
Abstract
Three years of hourly traffic collision data and associated weather data for the city of Edmonton, Alberta, Canada, were analyzed. Using a matched-pair analysis to compare periods of adverse weather with similar periods without adverse weather, the effect of weather on traffic collisions in Edmonton was assessed. Adverse weather took the form of strong winds (>35 km h−1), precipitation (>0.10 mm h−1), or limited visibility (<1.0 km). Risk ratio (RR) values were calculated to determine the relative increase in accidents resulting from each type of weather, as well as for multiple types of concurrent weather. Analysis was performed for collisions that resulted in property damage only (PDO) and severe collisions that resulted in injuries. To determine whether specific types of collisions were more likely to occur during adverse weather, RR values were determined for multiple types of collisions, such as following too closely or failing to stop at a traffic signal. Our results show that adverse weather affects traffic collisions in a variety of ways. Horizontal visibility less than 200 m and strong winds above 45 km h−1, while relatively infrequent in Edmonton, typically resulted in an increase in overall collisions (RR = 3.40 and 1.17, respectively). Precipitation, which is far more common to Edmonton, posed an increased risk to drivers. The type of precipitation was also clearly a factor. The RR value for PDO collisions was higher during periods of snowfall (1.90) than during periods of rainfall (1.28), but the RR value for collisions resulting in injuries (1.37) was higher than the value for PDO collisions during periods of rainfall. Collisions during snowfall had a higher RR value (1.90) for PDO collisions than for collisions resulting in injuries (1.55), and both were higher than the RR values for either type of collision during rainfall, suggesting that snowfall is a greater threat to driving safety than rainfall. For both precipitation types, a higher rate of precipitation was associated with increased risk and a larger number of collisions. Some collision types were clearly affected by the type of precipitation. Vehicles left the road resulting in property damage at far higher RR values during snowfall (3.36) than during periods of rainfall (1.09). Furthermore, analysis of collision types identify that two collisions with nearly identical actions, stopping at a stop sign and stopping at a traffic signal, have very different risks during adverse weather. Stopping at stop signs appears to be far more difficult than stopping at traffic signals during precipitation events and has a higher associated risk. Lastly, we identify a puzzling concern: our results show that Edmonton drivers do not perceive periods of rainfall as presenting a hazard, resulting in a disproportionately high number of injuries during rainfall.
Résumé
[Traduit par la rédaction] Nous analysons trois années de données horaires de collisions de la route et de données météorologiques associées, pour la ville d’Edmonton (Alberta), Canada. Nous évaluons l’effet des conditions météorologiques sur les collisions de la route à Edmonton, et ce, à l’aide d’une analyse par paires appariées afin de comparer les périodes de mauvais temps avec des périodes similaires sans mauvais temps. Les conditions météorologiques défavorables comprennent des vents forts (>35 km h−1), des précipitations (>0,10 mm h−1) ou des visibilités limitées (<1,0 km). Nous calculons le risque relatif (RR) afin de déterminer l’augmentation relative du nombre d’accidents qu’entraîne chaque type de conditions météorologiques, ainsi que des conditions météorologiques simultanées. Nous examinons les collisions qui ont causé des dommages matériels seulement et les collisions graves qui ont causé des blessures. Afin de déterminer si certains types de collisions sont plus susceptibles de se produire par mauvais temps, nous calculons le risque relatif de plusieurs types de collisions, par exemple en cas d’une distance insuffisante entre les véhicules ou d’omission de s’arrêter à un feu de circulation. Nos résultats montrent que les intempéries influent de diverses façons sur les collisions de la route. Les visibilités horizontales inférieures à 200 m et les vents forts au-dessus de 45 km h−1, bien que relativement peu fréquents à Edmonton, ont généralement entraîné une augmentation globale des collisions (RR = 3,40 et 1,17, respectivement). Les précipitations, qui elles sont beaucoup plus fréquentes à Edmonton, ont présenté un risque accru pour les conducteurs. L’influence du type de précipitations ressort aussi nettement. Le risque relatif pour les collisions avec dommages matériels seulement est plus élevé pour les cas de chute de neige (1,90) que pour la pluie (1,28), mais le risque relatif des collisions causant des blessures (1,37) est supérieur à celui des collisions sans blessés et en périodes de pluie. Les collisions lors de chutes de neige montrent un risque relatif plus ||élevé (1,90) pour les collisions avec dommages matériels seulement que pour les collisions causant des blessures (1,55), et tous deux sont plus élevés que le risque relatif de l’un ou l’autre type de collision pour les cas de pluie, ce qui laisse penser que les chutes de neige constituent une plus grande menace pour la sécurité de la conduite que la pluie. Le type de précipitations influe nettement sur certains types de collisions. Les véhicules ont quitté la route et subi des dommages matériels selon des valeurs de risque relatif beaucoup plus élevées pendant les chutes de neige (3,36) que pendant les périodes de pluie (1,09). De plus, l’analyse des types de collision révèle que deux types ayant des actions presque identiques, s’arrêter à un panneau d’arrêt et s’arrêter à un feu de circulation, présentent des risques très différents par mauvais temps. S’arrêter à un panneau d’arrêt semble beaucoup plus difficile que de s’arrêter à un feu de circulation pendant un épisode de précipitations et présente un risque plus élevé. Enfin, nous soulignons une découverte troublante: nos résultats montrent que les conducteurs d’Edmonton ne perçoivent pas les périodes de pluie comme présentant un danger. Cette perception entraîne un nombre disproportionnellement élevé de blessures en cas d’épisode de pluie.
1 Introduction
Adverse weather is problematic for drivers of motor vehicles. Weather can decrease the friction of tires on roadways, reduce visibility, and alter vehicle handling, ultimately resulting in changes to traffic volume and traffic safety (Maze, Agarwal, & and Burchett, Citation2006). Although the effect of weather on traffic collisions in Edmonton has recently been examined (Chen & Tjandra, Citation2014; El-Basyouny et al., Citation2014; Halim & Jiang, Citation2013), there has been no recent work examining how weather affects hourly collision rates. Because some weather features can take place at relatively short time scales, such as thunderstorms that are capable of delivering strong winds and precipitation over a few hours, it becomes apparent that using daily weather values or even 6-hour values will obscure the unfolding of the true event. Recognizing that there are periods of the day when the traffic volume changes over a relatively short period of time, such as morning and evening rush hours, and that modern weather stations record the weather at hourly intervals, it becomes apparent that analyzing collisions and weather at hourly time scales is feasible and appropriate. Black and Villarini (Citation2018) identify urban regions as being more likely to experience significant differences in relative risk of collisions when the calculations were performed at both daily and hourly steps. Andrey, Hambly, Mills, and Afrin (Citation2013) reviewed the effect of precipitation and traffic collisions for many Canadian cities from 1993 to 2003, one of which was the city of Edmonton. However, long-term collision risk due to precipitation has been changing (Andrey, Citation2010), with a lower collision risk resulting from rainfall than previously found and no discernible change in the relative risk of collisions due to snowfall. The objective of this study is to determine the effect of adverse weather on multiple types of collisions within the city of Edmonton, Alberta, Canada.
The city of Edmonton experiences a wide variety of weather. The winter season can include temperatures below −40°C, and summer temperatures can exceed 30°C. Approximately half the precipitation events in Edmonton occur as snowfall. Snowfall events can produce significant levels of accumulation, and snowfall during periods of strong winds can greatly reduce visibility. Thunderstorms, with brief but significant levels of rain, hail, and strong winds, occur during Edmonton’s highly convective summer period. The variety of weather in Edmonton makes this city a good candidate for studying the effects of weather on traffic collisions.
Weather can present difficulties for motor vehicle drivers in many ways. It is well documented that precipitation increases the risk of traffic collisions (e.g., Doherty, Andrey, & Marquis, Citation1993; Eisenberg, Citation2004; Ivey, Griffin, Newton, Lytton, & Hankins, Citation1981; Levine, Kim, & Nitz, Citation1995; Mills, Andrey, & Hambly, Citation2011; Unrau & Andrey, Citation2006). High winds have been shown to be detrimental to vehicle handling and increase traffic collisions (Baker & Reynolds, Citation1992; Edwards, Citation1994). Low visibility, often resulting from fog or heavy precipitation, also influences collision rates (Abdel-Aty, Ekram, Huang, & Choi, Citation2011). For example, Moore and Cooper (Citation1972) found that during periods of thick fog, traffic volume decreased by 20%, but traffic accidents increased by 16%.
Although adverse weather can often be linked to a change in the number of traffic collisions, the number of motor vehicles on the road was found to be inversely correlated to the severity of adverse weather (Al Hassan & Barker, Citation1999; Datla & Sharma, Citation2008; Maze et al., Citation2006; Moore & Cooper, Citation1972). Because reduced traffic volume is often correlated to a reduction in the number of accidents (e.g., Elvik, Citation2001), during conditions of adverse weather there is a reduction in collision risk attributed to the reduced volume of traffic. However, the effects of adverse weather can outweigh the reduced risk due to decreased traffic volume, potentially resulting in more collisions than would have occurred had there been no precipitation, heavy winds, or low visibility, which we will henceforth refer to as fair weather.
There are numerous types of collisions, including colliding with a parked vehicle, colliding with a vehicle in another lane, and running a vehicle off the road. How weather influences certain types of traffic collisions has been largely unexplored though Shankar, Mannering, and Barfield (Citation1995) estimated the impact of various weather factors on collision type. They calculated that heavy rainfall forces drivers to pay attention to the vehicle in front at the expense of monitoring their surroundings, likely decreasing rear-end collisions but increasing other collision types. For snowfall, Shankar et al. (Citation1995) predicted that there would be an increase in most forms of collisions because of the reduced traction and visibility. Following on these predictions, El-Basyouny et al. (Citation2014) investigated the influence of weather on multiple traffic collisions using Bayesian models from observed collisions and weather and identifying that there were significant differences between each collision type.
The long-term downward trend in collision risk due to precipitation (Andrey, Citation2010) has been partially attributed to improvements in safety features, such as anti-locking brakes and improvements in tires and airbags. However, Andrey (Citation2010) noted that there were no significant trends in the relative risk of collisions due to snowfall. The lack of a long-term trend in collision risk due to snowfall suggests that improvements in safety features are not effective when driving in snowy conditions. Because many cities around the world experience some degree of snowfall, it is important to investigate collision rates with respect to snowfall. In this pilot study, we examine the hourly weather occurring over the city of Edmonton and evaluate three years of collision data to determine the associated changes in collision risk caused by different types of adverse weather. We also determine how weather affects traffic collisions of various types. This pilot study was performed as a test to determine whether traffic collisions in Edmonton could first be forecast in some reasonable manner, with the hope of determining methods to reduce collisions in the future.
2 Methods
Traffic collision data from 2009 to 2011, documented in police reports, were prepared by the City of Edmonton Office of Traffic Safety. Every collision in the dataset contained the hour of the collision, day of year, collision type, collision severity, road surface conditions, and environmental conditions. The collision dataset contained numerous collision types; the more common collision types along with a brief definition, and abbreviation that will be used hereafter are listed in . Two categories of injury severity were used from the collision dataset: injury or property damage only (PDO). Collisions that resulted in a fatality were not used because of the small sample size (∼10 per year). To be categorized as an injury collision, a participant must have required medical treatment or admission to a hospital. Collisions that did not result in injuries or fatalities but resulted in more than CAD $1000 property damage were deemed to be PDO collisions. Collisions without injury that resulted in less than CAD $1000 are not required to be reported to police and are thus not included in our analysis.
Table 1. List of details for common collision types. Two common collision types were omitted from the analysis; Struck Parked Vehicle (14.1%) and changed lanes improperly (10.7%) because both could require a relatively small amount of lateral movement, but ROR requires a large movement.
Although the collision records contained a category for road surface conditions and environmental conditions, their consistency and accuracy could neither be determined nor quantified. Instead, we chose to use weather station data because those records would be both consistent and quantifiable. Hourly weather data were provided by Alberta Agriculture and Rural Development AgroClimatic Information Service (http://agriculture.alberta.ca/acis/) from the beginning of 2009 until this study began in December 2012. Hourly 2 m temperature, horizontal visibility, 10 m wind speed, and liquid-equivalent precipitation were recorded by the weather station at Edmonton International Airport. This weather station is regarded as the best option for the city of Edmonton data because it has high levels of quality control, hourly observations, and takes observations 24 h per day. Located about 25 km from downtown, it is not the closest weather station to the city, but no closer stations could provide higher quality data. Therefore, we made the following assumption: the weather that occurs over Edmonton International Airport occurs simultaneous to and is completely identical in strength to the weather over the streets within the entire city of Edmonton. Although other methods have had success in calculating collision risk (e.g., radar; Jaroszweski & McNamara, Citation2014), the use of an airport weather station to classify the weather across an entire town is relatively common in studies similar to ours (e.g., Andrey & Yagar, Citation1993; Black & Mote, Citation2015). Data are averaged for each hour, whereas precipitation is the total accumulation during each hour. This means that wind-speed values include the effects of wind gusts.
To investigate the effect of weather on traffic collisions in Edmonton, we used a matched-pair analysis similar to others who have studied the influence of weather on traffic (e.g., Andrey & Yagar, Citation1993; Andrey, Mills, Leahy, & Suggett, Citation2003; Black & Mote, Citation2015; Jaroszweski & McNamara, Citation2014; Qiu & Nixon, Citation2008). The matched-pair analysis compares the number of collisions sustained during a period of adverse weather, called the event (defined in full below), to the number of collisions sustained during a similar period under non-adverse weather conditions, known as the control. Adverse weather conditions include strong wind, low visibility, and/or precipitation. The threshold for adverse winds is hourly wind speed greater than 35 km h−1, and the threshold for adverse visibility is hourly visibility less than 1 km. An hourly liquid-equivalent precipitation rate equal to or above 0.10 mm h−1 indicates adverse precipitation. We chose the precipitation criterion of 0.10 mm h−1 because the minimum accumulation during an event, defined below, would be 0.20 mm, which is commonly accepted as the amount that constitutes rainfall rather than lighter precipitation, including fog and drizzle. The criteria for wind and visibility were chosen more arbitrarily because of a lack of information in the literature on a common threshold; we chose values that were expected to show little difference compared with the control periods, then proceeded to increase the strength of the adverse weather conditions.
If the following four conditions were met, then an event was deemed to have occurred: (1) the first hour with adverse conditions marked the start of the event; (2) two of three consecutive hours had adverse weather conditions; (3) the event continued until adverse conditions were not observed over two consecutive hours; (4) and the last hour of adverse conditions marked the end of the event. Events for a single form of adverse weather (e.g., snowfall) had no other forms of adverse weather (e.g., strong winds) occurring during the duration of the event. The same four conditions were applied when investigating multiple types of adverse weather, for example when estimating the collision risk due to strong winds and precipitation occurring at the same time during periods of fair visibility.
The control period was selected to be either one week prior to the event or one week after the event with no precipitation, winds greater than 35 km h−1, or horizontal visibility less than 1.0 km occurring for the duration of the control period. For example, a 4 h rainfall event that started at 1500 UTC on a Tuesday (event) would be matched with the previous or following Tuesday’s (control) collisions from 1500 to 1900 UTC, given fair weather during this period. Preference was given to the week before the control in rare cases when long-lasting effects were produced by the event. The major assumption in using matched-pair analysis is that for the same period of time, traffic volume does not change significantly one week before or after the event. Events or controls that took place during holidays were not used in the analysis because holiday traffic is expected to be different than traffic on regular days.
The matched-pair analysis above produces a risk ratio (RR) value, defined as the ratio between the total number of event collisions during the three-year period and the total number of corresponding control collisions. Values of RR were determined for each type of adverse weather, as well as each type and severity of collision. An RR of 1.00 would result from the same number of collisions during the event and control periods, indicating that weather had no effect on the collision type and severity being assessed. Values of RR greater than 1.00 indicate that more collisions occurred due to adverse weather, and values less than 1.00 indicate the opposite. However, traffic volume is often lower during adverse weather conditions (Abdel-Aty et al., 1999; Datla & Sharma, Citation2008; Maze et al., Citation2006; Moore & Cooper, Citation1972) than during periods of fair weather. Without knowing the traffic volume during each hour of the day, which is not possible in real time in Edmonton, RR values may be underestimated to some degree. Rather than adjust the RR value to reflect changes in traffic volume based on weather severity (Qiu & Nixon, 2018), we chose to enforce the assumption behind the matched-pair method: traffic volume is identical between periods with adverse weather and non-adverse weather.
To determine significance, we used a binomial distribution test to determine whether the calculated RR value was significantly different from chance. The binomial distribution test (binomdist in Microsoft Excel) compares the number of events having an RR greater than one with the total number of events having an RR value that is different from one. The resulting percentage, when subtracted from one, identifies a p-value, and we state that any p-value less than 0.05 is significant. This test was only performed on precipitation events because non-precipitation events were far less frequent.
3 Results
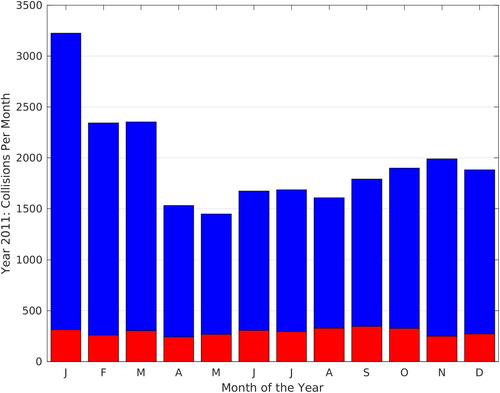
As expected, many more PDO collisions (69,301) occurred in Edmonton than injury collisions (8196) during our three-year sample period. Examination of a single year, 2011, revealed that monthly cycles were more obvious for PDO collisions than injury collisions (). During January, February, and March, PDO collisions were far more common, while little seasonality was seen during the remainder of the year. Although Edmonton experiences winter conditions with snowfall between October and May, winter storms occur more often between January and March, which likely contributes to the extra collisions visible on this figure. No noticeable changes in the number of injury collisions are observed during the year. However, this is just one of the three years sampled. We will focus on the aggregated three-year collision effects.
Fig. 1 Edmonton PDO (blue) and injury (red) collisions reported during each month of 2011.
The effects of adverse weather on traffic collisions is presented in two parts: the effects of weather on collision severity (Section 3a) and collision type (Section 3b). The effect of weather on collision severity is presented, then we show how various collision types are influenced differently by adverse weather. Because of the limited sample size, the effect of weather on collision type was only evaluated using PDO collisions during periods of precipitation, though sufficient collisions occurred for analysis for both rain and snowfall events.
a Collision Severity
1 PDO collisions
i Single adverse weather events
A matched-pair analysis was performed for events with adverse precipitation to determine RR values ( and ) for both snow and rainfall at different thresholds. At the lowest precipitation rate, 0.10 mm h−1, RR values for PDO collisions due to snow (1.90) and rain (1.28) indicate that even low precipitation rates influence traffic collisions compared with fair weather conditions. Edmonton, having very cold and dry conditions during the extended winter months, has relatively dry snowfall. Therefore, the liquid-equivalent snowfall rate was capped at 0.50 mm h−1 because there were too few cases at higher rates. Values of RR for snowfall were always higher than the RR values for rainfall, given the same precipitation rate, suggesting that snowfall has a stronger effect on the number of traffic collisions than rainfall. For both rain and snow, higher precipitation rates generally produced higher RR values. However, RR values appear relatively similar for rainfall rates between 0.10 and 1.00 mm h−1 and only increase noticeably for rainfall greater than 1.00 mm h−1. Snowfall, on the other hand, produced a large increase in risk once the precipitation rate reached 0.40 mm h−1 though the highest threshold had a lower RR value. However, there were relatively few events at the 0.40 and 0.50 mm h−1 thresholds, 6 and 5, respectively. Therefore, the RR values at these thresholds should be taken with caution, particularly when one considers that severe weather can lead to a large decrease in traffic volume (Datla & Sharma, Citation2008; Hanbali & Kuemmel, Citation1993), indicating that the true risk may be quite different than we report. Regardless of the precipitation type, RR values were greater than one for all precipitation rates, indicating that collisions during periods of precipitation were more frequent than during fair weather days. Furthermore, all analyses for PDO collisions during rainfall events were determined to be statistically significant (p-value < 0.05), though collisions during snowfall were not statistically significant at, or above, the 0.40 mm h−1 threshold because of the limited sample size. However, we still present the full range of RR values for all thresholds to illustrate the effects of heavy precipitation rates at reduced sample sizes.
Fig. 2 Risk Ratio (RR) values for various precipitation rates of equivalent liquid for collisions during rainfall (blue) and snowfall (red). The solid line indicates PDO collisions, while injury collisions are indicated by the dashed line. A yellow line at RR = 1.00 is shown for reference.
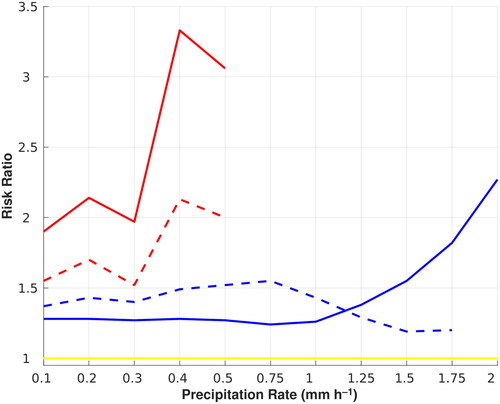
Table 2. Risk ratio (RR) values for property damage only (PDO) collisions for various types and strengths of weather in Edmonton between 2009 and 2011. The total number of matched-paired events are included for each weather criterion, as well as the number of collisions during both periods of adverse weather and during the control period. Bold values indicate that the values are statistically significant.
Values of RR for strong wind events without other forms of adverse weather are shown in . At the lowest wind-speed threshold, 35 km h−1, the RR value for PDO collisions was 0.93. With an RR value slightly less than 1.00, this suggests that although 35 km h−1 winds are strong, they did not pose an additional risk but rather resulted in fewer collisions. While a reduction in traffic volume during windy conditions is to be expected, we suspect that at this wind threshold, there is no significant effect on traffic collisions, resulting in an RR value slightly less than one. However, at higher wind-speed thresholds, the RR value slowly increased with an RR value of 1.07 for winds stronger than 40 km h−1 and 1.17 for winds stronger than 45 km h−1. However, due to the small sample size, the results are not statistically significant. Edmonton did not often report wind speeds above 35 km h−1, which resulted in 31 matched-paired wind-only events. Our results suggest that strong winds may induce additional collisions. Furthermore, with RR less than one at the lowest threshold, and an RR above one at the 40 and 45 km h−1 thresholds, there may be a specific wind speed which begins to influence the risk of collisions. Further investigation into wind speed and collisions is warranted though Edmonton would not be an ideal location for such a study.
Visibility events were even less frequent than strong wind events (). When horizontal visibility was lower than 1.0 km without strong winds or precipitation, the RR value was found to be 1.01, suggesting that a viewing distance of 1.0 km is sufficient to make collision mitigation decisions and react appropriately. The same can be said when the horizontal distance dropped below 500 m, with an RR value of 1.00. The RR value increased greatly (3.40) only when visibility was less than 200 m, which only occurred during one event over the three years. Our results suggest that there may be a horizontal distance at which the RR value changes quickly, and that it likely is between 200 and 500 m. Viewing distances less than this threshold provide insufficient time to react to road conditions, and more collisions ensue. These results are for events during which there was no precipitation and winds were weak though precipitation and wind are often the cause of low visibility. Therefore, the above results likely indicate periods of liquid and/or freezing fog, lightly blowing snow, or other obscuring conditions such as smoke. These events appear to be relatively rare in Edmonton; should they be present and reduce horizontal viewing distances to about 200 m or less, additional collisions may be expected. The effects of multiple weather types happening at the same time, including low visibility with precipitation and/or strong winds, are presented below.
ii Effects of concurrent types of adverse weather
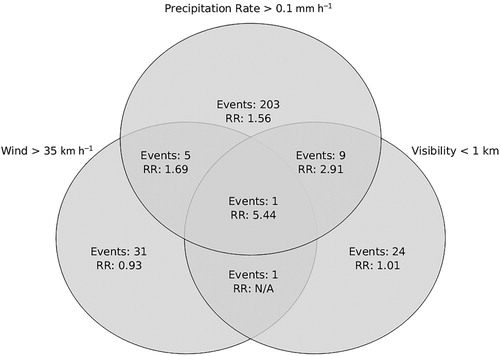
Because some severe weather systems often deliver precipitation, strong winds, and/or limited visibility, analysis was performed on periods of adverse weather that had two or three forms of adverse weather occurring at the same time (). As mentioned above, both low visibility and strong winds are relatively uncommon in Edmonton, so it was not surprising to find that events with strong winds or low visibility, as well as some other form of adverse weather, were even less frequent. With the scarcity of events, we suggest the following results be taken with some level of caution. Only a single event occurred with low visibility and strong winds but no precipitation. While seven collisions occurred during that brief period of time, no collisions occurred during the associated control period, and thus no RR value is available. One event had all three types of adverse weather, with an RR value of 5.44, which was achieved during blizzard-like conditions. Nine events had some level of precipitation and low visibility, resulting with an RR value of 2.91. Five events occurred during strong winds and some level of precipitation, and an RR value of 1.69. Regardless of the combination of adverse weather types, one common theme emerges: the resulting RR value is greater than the sum of the parts. For example, precipitation alone was associated with a 56% (RR = 1.56) increase in collisions, low visibility was associated with a mere 1% (RR = 1.01) increase, but a combination of precipitation and low visibility was associated with 191% (RR = 2.91) more collisions than normal.
Fig. 3 Risk Ratio (RR) values and the number of events for all three categories of adverse weather in this study: precipitation, strong wind, and low visibility. Overlapping regions indicate RR values and the number of events that had two or three types of adverse weather at the same time.
2 Injury Collisions
The effect of weather on injury collisions during precipitation events is indicated in . Values of RR during snowfall were always larger than RR values during rainfall at the same precipitation rate. Results were statistically significant, with a p-value less than 0.05, for rainfall up to a rate of 1.00 mm h−1 and for snowfall up to a rate of 0.30 mm h−1. While a higher snowfall rate generally meant a higher RR value, the same could not be said for rainfall. The RR value for rainfall slowly increased until the rainfall rate reached 0.75 mm h−1, after which the RR value decreased until the 1.50 mm h−1 rate was reached. We suggest that Edmonton’s drivers generally do not associate rainfall with hazardous driving conditions though eventually a certain point was reached at which more decisions regarding safety were being made: the 0.75 mm h−1 rate. However, it is not until the rainfall rate is greater than 1.00 mm h−1 that the injury RR value was lower than the property-damage value, identifying a serious concern: Edmonton drivers generally do not take appropriate safety measures when faced with rainfall, but they do during periods of snowfall. Had successful collision mitigation decisions been made during rainfall periods, the injury RR values should have been lower than those for PDO collisions. Because this is not what was observed, we hypothesize that the additional stressors presented to vehicle drivers during rainfall result in greater speed during collision impact, leading to higher injury rates. Although reasons will vary, we suspect that vehicles often travel at similar speeds during periods of rainfall as during fair weather, but the additional stressors result in reduced stopping distance before the collision.
b Collision type
To examine whether the type of PDO collision is affected by weather, we analyzed five collision types () with respect to periods of snowfall and rainfall. Although RR values vary (), we notice that all values are above 1.00, signifying that these collisions were likely induced by adverse weather. Furthermore, we identify that the various types of collisions are affected differently by periods of precipitation. For example, “ran off road” (ROR) collisions (red, circles; ) had very low RR values for rainfall rates below 0.50 mm h−1 compared with other collisions. However, during periods of snowfall ROR always had the highest risk. Snowfall clearly causes more vehicles to leave the road than rainfall, and both forms of precipitation lead to higher collision rates at higher precipitation thresholds. Other than “followed too closely” (FTC) collisions, each collision type eventually encountered a precipitation threshold with insufficient data.
Fig. 4 Risk Ratio (RR) values for PDO collisions during (a) rainfall and (b) snowfall for multiple collision types across multiple precipitation rates (mm h−1 of equivalent liquid). Colours (symbols) for FTC collisions are blue (+); ROR red (circles); LT purple (x); SSV orange (asterisks); TSV green (squares); and the complete collection of collisions black. See for collision abbreviations.
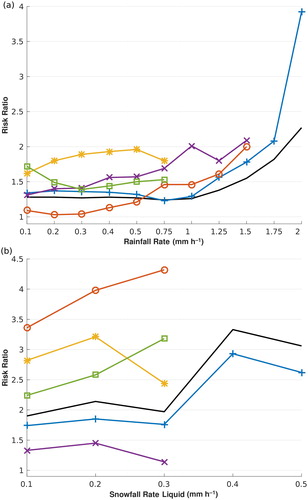
The most common collision type in Edmonton during our study was FTC collisions (blue, plus signs; ) were (). Values of RR were higher during rainfall (1.40–3.92) than during fair weather conditions. At the highest rainfall rate, 2.00 mm h−1, the RR value for FTC collisions rapidly increased to 3.92, a 290% increase in collisions compared with fair weather, perhaps an indication of an increase in hydroplaning at this intense rain threshold. The RR value for snowfall did not have such a drastic change at the highest snowfall rate analyzed, though RR values generally increased with precipitation rate regardless of the precipitation type.
Generally, “stop sign violation” (SSV) collisions (orange, asterisks; ) had higher RR values during periods of rainfall than any other collision type, with an RR value between 1.60 and 1.95. During periods of snowfall, ROR collisions were much higher though SSV collisions had higher RR values (2.44–3.21) than the other collision types across most snowfall thresholds. Interestingly, at the highest snowfall rate with sufficient data (0.30 mm h−1), SSV collisions had smaller RR values than at lower thresholds. We suggest that during periods of light snowfall, drivers may not take proper safety measures, in this case stopping earlier, but once the snowfall rate becomes moderate, drivers then initiate proper safety measures.
“Traffic signal violation” (TSV) collisions (green, squares; ) had RR values between 1.75 and 1.40 during periods of rainfall. For snowfall, the RR value was between 2.25 and 3.18. The mechanism for TSV collisions is similar to that for SSV collisions; both collisions occur because a vehicle violated a rule of the road and failed to stop at a certain point resulting in a collision. The only difference between them is the type of signal presented to the driver showing the need to stop: an illuminated traffic light or a stop sign. During periods of either snowfall or rainfall, RR values for TSV collisions were often lower than those for SSV collisions. These data suggest that during periods of adverse weather, vehicle drivers are more likely to respond to the brightness of a traffic light than they are to reflective stop signs, probably because it is far easier to see a traffic light regardless of the prevailing driving conditions. Adverse weather may make it far more difficult to see a stop sign; therefore, there often was a higher risk associated with SSV collisions than TSV collisions. This suggests that the city of Edmonton could benefit from stop signs that feature lights. Assuming that illuminated stop signs would result in SSV collisions having the same RR value as TSV collisions; about 50 PDO collisions could have been avoided over the course of three years.
The collision rate for “left turn across path” (LT) collisions (purple, X; ) was very low during periods of snowfall, with RR values between 1.15 and 1.45. Values of RR were greater during periods of rainfall than during periods of snowfall; rain produced RR values between 1.35 and 2.09. The small RR values associated with snowfall are likely a result of vehicle drivers taking much more time to determine when it is safe to make and complete a left turn, a proper safety decision. However, during periods of rainfall, this does not appear to be the case, and the RR values associated with LT collisions were often larger than for other collision types. It appears that Edmonton drivers faced with a left turn do not take appropriate safety measures during periods of rainfall, a point that has been made by the authors multiple times about driving during rainfall.
Overall, all collision types generally had higher RR values during periods of heavy precipitation than during periods of light precipitation. The authors would like to note that a 2.00 mm h−1 precipitation rate may not appear to be heavy precipitation. However, the criteria we used to determine the start and end of an event can capture a relatively short-lived heavy precipitation event surrounded by multiple hours of light precipitation, ultimately reducing the mean precipitation rate. Strong precipitation events lasting longer than two hours are not particularly common in Edmonton, and an alteration to the method we used to select events would likely provide too little data for this pilot study to state anything of consequence.
4 Discussion
Matching hourly weather data to collision rates made it clear that adverse weather conditions generally contributed to an increase in the number of traffic collisions within the city of Edmonton between 2009 and 2011. The type and strength of adverse weather was an important factor in collision risk. Precipitation, the most common form of adverse weather in Edmonton, produced a greater risk of collision than strong winds or low visibility. Higher precipitation rates resulted in higher RR values than periods with low precipitation rates, indicating that the strength of precipitation, either snow or rain, clearly influences traffic collisions. Collision risk was higher during snowfall than during rain. These results are somewhat at odds with El-Basyouny et al. (Citation2014) who found that snowfall significantly increased collision rates in Edmonton, but rainfall did not. The differences could be due to sampling methods because El-Basyouny et al. (Citation2014) used daily traffic collisions and weather data, while our study used hourly traffic collisions and weather data. This suggests that the impact of rain on collision rates is far shorter than snowfall, which Andrey and Yagar (Citation1993) confirm. Although adverse wind and low visibility are uncommon in Edmonton, both affected traffic collisions; winds speeds higher than 45 km h−1 resulted in more collisions, and visibility below 0.2 km contributed to an increase in the number of collisions.
The RR value for driving in rainy weather in Edmonton from 2009 to 2011 was found to be about 1.28, whereas for snow it was 1.90. Andrey (Citation2010) studied long-term trends in traffic risk due to weather from 1984 to 2002 in ten Canadian cities and found that the relative risk of collisions during rainfall decreased with time, whereas the relative risk during snowfall did not change significantly. In 1984, Andrey (Citation2010) found RR values for rain (snow) of approximately 1.9 (1.8) that changed to 1.5 (1.9) in 2002, putting our results in line with their long-term projections. To reduce the number of collisions, as well as the severity of collisions during snowfall, further work must be performed to understand why the collision risk does not decrease.
We have found numerous sources indicating that vehicle drivers in Edmonton do not regard periods of rainfall as hazardous: (i) the RR value (1.37) of being injured during rainfall is higher than the RR value (1.28) of only damaging property; (ii) the risk of some collision types is higher during rainfall than during snowfall; and (iii) a notable dip in risk occurs at the highest snowfall rate, which does not occur with increasing rainfall rates. This implies one of two things: (1) periods of strong rainfall do not result in a sufficient reduction in traffic volume to offset the additional collisions induced by adverse weather although it does for snowfall; or (2) Edmonton drivers tried to drive more safely during snow events, likely in the form of slower speeds and greater distances between cars, consequently fewer injuries were sustained. However, during rain events this was not the case. Edmonton drivers did not use the same safety practices used during snow events, resulting in a disproportionally larger number of injuries, probably from greater kinetic energy at the time of impact because of shorter stopping distances. Had mitigation techniques been properly used, such as longer stopping distances and slower speeds, our results would look much different. It was not until a precipitation rate of 1.25 mm h−1 was reached that the risk of injury during a collision was lower than that of property damage only. Although there were far fewer injury collisions than PDO collisions, the signal appears robust. Had the injury rates equalled the PDO rates we would still be concerned. We would anticipate that drivers were able to identify driving hazards and mitigate what might have been an injury collision, and this resulted in the rates of injury collisions being lower than the rates of PDO collisions. This is seen for snowfall but not rainfall. Therefore, we can state that Edmonton drivers specifically do not view light-to-moderate rainfall as hazardous. Because the authors do not suspect the situation in the city of Edmonton is unique, further research on this matter is clearly warranted.
Although collision risk was found to be higher during snowfall than rainfall when sampled across all collisions, the same result was not found when collision types were examined separately. Snowfall strongly influenced ROR collisions though periods of light-to-moderate rainfall barely affected ROR collisions. Investigation into collision type also determined that precipitation contributes to a larger number of collisions at stop signs than at traffic signals, though both share the same action: stopping the vehicle at a requested location. We determined that if stop signs had some form of illumination, other than the highly reflective coating currently used, about 50 PDO collisions could have been prevented within a three-year span. Our results, which are derived from a sparse number of events, indicate that future work on collision type across an expanded set of weather conditions is warranted.
The combined effects of precipitation and another type of adverse weather resulted in higher driver risk than two separate weather types. This suggests that vehicle drivers are unable to properly mitigate additional weather stressors, and collision risk increases. It is expected that precipitation occurring along with low visibility and strong winds would have presented a high collision risk to drivers. However, such events are very rare in Edmonton, and further study into the effects of multiple types of weather on traffic collisions would be recommended at a location that experiences these strong events more frequently.
This investigation was a collaboration between the University of Alberta Earth and Atmospheric Sciences Department and the City of Edmonton Office of Traffic Safety to study the effect of adverse weather on traffic collisions. The second part of the collaboration, which has been ongoing since 2015, is using a numerical weather prediction model to produce daily forecasts that are used as input to a traffic and speed model. The goal is to understand sources of traffic collisions in hopes of being able to bring about a reduction in collisions; one way is the documentation of how various forms of adverse weather affect different types of traffic collisions. This pilot study identified many aspects of the effects of adverse weather conditions on collisions that the Office of Traffic Safety has an interest in. Although the study only used data from Edmonton, we suspect that other municipalities could benefit from our research.
Acknowledgements
The authors express their appreciation to the City of Edmonton Office of Traffic Safety for access to their collision records, as well as guidance on this project. We would also like to thank Les Pennelly for his statistical expertise to better illustrate our results.
Disclosure statement
No potential conflict of interest was reported by the authors.
Additional information
Funding
References
- Abdel-Aty, M., Ekram, A., Huang, H., & Choi, K. (2011). A study on crashes related to visibility obstruction due to fog and smoke. Accident Analysis and Prevention, 43, 1730–1737. doi: 10.1016/j.aap.2011.04.003
- Al Hassan, Y., & Barker, D. J. (1999). The impact of unseasonable or extreme weather on traffic activity within Lothian region, Scotland. Journal of Transport Geography, 7(3), 209–213. doi: 10.1016/S0966-6923(98)00047-7
- Andrey, J. (2010). Long-term trends in weather-related crash risks. Journal of Transport Geography, 18(2), 247–258. doi: 10.1016/j.jtrangeo.2009.05.002
- Andrey, J., Hambly, D., Mills, B., & Afrin, S. (2013). Insights into driver adaptation to inclement weather in Canada. Journal of Transport Geography, 28, 192–203. doi: 10.1016/j.jtrangeo.2012.08.014
- Andrey, J., Mills, B., Leahy, M., & Suggett, J. (2003). Weather as a chronic hazard for road transportation in Canadian cities. Natural Hazards, 28(2), 319–343. doi: 10.1023/A:1022934225431
- Andrey, J., & Yagar, S. (1993). A temporal analysis of rain-related crash risk. Accident Analysis & Prevention, 25(4), 465–472. doi: 10.1016/0001-4575(93)90076-9
- Baker, C. J., & Reynolds, S. (1992). Wind-induced accidents of road vehicles. Accident Analysis and Prevention, 24(6), 559–575. doi: 10.1016/0001-4575(92)90009-8
- Black, A. W., & Mote, T. L. (2015). Effects of winter precipitation on automobile collisions, injuries, and fatalities in the United States. Journal of Transport Geography, 48, 165–175. doi: 10.1016/j.jtrangeo.2015.09.007
- Black, A. W., & Villarini, G. (2018). Effects of methodological decisions on rainfall-related crash relative risk estimates. Accident Analysis and Prevention, in press. doi: 10.1016/j.aap.2018.01.023
- Chen, Y., & Tjandra, S. (2014). Daily collision prediction with SARIMAX and generalized linear models on the basis of temporal and weather variables. Transportation Research Record: Journal of the Transportation Research Board, 2432, 26–36. doi: 10.3141/2432-04
- Datla, S., & Sharma, S. (2008). Impact of cold and snow on temporal and spatial variations of highway traffic volumes. Journal of Transport Geography, 16(5), 358–372. doi: 10.1016/j.jtrangeo.2007.12.003
- Doherty, S. T., Andrey, J. C., & Marquis, J. C. (1993). Driver adjustments to wet weather hazards. Climatological Bulletin, 27(3), 154–164.
- Edwards, J. B. (1994). Wind-related road accidents in England and Wales 1980–1990. Journal of Wind Engineering and Industrial Aerodynamics, 52, 293–303. doi: 10.1016/0167-6105(94)90055-8
- Eisenberg, D. (2004). The mixed effects of precipitation on traffic crashes. Accident Analysis & Prevention, 36(4), 637–647. doi: 10.1016/S0001-4575(03)00085-X
- El-Basyouny, K., Barua, S., Islam, M., & Li, R. (2014). Assessing the effect of weather states on crash severity and type by use of full Bayesian multivariate safety models. Transportation Research Record: Journal of the Transportation Research Board, 2432, 65–73. doi: 10.3141/2432-08
- El-Basyouny, K., Barua, S., & Islam, M. T. (2014). Investigation of time and weather effects on crash types using full Bayesian multivariate Poisson lognormal models. Accident Analysis & Prevention, 73, 91–99. doi: 10.1016/j.aap.2014.08.014
- Elvik, R. (2001). Area-wide urban traffic calming schemes: A meta-analysis of safety effects. Accident Analysis & Prevention, 33(3), 327–336. doi: 10.1016/S0001-4575(00)00046-4
- Halim, S., & Jiang, H. (2013). The effect of operation 24 hours on reducing collision in the city of Edmonton. Accident Analysis & Prevention, 58, 106–114. doi: 10.1016/j.aap.2013.04.031
- Hanbali, R. M., & Kuemmel, D. A. (1993). Traffic volume reductions due to winter storm conditions. Transportation Research Record: Journal of the Transportation Research Board, 1387, 159–164.
- Ivey, D. L., Griffin, L. I., Newton, T. M., Lytton, R. L., & Hankins, K. C. (1981). Predicting wet weather accidents. Accident Analysis & Prevention, 13(2), 83–99. doi: 10.1016/0001-4575(81)90022-1
- Jaroszweski, D., & McNamara, T. (2014). The influence of rainfall on road accidents in urban areas: A weather radar approach. Travel Behaviour and Society, 1, 15–21. doi: 10.1016/j.tbs.2013.10.005
- Levine, N., Kim, K. E., & Nitz, L. H. (1995). Daily fluctuations in Honolulu motor vehicle accidents. Accident Analysis and Prevention, 27(6), 785–796. doi: 10.1016/0001-4575(95)00038-0
- Maze, T., Agarwal, M., & and Burchett, G. (2006). Whether weather matters to traffic demand, traffic safety, and traffic operations and flow. Transportation Research Record: Journal of the Transportation Research Board, 1948, 170–176. doi: 10.1177/0361198106194800119
- Mills, B., Andrey, J., & Hambly, D. (2011). Analysis of precipitation-related motor vehicle collision and injury risk using insurance and police record information for Winnipeg, Canada. Journal of Safety Research, 42, 383–390. doi: 10.1016/j.jsr.2011.08.004
- Moore, R. L., & Cooper, L. (1972). Fog and road traffic (TRRL Report LR 446). Crowthorne, UK: Transport and Road Research Laboratory. Retrieved from https://trl.co.uk/sites/default/files/LR446.pdf
- Qiu, L., & Nixon, W. (2008). Effects of adverse weather on traffic crashes. Transportation Research Record: Journal of the Transportation Research Board, 2055, 139–146. doi: 10.3141/2055-16
- Shankar, V., Mannering, F., & Barfield, W. (1995). Effect of roadway geometrics and environmental factors on rural freeway accident frequencies. Accident Analysis & Prevention, 27(3), 371–389. doi: 10.1016/0001-4575(94)00078-Z
- Unrau, D., & Andrey, J. (2006). Driver response to rainfall on urban expressways. Transportation Research Record: Journal of the Transportation Research Board, 1980, 24–30. doi: 10.1177/0361198106198000105