
ABSTRACT
This study evaluates the 1981–2010 spatiotemporal differences in six available climate datasets (daily total precipitation and mean air temperature) over the Lower Nelson River Basin (LNRB) in ten of its sub-watersheds at seasonal and annual time scales. We find that the Australian National University spline interpolation (ANUSPLIN), and inverse distance weighted (IDW) interpolated observations from 14 Environment and Climate Change Canada (ECCC) meteorological stations show dry biases, whereas reanalysis products tend to overestimate precipitation across most of the basin. All datasets exhibit prominent disagreement in precipitation trends whereby the European Centre for Medium-Range Weather Forecasts (ECMWF) interim reanalysis (ERA-Interim) and European Union Water and Global Change (WATCH) Forcing Data ERA-Interim (WFDEI) show exceptional wetting trends, while the IDW and ANUSPLIN data manifest drying trends. Mean air temperature trends generally agree across most of the datasets; however, the North American Regional Reanalysis (NARR) and IDW show stronger warming relative to other datasets. Overall, analyses of the different climate datasets and their ensemble reveal that the choice of input dataset plays a crucial role in the accurate estimation of historical climatic conditions, particularly when assessing trends, for the LNRB. Using the ensemble has the distinct advantage of preserving the unique strengths of all datasets and affords the opportunity to estimate the uncertainty for hydrologic modelling and climate change impact studies.
Résumé
[Traduit par la rédaction] Cette étude évalue les différences, dans le temps et dans l’espace, de six séries de données climatologiques enregistrées de 1981 à 2010 (précipitations quotidiennes totales et température moyenne de l’air) sur le bassin inférieur du fleuve Nelson dans dix de ses sous-bassins versants, et ce, à des échelles saisonnière et annuelle. Nous constatons que l’interpolation par la fonction spline de l’Australian National University (ANUSPLIN) et les observations interpolées pondérées inversement à la distance (IDW) issues de 14 stations météorologiques d’Environnement et Changement climatique Canada présentent des biais secs, tandis que les produits de réanalyse ont tendance à surestimer les précipitations sur la presque totalité du bassin. Toutes les séries de données présentent des désaccords marqués quant aux tendances des précipitations. Les données provisoires du Centre européen pour les prévisions météorologiques à moyen terme (ERA-Interim du CEPMMT) et les données de forçage du projet Water and Global Change (WATCH-Forcing-Data-ERA-Interim) de l’Union européenne montrent des tendances humides exceptionnelles, tandis que les données issues de l’IDW et de l’ANUSPLIN révèlent des tendances sèches. Les tendances des températures moyennes de l’air concordent généralement d’une série de données à l’autre. Toutefois, la réanalyse régionale nord-américaine (NARR) et l’IDW montrent un réchauffement plus marqué par rapport aux autres séries de données. En général, les analyses des diverses séries de données climatologiques et de leur ensemble révèlent que la sélection d’une série de données initiales joue un rôle crucial dans l’estimation précise des climatologies passées, en particulier en ce qui concerne l’évaluation des tendances sur le bassin inférieur du fleuve Nelson. L’utilisation de l’ensemble offre le net avantage de préserver les forces uniques de toutes les séries de données et permet d’estimer l’incertitude de la modélisation hydrologique et des études qui portent sur l’impact des changements climatiques.
1 Introduction
Access to reliable and accurate atmospheric data, especially precipitation and air temperature, remains essential to understanding the climate system and hydrological processes. These variables form vital elements of the water and energy cycles and are key for driving land surface models. Reliable precipitation and air temperature measurements provide constructive information to climatologists, meteorologists, hydrologists, and other decision-makers in various applications, such as agricultural and environmental research (e.g., Hively, Gérard-Marchant, & Steenhuis, Citation2006; Zhang, Sun, Singh, & Chen, Citation2012), climate and/or land use change studies (e.g., Cuo et al., Citation2011; Dore, Citation2005; Huisman et al., Citation2009), hydrological and water resources planning (e.g., Hong, Adler, Huffman, & Pierce, Citation2010; Middelkoop et al., Citation2001), and mitigation of natural hazards (e.g., Blenkinsop & Fowler, Citation2007; Kay, Davies, Bell, & Jones, Citation2009; Taubenböck et al., Citation2011). Prior to the application of precipitation and air temperature from different available products, intercomparison of these variables is an essential prerequisite to ensure their reliability, particularly for specific spatial and temporal domains.
In recent decades, multiple global and regional datasets have been generated using different forcing products, such as climate model simulations and interpolations of remotely sensed and/or in situ observations (Dee et al., Citation2011; Mesinger et al., Citation2006). These datasets tend to systematically agree about the major temporal trends and spatial distribution of climate variables (i.e., precipitation and air temperature), but they often show notable differences at regional scales (Adler, Kidd, Petty, Morissey, & Goodman, Citation2001; Costa & Foley, Citation1998). Precipitation and air temperature stations provide direct physical readings with relatively accurate measurements at specific points. Moreover, these station measurements are often spatially interpolated and thus are unable to capture the actual spatial variability of precipitation and temperature fields because of the sparse density of the stations in the network. Satellite-based precipitation estimates provide good spatial coverage but have inaccuracies resulting primarily from instrumental, temporal sampling, and algorithm errors (Gebremichael, Krajewski, Morrissey, Huffman, & Adler, Citation2005; Nijssen & Lettenmaier, Citation2004). Reanalyses provide an alternative source of precipitation and air temperature by assimilating all available data (meteorological stations, aircraft, satellite, etc.); however, the accuracy of these products depends on the choice of physical parameterizations and specific analysis–forecast systems (Betts, Ball, & Viterbo, Citation2003).
Several gridded datasets for precipitation and air temperature—based on available observations, post-processing techniques, and sometimes climate modelling—are available for hydroclimatic studies over the Canadian landmass (Hopkinson et al., Citation2011; Mesinger et al., Citation2006). Because observational data are incorporated to derive the gridded datasets, they may also contain measurement errors and missing records. These missing values translate into the data interpolation and add to the overall uncertainty in the resulting gridded products (Eum, Dibike, Prowse, & Bonsal, Citation2014; Horton, Schaefli, Mezghani, Hingray, & Musy, Citation2006; Kay et al., Citation2009). Understanding the observed climate trends from different gridded datasets for a river basin is essential to be able to assess regional changes and gauge data consistency and reliability. Several data-related difficulties arise when attempting to analyze Canadian climate trends at regional and national scales. For example, Canada's vast land mass and high latitude result in a wide range of climates and relatively large spatial climate variability (Phillips, Citation1990).
Given the discrepancies in available gridded datasets, errors during data development, and the importance of data intercomparison prior to hydroclimatic application, our paper presents a detailed intercomparison of variability and trends calculated from available global and regional air temperature and precipitation datasets over the Lower Nelson River Basin (LNRB). Intercomparisons are quantified for ten sub-basins of the LNRB on seasonal and annual bases. Further, no studies have explored the spatiotemporal differences and historic trends from different gridded datasets for the LNRB. Thus, this paper seeks to fill an important gap in the understanding of historic trends and climate datasets and their application for future hydrologic modelling studies over the LNRB.
2 Study area: the Lower Nelson River Basin
The Nelson River basin (NRB) is one of the largest river systems in Canada (third largest by area and volumetric discharge to the coastal ocean) that drains water mainly from the interior of Canada, cutting through the Canadian Shield of northern Manitoba before emptying into Hudson Bay (a) (Newbury & Malaher, Citation1973). The Churchill River system covers the northwestern part of the NRB and is considered here because it was joined to the Nelson River by a diversion in 1976. The entire Nelson–Churchill River basin extends geographically between approximately 45.5°N to 59.5°N and 90.0°W to 117.5°W. In this study, the downstream segment of the Nelson River system fed by the Churchill River basin and Lake Winnipeg constitute the LNRB (b and 1c). The LNRB spans an area of approximately 90,500 km2 and collects all water from the drainage area upstream of the Nelson River (∼970,000 km2) before discharging into Hudson Bay. In the LNRB, the main stem river (Nelson) and its largest tributary—the Burntwood River, whose downstream segment carries flows diverted from the Churchill River—have less seasonal flow variability resulting from streamflow regulation and a large drainage area. Most of the LNRB has gentle slopes, with common channelized lakes moderating flow variability. Wetlands abound within the LNRB and store significant volumes of water, cover large areas, and moderate streamflow responses to rainfall and snowmelt events. Shallow soils and permafrost limit infiltration, groundwater storage, and groundwater flows. To increase its hydroelectric capacity, Manitoba Hydro manages flows in the LNRB with two major sources of streamflow regulation: the Churchill River diversion (CRD) and Lake Winnipeg Regulation (LWR; at the outlet of Lake Winnipeg and associated with the Jenpeg Generating Station) (b). On the LNRB's northwestern boundary, Manitoba Hydro operates the CRD. In 1977, a portion of the Churchill River Basin was diverted into the LNRB and regulated at Notigi Lake by the Notigi Control Structure on the Rat River. In 1972, Manitoba Hydro started the LWR project, which is key to hydropower development on the Nelson River system. Presently, Manitoba Hydro operates six hydroelectric generating stations while one station remains under construction (Keeyask) (b) within the LNRB (Déry, Stadnyk, MacDonald, Koenig, & Guay, Citation2018).
Fig. 1 Location of (a) the Nelson River basin (NRB), Churchill River basin (CRB), and Lower Nelson River basin (LNRB). (b) Major rivers within the LNRB are labelled; black triangles show the selected ECCC stations for this study; red diamonds denote current generating stations; the yellow circle shows a generating station under construction by Manitoba Hydro; the green box represents the Notigi Control Structure; and the red star indicates the Churchill River diversion. (c) Domain elevation distribution and selected sub-watersheds (black line).
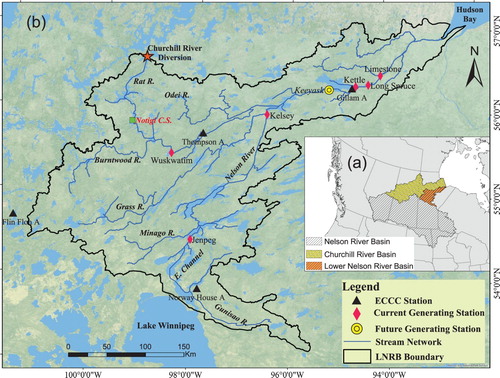
The LNRB experiences a sub-arctic continental climate characterized by moderate precipitation and humidity, cool summers, and cold winters. The snow-free season remains brief, generally beginning in May and ending in October. Most of the precipitation that occurs during the summer months falls as rain, accounting for nearly two-thirds of the annual total precipitation. Precipitation peaks in July, the warmest month of the year with an average daily air temperature of 16.2°C. The average annual precipitation over the LNRB totals approximately 500 mm, while evapotranspiration in the region attains approximately 300–350 mm annually with more annual surface water evaporation (∼450 mm) (Environment and Climate Change Canada, Citation2016; Smith, Delavau, & Stadnyk, Citation2015).
3 Data and methods
a Datasets
The following observation-based datasets are available for hydroclimatological studies over the LNRB (see ): Australian National University spline interpolation (ANUSPLIN), North American Regional Reanalysis (NARR), European Centre for Medium-Range Weather Forecasts (ECMWF) interim reanalysis (ERA-Interim), European Union Water and Global Change (WATCH) Forcing Data ERA-Interim (WFDEI), and Hydrological Global Forcing Data (HydroGFD). These datasets were selected because they are derived using advanced interpolation (for ANUSPLIN) and data assimilation (for NARR, ERA-Interim, WFDEI, and HydroGFD) techniques, are open source, cover the entire study period (1981–2010) and domain, and have continuous records at the required temporal and spatial resolutions for hydrological modelling. However, the data assimilation capacity of global and regional reanalysis products over different parts of the world does not extend to Canada, where weather station coverage is much sparser and not assimilated into many real-time reanalysis updates, especially in northern Canada (Bukovsky & Karoly, Citation2007; Essou, Sabarly, Lucas-Picher, Brissette, & Poulin, Citation2016; Langlois et al., Citation2009). To compare these products with observations, we constructed a gridded inverse distance weighted (IDW) dataset from 14 Environment and Climate Change Canada (ECCC) meteorological stations across the LNRB using a squared IDW interpolation technique (Table S1 and Fig. S1). Other observation-based datasets, such as the Canadian Precipitation Analysis (CaPA), are also available for intercomparison but CaPA contains records from 2002 onwards and so remains unsuitable for the present study (Fortin et al., Citation2018; Mahfouf, Brasnett, & Gagnon, Citation2007).
Table 1. Main characteristics of the datasets used in this study.
The observation-based daily gridded dataset, ANUSPLIN, developed by Natural Resources Canada (NRCan), is available for the Canadian landmass south of 60°N at 10 km resolution (Hopkinson et al., Citation2011; McKenney et al., Citation2011; NRCan, Citation2014). Preliminary analysis shows the updated version (1950–2015) of ANUSPLIN exhibits a consistent dry bias in precipitation over the LNRB; therefore, we retained the earlier version (1950–2011) of this dataset (Hopkinson et al., Citation2011). This dataset uses a trivariate thin-plate smoothing spline technique and includes daily total precipitation (millimetres), minimum and maximum air temperature (°C) at 10 km spatial resolution based on 7514 meteorological stations (1950–2011) across the Canadian landmass south of 60°N (Eum et al., Citation2014; Sharma & Déry, Citation2016).
The NARR product is a high-resolution, regional extension of the National Centers for Environmental Prediction (NCEP)/National Center for Atmospheric Research (NCAR) global reanalysis data (Kalnay et al., Citation1996; Kistler et al., Citation2001). It is developed at 32 km spatial and 3-hourly temporal resolution by utilizing a version of the Eta model and its three-dimensional variational data assimilation system (Mesinger et al., Citation2006) for the North American continent, available from 1979 to present.
The ERA-Interim dataset is a global reanalysis product from the ECMWF. Originally developed at 0.8° spatial resolution, data are also available for download at different spatial (0.125° to 3° grids) and 3-hourly temporal resolutions for January 1979 through near real-time (Dee et al., Citation2011). In this application, the ERA-Interim products are downloaded at 0.125° (∼13 km) spatial resolution. The product combines observations with a prior estimate of the atmospheric state generated by a global forecast model in a statistically optimal way. The ERA-Interim datasets have been evaluated and widely used in a variety of studies related to pan-Arctic hydroclimatology (Betts & Beljaars, Citation2017; Bromwich, Wilson, Bai, Moore, & Bauer, Citation2016; Simmons et al., Citation2014; Simmons & Poli, Citation2015).
The WFDEI reanalysis dataset relies on a method developed by the European Union's Water and Global Change (WATCH) project (http://www.eu-watch.org) and incorporates in situ observations in the reanalysis (Weedon et al., Citation2014). The WFDEI dataset was derived from ERA-Interim data (Dee et al., Citation2011) and was improved by an elevation correction for numerous variables. Further, to ensure that the monthly statistics remain similar to the in situ observations of the Global Precipitation Climatology Center (GPCC; Schneider, Fuchs, Meyer-Christoffer, & Rudolf, Citation2008), an undercatch correction is adopted whereby the daily variability of the reanalysis product is conserved (Weedon et al., Citation2014). We obtained the WFDEI-GPCC precipitation and mean air temperature data at approximately 55 km spatial and daily temporal scale for this study.
The recently developed HydroGFD dataset combines different reanalysis datasets to produce near-real-time, updated hydrologic forcing of precipitation and air temperature (Berg, Donnelly, & Gustafsson, Citation2018). The HydroGFD data use the already established WFDEI method but use updated climatological observations and interim products to produce near-real-time estimates of precipitation and air temperature at 3- and 6-hourly temporal and 0.50° spatial resolutions (Berg et al., Citation2018).
The IDW dataset of daily precipitation and mean air temperature is derived from 14 ECCC meteorological stations using the WATFLOOD interpolation tool (Kouwen, Citation1988; Table S1 and Fig. S1). These observation stations are spatially interpolated by applying the IDW interpolation method, and gridded datasets are procured at 0.10° (∼10 km) horizontal resolution for the LNRB. The WATFLOOD model is optimized through a calibration procedure over the LNRB with specified parameter values for the radius of influence (241.2 km), smoothing distance (52.8 km), and precipitation and air temperature vertical lapse rates (0 mm m−1 and −0.004°C m−1, respectively).
The NARR, ERA-Interim, and HydroGFD daily precipitation and mean air temperature are obtained from the sum and average, respectively, of 3-hourly values for a 24-hour period. To simplify the intercomparison of the datasets and to provide consistent hydrological model inputs for future work over the LNRB, the NARR, ERA-Interim, WFDEI, and HydroGFD data are then regridded to 10 km (∼0.10°) spatial resolution using a bilinear interpolation. The NARR (32 km) curvilinear grid and the ERA-Interim, WFDEI, and HydroGFD Gaussian grids are interpolated from coarser resolution to finer resolution (10 km). No elevation correction is performed during the interpolation from coarser to finer spatial resolutions because elevations vary no more than ±10% in the study area; hence, regridding of the NARR (32 km), ERA-Interim (∼13 km), WFDEI (∼55 km), and HydroGFD (∼55 km) datasets to 10 km spatial resolution results in negligible elevation-dependent uncertainty. The LNRB grid cells exhibit almost no difference in orography and none of these datasets contain discontinuous flux fields (precipitation and air temperature); therefore, atmospheric variables (i.e., average air temperature) and basin elevation remain nearly identical at both spatial resolutions.
Spatially regridded datasets (IDW, ANUSPLIN, NARR, ERA-Interim, WFDEI, and HydroGFD) at daily temporal and 10 km spatial resolutions are assembled to produce an ensemble mean dataset (i.e., ENSEMBLE) from 1981 to 2010. For the multi-product ensemble dataset, daily precipitation and mean air temperature are derived from the equally weighted average of all six gridded products. We assign equal weights to each dataset and so ignore prior knowledge of their modelling capacity. This is one of the most commonly used methods, which assumes that the equally weighted ensemble provides the best estimates of contemporary and future conditions because each model is equally likely to represent the truth (Krishnamurti et al., Citation1999; Suh et al., Citation2012). The concept of a multi-product ensemble has been used widely over global and regional domains to examine uncertainty in forcings and provide input to land surface models under historical and projected future climate conditions (Fowler & Kilsby, Citation2007; Fowler, Ekström, Blenkinsop, & Smith, Citation2007; Mishra & Lilhare, Citation2016; Wang, Bohn, Mahanama, Koster, & Lettenmaier, Citation2009).
b Methods
Observational data for an intercomparison were obtained from the average of four ECCC meteorological stations (ECCC hereafter) within the LNRB ( and a). The ECCC data with adjusted, continuous, and homogenous climatic records for 1981–2010 represent domain-averaged observations of mean annual air temperature and total precipitation (Fig. S2). They may not represent the best estimate of precipitation and air temperature, but an additional intercomparison of ECCC data provides acceptable results with respect to the interpolated (i.e., IDW) values (Fig. S2). We examine the root mean square error (RMSE), percent bias (PBIAS), and bias (air temperature only) for the long-term seasonal and annual precipitation and air temperature error statistics.
Analyses are performed for all four seasons: winter (DJF), spring (MAM), summer (JJA), and autumn (SON). Daily total precipitation (mean air temperature) from all datasets are averaged and aggregated to annual and seasonal totals (means) for each grid cell. Temporal and spatial analyses of the mean aggregated gridded data are then performed. As the first step of temporal analysis, the mean of all grid cells for each year and its seasons is calculated for all datasets; for spatial analyses, calculations are performed at the grid scale. The long-term seasonal variability is measured by the standard deviation for precipitation and mean air temperature.
For trend analyses, precipitation and air temperature datasets are verified for autocorrelation and, if any serial correlation exists, pre-whitened using the method of Yue, Pilon, Phinney, and Cavadias (Citation2002). Further, we used the Mann–Kendall, non-parametric test to estimate trends in the total seasonal and annual precipitation and mean air temperature (Kendall, Citation1975; Mann, Citation1945; Wilks, Citation2011). The Mann–Kendall trend test follows the relative ranking of the data rather than model fitting and is resistant to outliers, non-normal, and dominant data. This test remains robust for trend detection in similar hydroclimatic studies (Burford, Déry, & Holmes, Citation2009; Déry & Brown, Citation2007; Déry & Wood, Citation2005; Gan & Kwong, Citation1992; Gocic & Trajkovic, Citation2013; Modarres & Sarhadi, Citation2009). The trend magnitudes are calculated using the Theil–Sen trend estimate, and the statistical significance is determined at the 95% confidence level (Mondal, Kundu, & Mukhopadhyay, Citation2012; Sen, Citation1968).
4 Results
a Intercomparison of Gridded Climate Data with Station Observations
To examine the consistency and pattern of gridded datasets with respect to the ECCC dataset, each dataset is spatially averaged over the LNRB from 1981 to 2010 (). Overall, annual precipitation from the ERA-Interim and WFDEI datasets exceeds that from the ANUSPLIN, ECCC, NARR, and HydroGFD datasets over the entire study period. The ANUSPLIN data consistently underestimate annual total precipitation, whereas the HydroGFD and ENSEMBLE datasets show better agreement with observations for most years. Differences in annual total precipitation from six different datasets increase in recent years, mainly from 2004 to 2010; however, the ENSEMBLE dataset shows better agreement with the ECCC dataset. These emerging differences (post-2003) are likely because of Canadian precipitation observations not being assimilated into most of the gridded products as of 2004 (Mesinger et al., Citation2006). Long-term annual total precipitation for the HydroGFD dataset shows less positive PBIAS (0.5%) and RMSE (25.4 mm) relative to other datasets, while ERA-Interim and WFDEI show high RMSE and PBIAS as a result of systematic overestimation of precipitation (). The ANUSPLIN data exhibit a dry bias (−8.2%) in annual precipitation among other datasets. Long-term seasonal analyses reveal that the ANUSPLIN dataset underestimates precipitation during all seasons, except winter, whereas HydroGFD and ENSEMBLE data better represent seasonality with a lower RMSE ranging from 6.3 to 15.9 mm compared with ECCC stations (). The NARR precipitation data show less PBIAS (−0.5% to 10.2%) during winter, summer, and autumn and at an annual time scale, while NARR data overestimate spring precipitation (17.1%). The ERA-Interim and WFDEI datasets substantially overestimate seasonal precipitation, which ranges from 4.3% to 18.6% during spring, summer, and autumn.
Fig. 2 Area-averaged annual (a) total precipitation and (b) mean air temperature over the LNRB for the ANUSPLIN, NARR, ERA-Interim, WFDEI, and HydroGFD datasets compared with four ECCC stations average values across the basin, 1981–2010.
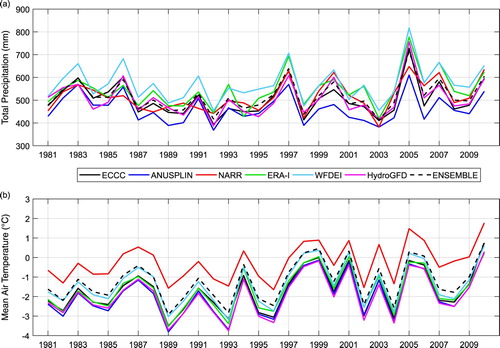
Table 2. Seasonal and annual precipitation and mean air temperature statistics for the domain-averaged ANUSPLIN, NARR, ERA-Interim, WFDEI, HydroGFD, and ENSEMBLE datasets with four ECCC stations average values across the LNRB, 1981–2010.
Aside from precipitation differences, the NARR dataset is not in agreement with other datasets on mean annual air temperature variability (). The NARR annual air temperature data are approximately 1.0°C higher than in other datasets, and the RMSE (1.5°C) over the LNRB is high relative to the ECCC observations, whereas ANUSPLIN and ERA-Interim data are in better agreement with the lowest RMSE (0.2°C) among all other datasets (). The ANUSPLIN and HydroGFD data are approximately 0.5°C colder than the observations, with a negative bias (−0.5°C to −0.1°C) that persists throughout the study period ( and ). The seasonal analysis reveals colder mean air temperatures from the ANUSPLIN, ERA-Interim, and HydroGFD datasets, which range from −0.5°C to −0.1°C, with similar interannual variability during spring, summer, and autumn. The NARR data are warmer across all seasons, which affects the ENSEMBLE mean air temperature (i.e., highest (lowest) positive biases, 1.7°C (1.1°C) in winter (spring)). In general, the ANUSPLIN dataset has lower biases and RMSEs than other datasets for mean seasonal air temperature, while the ERA-Interim and HydroGFD datasets fall statistically between the ANUSPLIN and WFDEI datasets for spring and summer. Moreover, the NARR dataset has larger RMSEs than its counterparts and has a strong positive bias in mean seasonal and annual air temperature over the LNRB. The NARR biases may translate into the ENSEMBLE dataset that exhibits positive seasonal and annual biases in air temperature.
b Intercomparison of Precipitation and Mean Air Temperature Datasets
1 basin average intercomparison of datasets
The domain-averaged monthly total precipitation magnitudes vary substantially among datasets, with greater inter-dataset differences over the LNRB from March to September (a). The ANUSPLIN dataset consistently underestimates precipitation throughout the study period relative to the IDW and NARR datasets, with 5–10 mm mo−1 differences, especially in summer. For peak spring and summer precipitation, the range of inter-dataset spread varies from 70 to 90 mm mo−1 and is overestimated by the ERA-Interim and WFDEI datasets during the study period. On the other hand, the observed seasonal climate normals for 1981–2010 for total precipitation compare favourably with the NARR dataset (Environment and Climate Change Canada, Citation2016). Summer precipitation, however, is overestimated by ERA-Interim and WFDEI, while winter, spring, and autumn precipitation correspond more favourably with climate normals. The dry bias in ANUSPLIN precipitation possibly arises from the thin-plate smoothing spline surface fitting technique used in its preparation, a feature reported in previous studies (Islam & Déry, Citation2017; Milewska, Hopkinson, & Niitsoo, Citation2005; O’Neil, Prowse, Bonsal, & Dibike, Citation2017). In the reanalysis products, HydroGFD shows the best agreement followed by NARR and IDW, while other products (ERA-Interim and WFDEI) reveal considerable differences in precipitation, which may have been induced by the climate model used to assimilate and generate these products. However, HydroGFD shows an improvement over the WFDEI and ERA-Interim datasets compared with IDW, in agreement with previous studies (e.g., Berg et al., Citation2018).
Fig. 3 Area-averaged climatology of (a) monthly total and (b) monthly mean air temperature over the LNRB for the IDW, ANUSPLIN, NARR, ERA-Interim, WFDEI, HydroGFD, and ENSEMBLE datasets, 1981–2010.
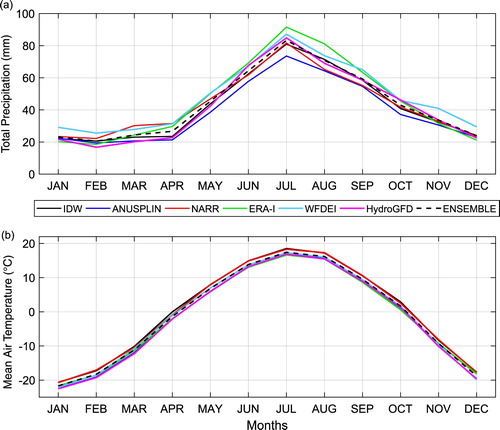
The monthly mean air temperature from all datasets is below 0.0°C from October to April but rises above 0.0°C in early spring over the LNRB domain (b). Although the seasonal variability of air temperature among the datasets is quite similar, IDW and NARR monthly mean air temperatures are approximately 1.5°C warmer than the other datasets. Seasonal climate normals for monthly mean air temperature of ANUSPLIN, ERA-Interim, WFDEI, and HydroGFD datasets match relatively well, except during spring when NARR overestimates mean air temperature when compared with the observed records (Manitoba Hydro, Citation2015).
2 spatial characteristics (1981–2010)
Because of the large number of datasets, and for the sake of clarity, we have only compared annual means. A more detailed intercomparison is carried out for the seasonal and annual standard deviations and trends in precipitation and air temperature at the sub-watershed scale in the following sections. To obtain the overall biases among datasets and their spatial distribution, we calculate the spread among the precipitation and air temperature datasets represented by the ensemble standard deviation.
i Annual total precipitation
Annual total precipitation patterns across the LNRB exhibit notable differences from relatively wet conditions for WFDEI data to relatively dry ones for ANUSPLIN data (); however, the IDW, NARR, and HydroGFD precipitation data are in general agreement with each other. Other noticeable features (wet and dry) in the rainfall distribution are present over the southeastern part of the basin and the Hudson Bay coast with different precipitation magnitudes in all datasets.
Fig. 4 Spatial distribution of the annual total precipitation (mm mo−1) for the (a) IDW, (b) ANUSPLIN, (c) NARR, (d) ERA-Interim, (e) WFDEI, and (f) HydroGFD datasets, 1981–2010.
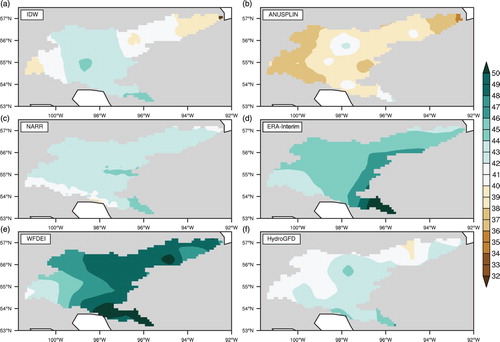
For the bias calculations, the NARR and HydroGFD datasets deviate only marginally and thus influence the ensemble mean relatively strongly (Fig. S3). This also applies to the IDW dataset, though the bias is slightly larger in the central part of the basin. Generally, ERA-Interim and WFDEI exhibit wetter conditions than other datasets for most of the regions, whereas ANUSPLIN appears to be unrealistically dry over the LNRB. The NARR and HydroGFD show improvements in modelled precipitation resulting in smaller differences than with the ENSEMBLE dataset. The differences are attributed to the number of observation stations used in the IDW and ANUSPLIN datasets and the climatological observations, interpolation, and data assimilation procedures used to develop the NARR, ERA-Interim, WFDEI, and HydroGFD datasets. Precipitation in the HydroGFD dataset has low biases in all regions, with dry biases over the northeastern part of the basin. The WATCH method, with updated climatological observations applied in HydroGFD, appears to have improved precipitation records for the LNRB. The NARR data are generally slightly wetter in most parts of the basin, which shows an improvement over global reanalysis products (i.e., ERA-Interim and WFDEI). Drier conditions over the eastern LNRB are exhibited by IDW and ANUSPLIN than with the other datasets, which may be a result of the interpolation technique associated with the poor gauge coverage in the underlying observation stations. The ensemble spread is found to be large (small) over the northeastern and southeastern (northwestern and middle) sections of the basin (). This high deviation in precipitation may result from the scarcity of observation stations that were incorporated during development of the climate datasets. The corresponding ensemble mean exceeds 43.0 mm mo−1, which is relatively high with low spatial variation in the higher elevations and southern part of the basin.
Fig. 5 Ensemble mean and standard deviation of (left) precipitation and (right) mean air temperature, 1981–2010.
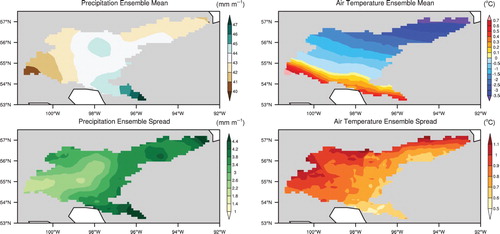
ii Mean annual air temperature
The ANUSPLIN, ERA-Interim, WFDEI, and HydroGFD datasets capture mean air temperature patterns (e.g., the longitudinal gradient between the northeastern and the southwestern parts of the domain) quite similarly, which ranges from 0.4°C to −2.0°C (). The IDW and NARR datasets exhibit similar spatial patterns, with mean annual air temperature ranging from 2.0°C at higher elevations to −2.0°C near Hudson Bay although both show overall warm biases relative to the ensemble mean (Fig. S4). Other datasets, including global reanalysis products, show overall cold biases over the domain that may be related to the relatively large influences of data assimilation and numerical modelling. Moreover, coarser resolutions of the reanalysis products impact biases because of the proximity of Hudson Bay. Large ensemble spreads (0.9°–1.1°C) can be seen over the northern part of the basin, while relatively small deviations (0.5°–0.7°C) emerge in the south ( and ).
Fig. 6 Spatial distribution of the mean annual air temperature (°C) for the (a) IDW, (b) ANUSPLIN, (c) NARR, (d) ERA-Interim, (e) WFDEI, and (f) HydroGFD datasets, 1981–2010.
iii Seasonal means, totals, and standard deviations (1981–2010)
In general, the precipitation totals and mean air temperature values from all datasets approach each other for all sub-watersheds and seasons (Figs S5 and S6). The precipitation totals show relatively large differences between datasets and sub-basins (Fig. S5). Further, summer and spring values show more variability among the datasets than the other seasons. In general, the ERA-Interim and WFDEI datasets appear to overestimate seasonal precipitation in all sub-basins, and ANUSPLIN clearly underestimates precipitation in all seasons and sub-watersheds. Over the southern and northeastern sub-basins (Gunisao, Limestone, and Weir), all datasets show high variability in seasonal precipitation. The temperature means are similar, except for the IDW and NARR datasets, which have a warm bias in all seasons, particularly during summer and winter in all sub-watersheds (Fig. S6).
Although each precipitation dataset is based on its own selected network of stations, with a probable substantial overlap, the IDW and ANUSPLIN datasets have a higher density of stations than the other datasets, notably in the middle portion of the basin (McKenney et al., Citation2011). The comparison of the ANUSPLIN dataset with higher density network datasets over different Canadian watersheds, however, has shown that the ANUSPLIN dataset underestimates higher precipitation values (Eum et al., Citation2014; Wong, Razavi, Bonsal, Wheater, & Asong, Citation2017). Over the domain, reanalysis products indicate high precipitation values, which lead to a high standard deviation over all sub-watersheds (Fig. S5). The latter is larger in winter and spring because of the high coefficient of variation in precipitation over the Gunisao sub-watershed (Fig. S7). The standard deviation over most of the sub-regions is similar for all seasons, except for the Gunisao and Weir sub-watersheds, which are the ones with the highest variability in precipitation among all datasets (Figs S5 and S7). The air temperature standard deviation from all datasets, except NARR, is higher in winter over all sub-watersheds (Fig. S6). Other seasonal spreads, except autumn for NARR, in temperature are similar in all the datasets over all sub-watersheds. Thus, apart from NARR, every dataset captures similar seasonal air temperature variation. Moreover, the IDW dataset shows high spread over the Weir sub-watershed for all seasons, which might be related to that region's sparse observation station density.
c Intercomparison of Annual and Seasonal Trends (1981–2010)
1 precipitation
The 1981–2010 maximum (minimum) annual precipitation trend among all datasets is 30.0 (−30.0) mm decade−1 over the LNRB (). Trend magnitudes from the IDW and ANUSPLIN data show similar decreasing trend magnitudes (5.0–20.0 mm decade−1), whereas reanalysis products such as NARR and ERA-Interim show significant increasing trends (20.0–30.0 mm decade−1) with disagreement over most of the basin. The WFDEI and HydroGFD data show better agreement in the north but with opposite trend magnitudes (±20.0 mm decade−1) in the south. Overall, the ENSEMBLE dataset does not show any significant trend over the LNRB; however, its precipitation increases by 5.0–25.0 mm decade−1 over most of the basin.
Fig. 7 Spatial trends of the annual total precipitation (mm decade−1) from different datasets, 1981–2010. The grid cells with significant trends (p < 0.05) are indicated by dots.
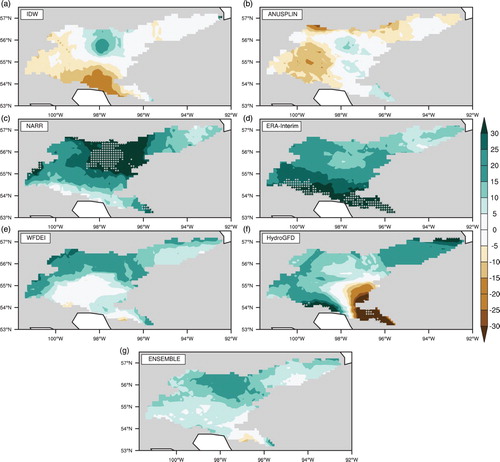
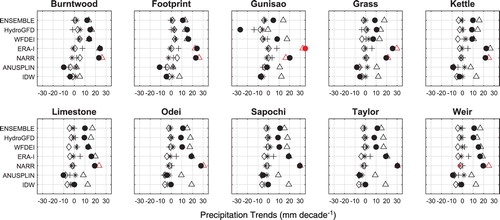
Sub-watershed annual trend signals are statistically insignificant for all regions, excluding the Gunisao, where ERA-Interim shows a significant increasing trend (>30.0 mm decade−1) (). All datasets show increasing trends in annual precipitation (>10.0 mm decade−1) for all sub-watersheds except ANUSPLIN and IDW, which show similar negative trends. The Gunisao sub-watershed shows different trend magnitudes in each dataset with small increasing trends from WFDEI and ENSEMBLE. The WFDEI and HydroGFD datasets produce similar trend magnitudes in most of the sub-watersheds, followed by the ENSEMBLE dataset, which indicates the substantial influence these two datasets have on the magnitude and pattern of the ENSEMBLE precipitation. This may also be due to the IDW, ANUSPLIN, ERA-Interim, and NARR data offsetting each other so that the ENSEMBLE values approach the HydroGFD and WFDEI values in all sub-basins except Gunisao. Significant increasing trends (∼25.0 mm decade−1) arise in NARR during summer for all sub-watersheds, whereas ERA-Interim manifests similar significant trends (25.0–30.0 mm decade−1) across the Footprint, Gunisao, and Grass sub-basins (). Winter precipitation exhibits no trend across all datasets, while autumn precipitation decreases by less than 8.0 mm decade−1 for the IDW, ANUSPLIN, HydroGFD, and ENSEMBLE datasets in most sub-basins with high drying tendencies (>15.0 mm decade−1) in HydroGFD over the Gunisao sub-watershed.
Fig. 8 Seasonal and annual precipitation trends for all datasets and sub-watersheds, 1981–2010: filled circles (annual); DJF (winter) stars; MAM (spring) diamonds; JJA (summer) triangles; SON (autumn) pluses. Red symbols denote significant trends (p < 0.05).
2 mean air temperature
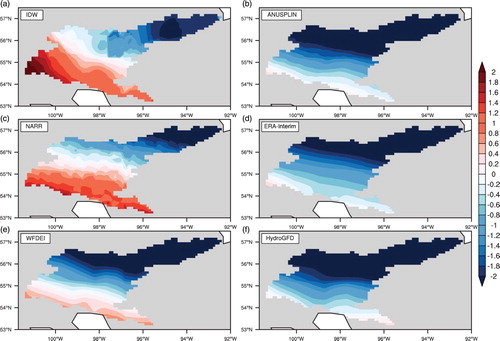
The 1981–2010 maximum and minimum spatial annual warming rate among all datasets, except IDW, are 0.6°C decade−1 and 0.1°C decade−1, respectively, over the LNRB (). Trend magnitudes from IDW, ANUSPLIN, and ERA-Interim show similar significant warming trends (>0.5°C decade−1) approaching those in NARR, WFDEI, and HydroGFD albeit with insignificant increasing trends over the eastern LNRB. The IDW temperature trend is in disagreement (i.e., a cooling trend of 0.2°C decade−1) with all the other datasets across the upstream part of the basin. The WFDEI and HydroGFD data do not show any significant warming and have similar magnitudes across the basin, which may affect the ENSEMBLE air temperature trends with some outliers at lower elevations. Overall, the ENSEMBLE air temperature does not demonstrate any significant warming across most of the LNRB; however, it shows warming of 0.1°–0.6°C decade−1 across the basin.
Fig. 9 Spatial trends of the mean annual air temperature (°C decade−1) from different datasets, 1981–2010. Dots indicate grid cells with significant trends (p < 0.05).
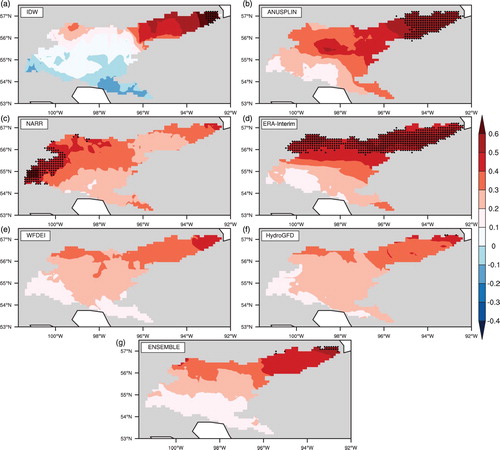
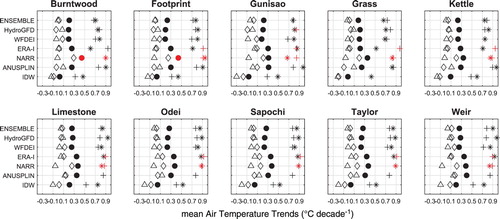
Almost all datasets show insignificant rising annual air temperatures over all LNRB sub-watersheds, apart from NARR for which we find significant warming trends (>0.4°C decade−1) in the Burntwood and Footprint sub-basins (). The ANUSPLIN, NARR, ERA-Interim, WFDEI, HydroGFD, and ENSEMBLE datasets manifest similar annual trend magnitudes for all regions with some exceptions: the NARR trends (>0.3°C decade−1) over all sub-basins are much greater than the other datasets and seem unrealistic. Consequently, trend analyses for the LNRB using NARR should be interpreted with caution. The only dataset that shows minimal annual temperature warming over the LNRB's sub-watersheds is IDW, which is in fact negative in the Gunisao and Grass sub-watersheds. All datasets in autumn show insignificant warming trends except NARR and ERA-Interim, which show significant and strong warming trends (0.8°C decade−1) over all sub-watersheds (). Strong warming trends in winter are exhibited by NARR (>0.8°C decade−1); however, other datasets (except ANUSPLIN) show more modest winter warming trends over all sub-watersheds. Summer and spring show insignificant negative trends, whereas most of the datasets show no trend during winter over each sub-basin. Overall, air temperature trend analysis shows insignificant warming during winter and autumn and even less warming in spring and summer over most of the basin.
Fig. 10 Seasonal and annual mean air temperature trends for all datasets and sub-watersheds, 1981–2010: filled circles (annual); DJF (winter) stars; MAM (spring) diamonds; JJA (summer) triangles; SON (autumn) pluses. Red symbols denote significant trends (p < 0.05).
5 Discussion and conclusions
An intercomparison of the 1981–2010 ERA-Interim and WFDEI precipitation showed wetter conditions than four other datasets across the LNRB including ten of its sub-basins. The NARR and HydroGFD data showed similar interannual variability and magnitudes for most of the sub-watersheds and across the LNRB. The ANUSPLIN data showed considerably dry seasonal and annual precipitation for the entire domain and sub-watersheds. The discrepancy in all precipitation datasets was notably greater for southern and low elevation regions of the LNRB and its sub-watersheds (and for all seasons except winter) than those in middle and higher latitude sub-basins. These results demonstrate that there is greater uncertainty in precipitation over the downstream portion of the basin. This is possibly a result of the combined effects of sparse observation stations (Fig. S1), the coarse spatial resolution of reanalysis products, and the possible undercatch of snowfall and rainfall in the observational data for the downstream and southeastern part of the LNRB. Moreover, we found much larger differences between ANUSPLIN and reanalysis datasets during the 2004–2010 period than in previous years. This may be because precipitation observations over Canada have not been assimilated in reanalysis products since 2004 (Bukovsky & Karoly, Citation2007; Mesinger et al., Citation2006). Furthermore, NARR precipitation exhibits a structural breakpoint in January 2004 over Canada's Athabasca watershed, further highlighting this issue (Eum et al., Citation2014). Nonetheless, previous studies found that NARR provided reliable climate input data relative to the global reanalysis product (NCEP/NCAR Global Reanalysis-1) over northern Manitoba (Choi, Kim, Rasmussen, & Moore, Citation2009). Precipitation data are more problematic than temperature data over Canada because of cumulative daily problems such as evaporation, wetting loss, and trace measurements (Mekis & Hogg, Citation1999). Therefore, it is necessary to conduct a data homogeneity test for different available datasets; moreover, reanalysis products, such as NARR, should be tested over different Canadian regions before use and limited to the qualified period from 1979 to 2003 for hydroclimatic studies (Choi et al., Citation2009; Eum et al., Citation2014; Mesinger et al., Citation2006).
The intercomparison showed that the NARR and IDW datasets provided warmer seasonal and annual air temperatures than all other datasets over the northern LNRB and its sub-watersheds. The IDW air temperature was slightly warmer than the NARR air temperature in the upper basin and somewhat similar across the rest of the basin. Comparison with the four ECCC stations showed that NARR exhibited warmer annual air temperature than other datasets and, therefore, resulted in larger RMSEs with a strong positive bias in air temperature over the basin. The ANUSPLIN, ERA-Interim, WFDEI, and HydroGFD data showed better agreement for seasonal and annual air temperatures over the entire basin, although the WFDEI data were warm over the upstream part of the LNRB. Moreover, the WFDEI and ERA-Interim air temperatures showed less bias than other datasets for most of the basin. The intercomparison of different air temperature datasets suggests that the global reanalysis products (ERA-Interim and WFDEI) compared better with observations than the regional reanalysis (NARR) and station-interpolated (IDW) datasets over the study domain. Consequently, there is a need for an improved air temperature monitoring system to increase the reliability of the observed gridded datasets. However, the ANUSPLIN and IDW datasets have been derived from similar temperature observations within the LNRB but showed different spatial patterns, which exhibit interpolation errors and outlier effects in the resulting datasets. On the other hand, the NARR air temperature data strongly disagreed with other global reanalysis products for the majority of the LNRB. This quantifies discrepancies in data assimilation and numerical modelling techniques during regional and global reanalysis product development. Overall, this analysis showed that HydroGFD may be the best option in selecting reanalysis products for both daily precipitation and air temperature for the LNRB. Both observational datasets, IDW and ANUSPLIN, have major issues with either precipitation or air temperature. Moreover, because of indirect assimilation in NARR through latent heat profiles over Canada during the 2004–2010 period, this study found noticeable differences between selected datasets (Essou et al., Citation2016; Mesinger et al., Citation2006). Therefore, combining all gridded datasets and generating a hybrid climate product (i.e., ENSEMBLE) can provide a reliable long-term climate dataset for further hydroclimatic study over the LNRB (Christensen & Lettenmaier, Citation2007; Eisner et al., Citation2017; Fowler et al., Citation2007; Wang et al., Citation2009).
Trend analyses for the relatively small area could be influenced by different spatial resolutions (e.g., global and regional climate datasets) and the time period used for the study. For instance, precipitation records indicated below-average precipitation in many regions since the mid-1980s; therefore, the trend analysis showed small increasing trends in eastern Canada for the 1948–1992 period (Boden, Kaiser, Sepanski, & Stoss, Citation1994; Environment Canada, Citation1995). Quantitative analyses of the influence of different spatial resolutions, as well as seasonal, and annual variations on the climate trends are difficult. Therefore, we investigated climate variability and trends from available datasets (global and regional) at both seasonal and annual time scales. This analysis supports many previous findings on Canadian climate trends that indicate insignificant increasing trends, which are not artificial (e.g., changes in observation sites, locations, or programmes), in precipitation and air temperature over northern Manitoba (LNRB) (e.g., Environment Canada, Citation1995; Skinner & Gullett, Citation1993; Zhang et al., Citation2012). Using multiple datasets for trend analysis from different sources confirms that both the data quality and the outcome are reliable and robust. Perhaps the most interesting finding from our analysis was the disagreement in historical precipitation trends from different gridded datasets, which involved wet and warm patterns across the basin. The eastern sub-watersheds are affected by abnormally warm and dry conditions in summer and autumn despite the general increase in precipitation throughout the study period. The cause of different spatial and temporal trends from available gridded datasets may be associated with increasing atmospheric greenhouse gases or natural climate variability and cannot be addressed by a study of this nature. In this study, our primary goal was to obtain data whose historical climatic trends compare better with observations. There is evidence, nevertheless, that suggests a certain degree of agreement exists between observed trends in the Canadian climate and those estimated by the WFDEI, HydroGFD, and ENSEMBLE precipitation and air temperature from all datasets except NARR and ERA-Interim (Environment Canada, Citation1995; Skinner & Gullett, Citation1993; Zhang et al., Citation2012).
One of the greatest challenges presently facing the hydroclimatic and hydrological modelling communities remains the reliability of available gridded data at different locations, including the distribution and amounts of regional and continental scale precipitation. Most reanalysis products predict a concomitant increase in regional and global precipitation as mean air temperatures rise during the historical time period (1981–2010). This study suggests that available gridded datasets have issues, mainly at seasonal time scales, with either precipitation or air temperature. The NARR precipitation, WFDEI air temperature, and HydroGFD precipitation and air temperature more closely resemble observations. Moreover, it is useful to have all the datasets to quantify the uncertainty in precipitation and air temperature across the basin and its sub-watersheds. Confidence in the historical and future hydrologic cycle simulations could be improved if ENSEMBLE precipitation and air temperature are used to drive land surface models.
Supplemental data
Supplemental data for this article can be accessed at https://doi.org/10.1080/07055900.2019.1638226.
Acknowledgements
Financial and in-kind support for this research was provided by Manitoba Hydro, ArcticNet, and the Natural Sciences and Engineering Research Council of Canada (NSERC) through the BaySys project. Mark Gervais, Phil Slota, Mike Vieira, and Shane Wruth (Manitoba Hydro) provided helpful advice and logistical support throughout this work and beneficial reviews on an earlier version of the manuscript. Thanks go to Siraj Ul Islam and Aseem Raj Sharma (UNBC) for providing access to and information on gridded climate datasets. Thanks also go to two anonymous reviewers for their constructive comments that greatly improved the manuscript.
Disclosure statement
No potential conflict of interest was reported by the authors.
ORCID
Rajtantra Lilhare http://orcid.org/0000-0002-6913-6024
Stephen J. Déry http://orcid.org/0000-0002-3553-8949
Scott Pokorny http://orcid.org/0000-0001-6665-5622
Tricia A. Stadnyk http://orcid.org/0000-0002-2145-4963
Kristina A. Koenig http://orcid.org/0000-0002-1570-3820
Additional information
Funding
References
- Adler, R. F., Kidd, C., Petty, G., Morissey, M., & Goodman, H. M. (2001). Intercomparison of global Precipitation products: The third Precipitation Intercomparison Project (PIP–3). Bulletin of the American Meteorological Society, 82(7), 1377–1396.
- Berg, P., Donnelly, C., & Gustafsson, D. (2018). Near-real-time adjusted reanalysis forcing data for hydrology. Hydrology and Earth System Sciences, 22(2), 989–1000. doi: 10.5194/hess-22-989-2018
- Betts, A. K., Ball, J. H., & Viterbo, P. (2003). Evaluation of the ERA-40 surface water budget and surface temperature for the Mackenzie River Basin. Journal of Hydrometeorology, 4(6), 1194–1211.
- Betts, A. K., & Beljaars, A. C. M. (2017). Analysis of near-surface biases in ERA-Interim over the Canadian Prairies. Journal of Advances in Modeling Earth Systems, 9(5), 2158–2173. doi: 10.1002/2017MS001025
- Blenkinsop, S., & Fowler, H. J. (2007). Changes in European drought characteristics projected by the PRUDENCE regional climate models. International Journal of Climatology, 27(12), 1595–1610.
- Boden, T., Kaiser, D. P., Sepanski, R. J., & Stoss, F. W. (1994). Trends’ 93: A compendium of data on global change (p. 984). Oak Ridge National Laboratory, Oak Ridge, Tennessee: ORNL/CDIAC-65, Carbon Dioxide Information Analysis Center.
- Bromwich, D. H., Wilson, A. B., Bai, L.-S., Moore, G. W. K., & Bauer, P. (2016). A comparison of the regional Arctic System Reanalysis and the global ERA-Interim reanalysis for the Arctic. Quarterly Journal of the Royal Meteorological Society, 142(695), 644–658. doi: 10.1002/qj.2527
- Bukovsky, M. S., & Karoly, D. J. (2007). A brief evaluation of precipitation from the North American Regional Reanalysis. Journal of Hydrometeorology, 8(4), 837–846. doi: 10.1175/JHM595.1
- Burford, J. E., Déry, S. J., & Holmes, R. D. (2009). Some aspects of the hydroclimatology of the Quesnel River Basin, British Columbia, Canada. Hydrological Processes, 23(10), 1529–1536.
- Choi, W., Kim, S. J., Rasmussen, P. F., & Moore, A. R. (2009). Use of the North American Regional Reanalysis for hydrological modelling in Manitoba. Canadian Water Resources Journal, 34(1), 17–36.
- Christensen, N. S., & Lettenmaier, D. P. (2007). A multimodel ensemble approach to assessment of climate change impacts on the hydrology and water resources of the Colorado River Basin. Hydrology and Earth System Sciences, 11(4), 1417–1434. doi: 10.5194/hess-11-1417-2007
- Costa, M. H., & Foley, J. A. (1998). A comparison of precipitation datasets for the Amazon basin. Geophysical Research Letters, 25(2), 155–158.
- Cuo, L., Beyene, T. K., Voisin, N., Su, F., Lettenmaier, D. P., Alberti, M., & Richey, J. E. (2011). Effects of mid-twenty-first century climate and land cover change on the hydrology of the Puget Sound basin, Washington. Hydrological Processes, 25(11), 1729–1753.
- Dee, D. P., Uppala, S. M., Simmons, A. J., Berrisford, P., Poli, P., Kobayashi, S., … Bauer, P. (2011). The ERA-Interim reanalysis: Configuration and performance of the data assimilation system. Quarterly Journal of the Royal Meteorological Society, 137(656), 553–597.
- Déry, S. J., & Brown, R. D. (2007). Recent Northern Hemisphere snow cover extent trends and implications for the snow-albedo feedback. Geophysical Research Letters, 34(22), L22504. doi: 10.1029/2007GL031474
- Déry, S. J., Stadnyk, T. A., MacDonald, M. K., Koenig, K. A., & Guay, C. (2018). Flow alteration impacts on Hudson Bay river discharge. Hydrological Processes, 32, 3576–3587. doi: 10.1002/hyp.13285
- Déry, S. J., & Wood, E. F. (2005). Observed twentieth century land surface air temperature and precipitation covariability. Geophysical Research Letters, 32, L21414. doi: 10.1029/2005GL024234
- Dore, M. H. (2005). Climate change and changes in global precipitation patterns: What do we know? Environment International, 31(8), 1167–1181.
- Eisner, S., Flörke, M., Chamorro, A., Daggupati, P., Donnelly, C., Huang, J., … Krysanova, V. (2017). An ensemble analysis of climate change impacts on streamflow seasonality across 11 large river basins. Climatic Change, 141(3), 401–417. doi: 10.1007/s10584-016-1844-5
- Environment Canada. (1995). The state of Canada’s climate: Monitoring variability and change (No. 95–1, p. 52). Ottawa, Canada: Minister of Public Works and Government Services.
- Environment and Climate Change Canada. (2016). Canadian climate normals 1981-2010 station data [Data]. Retrieved from http://climate.weather.gc.ca/climate_normals/results_1981_2010_e.html
- Essou, G. R., Sabarly, F., Lucas-Picher, P., Brissette, F., & Poulin, A. (2016). Can precipitation and temperature from meteorological reanalyses be used for hydrological modeling? Journal of Hydrometeorology, 17(7), 1929–1950.
- Eum, H.-I., Dibike, Y., Prowse, T., & Bonsal, B. (2014). Inter-comparison of high-resolution gridded climate data sets and their implication on hydrological model simulation over the Athabasca Watershed, Canada. Hydrological Processes, 28(14), 4250–4271.
- Fortin, V., Roy, G., Stadnyk, T., Koenig, K., Gasset, N., & Mahidjiba, A. (2018). Ten years of science based on the Canadian Precipitation Analysis: A CaPA system overview and literature review. Atmosphere-Ocean, 56(3), 178–196. doi: 10.1080/07055900.2018.1474728
- Fowler, H. J., Ekström, M., Blenkinsop, S., & Smith, A. P. (2007). Estimating change in extreme European precipitation using a multimodel ensemble. Journal of Geophysical Research: Atmospheres, 112(D18104). doi: 10.1029/2007JD008619
- Fowler, H. J., & Kilsby, C. G. (2007). Using regional climate model data to simulate historical and future river flows in northwest England. Climatic Change, 80(3–4), 337–367.
- Gan, T. Y., & Kwong, Y. T. (1992). Identification of warming trends in northern Alberta and southern Northwest Territories by the non-parametric Kendall’s test. In G. W. Kite & K. D. Harvey (Eds.), Proceedings of NHRI workshop no. 8: Using hydrometric data to detect and monitor climatic change (pp. 43–56). Saskatoon, SK: National Hydrology Research Institute.
- Gebremichael, M., Krajewski, W. F., Morrissey, M. L., Huffman, G. J., & Adler, R. F. (2005). A detailed evaluation of GPCP 1 daily rainfall estimates over the Mississippi River Basin. Journal of Applied Meteorology, 44(5), 665–681.
- Gemmer, M., Becker, S., & Jiang, T. (2004). Observed monthly precipitation trends in China 1951–2002. Theoretical and Applied Climatology, 77(1–2), 39–45. doi: 10.1007/s00704-003-0018-3
- Gocic, M., & Trajkovic, S. (2013). Analysis of changes in meteorological variables using Mann-Kendall and Sen’s slope estimator statistical tests in Serbia. Global and Planetary Change, 100, 172–182.
- Hively, W. D., Gérard-Marchant, P., & Steenhuis, T. S. (2006). Distributed hydrological modeling of total dissolved phosphorus transport in an agricultural landscape, part II: Dissolved phosphorus transport. Hydrology and Earth System Sciences, 10(2), 263–276. doi: 10.5194/hess-10-263-2006
- Hong, Y., Adler, R. F., Huffman, G. J., & Pierce, H. (2010). Applications of TRMM-based multi-satellite precipitation estimation for global runoff prediction: Prototyping a global flood modeling system. In Satellite rainfall applications for surface hydrology (pp. 245–265). Netherlands: Springer.
- Hopkinson, R. F., McKenney, D. W., Milewska, E. J., Hutchinson, M. F., Papadopol, P., & Vincent, L. A. (2011). Impact of aligning climatological day on gridding daily maximum–minimum temperature and precipitation over Canada. Journal of Applied Meteorology and Climatology, 50(8), 1654–1665.
- Horton, P., Schaefli, B., Mezghani, A., Hingray, B., & Musy, A. (2006). Assessment of climate-change impacts on alpine discharge regimes with climate model uncertainty. Hydrological Processes, 20(10), 2091–2109.
- Huisman, J. A., Breuer, L., Bormann, H., Bronstert, A., Croke, B. F. W., Frede, H. G., … Kite, G. (2009). Assessing the impact of land use change on hydrology by ensemble modeling (LUCHEM) III: Scenario analysis. Advances in Water Resources, 32(2), 159–170.
- Islam, S. U., & Déry, S. J. (2017). Evaluating uncertainties in modelling the snow hydrology of the Fraser River Basin, British Columbia, Canada. Hydrology and Earth System Sciences, 21(3), 1827–1847. doi: 10.5194/hess-21-1827-2017
- Kalnay, E., Kanamitsu, M., Kistler, R., Collins, W., Deaven, D., Gandin, L., … Woollen, J. (1996). The NCEP/NCAR 40-year reanalysis project. Bulletin of the American Meteorological Society, 77(3), 437–471.
- Kay, A. L., Davies, H. N., Bell, V. A., & Jones, R. G. (2009). Comparison of uncertainty sources for climate change impacts: Flood frequency in England. Climatic Change, 92(1), 41–63.
- Kendall, M. G. (1975). Rank correlation methods (4th ed., Vol. 8). London: Charles Griffin.
- Kistler, R., Collins, W., Saha, S., White, G., Woollen, J., Kalnay, E., … Kousky, V. (2001). The NCEP–NCAR 50–year reanalysis: Monthly means CD–ROM and documentation. Bulletin of the American Meteorological Society, 82(2), 247–267.
- Kouwen, N. (1988). WATFLOOD: A micro-computer based flood forecasting system based on real-time weather radar. Canadian Water Resources Journal, 13(1), 62–77. doi: 10.4296/cwrj1301062
- Krishnamurti, T. N., Kishtawal, C. M., LaRow, T. E., Bachiochi, D. R., Zhang, Z., Williford, C. E., … Surendran, S. (1999). Improved weather and seasonal climate forecasts from multimodel superensemble. Science, 285(5433), 1548–1550. doi: 10.1126/science.285.5433.1548
- Langlois, A., Kohn, J., Royer, A., Cliche, P., Brucker, L., Picard, G., … Willemet, J. M. (2009). Simulation of snow water equivalent (SWE) using thermodynamic snow models in Québec, Canada. Journal of Hydrometeorology, 10(6), 1447–1463. doi: 10.1175/2009JHM1154.1
- Mahfouf, J.-F., Brasnett, B., & Gagnon, S. (2007). A Canadian Precipitation Analysis (CaPA) project: Description and preliminary results. Atmosphere-Ocean, 45(1), 1–17. doi: 10.3137/ao.v450101
- Manitoba Hydro. (2015). Climate change report - Fiscal year 2014-2015. (p. 48). Retrieved from https://www.hydro.mb.ca/environment/pdf/climate_change_report_2014_15.pdf
- Mann, H. B. (1945). Nonparametric tests against trend. Econometrica: Journal of the Econometric Society, 13, 245–259.
- McKenney, D. W., Hutchinson, M. F., Papadopol, P., Lawrence, K., Pedlar, J., Campbell, K., … Owen, T. (2011). Customized spatial climate models for North America. Bulletin of the American Meteorological Society, 92(12), 1611–1622. doi: 10.1175/2011BAMS3132.1
- Mekis, E., & Hogg, W. D. (1999). Rehabilitation and analysis of Canadian daily precipitation time series. Atmosphere-Ocean, 37(1), 53–85.
- Mesinger, F., DiMego, G., Kalnay, E., Mitchell, K., Shafran, P. C., Ebisuzaki, W., … Shi, W. (2006). North American regional reanalysis. Bulletin of the American Meteorological Society, 87(3), 343–360. doi: 10.1175/BAMS-87-3-343
- Middelkoop, H., Daamen, K., Gellens, D., Grabs, W., Kwadijk, J. C., Lang, H., … Wilke, K. (2001). Impact of climate change on hydrological regimes and water resources management in the Rhine basin. Climatic Change, 49(1–2), 105–128.
- Milewska, E. J., Hopkinson, R. F., & Niitsoo, A. (2005). Evaluation of geo-referenced grids of 1961–1990 Canadian temperature and precipitation normals. Atmosphere-Ocean, 43(1), 49–75.
- Mishra, V., & Lilhare, R. (2016). Hydrologic sensitivity of Indian sub-continental river basins to climate change. Global and Planetary Change, 139, 78–96. doi: 10.1016/j.gloplacha.2016.01.003
- Modarres, R., & Sarhadi, A. (2009). Rainfall trends analysis of Iran in the last half of the twentieth century. Journal of Geophysical Research: Atmospheres, 114, D03101. doi: 10.1029/2008JD010707
- Mondal, A., Kundu, S., & Mukhopadhyay, A. (2012). Rainfall trend analysis by Mann-Kendall test: A case study of north-eastern part of Cuttack district, Orissa. International Journal of Geology, Earth and Environmental Sciences, 2(1), 70–78.
- Newbury, R., & Malaher, G. (1973). The destruction of Manitoba’s last great river. Retrieved from http://www.arlis.org/docs/vol2/hydropower/APA_DOC_no._887.pdf
- Nijssen, B., & Lettenmaier, D. P. (2004). Effect of precipitation sampling error on simulated hydrological fluxes and states: Anticipating the global precipitation measurement satellites. Journal of Geophysical Research: Atmospheres, 109(D02103). doi: 10.1029/2003JD003497
- NRCan. (2014). Regional, national and international climate modelling (Introduction). Retrieved from http://cfs.nrcan.gc.ca/projects/3?lang=en_CA
- O’Neil, H. C. L., Prowse, T. D., Bonsal, B. R., & Dibike, Y. B. (2017). Spatial and temporal characteristics in streamflow-related hydroclimatic variables over western Canada. Part 1: 1950–2010. Hydrology Research, 48(4), 915–931.
- Phillips, D. (1990). The climates of Canada (p. 178). Ottawa, Ontario: Canadian Government Publishing Centre. Environment Canada.
- Schneider, U., Fuchs, T., Meyer-Christoffer, A., & Rudolf, B. (2008). Global precipitation analysis products of the GPCC. Offenbach, Germany: Deutscher Wetterdienst.
- Sen, P. K. (1968). Estimates of the regression coefficient based on Kendall’s tau. Journal of the American Statistical Association, 63(324), 1379–1389.
- Sharma, A. R., & Déry, S. J. (2016). Elevational dependence of air temperature variability and trends in British Columbia’s Cariboo Mountains, 1950–2010. Atmosphere-Ocean, 54(2), 153–170.
- Shepard, D. (1968). A two-dimensional interpolation function for irregularly-spaced data. In Proceedings of the 1968 23rd ACM National Conference (pp. 517–524). New York: ACM. doi: 10.1145/800186.810616
- Simmons, A. J., & Poli, P. (2015). Arctic warming in ERA-Interim and other analyses. Quarterly Journal of the Royal Meteorological Society, 141(689), 1147–1162. doi: 10.1002/qj.2422
- Simmons, A. J., Poli, P., Dee, D. P., Berrisford, P., Hersbach, H., Kobayashi, S., & Peubey, C. (2014). Estimating low-frequency variability and trends in atmospheric temperature using ERA-Interim. Quarterly Journal of the Royal Meteorological Society, 140(679), 329–353. doi: 10.1002/qj.2317
- Skinner, W. R., & Gullett, D. W. (1993). Trends of daily maximum and minimum temperature in Canada during the past century. Climatological Bulletin, 27(2), 63–77.
- Smith, A., Delavau, C., & Stadnyk, T. (2015). Identification of geographical influences and flow regime characteristics using regional water isotope surveys in the lower Nelson River, Canada. Canadian Water Resources Journal, 40(1), 23–35.
- Suh, M.-S., Oh, S.-G., Lee, D.-K., Cha, D.-H., Choi, S.-J., Jin, C.-S., & Hong, S.-Y. (2012). Development of new ensemble methods based on the performance skills of regional climate models over South Korea. Journal of Climate, 25(20), 7067–7082. doi: 10.1175/JCLI-D-11-00457.1
- Taubenböck, H., Wurm, M., Netzband, M., Zwenzner, H., Roth, A., Rahman, A., & Dech, S. (2011). Flood risks in urbanized areas – Multi-sensoral approaches using remotely sensed data for risk assessment. Natural Hazards and Earth System Science, 11, 431–444.
- Wang, A., Bohn, T. J., Mahanama, S. P., Koster, R. D., & Lettenmaier, D. P. (2009). Multimodel ensemble reconstruction of drought over the continental United States. Journal of Climate, 22(10), 2694–2712.
- Weedon, G. P., Balsamo, G., Bellouin, N., Gomes, S., Best, M. J., & Viterbo, P. (2014). The WFDEI meteorological forcing data set: WATCH forcing data methodology applied to ERA-Interim reanalysis data. Water Resources Research, 50(9), 7505–7514.
- Wilks, D. S. (2011). Statistical methods in the atmospheric sciences ( Vol. 100). San Diego, CA: Academic Press.
- Wong, J. S., Razavi, S., Bonsal, B. R., Wheater, H. S., & Asong, Z. E. (2017). Inter-comparison of daily precipitation products for large-scale hydro-climatic applications over Canada. Hydrology and Earth System Sciences, 21(4), 2163–2185. doi: 10.5194/hess-21-2163-2017
- Yue, S., Pilon, P., Phinney, B., & Cavadias, G. (2002). The influence of autocorrelation on the ability to detect trend in hydrological series. Hydrological Processes, 16(9), 1807–1829. doi: 10.1002/hyp.1095
- Zhang, Q., Sun, P., Singh, V. P., & Chen, X. (2012). Spatial-temporal precipitation changes (1956–2000) and their implications for agriculture in China. Global and Planetary Change, 82-83, 86–95.