
ABSTRACT
This study presents the development of a new dataset of homogenized temperature for use in trend analysis and monitoring climate change in Canada. This dataset contains daily data for 780 locations across the country: 508 locations with an active station (current observations) and long record (starting prior to 1990); 53 locations with an active station and short record (starting after 1990); and 219 locations with no current observations (station closed) but with more than 30 years of data. Daily observations from nearby sites were often merged into a single record to create a long time series. This new dataset includes observations taken at Reference Climate Stations and from the Canada Aviation Weather Services, which are used to extend past climate observations into recent times. First, the data were quality controlled. The daily minimum temperature was adjusted for the change in observing time at principal stations in 1961. Parallel daily data were used to detect non-climatic shifts when the observations from nearby sites were merged. Series of annual and seasonal mean temperatures were tested for homogeneity. Daily temperatures were adjusted using a quantile-matching procedure if needed. Two main causes of data inhomogeneity affecting the trends over the 1948–2018 and 1900–2018 periods were identified. First, the change in observing time in 1961 introduced a cold bias in the annual means of the daily minimum temperatures after 1961. Second, merging observations from airport stations with older records has often created an artificial decreasing shift in the unadjusted data because of the better exposure of the instruments at airport stations. This new homogenized dataset shows a slightly stronger warming than the unadjusted data: the trend in the annual mean temperature for Canada has changed from 1.69° to 1.74°C for 1948–2018, and the trend for southern Canada has changed from 1.32° to 1.62°C for 1900–2018 because of all the adjustments applied to daily temperature in this study.
RÉSUMÉ
[Traduit par la rédaction] Cette étude décrit la création d’un nouvel ensemble de données de température homogénéisées destiné à l’analyse des tendances et à la surveillance des changements climatiques au Canada. Cet ensemble contient les données quotidiennes de 780 sites canadiens: 508 stations actives (rapportent actuellement) possédant un long historique de relevés (commençant avant 1990); 53 stations actives possédant un court historique de relevés (commençant après 1990); et 219 sites sans observations actuelles (stations fermées), mais comptant plus de 30 ans de données. Dans plusieurs cas, nous avons fusionné les observations quotidiennes de sites voisins afin de créer une longue série temporelle unique. Ce nouvel ensemble de données comprend des observations prises aux stations climatologiques de référence ou par les Services météorologiques à l’aviation du Canada, et sert à prolonger les observations climatologiques passées jusqu’à des périodes récentes. Tout d’abord, les données ont fait l’objet d’un contrôle de qualité. La température minimale quotidienne a été changée pour tenir compte de la modification de l’heure d’observation dans les stations principales en 1961. Le chevauchement des données quotidiennes a servi à détecter les décalages non climatologiques lorsque les observations des sites voisins ont été fusionnées. Nous avons testé les séries de températures moyennes annuelles et saisonnières afin d’en vérifier l’homogénéité. Puis nous avons modifié les températures quotidiennes à l’aide d’une régression quantile, le cas échéant. Nous avons détecté deux causes principales d’inhomogénéité des données touchant les tendances sur les périodes de 1948 à 2018 et de 1900 à 2018: (1) la modification de l’heure d’observation en 1961, qui a généré un biais froid dans les moyennes annuelles des températures minimales quotidiennes après 1961; (2) la fusion des observations issues de sites aéroportuaires avec des relevés plus anciens, qui a souvent créé un décalage artificiel vers le bas des données non corrigées, en raison de l’exposition améliorée des instruments des sites situés aux aéroports. Ce nouvel ensemble de données homogénéisées montre un réchauffement légèrement plus important que les données non corrigées: la tendance de la température moyenne annuelle pour le Canada est passée de 1,69 à 1,74 °C pour la période de 1948 à 2018, et la tendance pour le sud du Canada est passée de 1,32 à 1,62 °C pour la période de 1900 à 2018, et ce, à la suite des modifications appliquées à la température quotidienne dans cette étude.
1 Introduction
Long records of climate observations at fine temporal and spatial resolution are needed for studying climate trends on local, regional, and global scales (Bush et al., Citation2014; Collins et al., Citation2014; Donat et al., Citation2013; Kirtman et al., Citation2013). High quality observations are also required in near-real time for monitoring the effects of climate change and extreme weather events on today’s society (Blunden et al., Citation2018; WMO, Citation2018). In Canada, the climate monitoring network has experienced considerable changes over its long history of recording observations, particularly since the early 1990s. Programme reviews, including the modernization of the network with automated stations and the changing priorities of partner agencies who collect observations, have not only resulted in the closure of many long-term observing sites that had previously been in operation for decades but have also allowed for the installation of new sites in isolated areas. For this reason, it has become challenging for scientists to access long homogeneous records of climate observations that are routinely updated with current observations and can be used for studying climate trends in Canada.
Climate observations are stored in the National Climate Data and Information Archive and come from various private and public agencies and departments. The Meteorological Service of Canada (MSC) is responsible for archiving most of the climate observations recorded in Canada. A 7-digit climate identification number (denoted as climate ID or given by the actual 7-digit number hereafter) is assigned to a site where official weather observations are taken. This number serves as a unique identifier for retrieving climate data from the digital archives. When the observations are discontinued at a site because of site closure or a change in observing agency, for example, the same climate ID is not used for a subsequent site unless it is sufficiently close to the previous site, meaning that the observations can be combined for use in some climatological applications. Climate observations can be taken by different instruments and agencies at the same location and stored under different climate IDs in the digital archives.
Reference Climate Stations (RCS) were identified in Canada in response to a request made by the World Meteorological Organization (WMO, Citation1986, Citation1993) that foresaw the need for continuous observations of temperature and precipitation for properly assessing climatic change. The WMO guidelines recommend that stations be chosen not only for the longevity of their climate data but also for their characteristics, that is, they should be permanent, well managed (with very few changes in instrumentation or observing procedures), and unaffected by densely populated areas. These stations should be protected from any changes, including closure, and satisfy specific climate research requirements, such as extending coverage to data sparse areas like the Arctic and the boreal region. As of today, about 300 stations have been assigned RCS status in Canada. Most RCS stations are operated by the MSC but some are from contributing agencies, such as the Aviation Weather Services and the Department of National Defense. Not all RCS stations have a long continuous record of climate observations: most of them have observations in near-real time but with a rather short record of 5–20 years of continuous data. The RCS stations and their compatibility with the US network is discussed in detail in Milewska and Vincent (Citation2016).
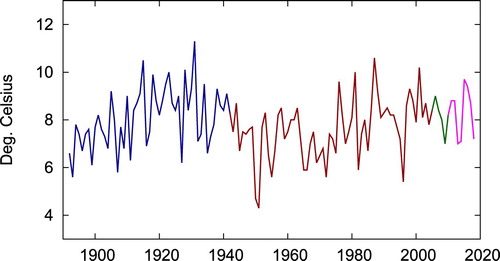
In order to have a long time series of observations suitable for climate monitoring and trend analysis, climatologists have to join observations with different climate IDs and make the joined data series homogeneous (i.e., free of artificial non-climatic shifts). This is not a trivial task because consideration needs to be given to the climate conditions, location of instruments, observing procedures and agency, and the interval of time for which the observations were recorded; otherwise, results of climate trend studies could be biased by artificial non-climatic shifts in the data series. A typical example is given for North Battleford located in west-central Saskatchewan. As shown in , the daily temperatures from Battleford downtown (4040420; 1891–1942) were joined with those from North Battleford Airport (4045600; 1942–2005) located about 10 km from the previous site; this composite time series was further joined to the automated observations from North Battleford Airport (4045605; 2005–2010) and North Battleford RCS (4045607; 2010–2018) taken at the same location. In these situations, the joined data series should be checked to make sure that a non-climatic shift was not created at the joining dates, as in 1942, 2005, and 2010 in the North Battleford example.
Fig. 1 Annual mean of the daily maximum temperatures from Battleford downtown station for 1892–1942 (blue); North Battleford Airport for 1942–2005 (red); North Battleford Airport automated observations for 2005–2010 (green), and North Battleford RCS automated observations 2010–2018 (magenta).
In the mid-1990s, a First Generation Homogenized Temperature dataset was developed: it included long time series of homogenized monthly mean temperature at 210 locations (Vincent, Citation1998; Vincent and Gullett, Citation1999). This dataset was created for the analysis of temperature trends in Canada (Environment Canada, Citation1995; Zhang et al., Citation2000). In order to improve temporal and spatial coverage and benefit from newly developed techniques to adjust daily temperature data (Vincent et al., Citation2002; Wang et al., Citation2010, Citation2014), a Second Generation Homogenized Temperature was developed at the end of the 2000s, which included homogenized daily temperature at 338 locations (Vincent et al., Citation2012). This dataset has been updated every year with the most current observations and made available publicly on the Adjusted and Homogenized Canadian Climate Data (AHCCD) website (ECCC, Citation2018a). Annual, seasonal, and monthly mean temperature departures from the average of the 1961–1990 reference period were interpolated to evenly spaced grid points called Canadian Grid or CANGRD (ECCC, Citation2018b; Milewska and Hogg, Citation2001; Zhang et al., Citation2000) for ongoing monitoring of the regional and national temperature conditions presented in the Climate Trends and Variations Bulletin (ECCC, Citation2018c) and updates of the temperature trends in Canada (Vincent et al., Citation2015). The data were also used to analyze changes in indices based on daily and extreme temperatures (Vincent et al., Citation2018a; Vincent and Mekis, Citation2006) and one-in-20-year extreme temperature events at individual stations (Wang et al., Citation2014).
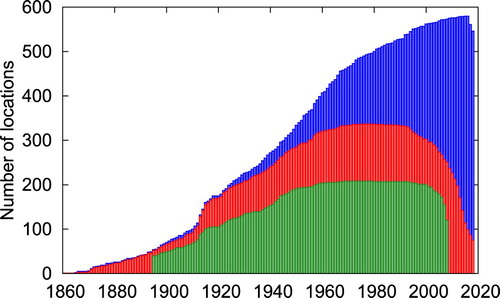
This paper presents the development of a Third Generation Homogenized Temperature, which builds on the Second Generation by first incorporating recent daily temperature observations taken at RCS sites and by the Aviation Weather Services (denoted as NavCan stations hereafter). Because many of the RCS sites have a relatively short period of data, it was often necessary to merge the RCS observations with those from the traditional older sites with longer records. To preserve the continuity of records during the modernization of the observing network, the MSC dedicated great effort and expense to installing new RCS sites in close proximity to older sites to collect parallel observations (Milewska and Hogg, Citation2002; Milewska and Vincent, Citation2016; Vincent et al., Citation2018b). In this study, pair-sites data (parallel observations) are used, when available, to determine whether an artificial shift is created at the joining date when the observations of two sites are merged; these data are also used to estimate the adjustments needed to homogenize the data when necessary. Merging observations with RCS and NavCan sites addresses the decline of stations reporting daily temperatures in the Second Generation Homogenized Temperature (). The Third Generation also includes observations from new sites installed in isolated areas (mainly RCS sites that cannot be extended back in time to produce long records) and those from older sites that have collected observations for long periods of time (>30 years) but lack current observations for trend analysis.
Fig. 2 Number of locations reporting each year in the First Generation (green), Second Generation without any additional joined observations from the RCS and NavCan sites (red), and Third Generation Homogenized Temperature (blue). The Third Generation dataset contains homogenized daily temperature for 780 locations in total; however, this figure shows the 561 locations with current data; the 219 locations with no current observations and with a long record (>30 years) are not included.
In this study, the data were first quality controlled, and the daily minimum temperatures were adjusted for the change in observing time in 1961 at 96 principal (mainly airport) stations. Then, parallel daily observations derived from periods of overlapping data between joined stations were used to test for potential shifts. Series of annual and seasonal means of daily temperature were tested for homogeneity using the observations of neighbouring stations as reference series. Daily temperatures were adjusted using a quantile-matching procedure in order to diminish the shifts detected in the data time series: daily values prior to the detected shifts were adjusted to be in agreement with the most recent homogeneous segment of the tested series. Section 2 describes the data and methodologies used to develop the homogenized temperature dataset. In Section 3, the impact of the data inhomogeneities on the temperature trends are examined first for individual stations, then for Canada (1948–2018) and southern Canada (1900–2018). A discussion and concluding remarks follow in Sections 4 and 5, respectively.
2 Data and methods
a Data
Daily maximum and minimum temperatures (hereafter denoted by tmax and tmin, respectively,) were retrieved from the National Climate Data and Information Archive of Environment and Climate Change Canada. An inventory indicated that daily temperature can be retrieved for approximately 6350 different climate IDs. About 9% of the climate IDs have more than 60 years of data, 20% have 30–60 years, 47% have 5–30 years, and 24% have less than 5 years of data. The location with the longest record of “continuous” daily temperature (with very few missing values and the same climate ID) is Toronto, Ontario (6158350; 1840–2003) followed by Woodstock, Ontario (6149625; 1886–present), Calgary, Alberta (3031093; 1881–2012), Indian Head CDA, Saskatchewan (4013480; 1889–present), and Ottawa, Ontario (6105976; 1889–present). Other notably long records include Medicine Hat, Alberta (3034480; 1883–2008), Montréal McGill, Quebec (7025280; 1871–1993), and Sable Island, Nova Scotia (8204700; 1897–present).
In this study, daily mean temperature (tmean hereafter) is the average of tmax and tmin. Monthly mean maximum (or minimum) temperature is the average of tmax (or tmin) over the month and is set to missing if more than eight random or five consecutive daily values in the month are missing. Annual and seasonal means are calculated from the monthly values and retained if all related monthly values are non-missing. The seasons are defined as winter (December of the previous year to February of the current year), spring (March–May), summer (June–August), and autumn (September–November).
b Joining Observations for Co-Located Sites
In order to have a long time series that is useful for trend analysis, it was often necessary to merge observations from co-located sites or from the same site but archived under a different climate ID: co-located sites were usually in close proximity and most were not more than 10 km apart. Considerations were first given to all 300 RCS sites; their records were joined to the data of older sites, in particular, to those of the Second Generation of homogenized data, when possible. Then the remaining series from the Second Generation were extended to cover recent years, often with observations from NavCan stations. Finally, other sites with long records (>30 years) but with no current observations were considered for inclusion in the Third Generation. In this study, homogenized daily temperatures are developed for 780 locations and joining of a site’s observations is done at many locations; more than half of the series are formed by joining the observations from two or more stations’ records. Among the 780 locations, 33% (257) join two climate IDs, 17% (132) join three IDs, 7% (51) join four IDs, and 1% (8) join five IDs. There are 42% (332) remaining locations with single-station sites (no joining observations).
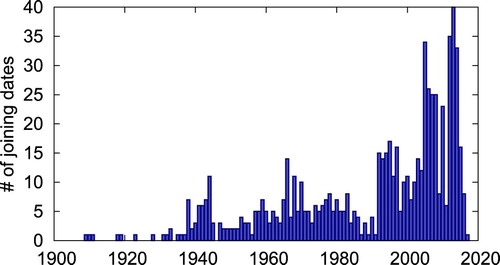
The number of joining dates per year shown in has a peak over 1941–1945 and a second peak over 1965–1970. These dates generally correspond to the merging of observations from rural observing sites (located at houses or farms) to newly built airport stations (during the Second World War, for example). In these situations, airport data are being extended backward in time using early climate stations. The third and fourth peaks over 1992–2000 and 2005–2008, respectively, are largely due to stations that have fully or partially ceased human observations: most of these sites were closed and then re-opened with automated observing systems and the data were stored under a different climate ID (some of these were assigned RCS status). The most recent peak over 2012–2015 mainly corresponds to joining dates with RCS and NavCan observations. In recent years, observations from RCS and NavCan sites have either been human or machine observations, or a combination of both, depending on the observing hours, specifically whether observations are made during evening, weekend, and holiday hours.
Fig. 3 Number of joining dates per year in the Third Generation Homogenized Temperature.
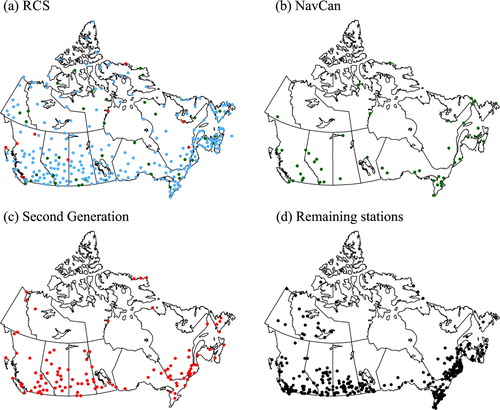
There are 224 locations with recent observations made at RCS sites whose data series were used to extend past climate observations into recent time (). There are 64 locations with recent RCS observations for which the data series were not joined in time because no sites with older daily temperature were available to use for joining (usually in remote areas). Currently, 12 of the 300 RCS sites are not included in the Third Generation because they have either too few observations or lack daily temperature observations. There are 48 locations with current data from NavCan stations that are not RCS sites (not all NavCan stations are used in this dataset) and 109 locations with data from the Second Generation that are not joined to RCS or NavCan sites.
Fig. 4 Location of daily temperature observations at (a) 300 RCS sites (224 joined in time, blue; 64 not joined in time, green; 12 not used, red); (b) 48 NavCan sites (not RCS); (c) 109 Second Generation sites (not RCS, not NavCan); and (d) 335 remaining sites, for a total of 780 locations across the country.
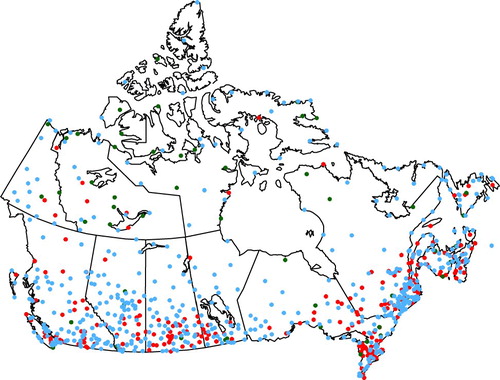
indicates the locations of the 780 homogenized data series. There are 508 locations with an active station (current observations) and a long record (starting date prior to 1990). There are 53 locations with an active station and short record (starting date on or after 1990): these locations are mainly new RCS sites located in the North. Finally, there are 219 locations with no current observations (station closed) but with more than 30 years of data. These latest series cannot be used in trend analysis over 1900–2018 and 1948–2018; however, these homogenized data series can be used for other purposes, such as interpolating station data to an evenly spaced grid to compare observed data with model predictions.
Fig. 5 Location of the 780 homogenized data series. There are 508 locations with an active station (current observations) and long record (starting date prior to 1990, blue); 53 locations with an active station and short record (starting date from 1990, green); and 219 locations with no current observations (station closed) but with more than 30 years of data (red).
c Checking Data Quality
A few basic checks were applied to ensure that the data were of reasonable quality. A suspicious daily temperature was identified when any one of the following criteria was met:
tmax (or tmin) less than −60°C or greater than 50°C (this test was applied to identify outliers in the climate archives)
tmax (or tmin) = 0 for more than five consecutive days (this happened at a few automated sites when the sensor was not reset properly)
tmin is greater than tmax (tmin can be greater than tmax at airport stations where tmin and tmax were previously observed at different times)
the difference between tmax and tmin is greater than 40°C (either tmax or tmin could be wrong)
tmax (or tmin) outside five standard deviations of the calendar day in question (the standard deviation was calculated for each calendar day using the full period of record).
The suspicious daily value was compared with the daily temperature before and after the identified day and sometimes with the observation at a nearby station. It was either retained, corrected (if the correction was obvious, such as the decimal point was at the wrong place or a negative sign was missing) or set to missing. Of the 780 homogenized data series of tmax and tmin throughout their complete period of record, only 0.0108% of data (about 2500 values) were identified as suspicious. About half were corrected or set to missing; the remainder were deemed accurate.
d Adjusting tmin for the Change in Observing Time in 1961
The highest and lowest temperatures are represented by tmax and tmin, respectively, over a 24-hour interval of time that does not necessarily correspond to the calendar day. On 1 July 1961, the climatological day (24-hour observing window) was redefined to end at 0600 UTC (Universal Time Coordinated) at all principal stations (mainly airports) in Canada for both tmax and tmin (the non-airport stations did not have this change in observing time). Prior to that date, the climatological day ended at 1200 UTC for tmax and 0000 UTC for tmin. Because the 0600 UTC hour corresponds more closely to the time when the actual daily minimum temperature occurs (between midnight and dawn), it is now more likely that the same (or similar) minimum is recorded on two consecutive days, introducing a cold bias in the annual and monthly means of tmin after July 1961 (Hopkinson et al., Citation2011; Vincent et al., Citation2009).
To resolve this bias (non-climatic shift), the affected tmin were adjusted from July 1961 to present (here to 2018) using hourly temperatures (temperature observed at the top of the hour). An affected day was detected when the lowest hourly temperature in the 24-hour window ending at 0600 UTC was colder (by more than 0.5°C) than the lowest hourly temperature in the 24-hour window ending at 0000 UTC. For the affected day, tmin was then estimated to be 0.5°C lower than the lowest hourly temperature in the 24-hour window ending at 0000 UTC: the subtraction of 0.5°C was used to estimate the small difference between the true daily minimum and the lowest hourly temperature (Hopkinson et al., Citation2011; Vincent et al., Citation2009). A similar approach was used to align the highest tmin; however, different highest values rarely occurred. Adjusting the period prior to 1961 (instead of after 1961) would have resolved the shift detected in the annual and monthly means of tmin, but it would also have created “incorrect” tmin before 1961 that do not correspond to actual minima in the daily temperature cycle.
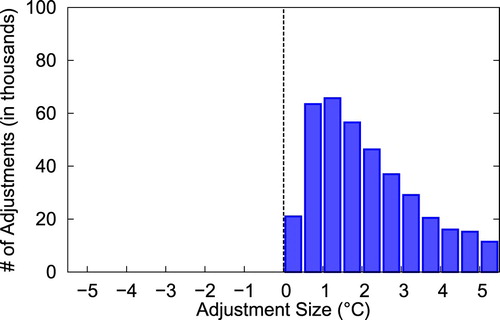
In the current study, this procedure was applied to adjust tmin at 96 principal stations because these stations were the only ones with sufficient hourly temperature observations (with few missing values) over the 1961–2018 period to properly identify the affected days. Because of the longitudinal width of Canada, the annual percentage of affected days gradually increases toward the eastern regions, from about 15% for stations in the west to 35% for stations in the east, over the 1961–2018 period. Therefore, the change in observing time in 1961 has created a larger bias in the annual and monthly means of tmin at locations in the eastern regions where the minimum temperature occurs closer to 0600 UTC, and more days are affected by this observing time. The majority of the daily adjustments for the change in observing time in 1961 ranges from 0.5° to 5°C, and the average adjustment is 2.5°C. ().
Fig. 6 Frequency distribution of the adjustments applied to tmin for the change in observing time in July 1961 at 96 principal stations. These adjustments were applied to the affected days from July 1961 to December 2018.
e Detecting Shifts Using Parallel Observations at Pair-sites
The collection of parallel observations has gradually become standard practice in recent years in Canada. New RCS sites were installed in close proximity to traditional sites that had been operational longer with the purpose of collecting parallel observations (Milewska and Hogg, Citation2002; Milewska and Vincent, Citation2016). There are also a number of older sites where concurrent observations exist at pair-sites (old rural and airport sites for example), and these data were previously used for developing mathematical relations and validating daily temperature adjustments (Vincent et al., Citation2018b). In the current study, all pair-sites with parallel observations are used to determine whether a non-climatic shift is created at the joining date when the observations of two sites are merged. Not all pair-sites were closely co-located: most of the distances between the pair-sites were within 10 km and most of the elevation differences were within 30 m.
Annual and seasonal means of the daily temperature (tmin or tmax) were first computed at site 1 and site 2 separately using the parallel observations available (2–5 years) usually prior to the joining date. A t-test was applied to determine whether the difference between the means was statistically different from zero at the 5% significance level; 287 pair-sites were tested. Sometimes the difference between the pair-sites was statistically significant but of opposite sign in winter and summer and with a magnitude near zero in the annual means. A shift was retained if the difference in means was statistically different from zero in at least one season. Among all 287 pair-sites, 51 and 105 shifts were detected in the tmax and tmin series, respectively (42 shifts were detected for the same joining date in tmax and tmin). Among the 224 pair-sites when old records were merged to RCS sites, 37 and 56 shifts were identified in the tmax and tmin series, respectively, affecting less than 22% of these joining dates. Daily temperatures were adjusted using a quantile-matching algorithm (described in Section 2.g below) to diminish the shifts detected using parallel observations. All series were further tested for homogeneity using the observations of neighbouring sites as reference series.
f Detecting Shifts Using Neighbour’s Observations as Reference Series
For each of the 780 locations, neighbouring sites were chosen (from the 780 locations) based on distance and periods of available data. The 10 closest neighbours were identified with beginning and ending dates within 10 years of the tested series. Many of the neighbours in the southern regions of the country were within 20–100 km of the tested locations although they could be as far as 400 km apart in the north.
Annual and seasonal means were tested separately to ensure the detection of shifts in cases in which shifts of opposite magnitude were introduced in winter and summer. The penalized maximal t-test (PMTred) algorithm (Wang, Citation2008), as implemented in the RHtestsV4 package (Wang and Feng, Citation2009), was applied separately to the time series of the tested location using each neighbour site as a reference series. This algorithm searches for the most probable position of a shift in the difference (tested-minus-reference) time series and tests whether the shift is statistically different from zero at a chosen significance level (5% here) using a penalized maximal t-test (Wang et al., Citation2007). A reference series is needed to represent the trend and low-frequency variations in the tested series. A changepoint (date of a potential shift ±1 year) was kept if it was detected in the annual series and in at least one season (or in the winter and summer series simultaneously). Because changepoints could arise from inhomogeneities in neighbour series (all neighbours were first adjusted for the change in observing time and shifts detected using parallel observations if needed), a changepoint was finally retained if it was detected using at least four neighbours to make sure that it would be attributable to the tested series (Trewin, Citation2013).
The available metadata were examined for all retained changepoints (shifts) to retrieve their potential cause. However, the station history files are often sparse and incomplete and do not routinely record all changes that have occurred at an observing site, especially the conditions surrounding the instruments, such as ground cover (e.g., pavement, grass) and construction of buildings. Still, greater confidence was placed in the data adjustments if the shifts were supported by some historical information.
The total number of retained shifts is reported in . It is important to mention that “no shifts” indicates that the tested series was found to be homogeneous at the 5% significance level (i.e., no shifts were retained for adjustment because there was no agreement with the detection results provided by the 10 neighbours). About 72% (66%) of the tested series were declared homogeneous in their maximum (minimum) temperature series and do not need adjustment; one to four shifts were retained in the remainder of the tested series. also provides the potential cause of the shifts that were kept for adjustment. About 72% (67%) of the shifts have an identified cause in their maximum (minimum) temperature series. The causes of these shifts include joining sites’ observations (the observations are from different climate IDs), relocation of the instruments, and other causes, such as changes in observer and surroundings (the observations are from the same climate ID). Many of the tested series that were declared homogeneous covered a relatively short period of time (<30 years); it is also possible that the interannual variability of the temperature in Canada, especially during the cold months, has made the detection of small inhomogeneities more difficult.
Table 1. (a) Number of tested series with zero, one, two, three, and four shifts, which have been adjusted, for maximum and minimum temperature; (b) number of shifts due to different causes.
g Adjusting Daily Temperature Using a Quantile-matching Algorithm
The quantile-matching (QM) algorithm as described in Wang et al. (Citation2014) was used for adjusting the shifts detected using parallel observations at pair-sites (first approach) and those detected using neighbour observations as reference (second approach). Both approaches are described in detail in Vincent et al. (Citation2018b) and summarized as follows.
In the first approach, the daily temperature at site 1 and site 2 taken over the overlapping period of two to five years (usually prior to the joining date) are used for developing the daily temperature’s adjustments. The quantiles (1st, 2nd, 3rd, … percentiles) of all data over the overlapping period are obtained for site 1 and site 2 separately; the quantiles are binned into 12 categories, and 12 quantile-category means are calculated for each site. The difference in the category-mean between the two sites is obtained, and a natural spline is fitted to the 12 category-mean differences. The daily adjustment is estimated as the value of the fitted spline corresponding to the quantile of the value to be adjusted.
In the second approach (using a neighbour’s data series as reference), the daily tested-minus-reference values (differences) are first obtained. These daily differences are binned into 12 categories according to the quantile of the corresponding value in the tested series. Such quantile-category binning is done for the segment of data over the five years before and five years after the shift to be adjusted (the year with the shift is not included). Then, for each quantile-category, the difference in the category-mean between the segments of data before and after the shift is obtained. A natural spline is fitted to the 12 category-mean differences. The daily adjustment is estimated as the value of the fitted spline corresponding to the quantile of the value to be adjusted. The three neighbours with the same identified shift and having the highest correlation with the tested series were used to produce three sets of daily adjustments: the final adjustment of the daily value was the median of the adjustments derived from the three neighbours.
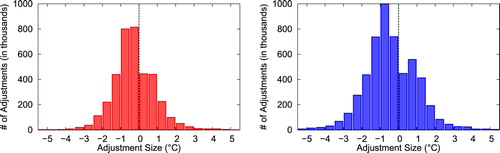
In the current work, all adjustments are taken to occur on 1 January unless the month with the shift is identified from the metadata, joining dates, or previous work. The daily temperatures prior to the detected shifts are adjusted to be in agreement with the most recent homogeneous segment of the tested series. The majority of the QM adjustments range from −3° to 2°C, with an average of −0.2°C for tmax, and from −3.5° to 2.5°C, with an average of −0.4°C for tmin ().
Fig. 7 Frequency distribution of the QM adjustments applied to (a) tmax and (b) tmin. These adjustments were applied from the beginning of the record to the date of the more recent shift at each station with identified inhomogeneities.
h Example of Detecting Shifts Using Parallel Observations at Pair-Sites
The daily temperatures at Victoria Gonzales Hts, British Columbia (1018610; 1898–1973) were joined with those at Victoria Int’l Airport (1018620; 1974–2013) located 27 km from the previous site; this composite series was further joined to the observations at Victoria Int’l Airport (1088621; 2013–2018) taken by NavCan. Victoria Gonzales Hts is located in a coastal hilly area with an elevation of 70 m, with trees and buildings surrounding the observing site, and is in close proximity to Juan de Fuca Strait. The instruments located at Victoria Int’l Airport are at 20 m elevation, far from water, and have better surface air exposure than at Victoria Gonzales Hts (trees and buildings are far from the instruments). Daily temperatures were observed simultaneously at both locations from 1974 to 1978, and these observations were used to determine if an artificial shift was created at the joining date in 1974.
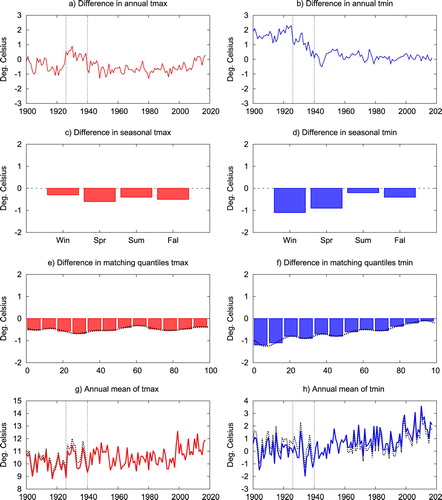
The difference between the daily temperatures over the 1974–1978 period (Victoria Int’l Airport minus Victoria Gonzales Hts) shows substantial variability and a strong seasonal pattern (a and 8b). Victoria Gonzales Hts is more affected by the winds than Victoria Int’l Airport because it is in close proximity to a large body of water. Close examination of the seasonal means of the daily differences reveals that the tmax values for Victoria Int’l Airport are generally warmer than those observed at Victoria Gonzales Hts, especially during the summer, by an average of about 1.9°C (c). This is probably a result of the instruments at the airport being located at lower elevation and far from the cooling effect of trees. However, the tmin values for Victoria Int’l Airport are much colder than those observed at Victoria Gonzales Hts, especially in the winter, spring, and autumn, by an annual average of 1.8°C (d). Because the instruments at the Victoria Gonzales Hts site are surrounded by trees and buildings, the nighttime temperature does not cool as much as the nighttime temperature at the airport, which has better exposure.
Fig. 8 Differences in (a) tmax and (b) tmin between the two sites (Victoria Int’l Airport minus Victoria Gonzales Hts); (c) and (d) seasonal means, and (e) and (f) 12 quantile-bins mean of the differences; (g) and (h) annual mean series before (dotted line) and after (solid line) applying the adjustments. In (e) and (f), the horizontal axis is the percentile, and the dotted line represents the spline fitted to the 12 quantile-bins mean.
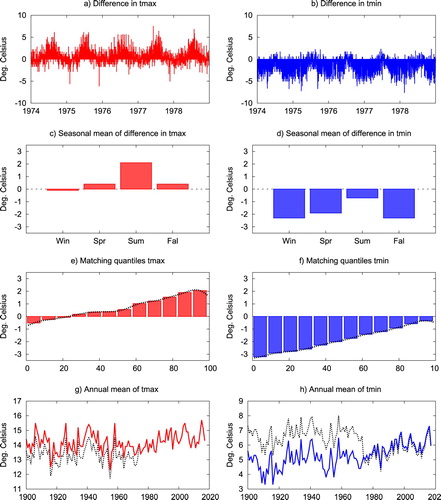
To diminish the shift in the composite daily temperature series, the QM adjustment for each daily temperature value was derived from the spline fitted to the 12 quantile-category means of the differences between the two sites (e and 8f). As a result, the summer high values of tmax at Victoria Gonzales Hts are adjusted by approximately 2.1°C, and the winter low values of tmin are adjusted by approximately −3°C. The daily adjustments have increased the annual mean of tmax by about 0.7°C prior to 1974 (g), while they have decreased the annual mean of tmin by about 1.8°C (h). The composite series of the annual mean of tmin was also adjusted for the change in observing time in 1961, and the adjustments have increased the annual mean of tmin by an average of 0.4°C for the 1974–2018 period. After all these adjustments, the annual mean of tmax (tmin) shows an increasing trend of 0.5°C (1.9°C) from 1900 to 2018, which is of a similar magnitude to the trends observed at neighbouring sites over a comparable period of time.
i Example of Detecting Shifts Using Neighbour’s Observations As Reference Series
The daily temperatures at Moncton, New Brunswick (8103100; 1898–1939) were joined with those at Moncton Airport (8103200; 1940–2012) located 11 km from the previous site; this composite series was further joined to the NavCan observations at Moncton Int’l Airport (8103201; 2012–2018). The instruments at Moncton were located downtown near buildings and trees at an elevation of 12 m. The instruments at the airport have a higher elevation of 71 m and better air exposure with no trees or buildings surrounding the instruments. Parallel observations are not available for this location.
The composite series of the annual and seasonal means of daily temperature were tested for homogeneity using 10 neighbours separately. The difference in the annual mean of tmax (tmin) between the tested series (Moncton composite series) and a neighbour (Fredericton, located 180 km from Moncton, used here as an example) indicates changepoints detected in 1926 and 1940 (a and 9b). These changepoints are identified with at least three other neighbouring series (same date ±1 year). The year 1926 corresponds to the relocation of the instruments to the pumping station, three blocks away from the former site, with a change in observer; the inspector’s report made several years after the relocation reveals that the instruments were not relocated to an adequate location. The year 1940 is associated with the joining of observations from the Moncton downtown site to the airport.
Fig. 9 Differences in annual mean of (a) tmax and (b) tmin between the tested series (Moncton) and neighbour (Fredericton); (c) and (d) seasonal mean and (e) and (f) 12 quantile-bin mean differences (5-year-after-1940 minus 5-year-before-1940) in the daily Moncton-minus-Fredericton series; and (g) and (h) the annual mean series before (dotted line) and after (solid line) applying the adjustments. In (a), (b), (g), and (h), the vertical lines represent the dates of the detected shifts (1926 and 1940). In (e) and (f), the horizontal axis is percentile, and the dotted line represents the spline fitted to the 12 quantile-bins mean.
The seasonal mean difference (5-years-after-1940 minus 5-years-before-1940) of the daily differences between the tested series and neighbour indicate that the tmax (tmin) observations made at the airport are, on average, about 0.5°C (0.7°C) colder than those from the pumping station although the difference in tmin is more pronounced in winter and spring (c and 9d). This difference in temperature is likely a result of the location of the instruments at the airport, with a higher elevation and better exposure.
To diminish the shift in 1940, the QM adjustment for each daily temperature value was derived from the spline fitted to the 12 quantile-category-mean differences shown in e and 9f. As a result, most tmax values at the Moncton pumping station are adjusted by approximately −0.5°C during the 1926–1939 period. The winter low tmin values are adjusted by about −1.0°C while the summer high tmin values are adjusted by about −0.1°C over the same period. The daily adjustments have decreased the annual mean of tmax (tmin) by approximately 0.5°C (0.7°C) over the 1926–1939 period. The procedure is repeated to derive the adjustment for the changepoint in 1926, which is combined with the adjustments for the 1940 shift to lower the data before 1926. These adjustments decreased the annual mean of tmax (tmin) by about 0.2°C (0.5°C) during the 1900–1925 period (g and 9h). The composite series of annual mean of tmin was also adjusted for the change in observing time in 1961, and these adjustments have increased the annual mean of tmin by an average of 0.7°C over the 1961–2018 period. No adjustments were applied to tmin between 1940 and 1961. After all adjustments, the annual mean of tmax (tmin) shows an increasing trend of 1.6°C (2.4°C) from 1900 to 2018, which is in agreement with the trends observed at neighbouring stations over a similar period.
3 Impact of data inhomogeneities on trends in temperature
Because very few stations in the northern regions have climate observations prior to 1948, temperature trends are examined for two periods: 1948–2018 for all stations across Canada to provide a national assessment and 1900–2018 for the stations located mainly in the south for a longer perspective (more than 100 years). The methodology to calculate the trends follows the approach described in Zhang et al. (Citation2000) and Wang et al. (Citation2006). The estimated magnitude of the trend is based on the slope estimation from Sen (Citation1968), and its statistical significance is obtained from the nonparametric Kendall’s tau test (Kendall, Citation1955). This approach was used to assess the trends in Canada’s climate (Vincent et al., Citation2015) and in temperature and precipitation indices (Vincent et al., Citation2018a).
a Impact on Trends at Individual stations
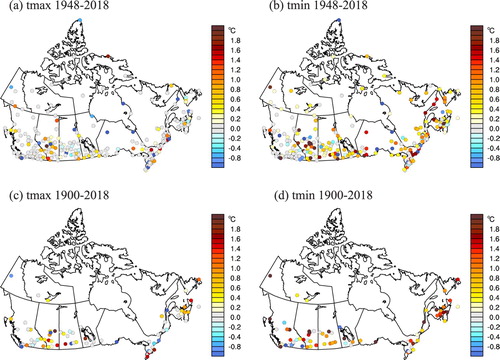
Trends in annual and seasonal means of tmax and tmin are obtained before and after adjustments at individual stations. A station’s trend is missing when more than 10% of consecutive years or more than 20% of random years are missing, where the percentage is calculated from the length of the analyzed period. The trends were computed at 250 (75) individual stations for the period 1948–2018 (1900–2018). The adjustments either “increase” the trend (the difference in the magnitude of the trends “after minus before adjustments” is positive) or “reduce” the trend (the difference in the magnitude of the trends is negative) at individual stations (). For 1948–2018, the adjustments increase the trends in the annual mean of tmax (tmin) at 18% (53%) of the stations while they reduce the trends at only 10% (12%) of the stations. During 1900–2018, the trends in the annual mean of tmax (tmin) increased at 38% (73%) of the stations, whereas they were reduced at 16% (11%) of the stations with the adjustments. Trends in the seasonal mean of tmax and tmin show similar results. Overall, more stations have an “increased” trend than a “reduced” trend with the adjustments, particularly for tmin and the longer 1900–2018 period. In other words, stronger warming is detected at many stations when the adjustments are applied, especially for tmin over the 1900–2018 period. Still, the difference between the trends shows a random pattern of changes (), and the adjustments have not artificially created regional warming.
Fig. 10 Difference in the magnitude of the trends (after minus before adjustment) in annual mean of tmax and tmin temperature for the two periods analyzed.
To investigate the causes of data inhomogeneity affecting the trends, the positive and negative adjustments for the stations reporting trends for the 1948–2018 and 1900–2018 periods are classified into six categories based on their cause (). The categories are defined as follows: change in observing time in 1961 (for tmin only); data joined to RCS sites; data joined to other sites (mainly airports and other agencies); relocation of the instruments; other causes identified (including changes in observers and surroundings); and no identified causes.
Fig. 11 Number of positive and negative adjustments for the stations reporting trends in (a) tmax for 1948–2018; (b) tmin for 1948–2018; (c) tmax for 1900–2018; and (d) tmin for 1900–2018, for six categories and four periods. The categories are change in observing time in 1961 (green); data joined to RCS sites (dark blue); data joined to other sites (light blue); relocation of the instruments (brown); other identified causes (grey); no identified causes (black).
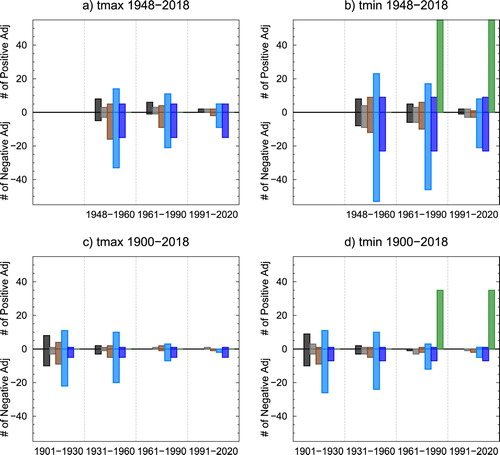
The main cause of data inhomogeneity affecting the trends for 1948–2018 and 1900–2018 is the change in observing time in July 1961. Adjustments were applied at principal stations to resolve the cold bias introduced in the annual and monthly means of the daily minimum temperatures after 1961 (green bars in b and 11d). Another important cause of data inhomogeneity affecting the trends is the merging of observations from airports to older sites (light blue bars in ). The instruments were often originally located in backyards near pavement and buildings with poor air exposure, and merging these observations to airport stations often created an artificial decreasing shift in the unadjusted data because of the better exposure of the instruments at airport stations. The adjustments resulting from these two main causes have generally accentuated the warming trend at individual stations.
Merging observations from RCS to older sites sometimes created a shift in the unadjusted temperature series because of the change in the instrument’s location (darks blue bars in ). No shift was detected as a result of joining observations to NavCan sites because the instruments remained at the same location and elevation, most of the time.
Some of the adjustments applied during the 1901–1930 period, classified as relocation, other causes, and no identified cause (brown, grey, and black bars in c and 11d), likely coincide with the introduction of the Stevenson screen. Original temperature screens were often mounted on an independent wall or on the north wall of a building, and they were gradually replaced by the Stevenson screen at the beginning of the twentieth century (Devine, Citation2006). It is very difficult to retrieve this information from the historical files, but it is sometimes possible to speculate on the replacement of the screen when old photos are available.
b Impact on Canada’s Trends (1948–2018)
Because stations recording temperature observations are not uniformly distributed across the country, with more stations in the south and fewer in the north, temperature data were interpolated to evenly spaced point locations for a better spatial assessment of the climate variations. Annual and seasonal temperature anomalies from the 1961–1990 reference period were first obtained at individual stations. They were then interpolated to 50 km–spaced grid points using Gandin’s Optimal Interpolation method (Alaka and Elvander, Citation1972; Bretherton et al., Citation1976; Gandin, Citation1965). The main prerequisite for a location to participate in the gridding process was having a 1961–1990 average. Therefore, the number of locations contributing to the gridding process increased from 338 locations (Second Generation) to 576 locations (Third Generation); however, most of the new contributing locations were found south of 60°N. The number of locations participating in the gridding process will increase if the reference period (here 1961–1990) changes (to 1981–2010 for example) because more locations, particularly in the North, have data over the more recent time period. Grid point values were averaged to produce a time series, at annual and seasonal resolution, representing the entire country for 1948–2018, and southern Canada (south of 60°N) for 1900–2018. A trend value was computed at each grid point and for the national and southern time series. The statistical significance of the trend was assessed at the 5% level.
The new homogenized data show warming across the country during the 1948–2018 period. Significant trends in annual mean temperature ranging from 1° to 3°C are found almost everywhere across the nation (a). The warming is more pronounced in the northern regions, especially in the Yukon, Northwest Territories, and western Nunavut, where trends greater than 3°C are observed in some areas over the past 71 years. The warming is slightly greater in the annual tmin than in the annual tmax, particularly in the western regions (figures not shown). Visually, the maps of temperature trends derived from the new homogenized data do not show strong differences from those produced from the unadjusted data (figures not shown). The national time series computed from the homogenized data exhibits considerable variability although a steady increase is observed from the beginning of the 1970s to the 2000s (b). This new homogenized dataset shows a slightly stronger warming in Canada compared with the unadjusted data, with an increase in annual mean temperature of 1.74°C for the 1948–2018 period, whereas an increase of 1.69°C was found in the unadjusted data (). The adjustments have slightly decreased the trend in annual tmax (from 1.62° to 1.58°C), whereas they have increased the trends in annual tmin (from 1.70° to 1.92°C) over the last 71 years.
Fig. 12 Trends in (a) annual mean of tmean for 1948–2018 (°C per 71 yr). Grid squares with trends statistically significant at the 5% level are marked with a dot. (b) Annual mean of tmean anomalies for Canada, 1948–2018. The red line indicates the anomalies before adjustment, and the black line is an 11 yr running mean.
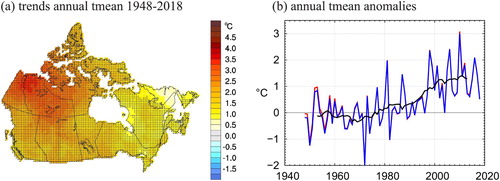
Table 2. Trends in annual and seasonal means of tmax, tmin, and tmean for Canada as a whole 1948–2018 (°C per 71 yr), and for southern Canada 1900–2018 (°C per 119 yr) before and after adjustments, respectively. The “y” (“n”) indicates a trend statistically significant (not significant) at the 5% level. Trends with a difference (after minus before adjustments) >0.2°C are in bold to highlight the greatest changes.
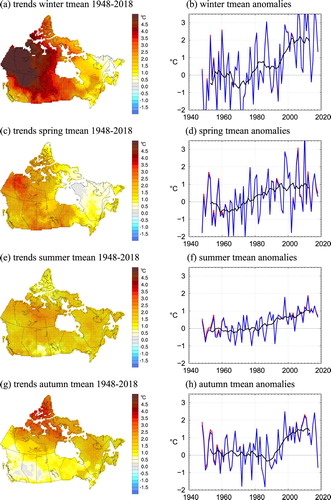
Seasonally, the greatest warming is experienced during the winter (). The winter warming trends are predominant in the western regions and the northern regions ranging from 4° to 6°C over the past 71 years in most areas. During the spring, the warming is less pronounced, but significant warming trends are also dominant over the western regions. Summer mean temperature has increased less than the winter and spring mean temperatures, but the magnitude of the warming is consistent across the country. In autumn, most of the warming is observed in the Arctic and northern Quebec. Here again, the maps of the seasonal trends derived from the homogenized data are not very different visually from those produced from the unadjusted data. Seasonal mean temperature anomalies averaged over Canada indicate significant increases of 3.30°, 1.56°, 1.45°, and 1.56°C from 1948 to 2018 for winter, spring, summer, and autumn, respectively (). The adjustments have slightly changed the magnitude of the seasonal trends and the greatest change is found in tmin. Annual and seasonal temperature trends and their spatial patterns across the country obtained over the 1948–2018 period produced from the Third Generation data are similar to those produced using the Second Generation data over a similar period 1948–2012 (Vincent et al., Citation2015).
Fig. 13 Trends in (a) winter, (c) spring, (e) summer, and (g) autumn tmean for 1948–2018 (°C per 71 yr). Grid squares with trends statistically significant at the 5% level are marked with a dot. Tmean anomalies for (b) winter, (d) spring, (f) summer, and (h) autumn for Canada, 1948–2018. The red line indicates the anomalies before adjustment, and the black line is an 11 yr running mean.
c Impact on Southern Canada’s Trends (1900–2018)
The new homogenized data show pronounced warming across southern Canada for the 1900–2018 period (). The warming is less evident in annual tmax, which indicates no significant increasing trends in some areas of the western provinces, as well as in Ontario and Quebec; it is more pronounced in annual tmin showing significant increasing trends of 1° to 3°C across the region. The adjustments have not considerably changed the spatial pattern of the trends (figures not presented here). The annual tmean averaged over southern Canada has increased by 1.62°C during the 1900–2018 period (). The adjustments have not changed the trend in annual tmax (about 1.0°C for 1900–2018), but the trend in annual tmin has changed from 1.68° to 2.29°C for the same period.
Fig. 14 Trends in annual mean of (a) tmax, (c) tmin, and (e) tmean for 1900–2018 (°C per 119 yr). Grid squares with trends statistically significant at the 5% level are marked with a dot. Annual mean of (b) tmax, (d) tmin, and (d) tmean anomalies for southern Canada, 1900–2018. The red line indicates the anomalies before adjustment, and the black line is an 11 yr running mean.
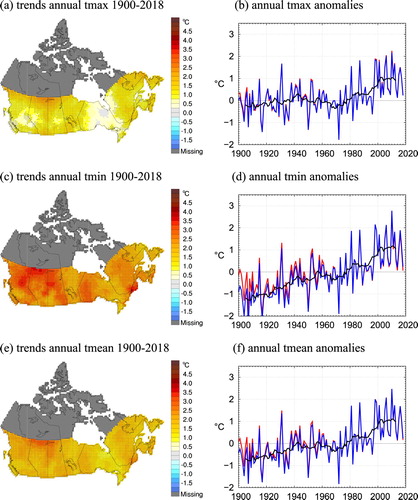
The adjustments have increased the trends in tmin by more than 0.2°C in every season over the past 119 years (). The greatest change in trends is found in the winter tmin (from 2.68° to 3.53°C after adjustment). As mentioned previously, the change in trends in annual and seasonal tmin is mainly a result of the adjustments for the change in observing time after 1961 and for the joining of observations from sites with poor air exposure to sites with better air exposure, effectively removing any insulating effects (meaning that the nights are generally colder at recent sites). As a result, the unadjusted annual tmin time series for southern Canada shows an obvious warm bias prior to 1970 (d). The spatial pattern of the temperature trends and the magnitude of the trends obtained over the 1900–2018 period with the Third Generation data are generally in agreement with the findings produced using the Second Generation data over a similar period 1900–2012 (Vincent et al., Citation2015).
4 Discussion
It is difficult to determine the exact cause of an artificial shift in temperature time series because it often corresponds to confounding changes occurring at the same time. For example, a relocation of the instruments, even a few metres away from the original site, often coincides with the screen being cleaned or repainted, new thermometers installed, observers reinstructed about practices, and different surroundings. The station’s history files, frequently based on inspectors’ reports, do not often document the changes occurring at the observing site but instead record the instruments used, location, observers, and surroundings on specific dates; some stations have only a few inspectors’ reports during their long record of observations. A combination of many causes can amplify or cancel their impact on daily temperature, and it becomes very difficult to classify the magnitude of the detected inhomogeneities by cause. In the current study, the cause of the detected shifts was mainly the result of a major change in the instrument’s exposure, often associated with a change in location and elevation.
Microclimatic inhomogeneities can also be introduced in temperature datasets as a result of growth or removal of surrounding vegetation, construction of roads and buildings, and maintenance of instruments and their shelters (Runnalls and Oke, Citation2006). Although these are a source of uncertainty in long-term temperature records, it is often difficult to properly detect microclimatic inhomogeneities because it requires the observations of a nearby and reliable neighbour station (no more than a few kilometres away and with no inhomogeneities) and detailed knowledge of the station’s history (often not available). In addition, the growth of surrounding vegetation or of a nearby town can introduce a gradual artificial trend in the temperature time series and not an artificial shift. More work is needed to develop procedures to properly detect and adjust these inhomogeneities when possible: these inhomogeneities were rarely recognized in the current work.
Automatic weather stations (electronic observing systems with sensors relating weather data to a data logger without human involvement) were widely introduced across the Canadian network from the early 1990s onward. In some cases, their introduction coincided with a station move and a period of parallel observations. Overall, no systematic biases were found as a result of automation as far as the instrumental systems were concerned. Based on a limited number of pair-sites, the Automatic Weather Observing Systems (AWOS) have shown slightly warmer temperatures, up to 0.2°C, because of the unaspirated Stevenson screen being cluttered with additional devices (Milewska and Hogg, Citation2002). At RCS sites, the largest bias came from matching the time of observations, while a small siting bias was due to differences in landscape, vegetation, and elevation when the sites were not exactly collocated (Milewska and Vincent, Citation2016). There is now less clutter on RCS screens and many have become aspirated (Ewa Milewska personal communication, 2018). Similar to Canada, the introduction of automated systems has not created a bias in temperature series in Australia (Trewin, Citation2013).
Homogenization of daily temperatures with regard to climate extremes is still an important topic for further studies. Several methods have been developed for adjusting not only the mean of a daily temperature time series but also its higher-order quantiles (Della-Marta and Wanner, Citation2006; Kuglitsch et al., Citation2009; Mestre et al., Citation2011; Toreti et al., Citation2010; Trewin, Citation2013). A recent study has indicated that the QM approach (Wang et al., Citation2014) can provide a good estimate of the adjustments when indices of extreme temperature are computed from homogenized daily values and the adjustments are based on highly correlated neighbours (Vincent et al., Citation2018b). An approach based on wavelet analysis has also demonstrated progress in quantifying daily temperature adjustments when dealing with climate extremes (Li et al., Citation2014; Yan and Jones, Citation2008). Nonetheless, more work is required to improve methodologies for the homogenization of daily temperature extremes.
5 Concluding remarks
The climate monitoring network in Canada has undergone considerable changes over its long history of recording observations. Many long-term observing stations were closed, and new sites were opened in isolated areas. The Third Generation Homogenized Temperature incorporates recent daily temperature observations made at RCS and NavCan stations. These data were used to continue in time the observations from older sites that had been operational longer in order to create long series for use in climate trend studies. Parallel observations were used, when available, to determine whether an artificial shift was created at the joining date when the observations from two sites were merged. Furthermore, the annual and seasonal time series for all stations were tested for homogeneity using neighbour observations as a reference series.
One of the main causes of data inhomogeneity affecting the trends over the 1948–2018 and 1900–2018 periods was the change in observing time in July 1961 at principal stations, which introduced a cold bias in the annual means of the daily minimum temperatures after 1961. Another important cause of data inhomogeneity affecting the trends corresponded to the merging of observations from airport stations to older records which often created an artificial decreasing shift in the unadjusted data because of the better exposure of the instruments at airport stations. The adjustments resulting from these two main causes have accentuated the warming trend at individual stations. Merging observations from older records with those from the RCS sites has created a shift in the unadjusted temperature series in fewer than 22% of the cases, often the result of differing instrument locations. This new homogenized dataset shows a slightly stronger warming in Canada and southern Canada than the unadjusted data. Because of the adjustments, the trend in the annual mean temperature in Canada has changed from 1.69° to 1.74°C for the 1948–2018 period, and the trend in southern Canada has changed from 1.32° to 1.62°C over the longer 1900–2018 period.
The homogenized daily temperatures from the Third Generation and Second Generation can be different at similar locations for three main reasons. First, merging observations from sites was carried out differently in the Third Generation to extend long records of daily data to recent time with the observations from the RCS and NavCan stations (if needed). Second, homogeneity testing was done over a longer period of time in the Third Generation which includes an additional 18 years of data: shifts could have been detected in the recent years and earlier data adjusted to correct these newly detected shifts. Third, the adjustments were derived from three neighbouring sites in the Third Generation instead of from the highest correlated site as done in the Second Generation. This was done in order to minimize the influence of outlying daily temperature values that can be found at an individual neighbour station. The most difficult task in homogeneity assessment is to choose the correct number of shifts and concurring dates because different neighbours frequently provide different changepoints. It was often necessary to compare the trends with the surrounding sites after adjustment over similar periods in order to gain some confidence in the adjustments. If the resulting trend was very different from those computed at surrounding sites then the number of shifts and concurring dates were re-assessed and adjustments were applied accordingly.
It is very important to document all adjustments made to the data and to preserve the original observations for a better understanding of the impact of the adjustments on various climate applications. Proper documentation is also crucial for assisting users’ understanding of the limitations of the datasets and to ensure accurate interpretation of the results derived from the data. In the current study, the impact of the data adjustments on the trends for 1948–2018 and 1900–2018 was examined in detail. More work is still needed to assess the impact on record daily high and low temperatures at individual stations and to make sure that the extremes are properly adjusted. The selection of the sites to be joined and joining dates was done following the best knowledge of the authors at the time of the study; however, these can be revised in the future to better integrate the experience of local climatologists and accommodate future changes in the climate network. The original and adjusted series along with the station list, sites joined including climate IDs and periods of time, and potential causes of the adjusted shifts (when known), are available from the authors and will be available on the Government of Canada’s Open Data Portal.
Acknowledgements
The authors would like to thank the internal reviewers Mark Barton, Marc Beauchemin, Bridget Thomas, Giselle Bramwell, and Pamela Lehr (MSC), as well as two anonymous reviewers, for their helpful comments and suggestions that have helped to improve the manuscript.
Disclosure statement
No potential conflict of interest was reported by the author(s).
References
- Alaka, M. A., & Elvander, R. C. (1972). Optimum interpolation from observations of mixed quality. Monthly Weather Review, 100(8), 612–624. https://doi.org/10.1175/1520-0493(1972)100<0612:OIFOOM>2.3.CO;2
- Blunden, J., Arndt, D. S., & Hartfield, G. (Eds.). (2018). State of the climate in 2017. Bulletin of the American Meteorological Society, 99(8), Si–S310. https://doi.org/10.1175/2018BAMSStateoftheClimate.1
- Bretherton, F. P., R. E. Davis, & B. Fandry (1976). A technique for objective analysis and design of oceanographic experiments applied to MODE-73. Deep Sea Research and Oceanographic Abstracts, 23(7), 559–582. https://doi.org/10.1016/0011-7471(76)90001-2.
- Bush, E. J., Loder, J. W., James, T. S., Mortsch, L. D., & Cohen, S. J. (2014). An overview of Canada’s changing climate. In F. J. Warren & D. S. Lemmen (Eds.), Canada in a changing climate: Sector perspectives on impacts and adaptation (pp. 23–64). Natural Resources Canada, Government of Canada.
- Collins, M., Knutti, R., Arblaster, J., Dufresne, J.-L., Fichefet, T., Friedlingstein, P., … Wehner, M. (2014). Long-term climate change: Projections, commitments and irreversibility. In T. F. Stocker, D. Qin, G.-K. Plattner, M. Tignor, S. K. Allen, J. Boschung, A. Nauels, Y. Xia, V. Bex, & P. M. Midgley (Eds.), Climate change 2013: The physical science basis. Contribution of Working Group I to the Fifth Assessment Report of the Intergovernmental Panel on Climate Change (pp. 1029–1136). Cambridge University Press. https://doi.org/10.1017/CBO9781107415324.024
- Della-Marta, P., & Wanner, H. (2006). A method of homogenizing the extremes and mean daily temperature measurements. Journal of Climate, 19(17), 4179–4197. https://doi.org/10.1175/JCLI3855.1
- Devine, K. A. (2006). The first fully louvred thermometer screen. CMOS Bulletin, 34(2), 43–44. http://cmosarchives.ca/Bulletin/b3402.pdf
- Donat, M. G., Alexander, L. V., Yang, H., Durre, I., Vose, R., Dunn, R. J. H., … Kitching, S. (2013). Updated analyses of temperature and precipitation extreme indices since the beginning of the twentieth century: The HadEX2 dataset. Journal of Geophysical Research: Atmospheres, 118(5), 2098–2118. https://doi.org/10.1002/jgrd.50150
- Environment and Climate Change Canada (ECCC). (2018a). Adjusted and Homogenized Canadian Climate Data (AHCCD). https://open.canada.ca/data/en/dataset/9c4ebc00-3ea4-4fe0-8bf2-66cfe1cddd1d
- Environment and Climate Change Canada (ECCC). (2018b). Canadian Gridded Temperature and Precipitation Anomalies CANGRD. https://open.canada.ca/data/en/dataset/3d4b68a5-13bc-48bb-ad10-801128aa6604
- Environment and Climate Change Canada (ECCC). (2018c). Climate trends and variations bulletin. https://www.canada.ca/en/environment-climate-change/services/climate-change/science-research-data/climate-trends-variability/trends-variations.html
- Environment Canada. (1995). A state of the environment report: The state of Canada’s climate: monitoring variability and change (SOE Report No. 95-1. ISBN 0-662-23061-2. Cat. No. En1-11/95-1E).
- Gandin, L. S. (1965). Objective analysis of meteorological fields [ Translated from the Russian]. Israel Program for Scientific Translations.
- Hopkinson, R. F., McKenney, D. W., Milewska, E. J., Hutchinson, M. F., Papadopol, P., & Vincent, L. A. (2011). Impact of aligning climatological day on gridding daily maximum-minimum temperature and precipitation over Canada. Journal of Applied Meteorology and Climatology, 50(8), 1654–1665. https://doi.org/10.1175/2011JAMC2684.1
- Kendall, M. G. (1955). Rank correlation methods (2nd ed.). Charles Griffin and Company.
- Kirtman, B., Power, S. B., Adedoyin, J. A., Boer, G. J., Bojariu, R., Camilloni, I., … Wang, H. J. (2013). Near-term climate change: Projections and predictability. In T. F. Stocker, D. Qin, G.-K. Plattner, M. Tignor, S. K. Allen, J. Boschung, A. Nauels, Y. Xia, V. Bex, & P. M. Midgley (Eds.), Climate change 2013: The physical science basis. Contribution of Working Group I to the Fifth Assessment Report of the Intergovernmental Panel on Climate Change (pp. 1029–1136). Cambridge University Press. https://doi.org/10.1017/ CBO9781107415324.024
- Kuglitsch, F. G., Toreti, A., Xoplaki, E., Della-Marta, P. M., Luterbacher, J., & Wanner, H. (2009). Homogenization of daily maximum temperature series in the Mediterranean. Journal of Geophysical Research, 114(D15), D15108. https://doi.org/10.1029/2008JD011606
- Li, Z., Yan, Z. W., Cao, L. J., & Jones, P. D. (2014). Adjusting inhomogeneous daily temperature variability using wavelet analysis. International Journal of Climatology, 34(4), 1196–1207. https://doi.org/10.1002/joc.3756
- Mestre, O., Gruber, C., Prieur, C., Caussinus, H., & Jourdain, S. (2011). SPLIDHOM: A method for homogenization of daily temperature observations. Journal of Applied Meteorology and Climatology, 50(11), 2343–2358. https://doi.org/10.1175/2011JAMC2641.1
- Milewska, E., & Hogg, W. D. (2001). Spatial representativeness of a long-term climate network in Canada. Atmosphere–Ocean, 39, 145–161. https://doi.org/10.1080/07055900.2001.9649671
- Milewska, E., & Hogg, W. D. (2002). Continuity of climatological observations with automation – Temperature and precipitation amounts from AWOS (Automated Weather Observing System). Atmosphere-Ocean, 40(3), 333–359. https://doi.org/10.3137/ao.400304
- Milewska, E. J., & Vincent, L. A. (2016). Preserving continuity of long-term daily maximum and minimum temperature observations with automation of reference climate stations using overlapping data and meteorological conditions. Atmosphere-Ocean, 54(1), 32–47. https://doi.org/10.1080/07055900.2015.1135784
- Runnalls, K. E., & Oke, T. R. (2006). A technique to detect microclimatic inhomogeneities in historical records of screen-level air temperature. Journal of Climate, 19(6), 959–978. https://doi.org/10.1175/JCLI3663.1
- Sen, P. K. (1968). Estimates of the regression coefficient based on Kendall’s tau. Journal of the American Statistical Association, 63(324), 1379–1389. https://doi.org/10.1080/01621459.1968.10480934
- Toreti, A., Kuglitsch, F. G., Xoplaki, E., Luterbacher, J., & Wanner, H. (2010). A novel method for the homogenization of daily temperature series and its relevance for climate change analysis. Journal of Climate, 23(19), 5325–5331. https://doi.org/10.1175/2010JCLI3499.1
- Trewin, B. (2013). A daily homogenized temperature data set for Australia. International Journal of Climatology, 33(6), 1510–1529. https://doi.org/10.1002/joc.3530
- Vincent, L. A. (1998). A technique for the identification of inhomogeneities in Canadian temperature series. Journal of Climate, 11(5), 1094–1104. https://doi.org/10.1175/1520-0442(1998)011<1094:ATFTIO>2.0.CO;2
- Vincent, L. A., & Gullett, D. W. (1999). Canadian historical and homogeneous temperature datasets for climate change analyses. International Journal of Climatology, 19(12), 1375–1388. https://doi.org/10.1002/(SICI)1097-0088(199910)19:12<1375::AID-JOC427>3.0.CO;2-0
- Vincent, L. A., & Mekis, É. (2006). Changes in daily and extreme temperature and precipitation indices for Canada over the twentieth century. Atmosphere-Ocean, 44(2), 177–193. https://doi.org/10.3137/ao.440205
- Vincent, L. A., Milewska, E. J., Hopkinson, R., & Malone, L. (2009). Bias in minimum temperature introduced by a redefinition of the climatological day at the Canadian synoptic stations. Journal of Applied Meteorology and Climatology, 48(10), 2160–2168. https://doi.org/10.1175/2009JAMC2191.1
- Vincent, L. A., Milewska, E. J., Wang, X. L., & Hartwell, M. M. (2018b). Uncertainty in homogenized daily temperatures and derived indices of extremes illustrated using parallel observations in Canada. International Journal of Climatology, 38(2), 692–707. https://doi.org/10.1002/joc.5203
- Vincent, L. A., Wang, X. L., Milewska, E. J., Wan, H., Yang, F., & Swail, V. (2012). A second generation of homogenized Canadian monthly surface air temperature for climate trend analysis. Journal of Geophysical Research: Atmospheres, 117, D18110. https://doi.org/10.1029/2012JD017859
- Vincent, L. A., Zhang, X., Bonsal, B. R., & Hogg, W. D. (2002). Homogenization of daily temperatures over Canada. Journal of Climate, 15(11), 1322–1334. https://doi.org/10.1175/1520-0442(2002)015<1322:HODTOC>2.0.CO;2
- Vincent, L. A., Zhang, X., Brown, R. D., Feng, Y., Mekis, É, Milewska, E. J., … Wang, X. L. (2015). Observed trends in Canada’s climate and influence of low-frequency variability modes. Journal of Climate, 28(11), 4545–4560. https://doi.org/10.1175/JCLI-D-14-00697.1
- Vincent, L. A., Zhang, X., Mekis, É, Wan, H., & Bush, E. J. (2018a). Changes in Canada’s climate: Trends in indices based on daily temperature and precipitation data. Atmosphere-Ocean, 56(5), 332–349. https://doi.org/10.1080/07055900.2018.1514579
- Wang, X. L. (2008). Accounting for autocorrelation in detecting mean-shifts in climate data series using the penalized maximal t or F test. Journal of Applied Meteorology and Climatology, 47(9), 2423–2444. https://doi.org/10.1175/2008JAMC1741.1
- Wang, X. L., Chen, H., Wu, Y., Feng, Y., & Pu, Q. (2010). New techniques for detection and adjustment of shifts in daily precipitation data series. Journal of Applied Meteorology and Climatology, 49(12), 2416–2436. https://doi.org/10.1175/2010JAMC2376.1
- Wang, X. L., & Feng, Y. (2009). RHtestsV4 user manual. Climate Research Division, Science and Technology Branch, Environment and Climate Change Canada, Toronto, Canada. http://etccdi.pacificclimate.org/RHtest/RHtestsV4_UserManual_10Dec2014.pdf
- Wang, X. L., Feng, Y., & Vincent, L. A. (2014). Observed changes in one-in-20 year extremes of Canadian surface air temperatures. Atmosphere-Ocean, 52(3), 222–231. https://doi.org/10.1080/07055900.2013.818526
- Wang, X. L., Wan, H., & Swail, V. R. (2006). Observed changes in cyclone activity in Canada and their relationships to major circulation regimes. Journal of Climate, 19(6), 896–915. https://doi.org/10.1175/JCLI3664.1
- Wang, X. L., Wen, Q. H., & Wu, Y. (2007). Penalized maximal t test for detecting undocumented mean change in climate data series. Journal of Applied Meteorology and Climatology, 46(6), 916–931. https://doi.org/10.1175/JAM2504.1
- World Meteorological Organization (WMO). (1986). Guidelines on the selection of Reference Climatological Stations (RCSs) from the existing climatological station network (WCP- 116, WMO/TD-No. 130). World Climate Programme series.
- World Meteorological Organization (WMO). (1993). Report of the experts meeting on Reference Climatological Stations (RCS) and National Climate Data Catalogues (NCC) (WCDMP-No. 23, WMO-TD No. 535). World Climate Data and Monitoring Programme series.
- World Meteorological Organization (WMO). (2018). WMO statement on the state of the global climate in 2017 (WMO-No. 1212, ISBN 978-92-63-11212-5). https://www.abc.net.au/cm/lb/10378648/data/wmo-2017-state-of-climate-data.pdf
- Yan, Z. W., & Jones, P. D. (2008). Detecting inhomogeneity in daily climate series using wavelet analysis. Advances in Atmospheric Sciences, 25(2), 157–163. https://doi.org/10.1007/s00376-008-0157-7
- Zhang, X., Vincent, L. A., Hogg, W. D., & Niitsoo, A. (2000). Temperature and precipitation trends in Canada during the 20th century. Atmosphere-Ocean, 38(3), 395–429. https://doi.org/10.1080/07055900.2000.9649654