
 ?Mathematical formulae have been encoded as MathML and are displayed in this HTML version using MathJax in order to improve their display. Uncheck the box to turn MathJax off. This feature requires Javascript. Click on a formula to zoom.
ABSTRACT
Intra-annual and decadal observations of snow depth on sea ice and on terrestrial land are examined within the Canadian Arctic. In situ snow depth measurements at 11 study sites spanning 1955–2019 form the basis of the analysis. Ice chart data acquired via the Canadian Ice Service are used to establish sea ice break-up and freeze-up dates and assess their impact on snow depth evolution. We find that on-ice and on-land snow accumulation in autumn differ due to the lag between the freeze-up and the first snow of the season. Once sea ice consolidates, on-ice and on-land snow depth become positively correlated in winter (p < 0.05). The mean seasonal rate of snow accumulation on sea ice from September to April is 3.2 ± 0.6 cm month−1 across the Canadian Arctic. Snow depth on terrestrial land is generally higher than on sea ice in the southern Canadian Arctic by up to 20–30 cm; but snow depth on sea ice tends to exceed that on land in the northern Canadian Arctic from winter to spring. Four sites (Eureka, Resolute, Cambridge Bay and Hall Beach) with continuous long-term records are selected for interannual analysis. Decadal trends in on-ice snow depth are mostly negative from autumn to spring. Autumn and spring snowfall have increased at three of the four sites. The Canadian Arctic experiences warming on a decadal scale, especially in autumn, by 0.5 to 0.8°C decade−1. Sea ice freeze-up is delayed by up to 2.5 days decade−1 in the southern Canadian Arctic, whereas break-up occurs earlier by about 3 days decade−1 in the northern Canadian Arctic.
RÉSUMÉ
[Traduit par la redaction] Les observations intra-annuelles et décennales de l’épaisseur de la neige sur la glace de mer et sur les terres terrestres sont examinées dans l’Arctique canadien. Les mesures in situ de l’épaisseur de la neige sur 11 sites d’étude, de 1955 à 2019, constituent la base de l’analyse. Les données des cartes des glaces acquises par le Service canadien des glaces servent à établir les dates de débâcle et de gel de la glace de mer et évaluer leur impact sur l’évolution de l’épaisseur de la neige. Nous constatons que l’accumulation de neige sur glace et sur terre en automne diffère en raison du décalage entre le gel et la première neige de la saison. Une fois que la glace de mer se consolide, l’épaisseur de la neige sur glace et sur terre devient positivement corrélée en hiver (p < 0,05). Le taux saisonnier moyen d’accumulation de neige sur la glace de mer de septembre à avril atteint ±3,2 0,6 cm par mois−1 dans l’ensemble de l’Arctique canadien. L’épaisseur de la neige sur les terres est généralement plus élevée que sur la glace de mer dans le sud de l’Arctique canadien, jusqu’à 20 à 30 cm; mais l’épaisseur de la neige sur la glace de mer a tendance à dépasser celle des terres dans le nord de l’Arctique canadien de l’hiver au printemps. Quatre sites (Eureka, Resolute, Cambridge Bay et Hall Beach) avec des enregistrements continus à long terme sont sélectionnés pour une analyse interannuelle. Les tendances décennales de l’épaisseur de neige sur la glace sont principalement négatives de l’automne au printemps. Les chutes de neige en automne et au printemps ont augmenté sur trois des quatre sites. L’Arctique canadien connaît un réchauffement à l’échelle décennale, surtout en automne, de 0,5 à 0,8°C par décennie−1. Le gel de la glace de mer est retardé jusqu’à 2,5 jours par décennie−1 dans le sud de l’Arctique canadien, tandis que la débâcle se produit plus tôt, d’environ 3 jours par décenniee−1, dans le nord de l’Arctique canadien.
1 Introduction
The snow cover on sea ice is an important physical parameter largely controlling sea ice thickness, growth, and melt rates. In the winter accumulation season, the snow cover undergoes extensive snow grain metamorphism which acts to increasingly insulate the sea ice from the cold atmosphere, hindering thermodynamic sea ice growth due to the low thermal conductivity of snow (Holtsmark, Citation1955; Ledley, Citation1991). Snow accumulation and thickness distribution on sea ice is controlled by ice type and surface roughness, and meteorological events such as storm driven precipitation and wind redistribution (Iacozza & Barber, Citation2010; Sturm et al., Citation2002; Sturm & Massom, Citation2016; Webster et al., Citation2019). Rain-on-snow and freeze–thaw events are highly variable over space and time and can significantly alter the thermodynamic, optical and microwave properties of the snow cover (Colbeck, Citation1991; Dolant et al., Citation2018). In spring, the snow cover acts to delay sea ice melt by insulating the ice from the warm atmosphere by preventing much of the incoming short-wave radiation from entering the ice volume due to its high albedo (Perovich et al., Citation2002). Eventually, melt ponds form on the surface which act to significantly reduce the surface albedo, depending on the areal fraction, which is largely dictated by snow depth and melt rate (Holt & Digby, Citation1985; Petrich et al., Citation2012; Polashenski et al., Citation2012; Yackel et al., Citation2007). This link between the snow cover and melt ponded sea ice is important because melt ponds are associated with reduced sea ice mechanical strength and increased break-up potential (Landy et al., Citation2014) and with the summertime minimum sea ice extent prediction in the Arctic (Howell et al., Citation2020; Schröder et al., Citation2014).
The Warren et al. (Citation1999) snow climatology has been viewed as the benchmark observational dataset of basin-scale snow depth distributions on Arctic sea ice. It was derived from observations collected at drifting Russian established measurement stations on multiyear ice (MYI) in the Arctic Ocean over the period 1954–1991. Since then, snow depth on Arctic sea ice has been monitored by field expeditions that are often location-specific and temporally limited due to logistical and financial constraints (Gerland & Haas, Citation2011; Haas et al., Citation2017; Shalina & Sandven, Citation2018). Climate models and satellite remote sensing provide alternative ways to continuously monitor snow across vast spatial regions, although validation with in-situ measurement is necessary (Webster et al., Citation2014). Using the Coupled Model Intercomparison Project 5 (CMIP5), Hezel et al. (Citation2012) found that due to loss of sea ice area in autumn, snow accumulation on sea ice is expected to be delayed by three months by the end of the twenty-first century and spring snow depth on sea ice north of 70°N will decrease by 12 cm. Snow depth decline on Arctic sea ice in spring was also observed by Webster et al. (Citation2014), which compared airborne radar data from NASA’s Operation IceBridge from 2009 to 2013 with archival data from drifting ice stations that predates 1990s. They found that the thinning of snow on sea ice correlated with the delayed sea ice freeze-up in autumn. In the Canadian Arctic Archipelago (CAA), studies have shown that there is a shift towards increasing first-year ice (FYI) fraction and that summer sea ice extent is declining (Howell et al., Citation2015; Mudryk et al., Citation2018; Tivy et al., Citation2011).
Within the CAA, most of the sea ice becomes landfast in the early winter season, with most of the CAA fasted by November or December. Landfast ice thickness and snow depth measurements on the sea ice have been made regularly for more than 60 years at several coastal stations. These data are quality controlled and archived at the Canadian Ice Service (CIS) and represent one of the few available sources of continuous snow depth and ice thickness measurements in the Arctic. Brown and Cote (Citation1992) used this dataset to examine the interannual variability of maximum (end-of-winter) landfast ice thickness and associated snow depth at four sites in the CAA from 1957 to 1989 and found that the insulating role of snow cover explains 30–60% of the variance in maximum ice thickness. Complimentary studies were presented by Flato and Brown (Citation1996) and Gough et al. (Citation2004). Using the same dataset, Howell et al. (Citation2016) summarized the interannual trend of maximum landfast ice thickness and found that the amount and timing of snow accumulation, rather than warming air temperature, controlled the interannual variability of maximum landfast ice thickness. Melling (Citation2002) pointed out the snow depth measured on MYI northwest of the Sverdrup Basin from 1954 to 1991 is higher than measured on adjacent land areas of the Queen Elizabeth Islands from 1955 to 1972 by 15–20 cm, and suggested that the most probable reason is a difference between the accumulations of snow on land and sea ice surfaces in the Arctic, and concluded that the snow depth on Sverdrup Basin ice does not differ greatly from that on old ice in the Canada Basin.
This study extends the spatial coverage slightly beyond the geographic boundary of the CAA but still within the Canadian Arctic to identify if such difference between on-ice and on-land snow accumulation can be observed. Documenting the trends and differences of in-situ on-ice and on-land snow depth in the Canadian Arctic will provide context for verifying regional climate models and remote sensing estimates, which are sometimes unable to resolve the waterways and inlets from the land masses due to their coarse spatial resolution, and thus may not provide valid estimates for the region. Retrievals of trend and variability of sea ice thickness from satellite altimetric measurements are also sensitive to the variability of snow depth on sea ice (Mallett et al., Citation2021). By comparing on-ice snow depth with its on-land counterpart, we seek answers to the following questions: (1) how are the seasonal trends of snow depth in the Canadian Arctic different on land from sea ice? (2) what are the regional variabilities of on-ice and on-land snow depths within the Canadian Arctic? (3) what are the dominant variables that control snow depth on land and on sea ice?
To answer these questions, we use observational data to investigate the spatial and temporal differences between on-ice and on-land snow accumulation in the Canadian Arctic. We investigate the influence of snowfall, rainfall, air temperature, and sea ice freeze-up on the variability of on-ice and on-land snow depth through an examination of their multiyear associations. Finally, we compare the spatio-temporal characteristics of on-ice and on-land snow depths within the Canadian Arctic with other pan-Arctic observations.
2 Data and methods
In the context of this study, on-ice and on-land snow depths refer to the snow depths measured on landfast sea ice and on terrestrial ground, respectively, near 11 Environment and Climate Change Canada (ECCC) weather station sites, hereafter referred to as the study sites. The additional variables investigated are snowfall, rainfall, air temperature, and sea ice break-up and freeze-up dates.
a Study Sites
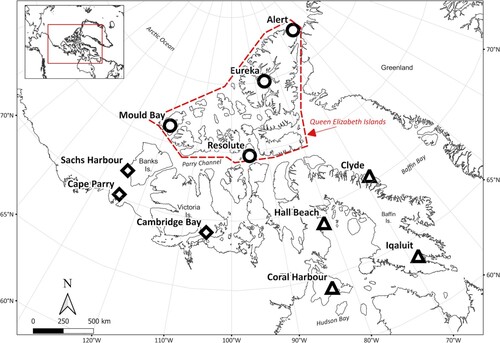
Eleven sites in the Canadian Arctic are included in the analysis of spatial and temporal variability of on-ice and on-land snow depths, snowfall, rainfall and freeze-up. The sites are classified into three sub-regions: the northern region, the southwest (SW) region, and the southeast (SE) region (). The Northern region contains sites in the islands north of the Parry Channel collectively known as Queen Elizabeth Islands (QEI). South of the Parry Channel, the SW region contains the sites Sachs Harbour, Cape Parry, and Cambridge Bay. The SE region contains the sites Clyde, Hall Beach, Coral Harbour, and Iqaluit.
Fig. 1 Study area and the locations of the 11 study sites. Northern sites are denoted by circles; southeastern sites by triangles; and southwestern sites by diamonds. Islands north of the Parry Channel (bounded by red dashed line in the main map) are collectively known as the Queen Elizabeth Islands (QEI).
b Snow Depth
In-situ on-ice snow depth measurements have been made regularly at proximal sites near coastal Arctic weather stations across Canada beginning as early as the 1950s for the first established stations (Eureka and Resolute), as part of ECCC’s Ice Thickness Program. The length of data record varies from station to station, with more than 50 years of observations available at some stations. Generally, weekly on-ice measurements are made after freeze-up when it is safe to walk on the ice, reported to the nearest centimeter, at approximately the same location every year and continue until break-up or when the ice conditions become unsafe. The sampling location is selected close to shore, but over a depth of water which will exceed the maximum ice thickness. The exact position of the sampling locations was not recorded. Further details of this dataset are provided in Brown and Cote (Citation1992) and Howell et al. (Citation2016). The dataset is archived by CIS and is available at https://ice-glaces.ec.gc.ca/ (See “Ice thickness Data” under Archive; accessed on August 1, 2020). In the Ice Thickness Program, sampling sites are operative with variable timespans. Canadian Arctic coastal sites with a record length of at least 30 years are selected for this study (). The weekly measurements are averaged to obtain monthly values.
Table 1. Data availability at the study sites.
On-land snow depth has been measured daily at the ECCC weather stations since the 1950s. The dataset is available at https://climate.weather.gc.ca (Under Historical Data; accessed on 1 August 2020). At the time of the observation, snow depth on terrestrial ground is determined in whole centimeters by making a series of measurements and taking the average. Trace amount of snow is flagged and is reported as zero snow depth (Environment and Climate Change Canada, Citation2020). In this study, mean monthly on-land snow depth is calculated from the daily snow depth on ground dataset. Of interest is the difference between on-land snow depth and adjacent on-ice snow depth
. The difference is expressed as
. Therefore, a positive (negative)
means that the on-land snow depth is higher (lower) than the on-ice snow depth.
c Precipitation
As part of the Adjusted and Homogenized Canadian Climate Data (AHCCD), the second generation of Adjusted Precipitation for Canada (APC2) dataset provides adjusted daily snowfall (in mm of water equivalent) and rainfall (in mm) for over 450 locations in Canada (Mekis & Vincent, Citation2011; Wang et al., Citation2017). In the most recent update, these homogenized data series are available over most of the Canadian Arctic from the mid-1940s to 2017. For snowfall, density corrections were applied to all snow ruler measurements based on coincident ruler and Nipher snow gauge measurements (Mekis & Brown, Citation2010). For rainfall, corrections for wind undercatch, evaporation, and gauge specific wetting losses were made based on the rain gauge type (Devine & Mekis, Citation2008; Metcalfe et al., Citation1997). Trace amounts of daily precipitation (below a minimum measurable amount) can accumulate and become significant, especially in the Canadian Arctic where precipitation amounts are low. They were set to a value of zero in the original measurement records and adjustments (0.1 mm for rainfall and 0.03 to 0.07 mm for snowfall) were made depending on the location of the station (Mekis & Vincent, Citation2011). When a station had been relocated, nearby observations were combined to create longer time series. Adjustments were applied based on a simple ratio computed using available periods of overlapping data (Vincent & Mekis, Citation2009).
In APC2, monthly snowfall and rainfall at a station is calculated by summing its daily snow ruler and rain gauge measurements over the month. A monthly value is missing if more than 3 consecutive days or more than 5 days in total are missing in the month. For our study sites, the missing months generally consist of less than 1% of their respective temporal range, with the exception of Iqaluit and Mould Bay, where 4–6% of the monthly data are missing. Monthly snowfall and rainfall at the 11 study sites are used to calculate intra-annual and interannual trends.
d Surface Air Temperature
As part of the AHCCD, the third generation of Homogenized Temperature dataset contains monthly, seasonal and annual means of daily maximum, minimum and mean surface air temperatures at 780 locations across Canada (Vincent et al., Citation2020). These homogenized data are available for the Canadian Arctic from the mid-1940s to 2019. In the homogenization procedure, concurrent daily data were used to detect non-climatic shifts when nearby observations were merged. If a shift in the data was observed at one station, but not at nearby stations, it is possible that the shift may be due to non-climatic causes. Once a shift has been identified, station metadata is used to identify what may have caused the shift, and what corrective measure should be applied. Further detailed procedures are described in Vincent et al. (Citation2020).
e Sea Ice Freeze-Up, Break-Up, and Onsets of Snow Accumulation
Weekly regional ice charts archived at CIS were evaluated to determine the annual freeze-up and break-up. At each study site, the total ice concentration is represented by its value on the ice charts at the adjacent offshore polygon. In this study, break-up is defined as the first occurrence of sub-80% ice concentration at the site in a year, whereas freeze-up is determined as the last occurrence of sub-80% ice concentration in a year, in order to account for ice dynamics prevalent in the Canadian Arctic during the summer season. The time span from break-up to freeze-up is defined as the open water period. Weekly CIS ice charts are valid for the week they are issued; therefore, break-up and freeze-up dates are subjected to an uncertainty of a week (±7 days). In the case that the ice concentration near a site remains consistently above (below) 80% throughout a year, the break-up and freeze-up dates are invalid and the site is considered to be completely ice-covered (ice-free) in that year.
While there has yet to be standardized ice concentration thresholds for sea ice break-up and freeze-up, the 80% threshold has been used by the U.S. National Ice Center to distinguish marginal ice zone and pack ice and by Markus et al. (Citation2009) to determine freeze-up and melt from satellite imagery in the Arctic. We use 80% ice concentration as a threshold to distinguish between mobile and consolidated ice regimes, instead of a lower ice concentration threshold (e.g., 50%). As one of the main foci of this study is on the differences in on-ice and on-land snow accumulation, we find the 80% threshold suitable for establishing the conditions for snow accumulation on ice, while limiting the effect of ice mobility that would be significant if a lower threshold is used. Since on-ice snow depth was only measured once the ice had consolidated and thickened to the extent for safe walking, the actual onset of on-ice snow accumulation (which can occur when the ice has formed a thin floating film) may occur prior to the first on-ice snow depth measurement and be closer in time to freeze-up. Therefore, the annual freeze-up date retrieved from the ice charts is estimated to be the onset of on-ice snow accumulation in this study. We acknowledge that the ice type at freeze-up can be new ice (<10 cm thick). However, Toyota et al. (Citation2020) found that ice as thin as 2 mm can act as collector of snow particles. Moreover, Gow et al. (Citation1990) observed that ice in a freezing lead can grow rapidly in its initial stage by 15 cm in 4 days. Therefore, we assume any ice type detected by our 80% threshold will thicken and be able to collect snowfall within the week that the corresponding ice chart is valid for.
On-land snow depth is measured continuously throughout the year, so its first non-zero measurement at a study site since August 1 is taken as the onset of on-land snow accumulation of the year, which will be referred to as snow-on in this study.
f Trend and Correlation Analysis
Four sites are selected for interannual trend and correlation analysis: Eureka and Resolute in the northern region, and Cambridge Bay and Hall Beach in the SW and SE regions, respectively. Our preferences for choosing the sites are based on the temporal range and the availability of recent records for the following dataset in descending priority: (1) on-ice and on-land snow depths; (2) precipitation (snowfall and rainfall) and temperature; and (3) ice charts (for estimating break-up and freeze-up dates) (). Interannual trends are calculated for the time series of on-ice and on-land snow depths, snowfall, rainfall and air temperature for each season at the four sites.
Following conventions in climate studies, seasons are defined as winter (December of the previous year to February of the current year), spring (March-May), summer (June-August), and autumn (September-November). The Theil-Sen approach (TSA) is used to compute the interannual trends for the available years since 1960 for each season. TSA is a non-parametric slope estimator that is less affected by outliers and extreme values in a time series than the least-squared method, thus providing a more robust estimate of the trend (Sen, Citation1968). TSA estimates the slope (β) by taking the median of the slopes obtained from all possible pairs of data points in the time series, where Y is the variable being tested for the trend and t is time, for all i and j pairs in the time series. Since TSA does not estimate the statistical significance of the trend, the non-parametric Mann-Kendall (MK) test is used to compute the statistical significance of the trends. The MK test determines if a monotonic trend exists in a time series, using the Kendall’s statistic
, where S is the sum of the signs of the slopes of all possible pairs Yi and Yj in the time series, and n is the length of the series (Kendall & Gibbons, Citation1990). Kendall’s tau correlation coefficient can be computed by
. For time series longer than 10 pairs of data points, a normal approximation is performed on S under the null hypothesis of no trend. This allows p-values to be calculated for the significance of the trend against the critical values of a standard normal distribution (Helsel & Hirsch, Citation1992). The MK test does not require the assumption of normality in the observations and is not affected by missing values, as pairs with missing values will not be included in the calculation of S. However, no serial correlation should exist in the time series in order to compute valid p-values (Helsel & Hirsch, Citation1992).
Correlation analysis is done on selected pairs of variables at the four sites (). Prior to evaluating the correlation between two variables, their time series for each season are detrended by subtracting the TSA slope from the original data. This is done to ensure any relations between two time series will be driven by variability in the parameters instead of a shared trend. The Kendall rank correlation was computed for the detrended multiyear time series for each season. A similar approach can be found in Zhang et al. (Citation2000) for trend analysis of precipitation and temperature data in Canada. Since missing data may exist in the datasets, particularly in but not limited to the summer months, the correlation coefficient is computed at a site only if there are at least 10 years of data for both variables, for a given season. Throughout this paper, statistical significance of the correlations is evaluated at the 95% confidence level.
3 Results and discussion
a Trends and Variability
1 Snow depth
The monthly on-ice and on-land snow depths at the sites are illustrated in as multiyear averages. Snow is present on land from September to June at all study sites. On ice, snow is recorded starting September in the north, whereas the record starts in either September or October in the south. The highest snow depths are recorded in May; on-land snow depth is the highest at the southeastern sites, up to above 50 cm at Clyde, whereas on-ice snow depth is the highest at the northern sites, up to above 40 cm at Resolute and Mould Bay.
Fig. 2 Seasonal on-ice (dark circles) and on-land (light triangles) snow depth. m and R2 on the plots refer respectively to the slope and coefficient of determination of on-ice snow depth (red dashed-lines) from September to April, excluding unavailable months. Titles of the plots indicate the sites; the left column contains the four northern sites, the middle column contains the four southeastern sites, and the right column contains the three southwestern sites. Error bars show the standard deviation in snow depth from multiyear measurements in each month.
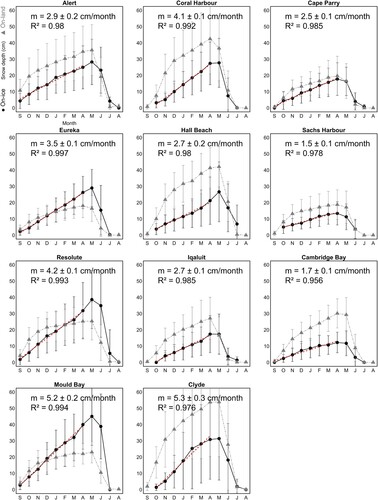
The amount of snowfall is only measured at the on-land sampling locations, but not on sea ice. Since the on-ice and on-land sampling locations are nearby, it is reasonable to assume that the snowfall received at both locations at a given study sites are similar. However, the accumulation rates and profiles of on-ice and on-land snow depth are notably different. On-land snow depths exhibit a similar accumulation pattern among all sites: rapid accumulation between September and November, followed by a more gradual linear increase from November to April. In contrast, the increase in on-ice snow depth is approximately linear from September to April. Both on-ice and on-land snow depths decline rapidly with the onset of snow melt, starting from April at the southwestern sites and May at the northern and southeastern sites. On-ice snow depth increases by 3.2 ± 0.6 cm month−1 between September and April on average for all the 11 study sites in the Canadian Arctic.
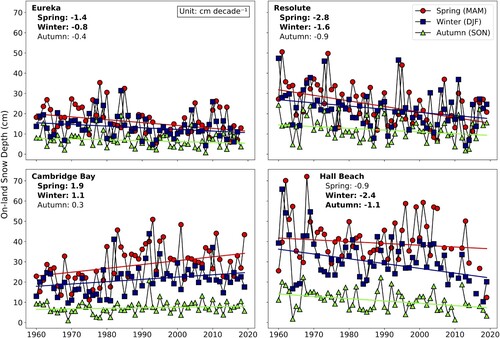
Interannual on-ice snow depth has generally been decreasing at the four select sites but is only statistically significant at Resolute in autumn (). On-land snow depth has also been decreasing at Eureka, Resolute, and Hall Beach in each season (some significant; see ); whereas, at Cambridge Bay, on-land snow depth has significantly increased by 1.1 cm decade−1 in winter and 1.9 cm decade−1 in spring.
Fig. 3 Interannual variability of on-ice snow depth by season (autumn, winter, and spring) at four sites within the Canadian Arctic. Trends are reported in centimeters per decade. Bold values indicate significance at 95% confidence level.
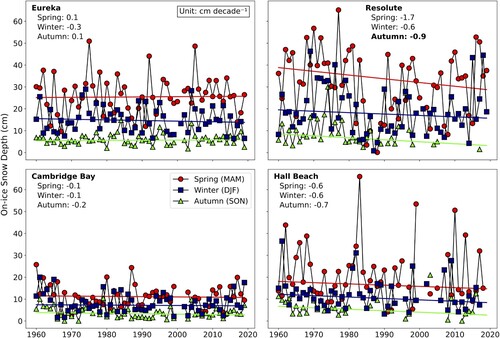
Fig. 4 Interannual variability of on-land snow depth by season (autumn, winter, and spring) at four sites within the Canadian Arctic. Trends are reported in centimeters per decade. Bold values indicate significance at 95% confidence level.
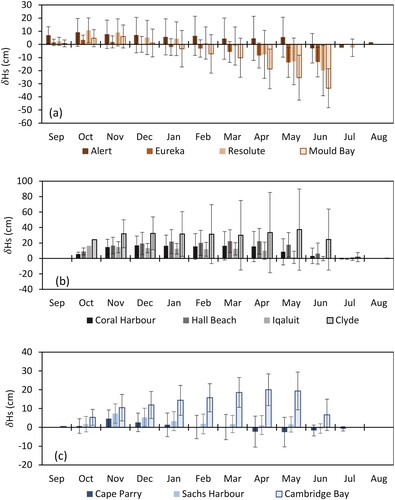
On-land to on-ice snow depth difference shows variable seasonal characteristics across the Canadian Arctic (). In the south,
is positive from September to March, and remains so for the rest of the year with typical values between +10 to +30 cm during winter and spring, except at Cape Parry where it is slightly negative from April to July (b,c). In the north, on-ice snow depth is more similar to and sometimes exceeds on-land snow depth, as
is within +10 cm prior to December and shifts toward negative values stating January, except at Alert.
Fig. 5 Difference δHs (cm) between monthly on-land snow depth and monthly on-ice snow depth at the (a) northern; (b) southeastern; and (c) southwestern sites. δHs is calculated by , where
is the on-land snow depth and
is the adjacent on-ice snow depth. Error bars show the multiyear standard deviation of δHs for a calendar month. Note the difference in the vertical scales.
2 Precipitation
Across the Canadian Arctic, snowfall is higher in autumn and late spring compared to winter (). Rainfall typically occurs between June and September in the north and between May and October in the south (). Precipitation is generally the highest in the southeast due to the availability of moisture from the Atlantic Ocean and the lowest in the northern region. Precipitation is often in the mixed form of rain and snow between late spring and early autumn due to warmer air temperature. Particularly, when these rain-on-snow events occur in September and October, during the time when snow first starts to accumulate on sea ice, superimposed layers of snow-ice can form and ice growth at the top of sea ice can occur, both leading to lower on-ice snow depth with respect to on-land snow depth as seen in .
Fig. 6 Monthly snowfall (mm of water equivalent) at the (a) northern; (b) southeastern; and (c) southwestern sites. Error bars show the multiyear standard deviation of snowfall for a calendar month.
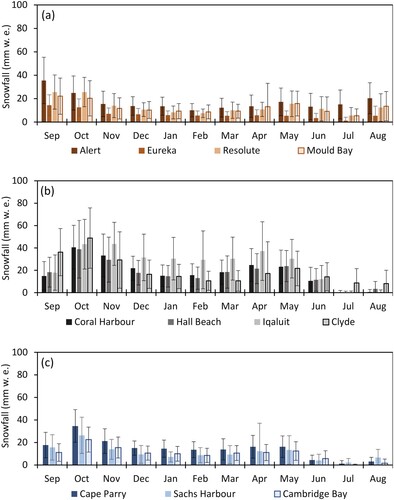
Fig. 7 Monthly rainfall (mm) at the (a) northern; (b) southeastern; and (c) southwestern sites. Error bars show the multiyear standard deviation of rainfall for a calendar month.
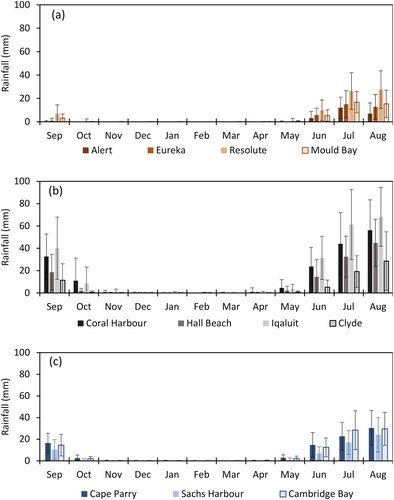
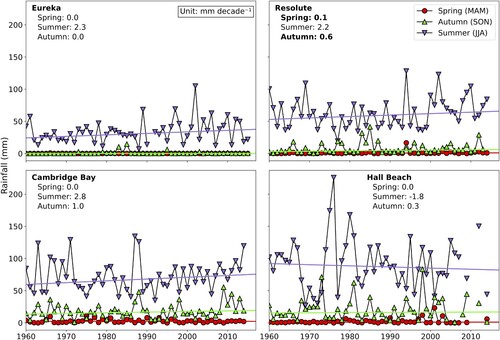
Interannual trends of snowfall are significantly positive at Eureka from autumn to spring at 1.6 to 2.1 mm decade−1 (), whereas the trends of rainfall are relatively small, only significant at Resolute in autumn and spring at less than 1 mm decade−1 (). The absence of significant trends at other sites is likely due to the presence of outliers in the fluctuating time series, resulting in lower statistical significance as determined by the MK test.
Fig. 8 Interannual variability of snowfall by season (autumn, winter, and spring) at four sites within the Canadian Arctic. Trends are reported in millimetre of water equivalent per decade. Bold values indicate significance at 95% confidence level.
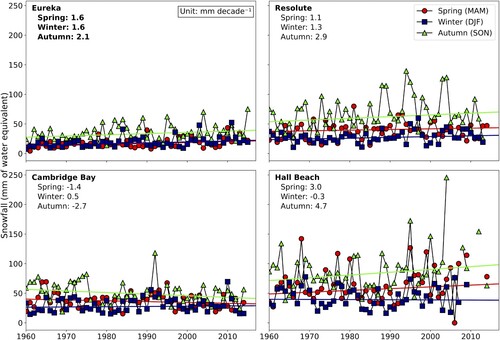
Fig. 9 Interannual variability of rainfall by season (spring, summer and autumn) at four sites within the Canadian Arctic. Trends are reported in millimetre per decade. Bold values indicate significance at 95% confidence level.
3 Air temperature
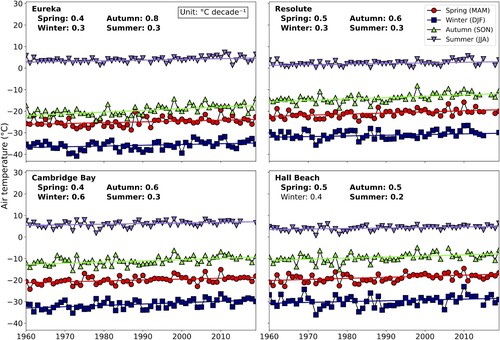
Air temperatures in the north are notably lower than in the south (). Between June and August, all sites record air temperature above 0°C, which justifies the exclusion of the summer season from the analysis on snow depth and snowfall in this study. Interannual air temperature has been increasing at all four sites throughout the year by 0.2 to 0.8°C decade−1 (). All trends are statistically significant, except in winter at Hall Beach.
Fig. 10 Monthly mean air temperature (°C) at the (a) northern; (b) southeastern; and (c) southwestern sites. Error bars show the multiyear standard deviation of air temperature for a calendar month. The curves are offset to show vertical error bars of each site and month.
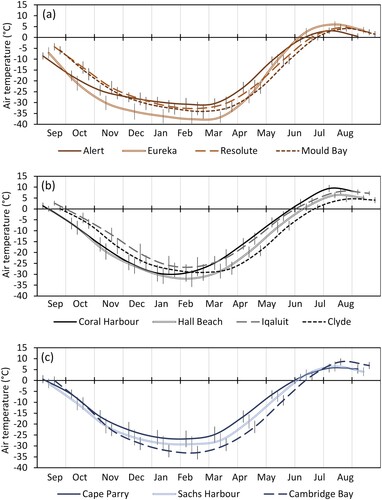
Fig. 11 Interannual variability of air temperature by all four seasons at four sites within the Canadian Arctic. Bold values indicate significance at 95% confidence level.
4 Break-up, freeze-up and snow accumulation
Open water period is notably shorter in the north due to regionally later break-up and earlier freeze-up (). Snow-on occurs earlier in the north than in the south, where precipitation is dominantly rainfall until October ( and ). Snow-on precedes freeze-up at the study sites by 12–64 days, except at Alert where snow-on may occur shortly after freeze-up (). This time lag allows snowfall to start accumulating on land before it does on ice. Interannually, break-up occurs earlier by up to 2.9 days decade−1 at Eureka, whereas freeze-up is significantly delayed by up to 2.5 days decade−1 at Hall Beach ( and ). Length of open water period is significantly longer by up to 3.9 days decade−1 at Eureka. There are no significant interannual trends in snow-on. Longer open water period and later freeze-up would result in sea ice receiving less snow in autumn, contributing to the negative interannual trends shown in .
Fig. 12 Length of open water period and the onset of on-land snow accumulation (snow-on) at the study sites. Left (right) end and error bars show the multiyear averages and standard deviations of the day of break-up (freeze-up) rounded to the nearest day. Red circles and capped error bars show the multiyear averages and standard deviations of the day of snow-on. Regions of the sites are denoted by N: northern, SW: southwest, and SE: southeast.
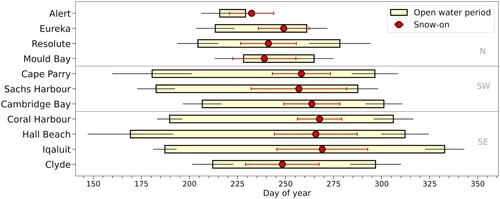
Fig. 13 Interannual variability of sea ice break-up (solid black line), freeze-up (dashed black line) and the length of open water period (vertical bars) at four sites within the Canadian Arctic. Annual onset of on-land snow accumulation (snow-on) is shown by the red circles. Colourbar indicates the length of open water period. Corresponding interannual trends are reported in .
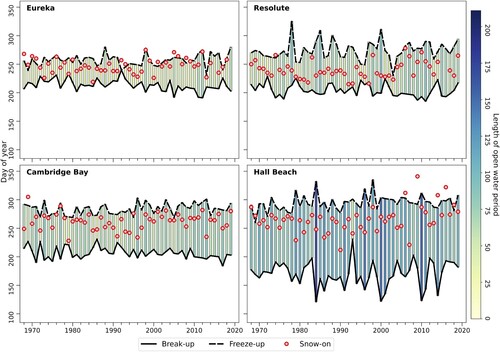
Table 2. Interannual trends (days per decade) of break-up, length of open water period, freeze-up, and onset of on-land snow accumulation (snow-on).
b Controls on Snow Depth
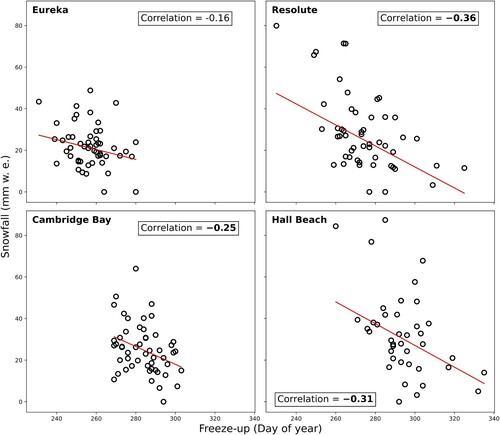
shows that when freeze-up occurs later in a year, total snowfall within the 90-day period after freeze-up is less. Later freeze-up also implies that the time available for snow accumulation on sea ice is shortened; therefore we should expect on-ice snow depth to be less when freeze-up is delayed. However, we did not observe any significant correlation between the dates of freeze-up and the accumulated amount of on-ice snow depth within the 90-day period that follows at any of the four sites. This implies that other factors are in place to mitigate the effect of delayed freeze-up on the snow accumulation on sea ice. One such contributing factor could be that later freeze-up allows snow to be captured at colder temperature, which reduces the rates of formation of snow-ice layers and compaction of snow and thus compensate for the effect of less snowfall.
Fig. 14 Total snowfall (mm of water equivalent) within 90 days of freeze-up versus the annual freeze-up. Each circle represents a data pair for a year. Kendall rank correlation coefficients are shown in the text boxes; bold number indicates statistical significance at 95% confidence level. Red line shows the linear trend among the data pairs.
The average on-land snow depth in autumn is significantly correlated with autumn snowfall at all four sites (), meaning that the year-to-year variability of the two parameters are in phase. However, their overall interannual trends do not share the same signs. Specifically, shows that snowfall has significantly increased at Eureka from autumn to spring; but on-land snow depth at the location has indeed decreased in winter and spring (). These divergent trends suggest that other factors, such as temperature-induced snow densification and rain-on-snow events influence snow accumulation. Indeed, shows that autumn rainfall has slightly increased (significantly at Resolute), which contributes to reduction of on-land snow depth by the formation of snow-ice. Rainfall is negligible at all study sites between November and April, so rain-on-snow events are limited to autumn and late spring ().
Table 3. Detrended Kendall rank correlation coefficients between snow depths and meteorological variables.
In autumn, on-ice and on-land snow depths are positively correlated at Eureka and Hall Beach (). The lack of correlation in autumn at Resolute and Cambridge Bay further suggests that the difference between on-ice and on-land snow depths is due to snow accumulating on land but not on sea ice, as the ice is not yet consolidated enough to capture snow at these sites. At Hall Beach, the significant positive correlation in autumn is a result of low snow depth both on sea ice (as sea ice is yet to form completely) and on land (as precipitation is a mix of rain and snow), which reduces and allows on-ice and on-land snow depth to follow a more similar seasonal trend. In winter, the correlation is statistically significant at all four sites (). As sea ice consolidates, snow can accumulate both on-land and on-sea ice, hence they become significantly and positively correlated in winter.
Table 4. Detrended Kendall rank correlation coefficients between on-ice snow depth and on-land snow depth.
The detrended correlations of autumn air temperature with freeze-up and with snow-on are positively correlated at three of the four sites (), suggesting that delayed freeze-up and snow-on are expected in years with warmer autumns. Throughout the Canadian Arctic, air temperature exhibits a warming trend in each season (), and freeze-up occurs later at all four sites (). As a result, the increase in autumn and early winter snowfall () is not fully captured on sea ice, which in turn causes on-ice snow depth to exhibit decreasing trends in each season at three study sites (). Post-freeze up snowfall amount also reduces when freeze-up is delayed. The delay in freeze-up is less at Eureka, resulting in less of an effect on on-ice snow depth at this site.
Table 5. Detrended Kendall rank correlation coefficients between onsets of snow accumulation and air temperature in autumn.
One possible reason for the increase in snowfall is that a warming Arctic atmosphere has a higher moisture holding capacity, which causes an increased potential for meteoric snowfall during storms (Cohen et al., Citation2012; Liu et al., Citation2012; Song & Liu, Citation2017; Yackel et al., Citation2019). However, warming trends in air temperature in autumn would allow for mixed precipitation in the form of rain and snow, particularly in the southern latitudes (). This will lead to more frequent rain-on-snow events and facilitate densification of the snow cover (Herron & Langway, Citation1980). This could reduce both on-land and on-ice snow depth. One aspect outside the scope of this study is wind redistribution of snow. Local-scale assessment on how seasonal wind patterns and the topography near each of the sites contribute to on-ice and on-land snow accumulation differences may provide further insights.
c Comparison with Previous Studies
The Warren et al. (Citation1999) climatological dataset is widely cited for its estimates of snow depth on sea ice. Based on in-situ measurements made at drifting stations on MYI in the Arctic Ocean over the period 1954-1991, they found that on average, MYI is mostly free of snow during August and snow accumulates rapidly in September and October and then moderately from November to May ( of Warren et al. (Citation1999)). The average snow depth of the MYI region reaches a maximum of 34.4 cm in May and the deepest snow is found north of Greenland and Ellesmere Island, peaking in early June at more than 40 cm. They also found weak negative interannual trends of snow depth for all months, with the largest decrease of 8 cm over 37 years (−2.2 cm decade−1) in May, the month of maximum snow depth. They attributed such decreases to a reduction in accumulation-season snowfall.
The intra-annual trend described by Warren et al. (Citation1999) matches that of on-land snow depth across the Canadian Arctic (). Given their persistence over the summer, MYI floes are able to capture autumn snowfall, hence the similarity between snow depth accumulation on MYI and on-land. The negative interannual trends of on-ice snow depth indicated by this study () also agree with the observations in Warren et al. (Citation1999). However, in our study we have shown that snowfall has increased at three of the four sites (), which suggests that the mechanism for decreasing snow depth on sea ice in the Canadian Arctic is different than that for MYI in the Arctic Ocean and may have changed in the last three decades.
Webster et al. (Citation2014) studied spring snow depth distribution on western Arctic sea ice using airborne radar observations from Operation IceBridge for 2009-2013. They compared the 2009–2013 average with Warren et al. (Citation1999) and found a thinning of the on-ice snow cover from 35.1 ± 9.4 to 22.2 ± 1.9 cm (−3.4 cm decade−1) in the western Arctic, and from 32.8 ± 9.4 to 14.5 ± 1.9 cm (−4.8 cm decade−1) in the Beaufort and Chukchi seas. They concluded that the decline in on-ice snow depth is correlated with the delayed onset of sea ice freeze-up during autumn. We demonstrated that this is contributing to the decline in on-ice snow depth in the Canadian Arctic, especially at Resolute. Using Coupled Model Intercomparison Project 5 (CMIP5) data, Hezel et al. (Citation2012) projected that April snow depth on sea ice north of 70°N will further decline from about 28 cm to 16 cm (−1.2 cm decade−1) in the twenty-first century. Our study finds that two of the study sites, Resolute and Hall Beach, exhibit a comparable decline in spring on-ice snow depth to Hezel et al. (Citation2012). The decline of on-ice snow depth in the Canadian Arctic is in general at a lesser rate than that found in the western Arctic and the Beaufort and Chukchi seas by Webster et al. (Citation2014).
Based on in-situ measurements from the Norwegian young sea ICE (N-ICE2015) expedition (January to March 2015), Merkouriadi et al. (Citation2017b) found that the observed winter snow depth on sea ice was 41 ± 19 cm in January and February and 56 ± 17 cm in March, almost 50% greater than the Warren et al. (Citation1999) climatological values in the region north of Svalbard. In this study, we observed generally thinner snow on FYI in the Canadian Arctic compared to Merkouriadi et al. (Citation2017b), ranging from 7.9 cm in January to 31.6 cm in March (). This suggests that snow depth on sea ice throughout the Canadian Arctic is generally lower than what is observed in the region north of Svalbard.
4 Conclusions
We found that the intra-annual trends of snow depth are markedly different on sea ice and on terrestrial land in the Canadian Arctic and depend on the location of the study sites. The linear trends of on-ice snow depth between September and April exhibit a mean of 3.2 ± 0.6 cm month−1 in the Canadian Arctic. The interannual trends are spatially and temporally variable. On a decadal scale, on-ice and on-land snow depths are generally decreasing at Eureka, Resolute, and Hall Beach. Comparison with previous studies suggests that on-ice snow depth in the Canadian Arctic is generally lower in magnitude and declines at a lower interannual rate than in the Arctic Ocean.
The primary control on both on-ice and on-land snow depth is autumn snowfall, which has increased on decadal timescales at Eureka, Resolute, and Hall Beach. Air temperature has been increasing on decadal timescales throughout most of the year by 0.2 to 0.8°C decade−1. Break-up has become earlier by about 2 to 3 days decade−1 and freeze-up has been delayed by up to 2.5 days decade−1, increasing the length of open water period. In general, for the Canadian Arctic, the increases in snowfall have not manifested as an increase in on-ice snow depth, due to the delay in sea ice freeze-up coupled with significantly warming air temperatures. This leads to decreasing on-ice snow depths for most sites. In southern areas, the greater increase in air temperature in autumn may lead to increased snow density and more frequent rain events. As freeze-up is delayed further in the future, the dynamics within the Canadian Arctic may change; the competing effects of changing snowfall and air temperature on snow depth will need to be monitored closely.
Under a continued warming Arctic atmosphere, on-ice snow depth could decrease further due to later freeze-up, enhanced snow densification, and rain-on-snow events, but could possibly be offset by increasing autumn and winter snowfall at some locations. The timing of sea ice freeze-up and snow depth on sea ice have been shown to contribute to the mass balance of sea ice, through the formation of snow-ice from accumulated snow and bottom ice growth (Granskog et al., Citation2017; Merkouriadi et al., Citation2017a). Under a thinning sea ice regime in the Arctic, changes in its snow cover will play a more significant role in sea ice mass balance estimates (Granskog et al., Citation2017). In addition, due to its higher thermal conductivity, such decreases in top-layer snow cover enable air temperature fluctuations to create larger changes in thermodynamic properties of the snow layer as detected by satellite-based active microwave scatterometers and altimeters.
Acknowledgements
The authors are grateful for the helpful feedback and comments on the manuscript provided by two anonymous reviewers.
Disclosure statement
No potential conflict of interest was reported by the author(s).
Additional information
Funding
References
- Brown, R. D., & Cote, P. (1992). Interannual variability of landfast ice thickness in the Canadian high Arctic, 1950–89. Arctic, 45(3), 273–284. https://www.jstor.org/stable/pdf/40511459.pdf?refreqid=excelsior%3A7877e4aeebf81ce71d6b1dbb3c03e1e8. https://doi.org/10.14430/arctic1402
- Cohen, J. L., Furtado, J. C., Barlow, M. A., Alexeev, V. A., & Cherry, J. E. (2012). Arctic warming, increasing snow cover and widespread boreal winter cooling. Environmental Research Letters, 7(1), 014007. https://doi.org/10.1088/1748-9326/7/1/014007
- Colbeck, S. C. (1991). The layered character of snow covers. Reviews of Geophysics, 29(1), 81–96. https://doi.org/10.1029/90RG02351
- Devine, K. A., & Mekis, É. (2008). Field accuracy of Canadian rain measurements. Atmosphere-Ocean, 46(2), 213–227. https://doi.org/10.3137/ao.460202
- Dolant, C., Langlois, A., Brucker, L., Royer, A., Roy, A., & Montpetit, B. (2018). Meteorological inventory of rain-on-snow events in the Canadian Arctic Archipelago and satellite detection assessment using passive microwave data. Physical Geography, 39(5), 428–444. https://doi.org/10.1080/02723646.2017.1400339
- Environment and Climate Change Canada. (2020). Technical documentation. https://climate.weather.gc.ca/doc/Technical_Documentation.pdf
- Flato, G. M., & Brown, R. D. (1996). Variability and climate sensitivity of landfast Arctic sea ice. Journal of Geophysical Research: Oceans, 101(C11), 25767–25777. https://doi.org/10.1029/96JC02431
- Gerland, S., & Haas, C. (2011). Snow-depth observations by adventurers traveling on Arctic sea ice. Annals of Glaciology, 52(57), 369–376. https://doi.org/10.3189/172756411795931552
- Gough, W. A., Gagnon, A. S., & Pang Lau, H. (2004). Interannual variability of Hudson Bay ice thickness. Polar Geography, 28(3), 222–238. https://doi.org/10.1080/789610188
- Gow, A. J., Meese, D. A., Perovich, D. K., & Tucker, W. B. (1990). The anatomy of a freezing lead. Journal of Geophysical Research, 95(C10), 18221. https://doi.org/10.1029/JC095iC10p18221
- Granskog, M. A., Rösel, A., Dodd, P. A., Divine, D., Gerland, S., Martma, T., & Leng, M. J. (2017). Snow contribution to first-year and second-year Arctic sea ice mass balance north of Svalbard. Journal of Geophysical Research: Oceans, 122(3), 2539–2549. https://doi.org/10.1002/2016JC012398
- Haas, C., Beckers, J. F., King, J., Silis, A., Stroeve, J. C., Wilkinson, J., Notenboom, B., Schweiger, A., & Hendricks, S. (2017). Ice and snow thickness variability and change in the high Arctic Ocean observed by in situ measurements. Geophysical Research Letters, 44(20), 10,462–10,469. https://doi.org/10.1002/2017GL075434
- Helsel, D. R., & Hirsch, R. M. (1992). Statistical methods in water resources. Elsevier, Amsterdam.
- Herron, M. M., & Langway, C. C. (1980). Firn densification: An empirical model. Journal of Glaciology, 25(93), 373–385. https://doi.org/10.3189/s0022143000015239
- Hezel, P. J., Zhang, X., Bitz, C. M., Kelly, B. P., & Massonnet, F. (2012). Projected decline in spring snow depth on Arctic sea ice caused by progressively later autumn open ocean freeze-up this century. Geophysical Research Letters, 39(17), L17505. https://doi.org/10.1029/2012GL052794
- Holt, B., & Digby, S. A. (1985). Processes and imagery of first-year fast sea ice during the melt season. Journal of Geophysical Research, 90(C3), 5045. https://doi.org/10.1029/JC090iC03p05045
- Holtsmark, B. E. (1955). Insulating effect of a snow cover on the growth of young sea ice. Arctic, 8(1), 60–65. https://doi.org/10.14430/arctic3805
- Howell, S. E. L., Derksen, C., Pizzolato, L., & Brady, M. (2015). Multiyear ice replenishment in the Canadian Arctic archipelago: 1997-2013. Journal of Geophysical Research: Oceans, 120(3), 1623–1637. https://doi.org/10.1002/2015JC010696
- Howell, S. E. L., Laliberté, F., Kwok, R., Derksen, C., & King, J. (2016). Landfast ice thickness in the Canadian Arctic Archipelago from observations and models. The Cryosphere, 10(4), 1463–1475. https://doi.org/10.5194/tc-10-1463-2016
- Howell, S. E. L., Scharien, R. K., Landy, J., & Brady, M. (2020). Spring melt pond fraction in the Canadian Arctic Archipelago predicted from RADARSAT-2. Cryosphere, 14(12), 4675–4686. https://doi.org/10.5194/tc-14-4675-2020
- Iacozza, J., & Barber, D. G. (2010). An examination of snow redistribution over smooth land-fast sea ice. Hydrological Processes, 24(7), 850–865. https://doi.org/10.1002/hyp.7526
- Kendall, M. G., & Gibbons, J. D. (1990). Rank correlation methods. E. Arnold.
- Landy, J., Ehn, J., Shields, M., & Barber, D. G. (2014). Surface and melt pond evolution on landfast first-year sea ice in the Canadian Arctic Archipelago. Journal of Geophysical Research: Oceans, 119(5), 3054–3075. https://doi.org/10.1002/2013JC009617
- Ledley, T. S. (1991). Snow on sea ice: Competing effects in shaping climate. Journal of Geophysical Research, 96(D9), 17195–17208. https://doi.org/10.1029/91jd01439
- Liu, J., Curry, J. A., Wang, H., Song, M., & Horton, R. M. (2012). Impact of declining Arctic sea ice on winter snowfall. Proceedings of the National Academy of Sciences of the United States of America, 109(11), 4074–4079. https://doi.org/10.1073/pnas.1114910109
- Mallett, R. D. C., Stroeve, J. C., Tsamados, M., Landy, J. C., Willatt, R., Nandan, V., & Liston, G. E. (2021). Faster decline and higher variability in the sea ice thickness of the marginal Arctic seas when accounting for dynamic snow cover. The Cryosphere, 15(5), 2429–2450. https://doi.org/10.5194/tc-15-2429-2021
- Markus, T., Stroeve, J. C., & Miller, J. (2009). Recent changes in Arctic sea ice melt onset, freezeup, and melt season length. Journal of Geophysical Research, 114(C12), C12024. https://doi.org/10.1029/2009JC005436
- Mekis, É, & Brown, R. D. (2010). Derivation of an adjustment factor map for the estimation of the water equivalent of snowfall from ruler measurements in Canada. Atmosphere-Ocean, 48(4), 284–293. https://doi.org/10.3137/AO1104.2010
- Mekis, É, & Vincent, L. A. (2011). An overview of the second generation adjusted daily precipitation dataset for trend analysis in Canada. Atmosphere – Ocean, 49(2), 163–177. https://doi.org/10.1080/07055900.2011.583910
- Melling, H. (2002). Sea ice of the northern Canadian Arctic Archipelago. Journal of Geophysical Research, 107(C11), 3181. https://doi.org/10.1029/2001JC001102
- Merkouriadi, I., Cheng, B., Graham, R. M., Rösel, A., & Granskog, M. A. (2017a). Critical role of snow on sea ice growth in the Atlantic sector of the Arctic Ocean. Geophysical Research Letters, 44(20), 10,479–10,485. https://doi.org/10.1002/2017GL075494
- Merkouriadi, I., Gallet, J. C., Graham, R. M., Liston, G. E., Polashenski, C., Rösel, A., & Gerland, S. (2017b). Winter snow conditions on Arctic sea ice north of Svalbard during the Norwegian young sea ICE (N-ICE2015) expedition. Journal of Geophysical Research: Atmospheres, 122(20), 10,837–10,854. https://doi.org/10.1002/2017JD026753
- Metcalfe, J. R., Routledge, B., & Devine, K. (1997). Rainfall measurement in Canada: Changing observational methodsand archive adjustment procedures. Journal of Climate, 10(1), 92–101. https://doi.org/10.1175/1520-0442(1997)010<0092:RMICCO>2.0.CO;2
- Mudryk, L. R., Derksen, C., Howell, S. E. L., Laliberté, F., Thackeray, C., Sospedra-Alfonso, R., Vionnet, V., Kushner, P. J., & Brown, R. D. (2018). Canadian snow and sea ice: Historical trends and projections. The Cryosphere, 12(4), 1157–1176. https://doi.org/10.5194/tc-12-1157-2018
- Perovich, D. K., Grenfell, T. C., Light, B., & Hobbs, P. V. (2002). Seasonal evolution of the albedo of multiyear Actic sea ice. Journal of Geophysical Research C: Oceans, 107(10), SHE 20-1. https://doi.org/10.1029/2000jc000438
- Petrich, C., Eicken, H., Polashenski, C. M., Sturm, M., Harbeck, J. P., Perovich, D. K., & Finnegan, D. C. (2012). Snow dunes: A controlling factor of melt pond distribution on Arctic sea ice. Journal of Geophysical Research: Oceans, 117(9), 9029. https://doi.org/10.1029/2012JC008192
- Polashenski, C., Perovich, D., & Courville, Z. (2012). The mechanisms of sea ice melt pond formation and evolution. Journal of Geophysical Research: Oceans, 117(1), C01001. https://doi.org/10.1029/2011JC007231
- Schröder, D., Feltham, D. L., Flocco, D., & Tsamados, M. (2014). September Arctic sea-ice minimum predicted by spring melt-pond fraction. Nature Climate Change, 4(5), 353–357. https://doi.org/10.1038/nclimate2203
- Sen, P. K. (1968). Estimates of the regression coefficient based on Kendall’s Tau. Journal of the American Statistical Association, 63(324), 1379–1389. https://doi.org/10.1080/01621459.1968.10480934
- Shalina, E. V., & Sandven, S. (2018). Snow depth on Arctic sea ice from historical in situ data. The Cryosphere, 12(6), 1867–1886. https://doi.org/10.5194/tc-12-1867-2018
- Song, M., & Liu, J. (2017). The role of diminishing Arctic sea ice in increased winter snowfall over northern high-latitude continents in a warming environment. Acta Oceanologica Sinica, 36(8), 34–41. https://doi.org/10.1007/s13131-017-1021-3
- Sturm, M., & Massom, R. A. (2016). Snow in the sea ice system: Friend or foe? In D. N. Thomas (Ed.), Sea ice: Third edition (pp. 65–109). Wiley Publisher, New York, NY. https://doi.org/10.1002/9781118778371.ch3
- Sturm, M., Perovich, D. K., & Holmgren, J. (2002). Thermal conductivity and heat transfer through the snow on the ice of the Beaufort sea. Journal of Geophysical Research, 107(C21), 8043. https://doi.org/10.1029/2000JC000409
- Tivy, A., Howell, S. E. L., Alt, B., McCourt, S., Chagnon, R., Crocker, G., Carrieres, T., & Yackel, J. J. (2011). Trends and variability in summer sea ice cover in the Canadian Arctic based on the Canadian ice service digital archive, 1960–2008 and 1968–2008. Journal of Geophysical Research: Oceans, 116(3), C03007. https://doi.org/10.1029/2009JC005855
- Toyota, T., Ono, T., Tanikawa, T., Wongpan, P., & Nomura, D. (2020). Solidification effects of snowfall on sea-ice freeze-up: Results from an onsite experimental study. Annals of Glaciology, 61(83), 299–308. https://doi.org/10.1017/aog.2020.49
- Vincent, L. A., Hartwell, M. M., & Wang, X. L. (2020). A third generation of homogenized temperature for trend analysis and monitoring changes in Canada’s climate. Atmosphere-Ocean, 58(3), 173–191. https://doi.org/10.1080/07055900.2020.1765728
- Vincent, L. A., & Mekis, E. (2009). Discontinuities due to joining precipitation station observations in Canada. Journal of Applied Meteorology and Climatology, 48(1), 156–166. https://doi.org/10.1175/2008JAMC2031.1
- Wang, X. L., Xu, H., Qian, B., Feng, Y., & Mekis, E. (2017). Adjusted daily rainfall and snowfall data for Canada. Atmosphere-Ocean, 55(3), 155–168. https://doi.org/10.1080/07055900.2017.1342163
- Warren, S. G., Rigor, I. G., Untersteiner, N., Radionov, V. F., Bryazgin, N. N., Aleksandrov, Y. I., & Colony, R. (1999). Snow depth on Arctic sea ice. Journal of Climate, 12(6), 1814–1829. https://doi.org/10.1175/1520-0442(1999)012<1814:SDOASI>2.0.CO;2
- Webster, M. A., Parker, C., Boisvert, L. N., & Kwok, R. (2019). The role of cyclone activity in snow accumulation on Arctic sea ice. Nature Communications, 10(1), 5285. https://doi.org/10.1038/s41467-019-13299-8
- Webster, M. A., Rigor, I. G., Nghiem, S. V., Kurtz, N. T., Farrell, S. L., Perovich, D. K., & Sturm, M. (2014). Interdecadal changes in snow depth on Arctic sea ice. Journal of Geophysical Research: Oceans, 119(8), 5395–5406. https://doi.org/10.1002/2014JC009985
- Yackel, J. J., Barber, D. G., Papakyriakou, T. N., & Breneman, C. (2007). First-year sea ice spring melt transitions in the Canadian Arctic Archipelago from time-series synthetic aperture radar data, 1992–2002. Hydrological Processes, 21(2), 253–265. https://doi.org/10.1002/hyp.6240
- Yackel, J. J., Geldsetzer, T., Mahmud, M., Nandan, V., Howell, S. E. L., Scharien, R. K., & Lam, H. M. (2019). Snow thickness estimation on first-year sea ice from late winter spaceborne scatterometer backscatter variance. Remote Sensing, 11(4), 417. https://doi.org/10.3390/rs11040417
- Zhang, X., Vincent, L. A., Hogg, W. D., & Niitsoo, A. (2000). Temperature and precipitation trends in Canada during the 20th century. Atmosphere – Ocean, 38(3), 395–429. https://doi.org/10.1080/07055900.2000.9649654