
ABSTRACT
Drought is the deadliest natural disaster on Earth due to its long duration, wide spatial coverage and direct connection with the food supply for human beings. Drought develops slowly and thus is called a silent killer. This paper reviews the history of research on droughts and mega-droughts. Interannual droughts are in many places driven by the El Nino-Southern Oscillation, multi-decadal mega-droughts are often driven by the Atlantic Multi-Decadal Oscillation, while centennial mega-droughts are often driven by the Global Inter-Centennial Oscillation. More generally, droughts are affected by multiple factors including global sea surface temperature anomalies, local land-atmosphere feedbacks, internal atmospheric variability and external forcings from outside the climate system. Possible future research directions are also suggested.
RÉSUMÉ
[Traduit par la redaction] La sécheresse est la catastrophe naturelle la plus meurtrière sur Terre en raison de sa longue durée, de sa large couverture spatiale et de son lien direct avec l’approvisionnement alimentaire des êtres humains. La sécheresse se développe lentement et est donc appelée un tueur silencieux. Le présent article porte sur l’histoire de la recherche sur les sécheresses et les méga-sécheresses. Les sécheresses interannuelles sont dans de nombreux endroits dirigées par l’oscillation El Niño-oscillation australe, les méga-sécheresses multi-décennales sont souvent dirigées par l’oscillation atlantique multi-décennale, tandis que les méga-sécheresses centennales sont souvent dirigées par l’oscillation globale inter-centennale. Plus généralement, les sécheresses sont affectées par de multiples facteurs, notamment les anomalies de la température de surface de la mer, les rétroactions terre-atmosphère locales, la variabilité atmosphérique interne et les forçages externes au système climatique. Des directions de recherche futures possibles sont aussi suggérées.
1 Introduction
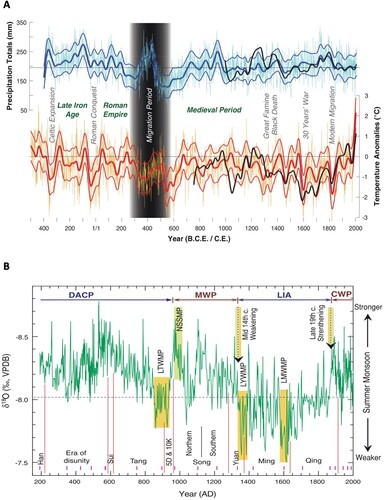
Drought, sometimes called the silent killer, is probably the deadliest natural disaster on Earth. Research shows that droughts have strongly affected human history (). A series of megadroughts between 135,000 and 75,000 years ago may have been responsible for the first migrations of early humans out of Africa, who were the ancestors of all non-Africans today around the world (Scholz et al., Citation2007). A megadrought hitting the Middle East and parts of Europe 4,500 years ago was a significant reason for the collapse of the Old Kingdom in Egypt around 4200 cal BP (Barta & Bezdek, Citation2008; Marriner et al., Citation2012). A century-long mega-drought in Europe between 200 and 300 AD preceded the collapse of Western Roman Empire during the Migration Period (a; Buntgen et al., Citation2011). A halving of annual rainfall in Central America 1200 years ago caused a war with neighbouring nations over dwindling water resources leading to the demise of the Mayan civilization (Evans et al., Citation2018; Kennett et al., Citation2012). Long-term drought records in China correspond well with the collapse of the Tang, Yuan, and Ming Dynasties, all times that were characterized by famine and popular unrest (b; Zhang et al., Citation2008). The deadliest drought in human history was the 1875–1878 Great Drought and resultant Global Famine, which caused a death toll of more than 50 million people in China, India, Indonesia, Australia, Brazil, Colombia, Venezuela and South Africa (Davis, Citation2001; Singh et al., Citation2018).
Fig. 1 (A) Reconstructed European AMJ precipitation totals (top) and JJA temperature anomalies (bottom) with respect to the 1901–2000 period. Bold lines are 60-year low pass filtered data (from Buntgen et al., Citation2011). (B) The WX42B d18O record from China. Chinese dynasties are indicated (from Zhang et al., Citation2008).
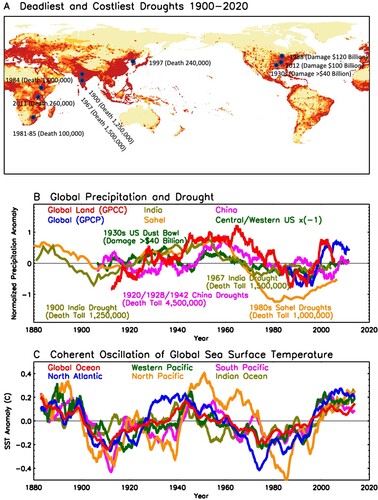
World population has almost doubled in the past four decades from 4 billion in 1975–7.9 billion in 2020 (World Bank, Citation2021), and the largest growth happened in the poorest developing countries in Africa and Central Asia (see for the global map of population density), making those regions more vulnerable to droughts and associated failure of agriculture. The deadliest and costliest droughts in the past 120 years (1900–2020) are shown in a. The 1899–1900 drought and resultant famine affected 59.5 million people with mortality estimates of 1–4.5 million (Mishra et al., Citation2019). The 1984 drought in Africa affected 250 million people in 22 countries and caused a death toll of one million people (Druyan, Citation1989). The 1988 North American drought caused $60 billion in damage (E. R. Cook et al., Citation2007; about $120 billion in today’s dollar), which was similar to the damage of Hurricane Katrina and wiped out more than 25% of the U.S. GDP growth in that year. b shows the normalized precipitation anomalies for global continent mean from the Global Precipitation Climatology Centre (GPCC; Schneider et al., Citation2016) dataset, global mean from the Global Precipitation Climatology Project (GPCP; Adler, Citation2003) dataset, Sahel rainfall from Nicholson et al. (Citation2012), Indian monsoon rainfall from the Indian Institute of Tropical Meteorology (Mooley et al., Citation1981), north China mean from the GPCC dataset, and central/western U.S. mean from the GPCC dataset. The precipitation anomalies are smoothed with 11-year running mean to display the low-frequency variability at decadal and longer timescales. The decadal precipitation anomalies in Sahel, India, China and the global continent mean show coherent variations. The decadal precipitation anomalies in central/western U.S. tend to be in opposite sign with the other regions, which has been multiplied by −1 in b. The deadliest and costliest droughts often occurred in the multi-decadal dry periods. This coherent variation of precipitation anomalies around the globe has been speculated to be driven by the coherent variation of SST anomalies in different ocean basins (c; Folland et al., Citation1986; Sutton & Hodson, Citation2005; Zhang & Delworth, Citation2006). However, the modern instrument records are too short, and long-term paleoclimate datasets are needed to derive statistically robust relationships.
Fig. 2 (A) The deadliest and costliest droughts in the past 120 years (1900–2020). Shading shows the population density in 2015. Damage has been adjusted to 2020 US dollars. (B) Global and regional mean precipitation anomalies (see text for details). Note the central/western U.S. anomalies have been multiplied by −1. (C) Global and basin-averaged SST anomalies from the ERSST dataset (detrended). The anomalies are smoothed with 11-year running mean to display the low-frequency variability at decadal and longer timescales.
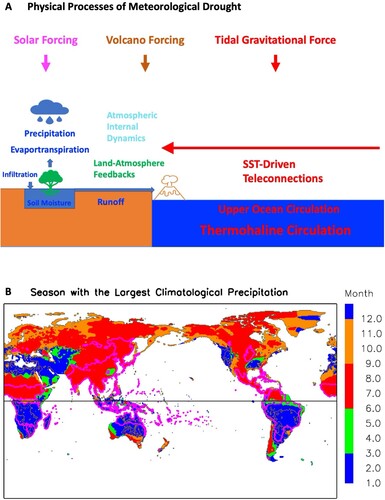
Drought can be defined as the shortage of water. Since water exists in all components of the global water cycle including the atmosphere, land, ocean and sea ice, shortage of water can happen in any of the components due to repartitioning of the total amount of water among the different components, or due to decrease of the total amount of water on Earth. Drought studies generally focus on the shortage of water over land, which directly affects human society (see reviews by Mishra & Singh, Citation2010; Peters-Lidard et al., Citation2018; Schubert et al., Citation2016; Wilhite, Citation2000, Citation2016). The land surface water budget has five key components: precipitation, evapotranspiration, runoff (also called streamflow), infiltration and soil moisture storage (a). There are four types of droughts generally considered in drought research: meteorological, hydrological, agricultural, and socioeconomic (Eslamian et al., Citation2017; Keyantash & Dracup, Citation2002; Wilhite & Glantz, Citation1985). Meteorological drought results from a shortage of precipitation, while hydrological drought describes a deficiency in the volume of the water supply at the ground, which includes streamflow, reservoir storage, and/or groundwater heights. Agricultural drought relates to a shortage of available water for plant growth, and is assessed as insufficient soil moisture to replace evapotranspirative losses. The socioeconomic drought is a consequence of the other drought types when societal demand exceeds natural supply. The four types of droughts are connected to one another. Generally, meteorological drought propagates to hydrological drought, then to agricultural drought, and finally to socioeconomic drought. When meteorological drought propagates to hydrological drought, other terms of the surface water budget also contribute. When hydrological drought propagates to agricultural drought, human activities such as irrigation and crop management also contribute. When agricultural drought propagates to socioeconomic drought, political and economic conditions also contribute, and it was often the case in history that corrupted governments badly enhanced the drought disasters. Scientifically, all the four types of droughts are ultimately driven by shortage of precipitation, which is the leading forcing of the surface water budget (Qian et al., Citation2006, Citation2007), although evapotranspiration change can also contribute significantly in some regions (B. I. Cook, et al., Citation2014; B. I. Cook, Ault et al., Citation2015; Schubert et al., Citation2016; Teuling et al., Citation2013). In the following we will focus on the meteorological droughts.
Fig. 3 (A) Schematic depiction of land-surface water budget and physical mechanisms for droughts and mega-droughts. (B) Global map showing the season with the largest climatological precipitation at each grid from the GPCC dataset. Magenta lines show the monsoon regions with summer-winter precipitation difference larger than 300 mm.
Many drought indices have been developed for the meteorological droughts (Eslamian et al., Citation2017; Heim, Citation2002; Keyantash & Dracup, Citation2002; Mishra & Singh, Citation2010; Oladipo, Citation1985), such as the discrete and cumulative precipitation anomalies, the rainfall deciles, the rainfall anomaly index (van Rooy, Citation1965), the Drought Area Index (Bhalme & Mooley, Citation1980), and the Standardized Precipitation Index (McKee et al., Citation1993). The Palmer Drought Severity Index (PDSI; Palmer, Citation1965), which has been used by many studies on climate change and paleoclimate droughts, was considered as a meteorological drought index in earlier reviews (e.g. Keyantash & Dracup, Citation2002; Mishra & Singh, Citation2010; Zargar et al., Citation2011), but as an agricultural drought index in later reviews (e.g. Eslamian et al., Citation2017; Yu et al., Citation2019). Palmer (Citation1965) used the surface precipitation and the surface air temperature to drive an idealized two-layer soil model, and calculated other terms of the land surface water budget. The PDSI has well-known limitations, such as region-dependent empirical parameters preventing spatial comparison of drought severity (Alley, Citation1984; Guttman et al., Citation1992), overly simplified soil model (Xu et al., Citation2012), overestimation of drought duration (Yu et al., Citation2019), and most importantly, overly large sensitivity to temperature, which tends to exaggerate drought severity in a warming climate (Sheffield et al., Citation2012). In this review, keeping in mind the above limitations, we nevertheless discuss drought studies which used the PDSI, simply because the limited number of existing reconstructions of paleoclimate drought atlas for different continents mostly used the PDSI rather than precipitation. Evaluations of the drought indices revealed that rainfall deciles and rainfall anomaly are among the best indices for meteorological drought (Keyantash & Dracup, Citation2002; Oladipo, Citation1985).
Since meteorological drought is shortage of precipitation, studies of the meteorological drought are intimately tied to precipitation variability over the continents. Precipitation on Earth can be generated by different physical mechanisms. Over the tropical continents and the warm-season extratropical continents, precipitation is often generated by deep convection. Over the cold-season extratropical continents, precipitation is often generated by fronts and orographic effects (see review by Houze, Citation2014; Lin et al., Citation2022). b displays global map showing the season with the largest climatological precipitation at each grid point based on the GPCC global land precipitation dataset covering the period 1901 till present. Red colour (northern summer, June–July–August) and brown colour (northern autumn, September–October–November) are for the northern hemisphere warm season, while blue colour (northern winter, December–January–February) and green colour (northern spring, March–April–May) are for the northern hemisphere cold season. Magenta lines show the monsoon regions with summer-winter precipitation difference larger than 300 mm. Over most of the global continents, especially over the monsoon regions, the largest climatological precipitation falls during the local warm season. However, over the Middle East, Central Asia, the western United States, the southeastern United States, the south coast of Australia and Chile, the largest climatological precipitation falls during the local cold season. Shortages of precipitation during those seasons have been the priority of most drought studies and predictions, although deficits in precipitation in the other (transition) seasons would also contribute to the development of droughts.
Predicting droughts is one of the most difficult problems in climate science, because the occurrence of droughts involves various modes of climate variability, climate change, SST-driven teleconnections, atmospheric internal dynamics, land-atmosphere feedbacks and external forcings (a). State-of-the-art global climate models are used for drought forecasts. Currently, 3-month official forecasts and 12-month experimental outlooks are being issued by the leading global climate forecasting centres, such as the U. S. National Center for Environmental Prediction (NCEP; https://www.cpc.ncep.noaa.gov/products/predictions/90day/), the European Center for Medium-range Weather Forecast (ECMWF; https://apps.ecmwf.int/webapps/opencharts/products/seasonal_system5_standard_rain), the International Research Institute (IRI; https://iri.columbia.edu/our-expertise/climate/forecasts/seasonal-climate-forecasts/), and the Australian Bureau of Meteorology (BOM; http://www.bom.gov.au/climate/outlooks/#/rainfall/median/seasonal/0). For the 3-month forecasts, the skills are generally higher in the tropics, especially over Australia, Africa and South America in the local warm seasons, but lower in the extratropics over North America and Europe (Goddard et al., Citation2003, their Table 1). In fact, droughts are connected to climate variability at all time-scales. The seasonal monsoons produce most of the land-surface precipitation in the tropics and subtropics (b), and droughts in those regions are often associated with the failure of monsoon rains. The global monsoon constitutes the rising branch of the Hadley Circulation, and thus some droughts are associated with variations in the seasonal zonal-mean atmospheric circulation. Droughts are modulated by the El Nino-Southern Oscillation (ENSO), the Pacific Decadal Oscillation (PDO), the Atlantic Multi-decadal Oscillation (AMO), and the Global Inter-Centennial Oscillation (GICO), among other modes of climate variability. Droughts are also affected by local feedback processes such as the circulation-convection feedback and land-atmosphere feedback. Moreover, external forcings such as human-released greenhouse gases, solar forcing, volcano forcing and tidal gravitational force can impact droughts.
This paper reviews the observations and theories of meteorological droughts. Based on the time-scales, we divide droughts into two groups: (1) the interannual to decadal droughts which last for less than 20 years (hereafter called droughts), and (2) the mega-droughts which last longer than 20 years. The latter are further divided into multi-decadal and centennial mega-droughts. We use 20-years as a somewhat arbitrary separation between droughts and mega-droughts, though this is supported somewhat by observations/reanalyses showing that the global climate system has a natural separation of variance between timescales longer than 40 years and shorter than 40 years (see ). With the oscillations of precipitation that are longer than 40 years, the wet/dry periods last for more than 20 years. We do not discuss the short-term “flash droughts” at subseasonal/seasonal time scales, such as the droughts/heat waves in Northern Eurasia (e.g. Schubert et al., Citation2014), which generally do not cause as much damage as the long-term droughts. In the following, we review separately the history of research on droughts and mega-droughts.
2 Droughts
a Overview
Rainfall began to be measured in the ancient times by different civilizations, with records of the simplest rain gauges going back as far as the sixth century BC in ancient Greece (Gallicchio, Citation2017). A bowl with its mouth as wide as 457 mm was used as a rain gauge in India in the fourth century BC (Frisinger, Citation1977; Shamasastry, Citation1915). In China, rain gauges were installed across the country around 1247 and methods were developed to convert the point measurements to area averages (Needham, Citation1959). In Korea, rain gauges were distributed to the country around 1441 and were used continuously until 1907 (Wada, Citation1911). In Italy, Benedetto Castelli, a long-term friend of Galileo, used a glass to measure rainfall around 1639 (Strangeways, Citation2010).
The modern instruments for measuring rainfall were invented in the seventeenth century (Strangeways, Citation2010). Wren & Hooke developed a tipping bucket (Grew, Citation1681), and Towneley (Citation1694) published the first systematic measurement of rainfall. Starting from 1861, the British Rainfall Organization and UK Met Office published 126 volumes of “British Rainfall”, with about 500 stations in 1861 (Burt, Citation2010). Stations were also set up in the late nineteenth century in the United States and the British colonies, such as India, South Africa, and Australia, and then spread to other countries in the early twentieth century. Today, numerous surface stations exist around the world (Kidd et al., Citation2017), while satellites with different sensors provide global coverage especially over the ocean (Kidd & Levizzani, Citation2011). The longest instrument global precipitation dataset goes back to 1900 (Sun et al., Citation2018).
Research on droughts began in the late nineteenth century for various regions around the world, such as India (Blanford, Citation1884), South Africa (Hutchins, Citation1889), North America (Guinn, Citation1890; Henry, Citation1930a, Citation1930b), Australia (Berney, Citation1906), and Brazil (Freise, Citation1938; Mossman, Citation1919). Brooks and Glasspoole (Citation1922) presented an excellent pioneering study on the relationships between severe droughts in the British Isles and large-scale atmospheric circulation. They recognized that the establishment and maintenance of local anticyclonic conditions is closely associated with dry weather, and aimed to discover how the local anomalies of pressure distribution are related to others in the general circulation in different parts of the world. Using 72 years (1850–1921) of data, they identified nine severe drought periods, which can be categorized into two types. Type A is characterized by high pressure anomalies to the north of the British Isles. The Icelandic low is shifted toward west Greenland and the Azores high is weakly developed. In this case, the drought is said to be due to dry winds rather than to anticyclonic conditions. Type B is characterized by high pressure anomalies right over the British Isles, and low pressure anomalies over the Arctic Ocean and at the Azores (a), which is similar to the North Atlantic Oscillation (NAO) pattern discovered by Exner (Citation1913).
Fig. 4 (a) Mean pressure anomaly of seven droughts in British Isles (from Brooks & Glasspoole, Citation1922). (b) Change in number of rain days per year associated with decrease of 10% in forest area (from Brooks, Citation1928).
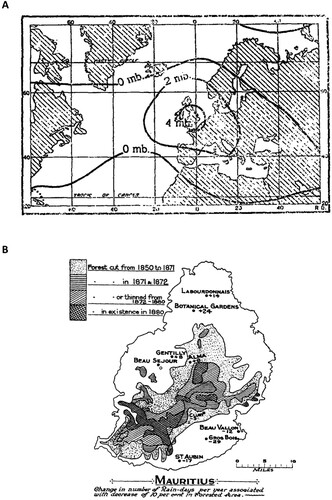
Brooks (Citation1928) published a pioneering study on land-atmosphere interaction and effects of deforestation and afforestation. There was a hot debate at that time on the influence of forests on rainfall. Brooks analysed the vegetation data and rainfall data from a deforestation/afforestation region (), and found that the replacement of forests by field crops or grass land probably tends to increase the general rainfall of the district slightly, while their replacement by bare ground probably tends to decrease the general rainfall slightly. Forests increase the local rainfall by one to two per cent, which is due to the increase of surface roughness. The most noticeable effect of afforestation of grass or crop land is increase of the local run-off by ten to twenty per cent, which is partly due to the decreased loss of water in evaporation and transpiration, and partly due to the slight increase of actual rainfall. Afforestation of bare ground would decrease the run-off, but this effect would be masked by the much greater regularity of the flow. Brooks suggested that forests, drawing their water supply from deep sources, possibly exercise a slight mitigating effect on droughts.
Since then, because of the strong hydrological, agricultural and socio-economic consequences of droughts, numerous case studies have been conducted on major drought events in different regions of the globe, such as North America (Chang & Wallace, Citation1987; Chen & Newman, Citation1998; Hoerling et al., Citation2014; Hoerling & Kumar, Citation2003; Klein, Citation1952; Liu et al., Citation1998; Namias, Citation1955, Citation1960, Citation1966, Citation1978, Citation1982, Citation1991; Palmer & Brankovic, Citation1989; Schubert et al., Citation2004b; Seager, Citation2007; Seager, , Kushnir, et al., Citation2008; Seager, Burgman, et al., Citation2008; Trenberth et al., Citation1988; Trenberth & Guillemot, Citation1996; Wang et al., Citation2014), Europe (Green, Citation1977; Hurrell, Citation1995; Kingston et al., Citation2013, Citation2015; Obukhov et al., Citation1984; Polozova & Grigoryeva, Citation1984; Ratcliffe, Citation1978; Schubert et al., Citation2011; Trenberth & Fasullo, Citation2012), Africa and Middle East (Barlow et al., Citation2016; Bryson, Citation1973; Folland et al., Citation1986; Fontaine et al., Citation1995; Giannini et al., Citation2003; Grist & Nicholson, Citation2001; Held et al., Citation2005; Lu & Delworth, Citation2005; Lyon, Citation2014; Nicholson, Citation1980, Citation1981; Rodriguez-Fonseca et al., Citation2011, Citation2015; Rowell, Citation2001; Shinoda, Citation1990; Yang et al., Citation2014; Winstanley, Citation1973a, Citation1973b), Latin America (Chu, Citation1983; Chung, Citation1982; Coelho et al., Citation2016; Enfield, Citation1996; Enfield & Alfaro, Citation1999; Grimm, Citation2011; Grimm & Zilli, Citation2009; Magana et al., Citation1999; Markham & McLain, Citation1977; Moron et al., Citation1995; Moura & Shukla, Citation1981; Namias, Citation1972; Yoon & Zeng, Citation2010), East Asia (Guo, Citation1992; Park & Schubert, Citation1997; Simmonds et al., Citation1999; Xu & Zhang, Citation1983; Ye, Citation1981; Zhang & Zhou, Citation2015; Zhou & Yu, Citation2005), and India (Berlage, Citation1957; Bhalme et al., Citation1983; Bhalme & Mooley, Citation1980; Goswami, Citation1998; Kanamitsu & Krishnamurti, Citation1978; Keshavamurty & Awade, Citation1974; Krishnan et al., Citation2006, Citation2009; Mishra et al., Citation2019; Raman & Rao, Citation1981; Ramaswamy, Citation1962, Citation1976; Sikka, Citation1980; Walker, Citation1923, Citation1924, Citation1928, Citation1937; Walker & Bliss, Citation1930, Citation1932). The above case studies provided detailed analysis of the physical processes associated with the development of individual drought events, which has led to interesting new ideas and new hypothesis on the underlying physical mechanisms. As just one example, the 1988 North American drought, which caused $60 billion damage, has been examined extensively. In one of the earliest studies of that drought, Trenberth et al. (Citation1988) found strong anticyclonic conditions and a northward displaced jet stream in the upper atmosphere over North America throughout this period were part of a distinctive wavetrain that emanated from the tropical Pacific. They further found that anomalies associated with the displaced ITCZ can force an anomalous wavetrain across North America similar to that observed. They proposed that the tropical Pacific SST anomalies are a notable (but not the sole) external forcing of the patterns. However, the generality of such mechanisms needs to be confirmed by looking more broadly across an ensemble of drought events, and carrying out additional modelling studies. In fact, Schubert et al. (Citation2009) provide evidence from simulations with an ensemble of atmospheric general circulation models (AGCMs) forced by idealized SST, that the precipitation deficits associated with droughts such as the one that occurred over the U.S. Great Plains during 1988, tend to be associated with cold tropical Pacific SSTs and warm tropical Atlantic SSTs, with the opposite (warm tropical Pacific SSTs and cold tropical Atlantic SSTs) true for wet conditions (see also next section).
With the advances in global precipitation datasets, SST analysis and atmospheric reanalysis, climatology and composites of droughts have been presented for different continents, such as North America (Andreadis et al., Citation2005; Karl & Koscielny, Citation1982; Seager & Hoerling, Citation2014), Europe (Briffa et al., Citation1994; Schubert et al., Citation2014; Spinoni et al., Citation2015), Africa (Nicholson et al., Citation2012; Rodriguez-Fonseca et al., Citation2011), South America (Grimm, Citation2011; Grimm & Zilli, Citation2009; Marengo & Espinoza, Citation2016), Asia (Mishra et al., Citation2019; Schubert et al., Citation2014; Wang et al., Citation2011), and the whole globe (Dai, Citation2011; Dai et al., Citation1998; Sheffield et al., Citation2009). These composite studies provided statistically robust results on the physical processes and physical mechanisms, which are reviewed below. Long-term ensemble climate model experiments further help to decompose the physical processes and feedbacks, which cannot be easily isolated in observational analysis.
The proposed physical mechanisms for droughts include (1) SST-driven teleconnections, (2) atmospheric internal dynamics, and (3) land-atmosphere feedback. Generally, droughts in the tropics and subtropics are better correlated with SST anomalies, while droughts in the mid-latitudes and high latitudes are more related to atmospheric internal dynamics with weaker but nevertheless important ties to remote SST anomalies. Land-atmosphere feedbacks often act in tandem with the other mechanisms leading to longer and/or more extreme events. Each of these mechanisms will be discussed in more detail below.
b SST-Driven Teleconnections
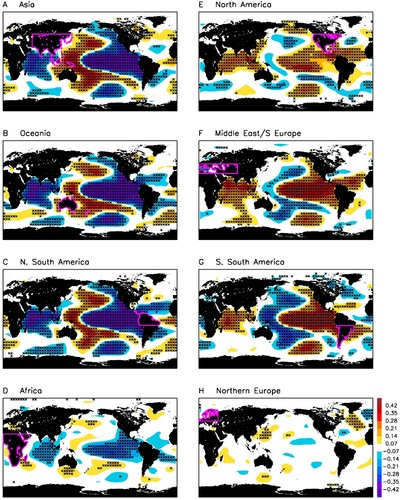
The first mechanism is SST-driven teleconnections. Following the methods of Schubert et al. (Citation2016), shows the correlations of the 2–10-year filtered monthly global SST anomalies in the past 116 years (1901–2016) from the ERSST dataset (Huang et al., Citation2017) with the 2–10-year filtered area-averaged precipitation anomalies from the GPCC dataset (Schneider et al., Citation2016) for (a) Asia, (b) Oceania, (c) northern South America, (d) Africa, (e) North America, (f) Middle East/southern Europe, (g) southern South America, and (h) northern Europe. Black stars denote the grids with correlation coefficient above the 95% confidence level. Magenta lines denote the region for precipitation averaging. The interannual precipitation anomalies over Asia are significantly correlated with a negative ENSO SST pattern in the Pacific Ocean, and a negative Indian Ocean Dipole (IOD; Saji et al., Citation1999; Webster et al., Citation1999) pattern in the tropical Indian Ocean (a). The precipitation anomalies over Oceania are associated with a negative ENSO SST pattern in the Pacific Ocean, basin-wide cooling in the tropical Indian Ocean, cooling symmetric to the equator in the tropical Atlantic Ocean, and warming in the South Atlantic Ocean (b). The precipitation anomalies over northern South America are associated with very similar global SST patterns as Oceania (c). The precipitation anomalies over Africa are associated with negative SST anomalies in the tropical central/eastern Pacific and the tropical Indian Ocean (d). The precipitation anomalies over North America are associated with a positive ENSO SST pattern in the Pacific Ocean, warming in the Atlantic warm pool (Wang & Enfield, Citation2001; C. Wang, Enfield, et al., Citation2006), and basin-wide warming in the tropical Indian Ocean (e). The precipitation anomalies over Middle East and southern Europe are associated with very similar global SST patterns as North America but with stronger correlations (f). The precipitation anomalies over southern South America are also associated with very similar SST patterns as North America in the Pacific and Indian Oceans with stronger correlations, but different SST patterns in the Atlantic Ocean with warming in the South Atlantic Ocean (g). The precipitation anomalies over northern Europe are associated with a dipole SST pattern in the North Atlantic Ocean and warming in the northwest Pacific Ocean (h). Overall, the wet years over Asia, Oceania, northern South America and Africa are associated with La Nina in the Pacific Ocean and general cooling in the tropical Indian Ocean, while the wet years over North America, Middle East, southern Europe and southern South America are associated with El Nino in the Pacific Ocean and general warming of the Indian Ocean. Note that basin-wide warming (cooling) of the tropical Indian Ocean occurs in the summer following the peak of El Nino (La Nina).
Fig. 5 Correlation of the 2–10-year filtered monthly global SST anomalies in the past 116 years (1901–2016) from the ERSST dataset with the 2–10-year filtered monthly area-averaged precipitation anomalies from the GPCC dataset for (a) Asia, (b) Oceania, (c) northern South America, (d) Africa, (e) North America, (f) Middle East/southern Europe, (g) southern South America, and (h) northern Europe. Black stars denote the grids with correlation coefficient above the 95% confidence level. Magenta lines denote the region for precipitation averaging.
An interesting question is what the typical spatial scale of droughts is. When presenting the precipitation or drought index time series, the choice of the region to average is often arbitrary or based on continents or administrative regions. An objective method for identifying the spatial scale of droughts is the EOF analysis, which can break the continent-averaged precipitation into the leading modes of droughts. Rotation of EOF analysis could further alleviate the artificial effect of mathematical orthogonality. EOF analysis and rotated EOF analysis have been applied to Africa (Rodriguez-Fonseca et al., Citation2011), South America (Grimm, Citation2011; Grimm & Zilli, Citation2009), North America (Karl & Koscielny, Citation1982; Seager & Hoerling, Citation2014), and Europe (Briffa et al., Citation1994; Schubert et al., Citation2014). The spatial scales of the interannual droughts are generally larger than 2000 km (see and ).
Fig. 6 (a) The leading modes of interannual precipitation anomalies in Western African monsoon and their correlations with SST anomalies (from Rodriguez-Fonseca et al., Citation2011). (b) The leading modes of interannual precipitation anomalies in South America and their correlations with SST anomalies (from Grimm & Zilli, Citation2009).
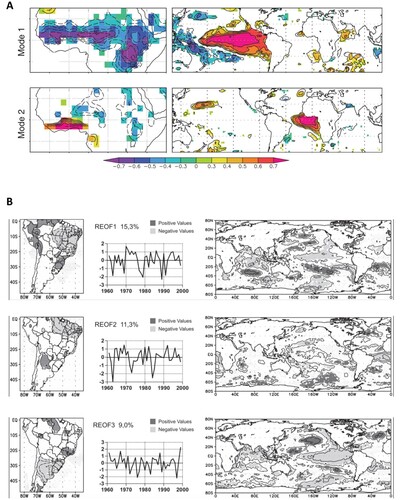
Fig. 7 (a) The leading EOF patterns of precipitation in North America (upper) and the correlation with SST anomalies (lower) (from Seager & Hoerling, Citation2014). (b) The temporal correlation between the monthly JJA 250-mb meridional wind and leading RPCs of combined 2-m temperature and precipitation in Europe (left) and the corresponding precipitation patterns (right) (from Schubert et al., Citation2014).
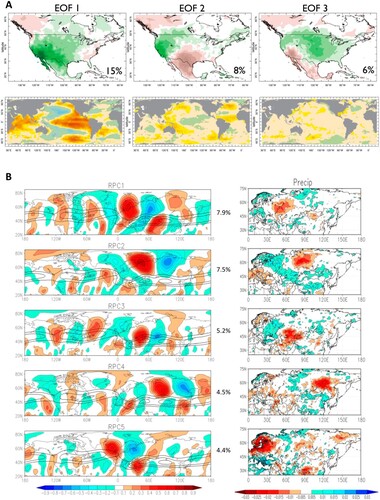
The SST anomalies play a key role in driving the regional droughts over the tropical and subtropical continents, such as Africa, South America, Oceania and Asia, but the SST-driven teleconnections become weaker over the mid-latitude and high-latitude continents, such as North America and Europe. When calculating the correlations of the leading modes with global SST anomalies, mode 1 of the interannual precipitation anomalies in west Africa is highly correlated with the ENSO, while mode 2 is correlated with the tropical Atlantic SST anomalies (a; Rodriguez-Fonseca et al., Citation2011). For South America, mode 1 and mode 3 are highly correlated with the ENSO, while mode 2 is related to the South Atlantic SST anomalies (b; Grimm & Zilli, Citation2009). For North America, an unrotated EOF analysis shows that mode 1 is strongly correlated with the ENSO, but mode 2 and mode 3 are not forced by SST anomalies (a; Seager & Hoerling, Citation2014). For northern Eurasia, none of the leading summer rotated EOF modes is significantly correlated with SST anomalies (b; Schubert et al., Citation2014).
Theoretical studies showed that teleconnections can be forced by SST anomalies in both the tropics and the extratropics (though less so). Land-sea temperature contrast was first proposed to drive the monsoons in the tropics (Halley, Citation1686; Holton, Citation1992; Hoskins & Rodwell, Citation1995; Rodwell & Hoskins, Citation1995; Wallace & Hobbs, Citation1977; Webster, Citation1987; Webster et al., Citation1998). The tropical atmospheric responses to tropical SST anomalies can be understood using the Gill model (Gill, Citation1980; Zhang & Krishnamurti, Citation1996). Diabatic heating symmetric to the equator generates a Kelvin wave response to the east and a Rossby wave response to the west, while heating anti-symmetric about the equator produces a mixed Rossby-gravity wave and a Rossby wave close to the heating. Zhang and Krishnamurti (Citation1996) showed that a linear sum of the symmetric and anti-symmetric heating responses can explain quite well the observed monthly tropical circulation. The extratropical atmospheric response to SST forcing is characterized by propagation of Rossby waves (Bjerknes, Citation1937; Bolin, Citation1950; Charney & Eliassen, Citation1949; Held et al., Citation1985; Hoskins & Karoly, Citation1981; Rossby, Citation1939; Smagorinsky, Citation1953; see reviews by Held, Citation2019; Trenberth et al., Citation1998). The Rossby waves tend to propagate through the westerly waveguides and thus are very sensitive to seasonal mean state of westerly flow (Ambrizzi et al., Citation1995; Ambrizzi & Hoskins, Citation1997; Hoskins & Ambrizzi, Citation1993). The global distribution of Rossby waveguides and preferred propagation paths have been shown by Ambrizzi et al. (Citation1995) for JJA, and by Hoskins and Ambrizzi (Citation1993) for DJF. The Rossby waveguides are basically the jet streams, with the warm season hemisphere having one subtropical jet while the cold season hemisphere having a subtropical jet and a subpolar jet. The preferred propagation paths of Rossby waves connect the tropics with the extratropics. For example, in DJF, SST anomalies in the tropical Pacific force a wave train similar to the Pacific-North American Pattern (Hoskins & Karoly, Citation1981), while SST anomalies in Indian Ocean drive a pattern heavily projected onto the North Atlantic Oscillation pattern (Hoerling et al., Citation2004). SST anomalies in the North Atlantic force a dipole between Greenland and Europe (Kushnir & Held, Citation1996), whereas SST anomalies in the North Pacific drive a dipole between Aleutian low and Hawaiian high (Kushnir et al., Citation2002), which is quite similar to the North Atlantic case. As shown in b, over most of the mid-latitude and high-latitude continents, the largest climatological precipitation occurs in the warm season when background westerly flow is weaker, leading to a weaker teleconnection driven by SST forcing, which may explain the weaker SST correlations for droughts over northern Europe (h and b). However, over some of the subtropical continents such as the western United States, southeastern United States, Middle East and southern Europe, the largest climatological precipitation occurs in the cold season when background westerly flow (the subtropical jet) is stronger, leading to strong teleconnections driven by SST forcing (e, f).
The dominant interannual mode of the global climate system is the ENSO, whose discovery was stimulated by the 1875–1878 Great Drought and resultant Global Famine, which killed more than 50 million people around the world (Blanford, Citation1884; Hildebrandsson, Citation1897; Lockyer & Lockyer, Citation1902; Walker, Citation1923). a summarizes the observed teleconnections of ENSO to the extratropics, tropical Indian and Atlantic Oceans, tropospheric zonal mean circulation and stratospheric circulation. El Niño drives the positive barotropic PNA pattern to northern hemisphere extratropics leading to a negative NAO (Horel & Wallace, Citation1981; Li & Lau, Citation2012), the positive barotropic PSA pattern to southern hemisphere extratropics affecting the Antarctic circumpolar wave (Karoly, Citation1989; Peterson & White, Citation1998), and the positive PJ/AEP pattern to east Asia which is a highly populated region (Nitta, Citation1986). Within the tropics, El Niño suppressed the Walker circulation and drives teleconnections to tropical Indian and Atlantic Oceans through atmospheric bridge, ocean dynamics and local air–sea feedbacks, leading to SST warming 3–6 months after the eastern Pacific warming (Klein et al., Citation1999). The Indian Ocean warming in turn serves as a heat capacitor to enhance the PJ/EAP pattern (Yang et al., Citation2007). In addition to the basin-wide warming, ENSO is also linked to the dipole modes such as IOD (Ashok et al., Citation2003) and AMM (Enfield & Mayer, Citation1997). El Niño enhances the tropospheric Hadley circulation and Ferrel circulation in certain seasons (Feng & Li, Citation2013; Oort & Yienger, Citation1996), and the stratospheric Brewer-Dobson circulation which leads to colder temperature and reduced ozone in tropical lower stratosphere, but warmer temperature and enhanced ozone in polar vortex region (Randel et al., Citation2009; Randel & Cobb, Citation1994). El Niño weakens the polar vortices in both hemispheres, while the northern polar vortex further affects climate in Europe by downward control (Domeisen et al., Citation2019; van Loon & Labitzke, Citation1987).
Fig. 8 (A) Schematic depiction of global teleconnections of ENSO. Walker circulation is represented by dashed cells. The PNA and PSA patterns are illustrated by centres of geopotential height anomalies and grey arching arrow towards North and South America, respectively (red – positive geopotential anomaly; blue – negative geopotential anomaly). The East Asia–Pacific (EAP) pattern or Japan – Pacific (JP) pattern is indicated by orange (positive) and light blue (negative) centres of sea level pressure. The Northwest Pacific Anticyclone (NWP AC) is represented by the orange circle. The ‘capacitor effect’ is represented by purple dashed arrow. Shading in the oceans: Sea surface temperature anomalies (red – warm, blue – cool). Shading over land: precipitation anomalies (brown – dry, green – wet). A positive Indian Ocean Dipole (IOD+) event can co-occur with El Niño in austral spring. An Indian Ocean Basin-wide warming (IOBW) and a tropical North Atlantic (tNA) warming can develop during and after El Niño’s peak. The tropical Atlantic can exhibit a positive Atlantic Meridional Mode pattern (AMM+). The zonal mean circulation and El Niño teleconnections via stratospheric pathway are illustrated by arrows on the left side of the schematic. (B) Schematic depiction of the observed physical mechanisms leading to the switch between El Niño and La Niña (from Lin & Qian, Citation2019b).
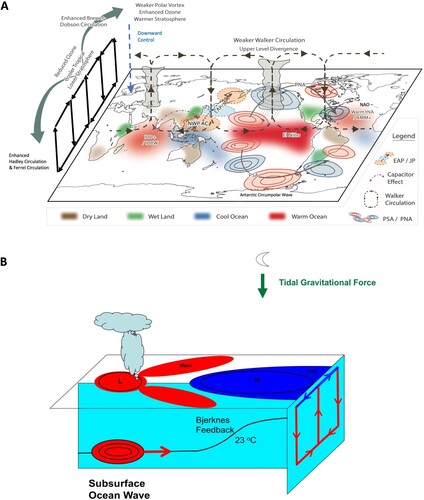
What drives the ENSO? Many ENSO theories have been developed, all involving ocean-atmosphere feedbacks. The most important feedback is the SST gradient-trade wind feedback discovered by Bjerknes (Citation1969), with the SST gradient along the equator driving the Walker circulation, and the Walker circulation, in turn, enhancing the SST gradient by forcing equatorial ocean upwelling in the eastern Pacific cold tongue. In addition to the Bjerknes feedback, other feedback mechanisms also play important roles in the Walker Circulation and the ENSO (Lin, Citation2007), such as the SST-latent heat flux feedback (Wallace, Citation1992) and the SST-shortwave flux feedback (Ramanathan & Collins, Citation1991). The switch between El Nino and La Nina has been linked to the ocean equatorial waves (e.g. Picaut et al., Citation1997; Suarez & Schopf, Citation1988; Weisberg & Wang, Citation1997), or recharge of ocean heat content (Jin, Citation1997), or stochastic forcings (e.g. Lau, Citation1985; Penland & Sardeshmuhk, Citation1995). Recently, Lin and Qian (Citation2019b) found that the switch between El Niño and La Niña is caused by a subsurface ocean wave propagating from the western Pacific to the central and eastern Pacific and then triggering development of SST anomaly. Further analysis of Earth's angular momentum budget and NASA's Apollo Lunar Laser Ranging Experiment suggests that the subsurface wave is likely driven by lunar tidal gravitational force (b).
ENSO SST anomalies often force strong global impacts in precipitation. Global climate models forced by the observed SST anomalies generally could reproduce the observed precipitation anomalies over the tropical and subtropical continents, but tend to underestimate the precipitation anomalies over the mid-latitude and high-latitude continents, although inter-model differences exist. Schubert et al. (Citation2016) reviewed the SST-forced teleconnections associated with droughts in eight regions around the world (a). The synthesis is primarily based on regionally focused articles submitted to the Global Drought Information System (GDIS) collection together with new results from a suite of atmospheric general circulation model experiments intended to integrate those studies into a coherent view of drought worldwide. On interannual time scales, the preeminence of ENSO as a driver of meteorological drought throughout much of the Americas, eastern Asia, Australia, and the Maritime Continent is well established, whereas in other regions (e.g. Europe, Africa, and India), the response to ENSO is more ephemeral or nonexistent. Northern Eurasia, central Europe, and central and eastern Canada stand out as regions with few SST forced impacts on precipitation on interannual time scales. Many AGCMs could simulate well the precipitation anomalies over different continents. However, some big drought events remain difficult to simulate, such as the 1930s Dust Bowl in North America (Seager, Kushnir, et al., Citation2008). Moreover, intercomparisons of AGCMs’ AMIP experiments showed that inter-model differences exist. Tippett (Citation2006) compared seven AGCM simulations of Sahel precipitation, and found that the models tend to simulate better decadal variability than interannual variability of Sahel precipitation. Mohino et al. (Citation2011) evaluated the AMIP simulations of five AGCMs and found that not all models were able to reproduce the observed negative link between rainfall over the Sahel and El Nino-like anomalies in the Pacific. When the AGCMs are coupled to the OGCMs, the model biases become larger. Ukkola et al. (Citation2018) evaluated the historical simulations (1950–2014) for 20 coupled models from the Coupled Model Intercomparison Project (CMIP5), and found that at the global scale, the coupled models agree well on most precipitation drought metrics, but 1980systematically underestimated precipitation drought intensity compared to observations.
Fig. 9 (a) Background map shows the measure of impact of the prescribed SSTs on the precipitation. The inset maps show the correlations between the area-averaged precipitation with SST. All results are for 1979–2011 based on 60 ensemble members: 12 AMIP simulations for five models (from Schubert et al. Citation2016). (b) Global impacts of the ENSO lifecycle (from Lin & Qian, Citation2019a).
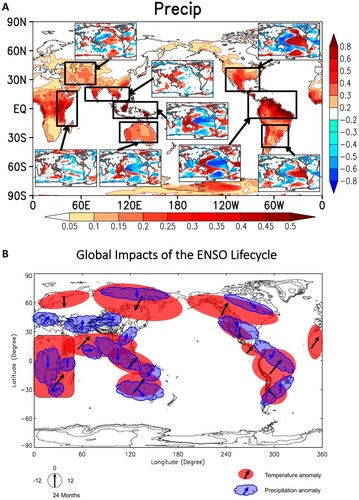
The observed impacts of ENSO on global continental precipitation were first studied in the s by Ropelewski and Halpert (Citation1986, Citation1987, Citation1989) using the World Monthly Surface Station Climatology (WMSSC) dataset compiled by the National Center for Atmospheric Research (NCAR), which were summarized later by the review of Trenberth et al. (Citation1998). Recently, Lin and Qian (Citation2019a) demonstrate a new picture of the global impacts of ENSO throughout its whole lifecycle based on the latest satellite, in situ and reanalysis datasets (b). The ENSO lifecycle significantly affects precipitation over the tropical and subtropical continents, and also affects precipitation over north Russia and north Canada. In general, the warm phase of ENSO is associated with dry anomalies over the tropical continents such as the west Africa, southeast Asia, Australia and tropical South America, wet anomalies over the subtropical continents such as the Middle East, central Asia, subtropical North America and subtropical South America, and dry anomalies over high-latitude continents such as north Russia and north Canada. The global impacts of the cold phase generally mirror those of the warm phase. This tri-belt seasaw among tropical continents, subtropical continents and high-latitude continents is likely linked to the ENSO-driven response of the global zonal mean atmospheric circulation, since the tropical belt is the ascending branch of the Hadley Cell while the subtropical belt is the descending branch of the Hadley cell and Ferrel cell, and the high-latitude belt is the ascending branch of the Ferrel cell and polar cell.
c Atmospheric Internal Dynamics
The second mechanism is atmospheric internal dynamics including monsoon dynamics (Chao & Chen, Citation2001a; Ramage, Citation1971; Riehl, Citation1954, Citation1979; Schneider & Bordoni, Citation2008; Sikka & Gadgil, Citation1980; Simpson, Citation1921; Trenberth et al., Citation2000), ITCZ dynamics (Bacmeister et al., Citation2006; Chao, Citation2000; Chao & Chen, Citation2001b, Citation2004; Charney, Citation1969, Citation1971; Holton et al., Citation1971; Lindzen, Citation1974; Schneider et al., Citation2014), Hadley circulation dynamics (Held & Hou, Citation1980; Hess et al., Citation1993; Numaguti, Citation1993; Plumb & Hou, Citation1992; Raymond, Citation2000; Schneider, Citation1977; Schneider & Lindzen, Citation1977), and extratropical Rossby wave dynamics (Schubert et al., Citation2011, Citation2014). Simpson (Citation1921) first pointed out that land-sea temperature contrast cannot explain some observed key features of the monsoon: India has a much higher surface air temperature in May before the monsoon starts than in July when monsoon is at its peak, and the average temperature is much greater in dry years than in wet years. The northwest India, which is the hottest part of the country, does not get any precipitation during monsoon season. Trenberth et al. (Citation2000) conducted a complex EOF analysis of the global divergent circulation and found a global monsoon mode which accounts for 60% of the variance. The global monsoon mode dominates the Hadley circulation, the Pacific Walker circulation, the Americas-Atlantic Walker circulation, and the Walker-type circulation over Asia, Middle East, North Africa, and the Indian Ocean. Now it is well recognized that monsoons are related to shift of global ITCZ and Hadley circulation.
For the extratropics, Schubert et al. (Citation2011, Citation2014) for example found that summertime stationary Rossby waves play a key role in the development of droughts, flooding and heat waves, such as the 1988 US drought, the 1993 US flooding, the 2003 European heat waves, and the 2010 Russian heat waves. They show up as the leading modes of rotated EOF of monthly North Hemisphere surface temperature and precipitation (b). At intraseasonal time scales, the leading modes account for more than 30% of the precipitation variability and more than 60% of the surface temperature variability over the U.S. northern Great Plains, parts of Canada, Europe, and Russia (Schubert et al., Citation2011). The Rossby waves are guided by the mean-state jet streams. Model experiments revealed that the Rossby wave forcing is dominated by submonthly vorticity transients.
d Land-Atmosphere Feedback
The third mechanism is land-atmosphere feedback. Land-atmosphere feedback studies were pioneered by Brooks (Citation1928), Newell (Citation1971) and Charney (Citation1975), Charney et al. (Citation1975). The proposed physical processes include feedbacks through albedo (Charney, Citation1975; Charney et al., Citation1975, Citation1977; Sud & Fennessy, Citation1982), surface roughness (Sud & Smith, Citation1985), soil moisture (Guo et al., Citation2006; Koster et al., Citation2003, Citation2004, Citation2006; Oglesby & Erickson III, Citation1989; Shukla & Mintz, Citation1982; Sud & Fennessy, Citation1984; Walker & Rowntree, Citation1977), and vegetation (B. I. Cook et al., Citation2009; Dirmeyer, Citation1994; Meng et al., Citation2014; Pielke et al., Citation1998; W. Pitman et al., Citation2009, Citation2012; Schubert et al., Citation2004a; Zeng et al., Citation1999; Zeng & Neelin, Citation2000; Wang, Anderson, et al., Citation2006). Charney (Citation1975) conducted GCM experiments with different prescribed surface albedo in the Sahara region, and found that an increased albedo causes decreased precipitation. He proposed that decreased plant cover during drought will lead to increased albedo and then be reinforced by decreased precipitation. This positive land-atmosphere feedback could initiate or perpetuate a drought. Koster et al. (Citation2004) used a dozen climate models to identify the key regions on Earth where precipitation is affected by soil moisture anomalies during Northern Hemisphere summer (a). They found that the major sensitive regions are the central Great Plains of North America, the Sahel, equatorial Africa, and India. There are secondary regions over South America, central Asia, and China. The major sensitive regions are in the transition zones between wet and dry climates. They proposed that precipitation is not sensitive to soil moisture either in wet regions where evaporation is controlled by radiation, or in dry regions where evaporation is too small to affect precipitation. In the transition zones, however, evaporation is still sensitive to soil moisture but high enough to affect boundary-layer moisture, and boundary-layer moisture can trigger moist convection, which connect soil moisture to precipitation. Zeng et al. (Citation1999) developed a theoretical model of Sahel to show that interactive vegetation and associated land-surface feedback enhance precipitation variability at interannual and interdecadal time scales. They found that vegetation changes associated with changes in rainfall during the multidecadal drying period from the 1950s to the 1980s.
Fig. 10 (a) The land-atmosphere coupling strength diagnostic for boreal summer averaged across the 12 models participating in GLACE. Insets are areally averaged coupling strengths for the 12 individual models over the outlined, representative hotspot regions (from Koster et al., Citation2004). (b) Relationship of NLH to SWet in the 16 ensemble members of nine GCMs at the grid box encompassing the ARM Central Facility. Solid blue line is fit through the means of 20 bins of equal number of points. Red points show the ensemble member used as basis for fixed SWet integrations (from Dirmeyer et al., Citation2006).
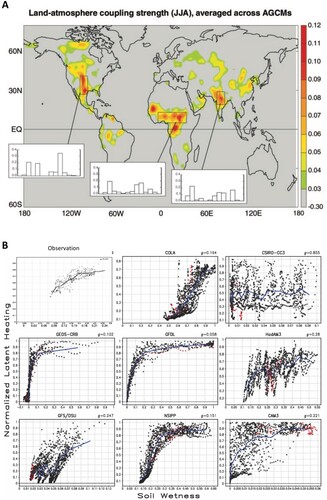
Simulations of land-atmosphere feedbacks are strongly affected by the land surface schemes in climate models (Deardorff, Citation1978; Dickinson et al., Citation1986; Manabe, Citation1969; Sellers et al., Citation1986; see reviews by Avissar & Verstraete, Citation1990; Betts et al., Citation1996; Peters-Lidard et al., Citation2018; Pitman, Citation2003; Randall et al., Citation2019). It is important to evaluate the model simulations using observations (Dirmeyer, Citation2011; Dirmeyer et al., Citation2006, Citation2016, Citation2018). Dirmeyer et al. (Citation2006) examined the local covariability of key atmospheric and land surface variables both in models and in observations from the Atmospheric Radiation Measurement (ARM) stations (b). Most models cannot reproduce well the observed relationships between surface and atmospheric state variables and fluxes, suggesting that these models do not capture correctly the land-atmosphere feedbacks. They found systematic biases in surface air temperature and humidity which may contribute to the unrealistic surface flux sensitivities. The multimodel ensemble mean generally performs better than most or all of the individual models. The models also show a large scatter in regional precipitation characteristics, but the multimodel ensemble mean is remarkably accurate.
Physics-based evaluations of climate models are important for understanding the contributions of the three physical mechanisms to droughts. Modelling studies accessing the relative contributions of the different mechanisms often compare only with observed precipitation, which is the end product of all the physical processes. When model precipitation matches well with the observed precipitation, it does not guarantee that the physical processes are correct. For example, the correct model precipitation may come from an overestimation of SST response offset by an underestimation of land-atmosphere feedbacks. Therefore, it is important to evaluate step-by-step the whole chain of physical processes, as well as the strength of the feedbacks.
3 Mega-droughts
a Overview
Due to their longer durations, the multi-decadal- to centennial-scale mega-droughts have more profound impacts on human society and human history. Multi-decadal- to centennial-scale mega-droughts were linked to the collapse of the Old Kingdom in Egypt around 4200 cal BP (b, Barta & Bezdek, Citation2008; Marriner et al., Citation2012), the collapse of Western Roman Empire in Europe during the Migration Period in 300–400 AD (a; Buntgen et al., Citation2011), the collapse of the Tang, Yuan, and Ming Dynasties in China (b; Zhang et al., Citation2008), and the development and disintegration of Maya political systems in North America (Evans et al., Citation2018; Kennett et al., Citation2012). Rapid progress is being made in recent years in research on mega-droughts thanks to the advances in high-resolution paleoclimate records, paleoclimate field reconstructions, and paleoclimate reanalysis.
High-resolution paleoclimate data with annual to decadal resolutions are needed for studying the mega-droughts. Tree rings provide nice records of precipitation for the common era, while speleothem and ice core provide good histories for Holocene and late Quaternary. Quantitative tree ring studies began in the late nineteenth century and early twentieth century (Abbot, Citation1936; Douglass, Citation1909, Citation1914; Huber, Citation1935; Kapteyn, Citation1914; Keen, Citation1937; Schulman, Citation1947; Shvedov, Citation1892). Shvedov (Citation1892) presented a pioneering precipitation analysis using two trees in Russia, and found a 3–9 year cycle in precipitation, making it possible to correctly predict the droughts in 1882 and 1891. Douglass (Citation1914) also developed a method of estimating rainfall from tree ring data. Starting from the 1950s, radioisotopic dating and stable isotope analysis were applied to speleothems (Broecker et al., Citation1960; Orr, Citation1952, Citation1953) and ice cores (Coachman et al., Citation1958; Dansgaard et al., Citation1969; Langway Jr. et al., Citation1965; Scholander et al., Citation1962).
The past three decades (1990–2020) witnessed a major increase in high-resolution paleoclimate datasets. Numerous high-quality high-resolution datasets have been developed for Greenland (Alley, Citation2000; NGRIP members, Citation2004; Vinther et al., Citation2008, Citation2010), Antarctica (Abram et al., Citation2013; Steig et al., Citation2013), Africa (Scroxton et al., Citation2017; Shanahan et al., Citation2009; Thompson et al., Citation2002; Voarintsoa et al., Citation2017), Asia (Eichler et al., Citation2009; Griffiths et al., Citation2016; Kaspari et al., Citation2007; Sinha, Berkelhammer, et al., Citation2011; Sinha, Stott, et al., Citation2011; Tan et al., Citation2003, Citation2009; Thompson et al., Citation1997, Citation2000; Treydte et al., Citation2006; Wang et al., Citation2005), Australia (Denniston et al., Citation2017; Saunders et al., Citation2013), Europe (Baker et al., Citation2011; Edwards et al., Citation2017; Fohlmeister et al., Citation2013; Isaksson et al., Citation2005; Kinnard et al., Citation2011; Voronin et al., Citation2008), North America (Anderson, Citation2011; Asmerom et al., Citation2013; Bird et al., Citation2017; Buhay et al., Citation2009; Edwards et al., Citation2008; Kennett et al., Citation2012; Kinnard et al., Citation2011; Lachniet et al., Citation2017; McCabe-Glynn et al., Citation2013; Medina-Elizalde et al., Citation2010; Steinman et al., Citation2012), South America (Bird et al., Citation2011; Elbert et al., Citation2013; Kanner et al., Citation2013; Kellerhals et al., Citation2010; Novello et al., Citation2016; Reuter et al., Citation2009; Thompson et al., Citation2013; Wortham et al., Citation2017), Indian Ocean (Doose-Rolinski et al., Citation2001; Munz et al., Citation2015), tropical western Pacific (Maupin et al., Citation2014; Partin et al., Citation2013), Northwestern Pacific (Isono et al., Citation2009), North Atlantic (Cronin et al., Citation2010; Cunningham et al., Citation2013; Eirìksson et al., Citation2006; Keigwin, Citation1996; Reynolds et al., Citation2016; Sicre et al., Citation2008; van Hengstum et al., Citation2015), and tropical Atlantic (Black et al., Citation2007; Kilbourne et al., Citation2008; McGregor et al., Citation2015). The datasets have been summarized by a series of reviews (Jones et al., Citation2009; Ljungqvist, Citation2009; Ljungqvist et al., Citation2012, Citation2016; PAGES Citation2k Consortium, Citation2017).
Using the high-resolution datasets, paleoclimate field reconstructions and paleoclimate reanalysis have been developed to produce spatial distribution of temperature and hydroclimate (Cook & Jacoby, Citation1977; Fritts, Citation1965; Stockton & Meko, Citation1975). Temperature reconstructions have been generated for Europe (Briffa et al., Citation1990; Ljungqvist, Seim, et al., Citation2019; Luterbacher et al., Citation2016), Asia (Cook, Krusic et al., Citation2013; Zhang et al., Citation2018), North America (Anchukaitis et al., Citation2013; Trouet et al., Citation2013), Australia (Gergis et al., Citation2016), Arctic (Helama et al., Citation2012; Werner et al., Citation2018), and northern hemisphere (Briffa, Citation2000; Büntgen et al., Citation2021; Cook, Esper et al., Citation2004; D'Arrigo et al., Citation2006; Esper et al., Citation2002, Citation2012; Guillet et al., Citation2017; Jones et al., Citation1998, Citation2009; Ljungqvist, Citation2010; Mann et al., Citation1999; Moberg et al., Citation2005; Schneider et al., Citation2015; Stoffel et al., Citation2015; Wilson et al., Citation2016). Drought and precipitation have been reconstructed for North America (B. I. Cook et al., Citation2018; E. R. Cook et al., Citation1999, Citation2007, Citation2020; Cook, Woodhouse et al. Citation2004; E. R. Cook, Seager, et al., Citation2010; D'Arrigo & Jacoby, Citation1991; Fritts, Citation1965; Routson et al., Citation2011; Schulman, Citation1947; Stahle et al., Citation1985, Citation2000; Stockton & Meko, Citation1975; Weakly, Citation1965), Asia (Borgaonkar et al., Citation2010; Buckley et al., Citation2010; E. R. Cook, Anchukaitis, et al., Citation2010; Sano et al., Citation2009; Sinha et al., Citation2007; Sinha, Berkelhammer, et al., Citation2011; Sinha, Stott, et al., Citation2011; Shi et al., Citation2017, Citation2018), Australia (McGowan et al., Citation2012; Palmer et al., Citation2015), and Europe (Cook, Seager et al., Citation2015). The recent PAGES 2K consortium is the largest international effort in the history of paleoclimatology to reconstruct the climate history of the common era (Anchukaitis & McKay, Citation2014; PAGES Citation2k Consortium, Citation2017), which has led to the latest continent-scale temperature reconstructions (PAGES Citation2k Consortium, Citation2013) and the first generation of paleoclimate reanalysis such as the Last Millennium Reanalysis (LMR; Dee et al., Citation2016; Hakim et al., Citation2016; Tardif et al., Citation2019), Paleo Hydrodynamics Data Assimilation (PHYDA; Steiger et al., Citation2018), and comparison of multiple methods (Neukom et al., Citation2019; PAGES Citation2k Consortium, Citation2019). Hakim et al. (Citation2016) developed the LMR reanalysis using an “offline” data assimilation method, where static ensemble samples are extracted from existing CMIP5 climate-model simulations to serve as the prior estimate of climate variables. They used linear, univariate forward proxy system models that map climate variables to proxy measurements. They verified the reanalysis with modern instrumental datasets and found that the greatest skill is in the tropics. Tardif et al. (Citation2019) developed LMR version 2 based on the CCSM4 climate model simulations, an updated proxy database and improved seasonal regression-based forward models, which significantly improved surface air temperature and 500 mb geopotential height. Steiger et al. (Citation2018) developed the PHYDA reanalysis using the CESM climate model simulations and a data assimilation method especially aiming at reconstructions of hydroclimate. Neukom et al. (Citation2019) further derived global surface temperature fields for the past 2000 years using six different reconstruction methods.
Significant multi-decadal- to centennial-scale variability of temperature has been found widely in the high-resolution paleoclimate reconstructions and reanalyses. Significant multi-decadal- to centennial-scale variability of temperature was noted in individual paleoclimate records as early as in the 1960s (Dansgaard et al., Citation1969; Johnsen et al., Citation1970; Lamb, Citation1965), and later found in continental mean temperature reconstructions (Gergis et al., Citation2016; Ljungqvist, Seim, et al., Citation2019, Ljungqvist, Zhang, et al., Citation2019; PAGES Citation2k Consortium, Citation2013; Werner et al., Citation2018; Zhang et al., Citation2018), northern hemisphere mean temperature reconstructions (Cook, Esper et al., Citation2004; D'Arrigo et al., Citation2006; Esper et al., Citation2002, Citation2012; Guillet et al., Citation2017; King et al., Citation2021; Ljungqvist, Citation2010; Moberg et al., Citation2005; Schneider et al., Citation2015; Stoffel et al., Citation2015; Wilson et al., Citation2016) and global mean temperature reconstructions (PAGES Citation2k Consortium, Citation2019). For example, PAGES Citation2k Consortium (Citation2019) used seven different statistical and data assimilation methods to reconstruct global mean surface temperature for the past 2000 years based on all available high-resolution paleoclimate records around the world. The seven products consistently show strong multi-decadal- to centennial-scale variability that are coherent with one another (a).
Fig. 11 (A) Global mean surface temperature for the past 2000 years using 7 different reconstruction methods. Data are 30–200-year bandpass-filtered (from PAGES Citation2k Consortium, Citation2019). (B) Normalized area-averaged PDSI (z-scores) for Europe (OWDA), North America (NADA), and Asia (MADA) and northern hemisphere (NHDA). Data are low pass–filtered to emphasize variability that was >30 years in duration (from Cook, Seager et al., Citation2015). (C) Lake level of Lake Bosumtwi in West Africa measured by two paleoclimate proxies: δ18O (red) and Si intensity (black) (from Shanahan et al., Citation2009).
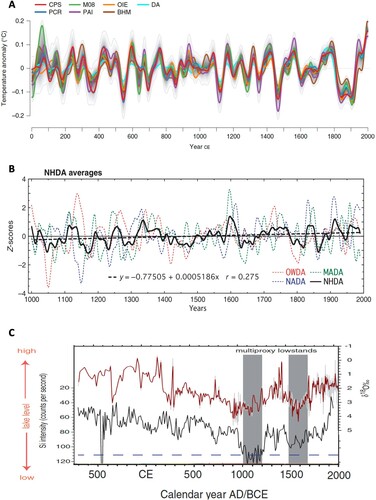
Multi-decadal- to centennial-scale mega-droughts have also been found in the high-resolution reconstructions of hydroclimate in the past 2000 years. Centennial-scale mega-droughts were first discovered by Stine (Citation1994). He studied tree ring records from California and Argentine Patagonia, and found that California's Sierra Nevada had extremely severe droughts for more than 200 years between 862 and 1074 (Stine #1 mega-drought) and for more than 140 years between 1122 and 1209 (Stine #2 mega-drought). During these droughts, runoff from the Sierra was much weaker than during any of the modern droughts in that region in the past 140 years. He also found similar drought conditions in Argentine Patagonia. Multi-decadal mega-droughts were first discovered by Stahle et al. (Citation2000). They analysed high-resolution tree-ring data and found significant multi-decadal mega-droughts in different regions of North America in the pre-industrial sixteenth century, as well as in the twentieth century. Drought conditions were prevalent throughout the sixteenth century over the Sierra Madre Occidental, Rocky Mountains, and Mississippi Valley, and also persisted from the 1540s to 1580s in Mexico, from the 1550s to 1590s over the Southwest, and from the 1570s to 1600s over Wyoming and Montana. The droughts of the sixteenth century exceeded the severity, persistence, and coverage of any drought witnessed in the United States during the period of instrumental meteorological or hydrological observation, which is consistent with the results of Woodhouse and Overpeck (Citation1998). Later many studies found strong multi-decadal- to centennial-scale variability of hydroclimate in Africa (Scroxton et al., Citation2017; Shanahan et al., Citation2009; Voarintsoa et al., Citation2017; Wassenburg et al., Citation2013), Asia (Buckley et al., Citation2010; Cook, Anchukaitis et al., Citation2010; Hao et al., Citation2016; Sankar et al., Citation2016; Sheppard et al., Citation2004; Shi et al., Citation2017, Citation2018; Sinha, Berkelhammer, et al., Citation2011; Sinha, Stott, et al., Citation2011; Tan et al., Citation2009; Treydte et al., Citation2006; Wang et al., Citation2005; Wu et al., Citation2009; Zhang et al., Citation2008), Australia (Palmer et al., Citation2015), Europe (Buntgen et al., Citation2011; Cook, Seager et al., Citation2015; Helama et al., Citation2009; Pauling et al., Citation2006), North America (Bird et al., Citation2017; Cook, Woodhouse et al., Citation2004; Cook et al., Citation2016; Evans et al., Citation2018; Fawcett et al., Citation2011; Kennett et al., Citation2012; Lachniet et al., Citation2017; McCabe-Glynn et al., Citation2013; Medina-Elizalde et al., Citation2010; O'Mara et al., Citation2019; Steinman et al., Citation2012; Thirumalai et al., Citation2018), South America (Campos et al., Citation2019; Kanner et al., Citation2013; Novello et al., Citation2016), the tropics (Griffiths et al., Citation2016; Lechleitner et al., Citation2017), the Northern Hemisphere (Asmerom et al., Citation2013; Ljungqvist et al., Citation2016), and the Southern Hemisphere (Scroxton et al., Citation2017). Cook, Seager et al. (Citation2015) compared the continental mean PDSI for Europe from the Old World Drought Atlas (OWDA), for North America from the North American Drought Atlas (NADA), for Asia from the Monsoon Asia Drought Atlas (MADA), and for the northern hemisphere from the Northern Hemisphere Drought Atlas (NHDA) (b). The continental mean PDSI time series have been normalized and converted to Z-scores, and are low pass–filtered to emphasize variability that was >30 years in duration. There is not any statistically significant trend in the regional mean PDSI for Europe, North America, Asia or the northern hemisphere, and the PDSI values in the industrial era are not significantly different from the pre-industrial values. On the other hand, All the regional mean PDSI time series show clear multi-decadal to centennial variability. This is also the case for the continental mean PDSI for Oceania (Palmer et al., Citation2015), which does not show any statistically significant trend, but shows substantial multi-decadal to centennial-scale variability. For Africa, Shanahan et al. (Citation2009) combined geomorphic, isotopic, and geochemical evidence from the sediments of Lake Bosumtwi, Ghana, to reconstruct natural variability in the African monsoon over the past three millennia (c). They found that intervals of severe drought lasting for periods ranging from decades to centuries are characteristic of the monsoon and are linked to natural variations in Atlantic temperatures. Thus the severe drought of recent decades is not anomalous in the context of the past three millennia, indicating that the monsoon is capable of longer and more severe future droughts.
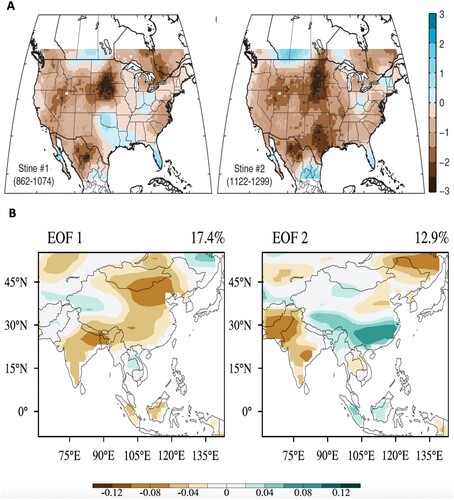
The spatial structure of the mega-droughts has been analysed using the reconstructed drought atlas for Europe (Cook, Seager et al., Citation2015), North America (Cook, Woodhouse et al., Citation2004; Stahle et al., Citation2016), Asia (Cook, Anchukaitis et al., Citation2010; Hao et al., Citation2016; Shi et al., Citation2017, Citation2018), Australia (Palmer et al., Citation2015), South America (Christie et al., Citation2011), and northern hemisphere (Ljungqvist et al., Citation2016). Cook, Seager et al. (Citation2015) found that Europe was significantly drier in the Medieval Climate Anomaly period than in the Little Ice Age period and the modern period. Cook et al. (Citation2016) presented the horizontal maps of North America for the famous centennial-scale Stine #1 mega-drought between 862 and 1074, and Stine #2 mega-drought between 1122 and 1209 (a), both of which were in fact pan-continent drought occurring during the Medieval Climate Anomaly and are much stronger than the modern droughts. They also showed the horizontal maps for the major multi-decadal mega-droughts between 966 and 985, 1271 and 1297, 1323 and 1350, 1435 and 1478 and 1568 and 1591, all of which centred in the central United States. The 1271–1297 mega-drought coincided with the abandonment of the Ancestral Puebloan native American settlement, while the 1323–1350 mega-drought coincided with the abandonment of the Cahokia native American settlement. Shi et al. (Citation2018) calculated the leading EOFs for Asian summer precipitation over the past 554 years, and found that the EOF1 represents a centennial mode with a pan-continent drought pattern, while the EOF2 represents an interdecadal mode with a tri-pole pattern among Pakistan/India, South China and southeast Siberia (b). Ljungqvist et al. (Citation2016) presented a reconstruction of Northern Hemisphere hydroclimate variability for the past 1200 years based on a network of 196 millennium-long proxy records. The century-mean drought maps show that the northern hemisphere was drier in the ninth century and twelfth century than in the twentieth century. They found that the strong seesaw patterns of moisture observed in modern instrumental records over the western USA, Mediterranean, and China have operated consistently in the past 1200 years. For the tropics and the Southern Hemisphere, Scroxton et al. (Citation2017) compared the centennial-scale variability of hydroclimate in different continents and found that they show good coherency. They suggested that the cause of this coherency could be related to symmetrical changes in continental sensible heating, or to a low frequency sea surface temperature climate mode.
Fig. 12 (A) Horizontal maps of PDSI for the Stine (Citation1994) #1 and #2 centennial-scale mega-droughts in North America (from Cook et al., Citation2016). (B) The first two EOFs of Asian summer precipitation for the past 554 years (from Shi et al., Citation2018).
Numerous observational studies found that multi-decadal- to centennial-scale mega-droughts are associated with ocean temperature anomalies and suggest that they are driven by ocean forcing. Mega-droughts in Africa are linked to natural variations in Atlantic ocean temperatures (Shanahan et al., Citation2009), the NAO (Wassenburg et al., Citation2013), latitudinal shifts of ITCZ (Voarintsoa et al., Citation2017), and oscillations of the Indian Ocean dipole (Scroxton et al., Citation2017). Mega-droughts in Asia are linked to the North Atlantic ice-rifting events – an index of the AMOC (Wang et al., Citation2005), the AMO (Sankar et al., Citation2016), and ENSO-like SST pattern in tropical Pacific (Griffiths et al., Citation2016). Mega-droughts in Australia are linked to the IPO (Palmer et al., Citation2015). Mega-droughts in Europe coincided with an ENSO-like pattern (Helama et al., Citation2009). Mega-droughts in North America are linked to the PDO (O'Mara et al., Citation2019; Steinman et al., Citation2012), SST anomalies in Kuroshio Extension (McCabe-Glynn et al., Citation2013), and the AMOC (Thirumalai et al., Citation2018). Mega-droughts in South America are linked to the zonal SST gradient in the Pacific Ocean (Kanner et al., Citation2013).
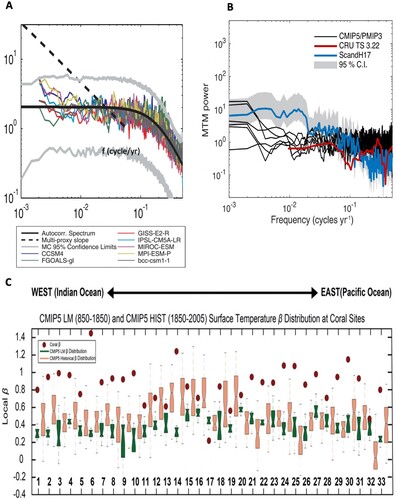
Many studies have found that the spectra of hydroclimate and temperature variability in instrumental and paleoclimate observations follow power-law scaling, in which the amplitude of variability increases at longer time scales (Ault et al., Citation2013, Citation2014; Huybers & Curry, Citation2006; Laepple & Huybers, Citation2014a, Citation2014b; Loope et al., Citation2020; Parsons et al., Citation2017; Pelletier & Turcotte, Citation1997). This scaling behaviour is often characterized by the exponent β in the power-law function relating climate variance to timescale. For example, Ault et al. (Citation2013) calculated the spectra of multiple PDSI datasets in western North America, and the composite multi-proxy slope is shown in a. Seftigen et al. (Citation2017) calculated the spectra of the standardized precipitation evapotranspiration index (SPEI) in Scandinavia from the ScandH17 reconstruction (b), while Parsons et al. (Citation2017) calculated the β value for 33 coral datasets in tropical Indian Ocean and tropical Pacific Ocean (c). Reconstructed thermohaline circulation from paleoclimate records also shows significant centennial-scale variability (Ayache et al., Citation2018).
Fig. 13 (A) North American spectral means for PDSI computed from CMIP5 Last Millennium (LM) simulations comparing with the multi-proxy slope (from Ault et al., Citation2013). (B) Spectra of the standardized precipitation evapotranspiration index (SPEI) in Scandinavia from CMIP5 LM simulations and CRU/ScandH17 observations. Gray shading shows the 95% confidence interval of the ScandH17 observation (from Seftigen et al., Citation2017). (C) Ocean temperature spectral slope β at the same locations calculated from coral records, CMIP5 LM simulations, and CMIP5 historical runs (1850–2015 CE) (from Parsons et al., Citation2017).
Global climate models driven by external forcings have significant difficulties in simulating the observed amplitude, timing and teleconnections of multi-decadal- to centennial-scale mega-droughts, as well as the observed multi-decadal- to centennial variability of ocean temperature. External forcings do have significant multi-decadal- to centennial-scale variability (Otto-Bliesner et al., Citation2016). Volcano forcing has both multi-decadal variability and centennial-scale variability, while solar forcing has a centennial-scale variability, although the greenhouse gases and land use change do not show multi-decadal- to centennial-scale variability. However, the volcano forcing and solar forcing often excite overly weak multi-decadal- to centennial-scale variability of hydroclimate in climate models (Ault et al., Citation2013; Loope et al., Citation2020; Seftigen et al., Citation2017). The model spectra of hydroclimate indices are generally red noise spectra with much smaller variance than observations at the multi-decadal to centennial time scales (a, b). Global climate models also have difficulties in reproducing the timing and duration of the observed mega-droughts in Africa (Klein et al., Citation2016), Asia (Fan et al., Citation2009), and North America (Coats et al., Citation2013; Coats, Smerdon, Cook, et al., Citation2015; Coats, Smerdon, Seager, et al., Citation2015; PAGES Hydro2k Consortium Citation2017; Parsons et al., Citation2017). For example, Hydro2k Consortium (Citation2017) compared the JJA PDSI over the American Southwest from the CMIP5/PMIP3 models with the observations. The observed five largest megadroughts all occurred during the Medieval Climate Anomaly (the gray bars), with the first four events not coincided with volcano eruptions. The climate models fail to capture the first four events. Moreover, global climate models produce overly weak teleconnections between mega-droughts and ocean temperature (Coats et al., Citation2013; Coats, Smerdon, Cook, et al., Citation2016; Coats, Smerdon, Karnauskas, et al., Citation2016; Stevenson et al., Citation2015). The model mega-droughts are stochastically generated by atmospheric internal variability and local land-atmosphere feedback. The models difficulties in simulating the observed amplitude, timing and SST-teleconnections of mega-droughts are likely associated with the models’ overly weak multi-decadal- to centennial-scale variability in ocean temperature (Laepple & Huybers, Citation2014a; Parsons et al., Citation2017). Laepple and Huybers (2014) compared 20 CMIP5 last millennium simulations with 33 coral, foraminifer, and alkenone records around the world oceans. They found that simulate SST variability that is systematically smaller than instrumental and proxy-based estimates. Discrepancies in variability are largest at low latitudes and increase with timescale, reaching two orders of magnitude for tropical variability at millennial timescales. Parsons et al. (Citation2017) compared with observations the β value in CMIP5 last millennium and history experiments for 33 coral sites in tropical Indian Ocean and tropical Pacific Ocean (c). The CMIP5 models significantly underestimate the β values in tropical Indian Ocean and tropical central/eastern Pacific Ocean. The overly weak ocean variability makes the continental mega-droughts overly weak and stochastically generated.
Unforced climate model experiments showed that the Atlantic Meridional Overturning Circulation (AMOC), which is part of the global deep ocean circulation – the thermohaline circulation, has intrinsic oscillations at multi-decadal to centennial timescales. Mysak et al. (Citation1993) used a 2D thermohaline ocean circulation model of the Atlantic Ocean, and found that 200–300-year period oscillations exist for a wide range of vertical and horizontal diffusivities. These oscillations are associated with propagating salinity anomalies accompanying the thermohaline circulation. Park and Latif (Citation2008) conducted a multimillenial control experiment of the Kiel Climate Model and found significant multi-decadal and centennial variability of the AMOC (a). The multi-decadal variability is similar to the observed AMO, which originates in the North Atlantic and goes to 3000 meters deep (b), while the multicentennial variability is driven in the Southern Ocean and extends to the ocean floor (c). The longer timescale of the multicentennial variability is likely associated with its larger spatial scale and involvement of deeper ocean volume. Both modes are associated with significant changes of sea ice extent. Delworth and Zeng (Citation2012) conducted a 4000-year control experiment of the GFDL CM2.1 climate model, and found a distinct multicentennial oscillation of surface air temperature over the entire Northern Hemisphere extratropics, but with strongest signals in the Atlantic and Arctic regions. This variability is driven by interhemispheric oscillations in AMOC oceanic heat transport, which is associated with propagation of salinity anomalies along the direction of AMOC. The salinity anomalies provide positive feedback to the AMOC. In short, the overly weak multi-decadal to centennial variability in forced climate model simulations suggest that volcano forcing and solar forcing are inefficient in exciting multi-decadal- to centennial-scale oscillations of the AMOC and the global thermohaline circulation.
Fig. 14 (a) Spectrum of meridional overturning circulation strength. (b) Multi-decadal composite of meridional overturning circulation. (c) Multi-centennial composite of meridional overturning circulation. (from Park & Latif, Citation2008).
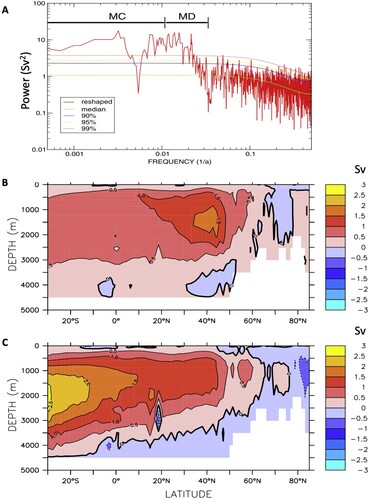
The AMOC and the global thermohaline circulation were discovered by Wust (Citation1935, 1936) and Clowes and Deacon (Citation1935), and its global structure was summarized by Gordon (Citation1986, Citation1991), Broecker (Citation1987, Citation1992), Rahmstorf (Citation2006) and Talley (Citation2013). Theoretical studies found that the AMOC and the global thermohaline circulation are driven by two physical mechanisms (see review by Kuhlbrodt et al., Citation2007): (1) the mixing-driven mechanism (Bjerknes, Citation1916; Huang, Citation1999; Jeffreys, Citation1925; Munk, Citation1966; Munk & Wunsch, Citation1998; Oort et al., Citation1994; Sandstrom, Citation1908, Citation1916), and (2) the wind-driven mechanism (Sloyan & Rintoul, Citation2001; Toggweiler & Samuels, Citation1993, Citation1995, Citation1998; Webb & Suginohara, Citation2001). Mixing is caused by tides, winds, and waves. Observations in recent decades revealed that tidal mixing is the leading component of ocean mixing, especially in the deep ocean (Egbert & Ray, Citation2000, Citation2003; Garrett, Citation2003; Koch-Larrouy et al., Citation2010, Citation2015; Ledwell et al., Citation2000; Loder & Garrett, Citation1978; Polzin et al., Citation1997; Ray & Susanto, Citation2016; Rudnick et al., Citation2003; Zaron & Egbert, Citation2006). Unfortunately, tidal mixing has not been well represented in most ocean models, which generally use an overly large diffusion to drive the AMOC and the global thermohaline circulation (see review by Kuhlbrodt et al., Citation2007). Right now the global ocean modelling community is installing tidal mixing into the global ocean models to replace the overly large diffusion.
The first generation of paleoclimate reanalysis makes it possible to study the global coherent structure and physical mechanisms of the multi-decadal to centennial mega-droughts. Steiger et al. (Citation2019) used the PHYDA reanalysis, in conjunction with radiative forcing estimates, to demonstrate that megadroughts in the American Southwest were driven by unusually frequent and cold central tropical Pacific SST excursions in conjunction with anomalously warm Atlantic SSTs and a locally positive radiative forcing. a shows the maximum entropy spectrum of global mean surface temperature from the LMR reanalysis for the past 2000 years. The spectrum demonstrates strong inter-centennial variability between 100 and 400 years and multi-decadal variability between 40 and 100 years. Similar results are found for the Nino3.4 SST anomaly (b) and north Atlantic SST anomaly (AMO index as defined by Enfield et al., Citation2001, c) from the LMR reanalysis. An independent deep ocean AMOC index from a paleoclimate ocean sediment record (Mjell et al., Citation2016) is also analysed, which also shows strong inter-centennial variability and multi-decadal variability, although the inter-centennial spectral peaks are wider than the AMO index from the LMR reanalysis (d). For the external forcings, the IPCC AR6 solar forcing shows significant centennial-scale variability with a spectral peak around 200 years (e), while the IPCC AR6 volcano forcing shows significant multi-decadal and centennial-scale variability (f). g shows the spectrum for the tidal gravitation force calculated from the NASA JPL DE431 Planetary and Lunar Ephemerides (https://ssd.jpl.nasa.gov/planets/eph_export.html), which is the total tidal gravitation force above the equator from the Moon, the Sun, Mercury, Venus, Mars, Jupiter and Saturn. The tidal gravitation forces from Uranus and Neptune are negligible since they are too far away from the Earth. The tidal gravitation force demonstrates both multi-decadal and centennial-scale variability (g). In the following, we will examine the multi-decadal mega-droughts and the centennial mega-droughts separately.
Fig. 15 Maximum entropy spectra of (a) the global mean surface temperature, (b) the Nino3.4 SST, and (c) the North Atlantic Ocean SST from the LMR reanalysis, and (d) the AMOC index from Mjell et al. (Citation2016), (e) the solar forcing from IPCC AR6, (f) the volcano forcing from IPCC AR6, and (g) the tidal gravitational force from NASA JPL. All data are for the past 2000 years.
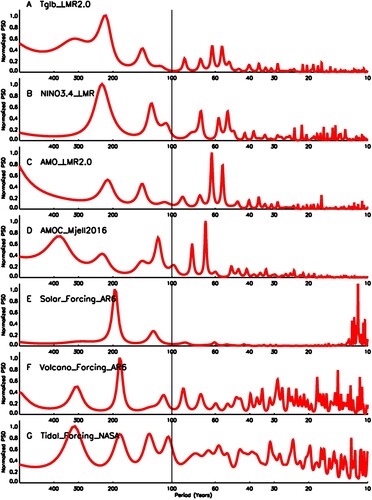
b Multi-Decadal Mega-Droughts
As shown in , the deadliest and costliest droughts in the past 140 years, such as the 1930s Dust Bowl and the 1980s Sahel drought, often occurred during the peak of the multi-decadal dry periods. It has long been speculated that these big droughts and the multi-decadal dry periods are driven by the global SST anomalies associated with the AMO (Folland et al., Citation1986; Sutton & Hodson, Citation2005; Zhang & Delworth, Citation2006), but the modern instrument records are too short to study the multi-decadal mega-droughts. Paleoclimate records showed that the droughts in the modern instrument period are not unprecedent, and there were much stronger droughts in the past 2000 years (). The first generation of paleoclimate reanalysis makes it possible to derive statistically robust results. Following the method of Schubert et al. (Citation2016), we examine the global SST patterns associated with the multi-decadal precipitation anomalies over each continent in the past 2000 years. illustrates the correlation of 40–100-year filtered LMR global SST anomalies with 40–100-year filtered area-averaged precipitation anomalies in the past 2000 years for (a) Asia, (b) Oceania, (c) Africa, (d) North America, (e) Europe, and (f) South America. Magenta lines denote the region for precipitation averaging. Black stars denote the grids with correlation coefficient above the 95% confidence level. The multi-decadal precipitation anomalies in Asia are associated with a negative ENSO-like SST pattern in the Pacific Ocean, a negative IOD pattern in the tropical Indian Ocean, negative SST anomalies in the Southern Indian Ocean, and positive SST anomalies in the North Atlantic Ocean, the eastern Arctic Ocean and the South Atlantic Ocean (a). The multi-decadal precipitation anomalies in Oceania are associated with a negative ENSO-like SST pattern in the Pacific Ocean, a negative IOD-like pattern in the tropical Indian Ocean, positive SST anomalies to the south of Australia, negative SST anomalies in the tropical Atlantic Ocean, and positive SST anomalies in the North Atlantic Ocean and the South Atlantic Ocean (b). The multi-decadal precipitation anomalies in Africa are associated with a positive ENSO-like SST pattern in the Pacific Ocean, a basin-wide warming in the tropical Indian Ocean, positive SST anomalies in the whole Arctic Ocean, the North Atlantic Ocean and the tropical Atlantic Ocean, and negative SST anomalies in the South Atlantic Ocean (c). For the multi-decadal precipitation anomalies in North America, the associated SST patterns (d) are similar to those for Africa (c). For the multi-decadal precipitation anomalies in Europe, the associated SST patterns are also similar to those for Africa but with weaker correlations (e). The multi-decadal precipitation anomalies in South America are also associated with SST patterns similar to those for Africa (f), suggesting that they have the same SST forcing.
Fig. 16 Correlation of the 40–100-year filtered global SST anomalies in the past 2000 years from the LMR reanalysis with the 40–100-year filtered area-averaged precipitation anomalies for (a) Asia, (b) Oceania, (c) Africa, (d) North America, (e) Europe, and (f) South America. Black stars denote the grids with correlation coefficient above the 95% confidence level. Magenta lines denote the region for precipitation averaging.
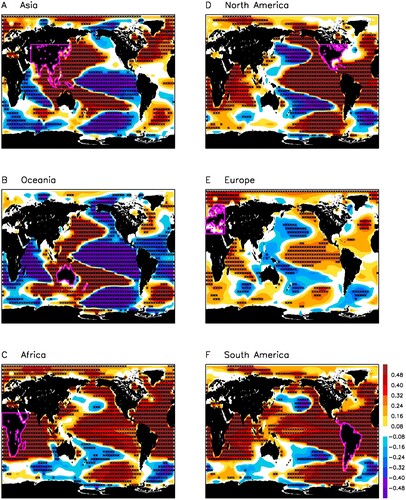
These patterns can be compared with the SST patterns associated with the interannual precipitation anomalies over each continent ( and a). The interannual precipitation anomalies are mainly associated with SST anomalies in the Pacific Ocean, tropical Indian Ocean and sometimes tropical Atlantic Ocean, while the multi-decadal precipitation anomalies are also associated with significant SST anomalies in the entire Atlantic Ocean and the Arctic Ocean. In general, the interannual precipitation anomalies over the different continents are often affected by the ENSO, which is the dominant climate mode of interannual variability of the global climate system, while the multi-decadal precipitation anomalies are often affected by the AMO.
The dominant mode of multi-decadal variability of the global climate system is the AMO (Enfield et al., Citation2001; Schlesinger & Ramankutty, Citation1994). Analysis of modern instrument data, which covers two and a half AMO cycles, suggested that the AMO affects droughts in Africa (Folland et al., Citation1986; Zhang & Delworth, Citation2006), Asia (Lu et al., Citation2006; Wang et al., Citation2009; Zhang & Delworth, Citation2006), Europe (Sutton & Hodson, Citation2005), North America (Curtis, Citation2008; Hu & Feng, Citation2008; Nigam et al., Citation2011; Sutton & Hodson, Citation2005), and South America (Chiessi et al., Citation2009; Kayano & Capistrano, Citation2014). The paleoclimate studies reviewed before generally used paleoclimate records from a few stations, from which it was difficult to derive the spatial and global structures. A recent progress was Baek et al. (Citation2017) who used the reconstructed North American Drought Atlas, Monsoon Asia Drought Atlas and Old World Drought Atlas for the past millennium, and found robust teleconnection patterns of the AMO over those three continents.
The first generation of paleoclimate reanalysis makes it possible to examine with statistical confidence the global structures of the AMO lifecycle and the underlying physical mechanisms. shows the lag-correlations of 40–100-year filtered global SST anomalies in the past 2000 years from the LMR reanalysis with the AMO index for lags (a) −30 years, (b) −15 years, (c) 0 year, and (d) +15 years. The global SST pattern at lag 0 year (c), which is the peak phase of the AMO, is similar to that derived from modern instrument data (e.g. Enfield et al., Citation2001, their ), which is characterized by warm SST anomalies in the North Atlantic Ocean, the tropical Atlantic Ocean, the North Pacific Ocean, the western Pacific Ocean, the southeast Pacific Ocean and the tropical Indian Ocean. Note that the AMO SST pattern is characterized by a region without significant SST anomalies in central/eastern Pacific, which was also found in modern instrument data (e.g. Enfield et al., Citation2001). At lag +15 years, which is a quarter cycle after the warmest SST anomalies in the North Atlantic Ocean, there is a negative ENSO-like SST pattern in the Pacific Ocean and a negative IOD-like pattern in the tropical Indian Ocean (d). The SST pattern at lag −30 years (a), which is the negative phase of the AMO, mirror that at lag 0 year (c). The SST pattern at lag −15 years (b), which is a quarter cycle before the peak of the AMO, mirror that at lag +15 year (d). Therefore, the ENSO-like pattern is in quadrature with the AMO pattern, and the two patterns correspond to two stages of the AMO lifecycle. This explains why both the North Atlantic SST anomalies (the AMO index; b) and the Nino3.4 SST anomalies (c) show significant multi-decadal oscillations. In fact, the global oceans are linked together in the AMO lifecycle.
Fig. 17 Lag-correlations of the 40–100-year filtered global SST anomalies in the past 2000 years from the LMR reanalysis with the AMO index for lags (a) −30 years, (b) −15 years, (c) 0 year, and (d) +15 years. Lag-correlations of the 40–100-year filtered global land surface precipitation anomalies in the past 2000 years from the LMR reanalysis with the AMO index for lags (e) −30 years, (f) −15 years, (g) 0 year, and (h) +15 years. Black stars denote the grids with correlation coefficient above the 95% confidence level. For land surface precipitation, the number in the upper-left corner is the fraction of global continent area with correlation coefficient above the 95% confidence level.
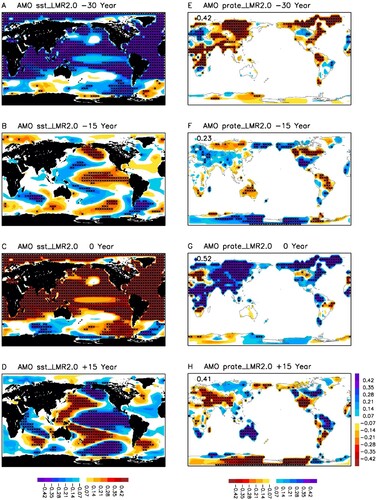
The AMO strongly affects the multi-decadal mega-droughts around the world. As shown in , the multi-decadal precipitation anomalies in different continents are affected by the ENSO-like SST pattern and/or the AMO pattern, as well as the IOD-like pattern. also shows the lag-correlations of 40–100-year filtered land surface precipitation anomalies from the LMR reanalysis with the AMO index for lags (e) −30 years, (f) −15 years, (g) 0 year, and (h) +15 years. Black stars denote the grids with correlation coefficient above the 95% confidence level. The number in the upper-left corner is the fraction of global continent area with correlation coefficient above the 95% confidence level. Note the reversed red-blue colour bar with blue colour for wet anomalies and red colour for dry anomalies. At lag 0 year (g), there are wet anomalies over tropical Africa, entire Asia, Alaska, north Canada, Greenland and eastern United States, but dry anomalies over central Europe. 52% of the global continent area are significantly affected by the AMO at this stage, which are associated with the SST patterns in c. At lag +15 years (h), there are dry anomalies over eastern Europe, Middle East, central Asia, United States and Antarctica, but wet anomalies over Australia, eastern Brazil and Canada. 41% of the global continent area are significantly affected by the AMO at this stage when the SST pattern is the negative ENSO-like pattern (d). The precipitation patterns at lag −30 years (e) mirror those at lag 0 year (g). The precipitation patterns at lag −15 years (f) mirror those at lag +15 years (h) but with weaker correlations, which is associated with the weaker SST anomalies at that stage (b).
summarizes of the global impacts of the AMO on (a) the land surface precipitation, and (b) the land surface air temperature in the LMR reanalysis. Shadings show the maximum lag-correlation with the AMO index at each grid. Arrows denote the grids with the maximum lag-correlation above the 95% confidence level, and arrow directions represent the time lag of the maximum correlation with respect to the AMO index. Phase clock is shown on the upper-right corner. The number in the upper-left corner is the fraction of global continent area with the maximum lag-correlation above the 95% confidence level. The AMO strongly affects the land surface precipitation over all the continents, with 88% of the global continent area having significant lag-correlations with the AMO index. The AMO has stronger impacts on global land surface air temperature, with 97% of the global continent area including 100% of the continents outside the Antarctica having significant lag-correlations with the AMO index. Comparison with b shows that the global impacts of the AMO cover a wider range of latitudes than those of the ENSO. The ENSO impacts are mainly over the tropics and subtropics, while the AMO impacts are over all the global continents, which is consistent with the wider latitude range of AMO SST anomalies (). The AMO impacts in mid-latitudes and high-latitudes may not be generated by Rossby wave propagations. Other physical mechanisms such as the response of zonal mean circulations, stratospheric pathways and polar sea ice changes may contribute to the observed AMO impacts in mid-latitudes and high-latitudes.
Fig. 18 Summary of the global impacts of the AMO on (a) the land surface precipitation, and (b) the land surface air temperature in the LMR reanalysis. Shadings show the maximum lag-correlation with the AMO index at each grid. Arrows denote the grids with the maximum lag-correlation above the 95% confidence level, and arrow directions represent the time lag of the maximum correlation with respect to the AMO index. Phase clock is shown on the upper-right corner. The number in the upper-left corner is the fraction of global continent area with the maximum lag-correlation above the 95% confidence level.
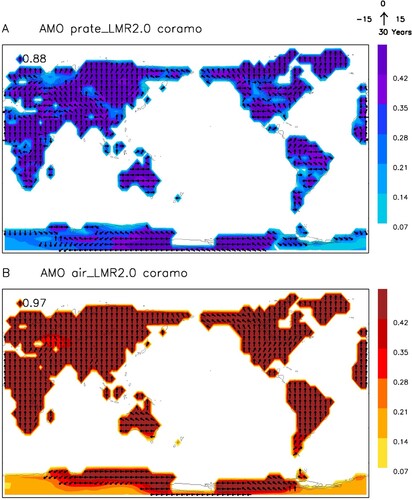
What drives the AMO? As reviewed by Lin and Qian (Citation2022), the existing AMO theories can be categorized into seven groups: (1) the stochastic forcing theory (Delworth et al., Citation1993; Griffies & Tziperman, Citation1995; Delworth & Greatbatch, Citation2000), (2) the North Atlantic Oscillation (NAO) coupled oscillator (Timmermann et al., Citation1998; Latif et al., Citation2004, Citation2007; Sun et al., Citation2015; Delworth et al., Citation2017; Sutton et al., Citation2018), (3) the zonal-meridional oscillator (Te Raa & Dijkstra, Citation2002; Dijkstra et al., Citation2006), (4) the delayed advective oscillator (Lee & Wang, Citation2010; Zhang & Wang, Citation2013), (5) the ice coupled oscillator (Dima & Lohmann, Citation2007; Frankcombe et al., Citation2010; Böning et al., Citation2016), (6) the cloud-radiation feedback theory (Clement et al., Citation2015, 2016; Bellomo et al., Citation2016; Brown et al., Citation2016; Yuan et al., Citation2016; Cane et al., Citation2017), and (7) the aerosol forcing theory (Booth et al., Citation2012; Knudsen et al., Citation2014; Yuan et al., Citation2016; J. Wang et al., Citation2017; Birkel et al., Citation2018). Theories (1)–(5) emphasize internal dynamics associated with the AMOC, theory (6) emphasizes internal heat fluxes associated with ocean mixed layer, while theory (7) emphasizes external forcing. Using the paleoclimate reanalysis and other observational datasets, Lin and Qian (Citation2022) found that the AMO is associated with significant oscillation of the AMOC flow, which is likely driven by tidal gravitational forcing and enhanced by volcano forcing and cloud-radiation feedback. To examine the relationship between the AMOC and the AMO, shows the lag-correlations of 40–100-year filtered global SST anomalies with the AMOC index for lags (a) −20 years, and (b) −5 years. The global SST anomalies are significantly correlated with the AMOC index, and the patterns at lag −20 years (a) and lag −5 years (b) are quite similar to those for AMO at lags −30 years (a) and lag −15 years (b), respectively. Therefore, the AMO is robustly linked to the AMOC, with the AMOC leading the AMO by about 10 years.
Fig. 19 Lag-correlations of the 40–100-year filtered global SST anomalies in the past 2000 years from the LMR reanalysis with the 40–100-year filtered AMOC index for lags (A) −20 years, and (B) −5 years; with the solar forcing for lags (C) 0 year, and (D) +15 years; with the volcano forcing for lags (E) 0 year, and (F) +15 years; and with the tidal gravitational force for lags (G) −15 years, and (H) 0 year. Black stars denote the grids with correlation coefficient above the 95% confidence level.
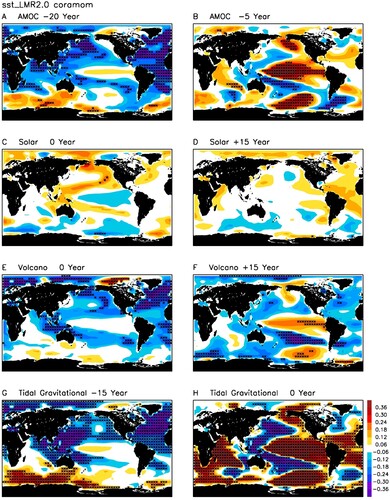
For the external forcings, also shows the lag-correlations of 40–100-year filtered global SST anomalies with the solar forcing for lags (c) 0 year, and (d) +15 years; with the volcano forcing for lags (e) 0 year, and (f) +15 years; and with the tidal gravitational force for lags (g) −15 years, and (h) 0 year. The solar forcing does not have any significant correlation with the global SST anomalies (c, d), which is consistent with the lack of multi-decadal variability in solar forcing (e). The volcano forcing does have significant multi-decadal variability (f), but does not show strong correlations with the global SST anomalies (e, f), suggesting that the volcano forcing, which is mainly a radiative forcing, is inefficient in exciting the multi-decadal variability of global ocean circulation. Interestingly, the tidal gravitational force is strongly correlated with the global SST anomalies (g, h). This is amazing since the tidal gravitational force is derived from the NASA JPL Planetary and Lunar Ephemerides, which are totally independent from the paleoclimate records entering the paleoclimate reanalysis, while the CCSM4 climate model used by the LMR reanalysis does not have any tidal forcing. The SST patterns in g, h are quite similar to those in a, b, respectively, and are also similar to those in a, b, respectively, indicating that the tidal gravitational force is in phase with the ENSO-like pattern, leads the AMOC by 5 years, and leads the AMO pattern by 15 years. These results suggest that the tidal gravitational force plays a key role in driving the AMOC and the AMO.
Since the volcano and solar forcings are inefficient in exciting the multi-decadal variability in global climate models, the tidal gravitational force likely provides a new physical mechanism for exciting the multi-decadal to centennial variability. Physically, modulation of Earth’s climate system by the tidal gravitational force is direct since (1) tidal mixing is the leading physical mechanism for driving the global thermohaline circulation (Bjerknes, Citation1916; Huang, Citation1999; Jeffreys, Citation1925; Munk, Citation1966; Munk & Wunsch, Citation1998; Oort et al., Citation1994; Sandstrom, Citation1908, Citation1916; see review by Kuhlbrodt et al., Citation2007), and also drives the upper ocean circulation in the Pacific Ocean (Hasumi et al., Citation2008; Tanaka et al., Citation2012; Osafune & Yasuda, Citation2013; Osafune et al., Citation2014, Citation2020; Tatebe et al., Citation2018); (2) the AMOC has intrinsic multi-decadal to centennial variability as shown by the unforced climate model experiments (Delworth & Zeng, Citation2012; Mysak et al., Citation1993; Park & Latif, Citation2008); and (3) tidal forcing has strong multi-decadal to centennial variability (g). Therefore, oscillations in tidal gravitational force likely cause resonant oscillations of the AMOC and global thermohaline circulation at the multi-decadal to centennial timescales.
In summary, the multi-decadal mega-droughts over each continent are associated with significant global SST anomalies. The dominant mode of multi-decadal variability of the global climate system is the AMO, which has strong impacts on the multi-decadal variability of precipitation over all continents. The AMO is associated with significant oscillation of the AMOC flow, which is likely driven by tidal gravitational forcing and enhanced by volcano forcing and cloud-radiation feedback. There are other possible mechanisms such as the land-atmosphere feedbacks. Currently, the first generation of paleoclimate reanalysis provide a limited set of variables, and it is not possible to analyse the land-atmosphere feedbacks.
c Centennial-Scale Mega-Droughts
The centennial-scale mega-droughts, such as those happening around the Migration Period in Europe (a) and before the continuous wars of the Five Dynasties and Ten Kingdoms period in China (b, denoted as 5D&10K), have strong impacts on human history due to their long duration. Following the method of Schubert et al. (Citation2016), we examine the global SST patterns associated with the centennial-scale mega-droughts over each continent in the past 2000 years. illustrates the correlations of the 100–400-year filtered global SST anomalies in the past 2000 years from the LMR reanalysis with the 100–400-year filtered area-averaged precipitation anomalies for (a) Asia, (b) Oceania, (c) Africa, (d) North America, (e) Europe and (f) South America. Magenta lines denote the regions for precipitation averaging. The centennial-scale precipitation anomalies over all the continents are strongly correlated with global SST anomalies. The centennial-scale precipitation anomalies over Asia are associated with a negative ENSO-like pattern in the Pacific Ocean, and warmings in the North Atlantic Ocean, the eastern Arctic Ocean, the South Atlantic Ocean, the eastern Indian Ocean and the southern Indian Ocean (a). The centennial-scale precipitation anomalies over Oceania are associated with very similar global SST patterns as those for Asia (b). The centennial-scale precipitation anomalies over Africa are associated with a positive AMO-like global SST pattern (c). The centennial-scale precipitation anomalies over North America are associated with a positive ENSO-like pattern in the Pacific Ocean, and warmings in the tropical Atlantic Ocean, the western Arctic Ocean, the tropical Indian Ocean and the southern Indian Ocean (d). The centennial-scale precipitation anomalies over Europe are associated with a global warming pattern (e), bearing some resemblance to the positive AMO-like pattern (c). The centennial-scale precipitation anomalies over South America are associated with a similar global SST pattern (f), suggesting that they have similar SST forcing.
Fig. 20 Correlation of the 100–400-year filtered global SST anomalies in the past 2000 years from the LMR reanalysis with the 100–400-year filtered area-averaged precipitation anomalies for (a) Asia, (b) Oceania, (c) Africa, (d) North America, (e) Europe, and (f) South America. Black stars denote the grids with correlation coefficient above the 95% confidence level. Magenta lines denote the region for PDSI averaging.
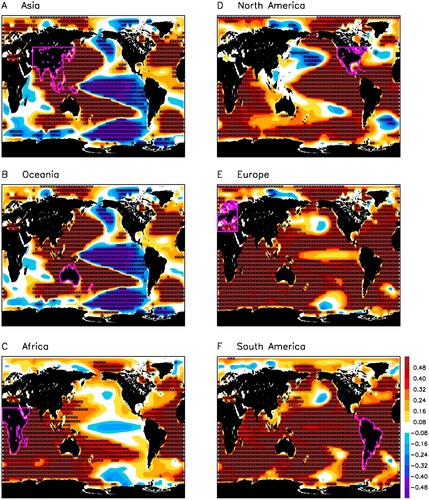
Comparing with shows that the centennial-scale precipitation anomalies are associated with SST anomalies over larger regions than the interannual precipitation anomalies. Comparison of and indicates that the centennial-scale precipitation anomalies and the multi-decadal precipitation anomalies are associated with similar SST patterns for Asia, Oceania and North America, but highly different SST patterns for Africa, Europe and South America, suggesting the existence of different physical mechanisms at different timescales.
The modern instrument records cover two AMO cycles and provide the AMO structures for two events. However, for the centennial-scale variability, the modern instrument records are too short to cover one cycle. Therefore, there has not been any observational evidence concerning the dominant modes of the centennial-scale variability. The first generation of paleoclimate reanalysis makes it possible, for the first time, to examine the dominant modes of the centennial-scale variability. The dominant modes of global SST anomalies at the centennial timescale are shown in , which illustrates the first two EOFs of the 100–400-year filtered global SST anomalies from the LMR reanalysis. EOF1 is an ENSO-like pattern which explains 47.8% of the total variance, while EOF2 is an AMO-like pattern which explains 29.9% of the total variance. Lag-correlation analysis shows that PC1 leads PC2 by about a quarter cycle, suggesting that the two leading modes are associated with a coherent inter-centennial oscillation. We hereby define this oscillation the Global Inter-Centennial Oscillation (GICO), and use PC1 as the GICO index.
Fig. 21 The first two EOFs of 100–400-year filtered global SST anomalies from the LMR reanalysis. EOF1 explains 47.8% of variance, while EOF2 explains 29.9% of variance.
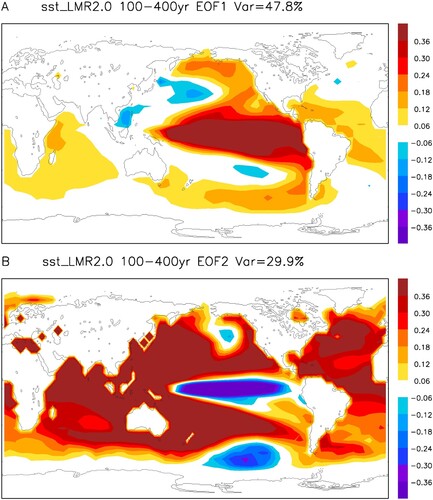
demonstrates the lag-correlation of the 100–400-year filtered SST anomalies in the past 2000 years from the LMR reanalysis with the GICO index for lags (a) −75 years, (b) −60 years, (c) −45 years, (d) −30 years, (e) −15 years, and (f) 0 year. At lag −75 years (a), there are significant cold SST anomalies in tropical Pacific, northeast Pacific, southeast Pacific, southwest Pacific, south Indian Ocean, tropical Atlantic and southwest Atlantic. At lag −60 years (b), cold SST anomalies start to fade away in eastern Pacific, but grow in northwest Pacific, which amplify at lag −45 years (c). An El Nino-like SST pattern appears in Pacific Ocean at lag −30 years (d), with significant warm SST anomalies in tropical central and eastern Pacific, northeast Pacific and south Pacific, but is associated with significant cold SST anomalies in north Atlantic and south Atlantic. The pattern amplifies at lag −15 years (e), with warm SST anomalies emerging in tropical Atlantic Ocean and south Indian Ocean. The pattern reaches the peak at lag 0 year (f), with warm SST anomalies covering whole Indian Ocean and tropical Atlantic.
Fig. 22 Lag-correlations of the 100–400-year filtered global SST anomalies in the past 2000 years from the LMR reanalysis with the GICO index for lags (a) −75 years, (b) −60 years, (c) −45 years, (d) −30 years, (e) −15 years, and (f) 0 year. Black stars denote the grids with correlation coefficient above the 95% confidence level.
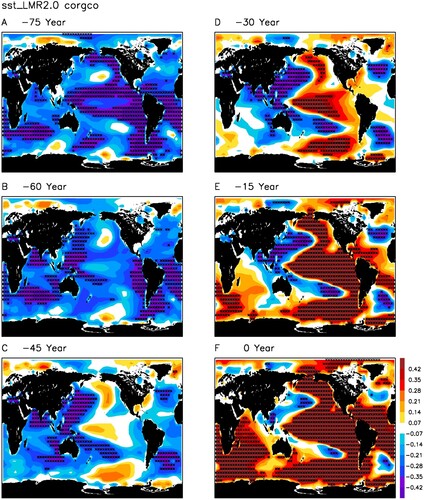
The GICO SST anomalies significantly affect the global land surface precipitation. shows the lag-correlation of the land surface precipitation anomalies in the past 2000 years with the GICO index for lags (a) −75 years, (b) −60 years, (c) −45 years, (d) −30 years, (e) −15 years, and (f) 0 year. With the 100–400-year oscillations, the dry/wet periods last for 50–200 years. At lag −75 years (a), there are dry periods in Siberia, but wet anomalies in east China, west Asia and central America, which persist to lag −60 years (b). At lag −45 years (c), the dry anomalies over Siberia still persist, while new dry periods develop in Australia, India and east Africa. At lag −30 years (d), dry anomalies amplify in Australia, India, southeast Asia and Africa, while wet anomalies appear in North America and Argentina. At lag −15 years (e), dry anomalies persist in Australia, India, southeast Asia and Africa, and also appear in Brazil and Alaska, but are replaced by wet anomalies in Russia. The patterns persist to lag 0 year (f).
Fig. 23 Lag-correlations of the 100–400-year filtered land precipitation anomalies in the past 2000 years from the LMR reanalysis with the GICO index for lags (a) −75 years, (b) −60 years, (c) −45 years, (d) −30 years, (e) −15 years, and (f) 0 year. Black stars denote the grids with correlation coefficient above the 95% confidence level. The number in the upper-left corner is the fraction of global continent area with correlation coefficient above the 95% confidence level.
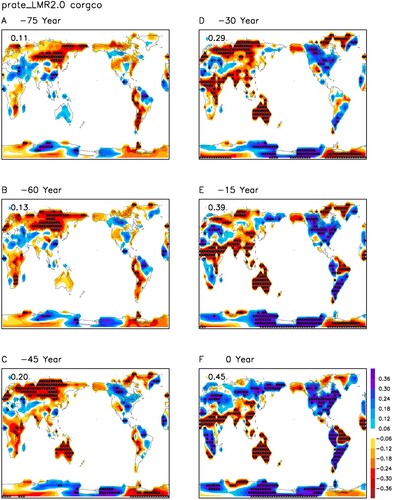
summarizes the global impacts of the GICO on (a) the land surface precipitation, and (b) the land surface air temperature in the LMR reanalysis. Shadings show the maximum lag-correlation with the GICO index at each grid. Arrows denote the grids with maximum lag-correlation above the 95% confidence level, and arrow directions represent the time lag of maximum correlation with respect to the GICO index. Phase clock is shown on the upper-right corner. The number in the upper-left corner is the fraction of global continent area with the maximum lag-correlation above the 95% confidence level. The GICO strongly affects the land surface precipitation and surface air temperature around the world. For the land surface precipitation, the GICO is associated with significant dry/wet periods over all the continents except Middle East, central Asia, South Africa, southwestern United States and Mexico (a), which is quite different from the significant ENSO and AMO impacts over these regions (b and a). Precipitation anomalies over 67% of the global continent area have significant lag-correlations with the GICO. For the surface air temperature, there are significant lag-correlations over all the continents except the United States and most of Canada, which cover 80% of the global continent area (b).
Fig. 24 Summary of the global impacts of the GICO on (a) the land surface precipitation, and (b) the land surface air temperature in the LMR reanalysis. Shadings show the maximum lag-correlation with the GICO index at each grid. Arrows denote the grids with the maximum lag-correlation above the 95% confidence level, and arrow directions represent the time lag of the maximum correlation with respect to the GICO index. Phase clock is shown on the upper-right corner. The number in the upper-left corner is the fraction of global continent area with the maximum lag-correlation above the 95% confidence level.
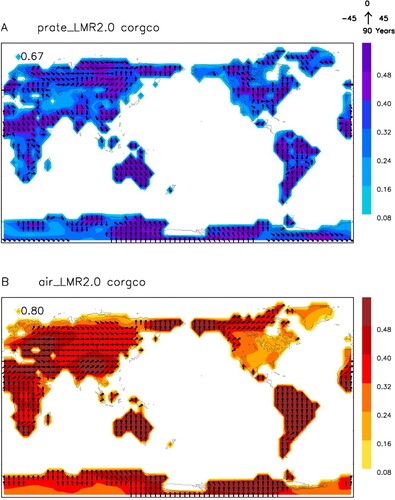
What drives the centennial-scale variability is still unclear. The proposed physical mechanisms include ocean internal dynamics, solar forcing, and volcano forcing. Ocean internal dynamics refers to unforced oscillations of the AMOC (Delworth et al., Citation2007; Delworth & Zeng, Citation2012; Latif et al., Citation2013; Martin et al., Citation2013; Mysak et al., Citation1993; Park & Latif, Citation2008; Vellinga & Wu, Citation2004). a shows the correlation of 100–400-year filtered global SST anomalies in the past 2000 years from the LMR reanalysis with the AMOC index at lag +45 years. The AMOC is significantly correlated with a negative ENSO-like pattern in the Pacific Ocean, and warming in the North Atlantic Ocean, the South Atlantic Ocean, the eastern Indian Ocean, and the southern Indian Ocean, suggesting that the GICO is connected to the AMOC. The AMOC is also significantly correlated with the centennial-scale precipitation anomalies over South America, eastern United States, Europe, Africa, east Asia and Australia (d), which are likely through SST-driven teleconnections.
Fig. 25 Correlations of the 100–400-year filtered global SST anomalies in the past 2000 years from the LMR reanalysis with (a) the AMOC index, (b) the solar forcing, and (c) the volcano forcing. Correlations of the 100–400-year filtered land precipitation anomalies with the above indices are shown in (d) (e) and (f), respectively. Black stars denote the grids with correlation coefficient above the 95% confidence level.
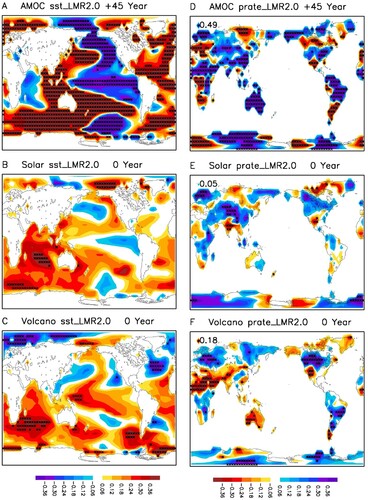
The solar forcing was proposed by many studies to drive the observed centennial-scale variability of climate (Asmerom et al., Citation2013; Eichler et al., Citation2009; Novello et al., Citation2016; Poore et al., Citation2004; Sagawa et al., Citation2014; Wang et al., Citation2005; Waple et al., Citation2002; Wiles et al., Citation2004; Yu & Ito, Citation1999). The solar forcing has strong centennial-scale variability with a sharp spectral peak around 200 years and a secondary spectral peak around 120 years (e). However, b shows the correlations of 100–400-year filtered global SST anomalies in the past 2000 years from the LMR reanalysis with the solar forcing. The correlations are very weak, suggesting that the solar forcing is inefficient in exciting the centennial-scale variability of the global oceans. The correlations of the solar forcing with land surface precipitation anomalies are also weak (e).
The volcano forcing has been proposed by several modelling studies to drive the centennial-scale variability (Crowley & Kim, Citation1999; Fan et al., Citation2009; Hartl-Meier et al., Citation2017; Man et al., Citation2012). The volcano forcing has strong centennial-scale variability with a sharp spectral peak around 180 years and a secondary spectral peak around 300 years (f). However, c shows the correlations of 100–400-year filtered global SST anomalies with the volcano forcing. Again, the correlations are very weak, suggesting that the volcano forcing is inefficient in exciting the centennial-scale variability of the global oceans. As reviewed before, climate models driven by solar and volcano forcings generally underestimate the variance of the observed centennial-scale variability of the ocean temperature and cannot reproduce the timing of the observed centennial-scale variability. However, the volcano forcing is significantly correlated with the centennial-scale precipitation anomalies over western Europe, tropical Africa, north America and southern South America (f), which are possibly caused by the radiative and/or microphysics effects of volcano aerosols since there isn’t significantly correlated SST anomalies (c). Note that the first generation of paleoclimate reanalysis employed climate model simulations forced by the solar forcing and the volcano forcing, which may contribute to the significant correlations in f. In the future generations of paleoclimate reanalysis, it may be better to use unforced climate model simulations, or provide both forced and unforced versions for comparison.
Contrary to the solar forcing and the volcano forcing, the tidal gravitational force demonstrates strong correlations with the centennial-scale variability of the Earth’s climate system. The tidal gravitational force also has strong centennial-scale variability with four spectral peaks around 105, 130, 190 and 310 years (g). shows the lag-correlations of the 100–400-year filtered SST anomalies in the past 2000 years from the LMR reanalysis with the tidal gravitational force for lags (a) −75 years, (b) −60 years, (c) −45 years, (d) −30 years, (e) −15 years, and (f) 0 year. The tidal gravitational force shows significant correlations with the global SST anomalies, and the evolutions of global SST pattern in are quite similar to the evolutions of global SST pattern associated with the GICO lifecycle in , with the tidal gravitational force leading the GICO by about 15 years (e.g. h for lag +15 years of the tidal gravitational force has similar patterns as h for lag 0 year of the GICO). These results suggest that the tidal gravitational force plays a key role in driving the GICO. Once again, note that the NASA JPL Planetary and Lunar Ephemerides used for calculating the tidal gravitational force are totally independent of the paleoclimate records and climate models used for the paleoclimate reanalysis.
Fig. 26 Lag-correlations of the 100–400-year filtered global SST anomalies in the past 2000 years from the LMR reanalysis with the tidal gravitational forcing for lags (a) −60 years, (b) −45 years, (c) −30 years, (d) −15 years, (e) 0 year, and (f) +15 years. Black stars denote the grids with correlation coefficient above the 95% confidence level.
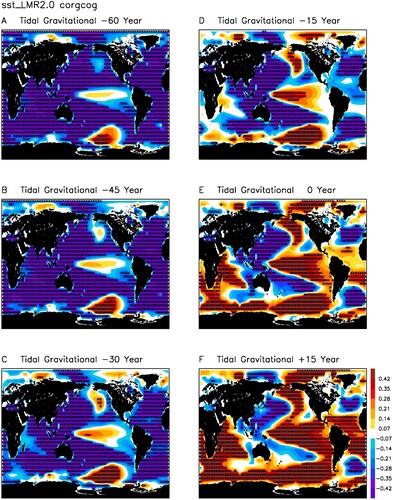
The tidal gravitational force is also strongly correlated with the centennial-scale precipitation anomalies (). The correlation patterns in are quite similar to those in , but with even stronger correlations. At different time lags, centennial-scale precipitation anomalies over 40–60% of the global continent area are significantly correlated with the tidal gravitational force, which is likely through SST-driven teleconnections. summarizes the global impacts of tidal gravitational force on the centennial-scale (a) land surface precipitation, and (b) land surface air temperature. The tidal gravitational force strongly affects the centennial-scale precipitation anomalies over all the continents, with 89% of the global continent area having significant lag-correlations with the tidal gravitational force, which is likely through SST-driven teleconnections (). The tidal gravitational force has stronger impacts on centennial-scale land surface air temperature, with 100% of the global continent area having significant lag-correlations with the tidal gravitational force.
Fig. 27 Lag-correlations of the 100–400-year filtered land surface precipitation anomalies in the past 2000 years from the LMR reanalysis with the tidal gravitational force for lags (a) −75 years, (b) −60 years, (c) −45 years, (d) −30 years, (e) −15 years, and (f) 0 year. Black stars denote the grids with correlation coefficient above the 95% confidence level. The number in the upper-left corner is the fraction of global continent area with correlation coefficient above the 95% confidence level.
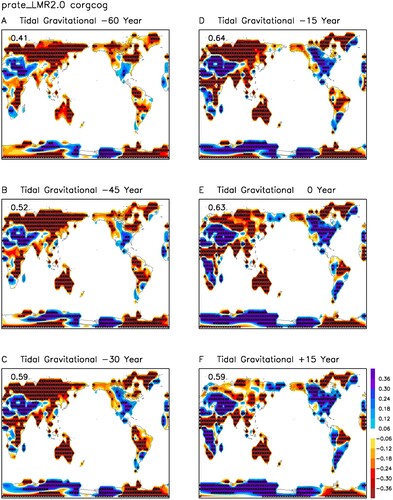
Fig. 28 Summary of the global impacts of the tidal gravitational force on the centennial-scale 100–400-year filtered (a) land surface precipitation, and (b) land surface air temperature in the LMR reanalysis. Shadings show the maximum lag-correlation with the tidal gravitational force at each grid. Arrows denote the grids with the maximum lag-correlation above the 95% confidence level, and arrow directions represent the time lag of the maximum correlation with respect to the tidal gravitational force. Phase clock is shown on the upper-right corner. The number in the upper-left corner is the fraction of global continent area with the maximum lag-correlation above the 95% confidence level.
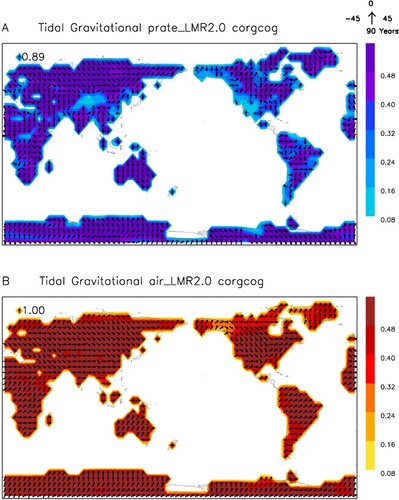
In summary, the centennial-scale mega-droughts over each continent are associated with significant global SST anomalies. The dominant mode of centennial-scale variability of the global climate system is the GICO, which has strong impacts on the centennial-scale variability of precipitation over all continents. The solar forcing and volcano forcing are inefficient in exciting the centennial-scale variability of SST, while the tidal gravitational force plays a key role in exciting the GICO. The tidal gravitational force is also strongly correlated with the centennial-scale precipitation anomalies, which is likely through SST-driven teleconnections. There are other possible mechanisms such as the land-atmosphere feedback and the sea ice teleconnections, which need further studies in the future.
4 Summary
This paper reviews the history of research on droughts and mega-droughts. The interannual droughts are often driven by the ENSO, the multi-decadal mega-droughts are often driven by the AMO, while the centennial mega-droughts are often driven by the GICO. Droughts over land are affected by multiple factors such as global sea surface temperature anomalies, local land-atmosphere feedbacks, internal atmospheric variability and external forcings from outside the climate system.
The multi-decadal mega-droughts over each continent are associated with significant global SST anomalies. The dominant mode of multi-decadal variability of the global climate system is the AMO, which has strong impacts on the multi-decadal variability of precipitation over all continents. The AMO is associated with significant oscillation of the AMOC flow, which is likely driven by the tidal gravitational force and enhanced by the volcano forcing and the cloud-radiation feedback.
The centennial-scale mega-droughts over each continent are associated with significant global SST anomalies. The dominant mode of centennial-scale variability of the global climate system is the GICO, which has strong impacts on the centennial-scale variability of precipitation over all continents. The solar forcing and volcano forcing are inefficient in exciting the centennial-scale variability of SST, while the tidal gravitational force plays a key role in exciting the GICO. The tidal gravitational force is also strongly correlated with the centennial-scale precipitation anomalies over all continents, which is likely through SST-driven teleconnections.
Currently, global climate models driven by solar and volcano forcings have significant difficulties in simulating the observed amplitude, timing and teleconnections of multi-decadal- to centennial-scale mega-droughts, as well as the observed multi-decadal- to centennial variability of ocean temperature. Unforced climate model experiments showed that the AMOC, which is part of the global thermohaline circulation, has intrinsic oscillations at multi-decadal to centennial timescales. However, the solar forcing and volcano forcing are inefficient in exciting the multi-decadal- to centennial-scale oscillations of the AMOC and the global thermohaline circulation.
Since the volcano forcing and solar forcing are mainly radiative forcings, increase of SST response would require an increase of climate sensitivity. Right now the state-of-the-art global climate models already have an unrealistically high climate sensitivity, which jumped from 2.0 to 4.7 K in CMIP5 models to 1.8–5.6 K in CMIP6 models (Flynn & Mauritsen, Citation2020; Meehl et al., Citation2020). Such a high climate sensitivity is not supported by well-established paleoclimate constraints (Sherwood et al., Citation2020; Zhu et al., Citation2020, Citation2021), and is likely caused by overly large low cloud feedback and aerosol cooling (Flynn & Mauritsen, Citation2020; Zelinka et al., Citation2020). Moreover, the solar forcing and volcano forcing are not correlated with the observed multi-decadal and centennial-scale SST anomalies (–f and b–c), which means that even with higher climate sensitivity, they would not be able to reproduce the timing of the observed SST oscillations. Therefore, it is not possible to use the volcano forcing and solar forcing to drive the observed multi-decadal- to centennial-scale variability.
Physically, modulation of Earth’s climate system by the tidal gravitational force is direct since tidal mixing is the leading physical mechanism for driving the global thermohaline circulation, and also affects the upper ocean circulation in the Pacific Ocean. Therefore oscillations in tidal gravitational force likely cause resonant oscillations of the global thermohaline circulation and upper ocean circulation in the Pacific Ocean at the multi-decadal to centennial timescales.
There are other possible mechanisms for multi-decadal and centennial-scale mega-droughts such as the land-atmosphere feedback and the sea ice teleconnections. However, due to the lack of paleoclimate records, the first generation of paleoclimate reanalysis provide a limited set of variables, and it is not possible to analyse the land-atmosphere feedback and sea ice teleconnections. Currently, we have very limited paleoclimate records on soil moisture, dust and paleo-vegetation. Future efforts are needed to significantly expand the archive of paleoclimate soil moisture, dust and vegetation records and incorporate them into the paleoclimate reanalysis.
Regarding the internal processes of the climate system, physics-based evaluations of climate models are important for understanding the relative contributions of SST-driven teleconnections, atmospheric internal dynamics and land-atmosphere feedbacks. Simple comparisons with the observed precipitation could not guarantee the correct partitioning of contributions from the different physical mechanisms. It is important to evaluate step-by-step the physical processes and feedbacks using the corresponding observational data. For example, the SST-driven teleconnections can be divided into three steps: (1) generation of convective heating over the SST anomalies; (2) forcing of atmospheric circulation anomalies and Rossby waves by the convective heating; and (3) generation of precipitation anomalies over the continents by the atmospheric circulation anomalies and Rossby waves. The state-of-the-art climate models can simulate the second step well. However, the first step and the third step both involve the convective parameterization, which is one of the key bottlenecks of global climate modelling. For the first step, model intercomparisons showed that the models have difficulty in simulating the position of precipitation anomalies associated with ENSO SST anomalies, and the model precipitation anomalies over equatorial Pacific shift westward comparing to observations (Bellenger et al., Citation2014; Wittenberg et al., Citation2006). When the heating anomalies shift westward, the Rossby wavetrains will be affected. For the third step, currently, the models have difficulty in simulating the diurnal cycle of continental precipitation with the precipitation occurring 6 h earlier than in observations (Covey et al., Citation2016). Therefore, improving the convective parameterization over the ocean and over the continent is important for improving the SST-driven teleconnection in climate models.
We propose the following future directions for research on droughts and mega-droughts:
Use the next generation of Earth system models with tidal forcing in ocean models to study and predict the droughts and mega-droughts. Currently the global ocean modelling community is installing tidal mixing into the global ocean models.
Conduct step-by-step evaluations of the physical processes and feedbacks in global climate models for understanding the relative contributions of the SST-driven teleconnections, atmospheric internal dynamics and land-atmosphere feedbacks.
Understand the role of internal atmospheric variability in the development of drought, and implications for predictability. What are the physical mechanisms for the Rossby waves associated with extratropical droughts? Are the Rossby waves stationary waves or travelling waves? What force these waves? How do the Rossby waves affect the droughts?
Understand the link between heat waves and drought, and how a warming world impacts drought on all time scales.
Evaluate the strength of land-atmosphere feedback in climate models using observational data.
For paleoclimate reanalysis, use unforced climate model simulations to avoid any possible artificial effects from the prescribed solar forcing and volcano forcing.
Expand the paleoclimate reanalysis from the surface to the upper air and the ocean subsurface, and extend the time coverage from the past 2000 years to the past 10,000 years, which will provide the foundation for the research on the structure and physical mechanisms of mega-droughts.
Conduct paleoclimate model intercomparison experiments to examine the SST-driven teleconnections for multi-decadal and centennial-scale mega-droughts. Force the AGCMs using the reconstructed SST datasets for the past 2000 years to understand the global teleconnections and impacts of the AMO and GICO. Examine the possible roles of Rossby wave propagations, response of zonal mean circulations, stratospheric pathways and polar sea ice forcing.
Examine the land-atmosphere feedback mechanisms for multi-decadal and centennial-scale megadroughts, such as the vegetation feedback (Zeng et al. Citation1999) and dust aerosol feedback (Forman et al., Citation2001; Hanson et al., Citation2010; Miao et al., Citation2007). For this purpose, we suggest to significantly expand the global archive of paleo-vegetation reconstructions (Buso et al., Citation2019; Leavitt et al., Citation2007), and paleo-dust reconstructions (Albani et al., Citation2015; Albani & Mahowald, Citation2019; Kohfeld & Harrison, Citation2001; Maher et al., Citation2010).
Interannual droughts and multi-decadal- to centennial-scale mega-droughts have profound impacts on human society, and require long-lead predictions in order for the governments to have time for preparation. Currently, the leading global climate forecasting centres are issuing 3-month official forecasts, which provides too short lead time for disaster preparation and mitigation. The tidal gravitational force is highly predictable and the NASA JPL Planetary and Lunar Ephemerides provide predictions for the next 500 years. Therefore, incorporating the tidal gravitational force might significantly extend the lead time of drought predictions.
Drought is the deadliest natural disaster on Earth due to its long duration, wide spatial coverage and direct connection with food supply for human beings. Currently, the different forecasting centres are using different models which sometimes yield quite different predictions, but an international drought prediction bulletin is still lacking. We suggest that an international drought prediction bulletin, which is similar to the current ENSO prediction bulletin, is set up to summarize and inter-compare all the available predictions, and promote international efforts in drought prediction. This will especially benefit the developing countries which do not have the experts for making good drought prediction, and may save many people’s lives.
Acknowledgements
Part of this work was done by TQ when working in the Department of Geography, The Ohio State University. The LMR reanalysis datasets are from https://atmos.washington.edu/~hakim/lmr/. The PHYDA reanalysis datasets are from https://zenodo.org/record/1198817#.YZ5i2S-cZaM. The JPL Planetary and Lunar Ephemerides are from https://ssd.jpl.nasa.gov/planets/eph_export.html. JL designed Fig. 8a and advised Andrea S. Taschetto to make an earlier version of it.
Disclosure statement
No potential conflict of interest was reported by the author(s).
References
- Abbot, C. G. (1936). Cycles in tree-ring widths. Smithsonian Miscellaneous Collections, 95(19), 1–5. https://repository.si.edu/bitstream/handle/10088/23883/SMC_95_Abbot_1936_19_1-5.pdf
- Abram, N. J., Mulvaney, R., Wolff, E. W., Triest, J., Kipfstuhl, S., Trusel, L. D., Vimeux, F., Fleet, L., & Arrowsmith, C. (2013). Acceleration of snowmelt in an Antarctic Peninsula ice core during the 20th century. Nature Geoscience, 6(5), 404–411. https://doi.org/10.1038/ngeo1787
- Adler, R. F. (2003). The version 2 Global Precipitation Climatology Project (GPCP) monthly precipitation analysis (1979-present). Journal of Hydrometeorology, 4(6), 1147–1167. https://doi.org/10.1175/1525-7541(2003)004%3C1147:TVGPCP%3E2.0.CO;2
- Albani, S., Mahowald, N. M., Winckler, G., Anderson, R. F., Bradtmiller, L. I., Delmonte, B., François, R., Goman, M., Heavens, N. G., Hesse, P. P., Hovan, S. A., Kang, S. G., Kohfeld, K. E., Lu, H., Maggi, V., Mason, J. A., Mayewski, P. A., McGee, D., Miao, X., … Sun, J. (2015). Twelve thousand years of dust: The Holocene global dust cycle constrained by natural archives. Climate of the Past, 11(6), 869–903. https://doi.org/10.5194/cp-11-869-2015
- Albani, S., & Mahowald, N. M. (2019). Paleodust insights into dust impacts on climate. Journal of Climate, 32(22), 7897–7913. https://doi.org/10.1175/JCLI-D-18-0742.1
- Alley, R. B. (2000). The younger dryas cold interval as viewed from central Greenland. Quaternary Science Reviews, 19(1-5), 213–226. https://doi.org/10.1016/S0277-3791(99)00062-1
- Alley, W. M. (1984). The Palmer drought severity index: Limitations and assumptions. Journal of Applied Meteorology and Climatology, 23(7), 1100–1109. https://doi.org/10.1175/1520-0450(1984)023%3C1100:TPDSIL%3E2.0.CO;2
- Ambrizzi, T., & Hoskins, B. J. (1997). Stationary rossby-wave propagation in a baroclinic atmosphere. Quarterly Journal of the Royal Meteorological Society, 123(540), 919–928. https://doi.org/10.1002/qj.49712354007
- Ambrizzi, T., Hoskins, B. J., & Hsu, H.-H. (1995). Rossby wave propagation and teleconnection patterns in the austral winter. Journal of the Atmospheric Sciences, 52(21), 3661–3672. https://doi.org/10.1175/1520-0469(1995)052%3C3661:RWPATP%3E2.0.CO;2
- Anchukaitis, K., & McKay, N. (2014). PAGES2k: Advances in Climate Field Re- constructions. PAGES Magazine, 22, 98.
- Anchukaitis, K., D'Arrigo, R., Andreu-Hayles, L., Frank, D., Verstege, A., Buckley, B., Curtis, A., Jacoby, G., & Cook, E. (2013). Tree-ring reconstructed summer temperatures from northwestern North America during the last nine centuries. Journal of Climate, 26(10), 3001–3012. https://doi.org/10.1175/JCLI-D-11-00139.1
- Anderson, L. (2011). Holocene record of precipitation seasonality from lake calcite d18O in the central Rocky Mountains, United States. Geology, 39(3), 211–214. https://doi.org/10.1130/G31575.1
- Andreadis, K. M., Clark, E. A., Wood, A. W., Hamlet, A. F., & Lettenmaier, D. P. (2005). Twentieth-century drought in the conterminous United States. Journal of Hydrometeorology, 6(6), 985–1001. https://doi.org/10.1175/JHM450.1
- Ashok, K., Guan, Z., & Yamagata, T. (2003). A look at the relationship between ENSO and the Indian Ocean dipole. Journal of the Meteorological Society of Japan, 81, 41–56. https://doi.org/10.2151/jmsj.81.41
- Asmerom, Y., Polyak, V. J., Rasmussen, J. B. T., Burns, S. J., & Lachniet, M. (2013). Multidecadal to multicentury scale collapses of Northern Hemisphere monsoons over the past millennium. Proceedings of the National Academy of Sciences, 110(24), 9651–9656. https://doi.org/10.1073/pnas.1214870110
- Ault, T. R., Cole, J. E., Overpeck, J. T., Pederson, G. T., George, S. S., Otto-Bliesner, B., Woodhouse, C. A., & Deser, C. (2013). The continuum of hydroclimate variability in western North America during the last millennium. Journal of Climate, 26(16), 5863–5878. https://doi.org/10.1175/JCLI-D-11-00732.1
- Ault, T. R., Overpeck, J. T., Pederson, G. T., & Meko, D. (2014). Assessing the risk of persistent drought using climate model simulations and paleoclimate data. Journal of Climate, 27(20), 7529–7549. https://doi.org/10.1175/JCLI-D-12-00282.1
- Avissar, R., & Verstraete, M. M. (1990). The representation of continental surface processes in atmospheric models. Reviews of Geophysics, 28(1), 35–52. https://doi.org/10.1029/RG028i001p00035
- Ayache, M., Swingedouw, D., Mary, Y., Eynaud, F., & Colin, C. (2018). Multi-centennial variability of the AMOC over the holocene: A new reconstruction based on multiple proxy-derived SST records. Global and Planetary Change, 170, 172–189. https://doi.org/10.1016/j.gloplacha.2018.08.016
- Bacmeister, J. T., Suarez, M. J., & Robertson, F. R. (2006). Rain reevaporation, boundary layer-convection interactions, and Pacific rainfall patterns in an AGCM. Journal of the Atmospheric Sciences, 63(12), 3383–3403. https://doi.org/10.1175/JAS3791.1
- Baek, S. H., Smerdon, J., Coats, S., Williams, A., Cook, B., Cook, E., & Seager, R. (2017). Precipitation, temperature, and teleconnection signals across the combined North American, Monsoon Asia, and Old World Drought atlases. Journal of Climate, 30(18), 7141–7155. https://doi.org/10.1175/JCLI-D-16-0766.1
- Baker, A., Wilson, R., Fairchild, I., Franke, J., Spatl, C., Mattey, D., Trouet, V., & Fuller, L. (2011). High resolution d18O and d13C records from an annually laminated Scottish stalagmite and relationship with last millennium climate. Global and Planetary Change, 79(3–4), 301–311. https://doi.org/10.1016/j.gloplacha.2010.12.007
- Barlow, M., Zaitchik, B., Paz, S., Black, E., Evans, J., & Hoell, A. (2016). A review of drought in the Middle East and southwest Asia. Journal of Climate, 29(23), 8547–8574. https://doi.org/10.1175/JCLI-D-13-00692.1
- Bárta, M., & Bezdek, A. (2008). Beetles and the decline of the Old Kingdom: climate change in ancient Egypt. In: Vymazalová, H., Bárta, B. (Eds.), Chronology and Archaeology in Ancient Egypt (The Third Millennium B.C.) (pp. 214–222).
- Bellenger, H., Guilyardi, E., Leloup, J., Lengaigne, M., & Vialard, J. (2014). ENSO representation in climate models: From CMIP3 to CMIP5. Climate Dynamics, 42(7-8), 1999–2018. https://doi.org/10.1007/s00382-013-1783-z
- Bellomo, K., Clement, A. C., Murphy, L. N., Polvani, L. M., & Cane, M. A. (2016). New observational evidence for a positive cloud feedback that amplifies the Atlantic Multidecadal Oscillation. Geophysical Research Letters, 43, 9852–9859. https://doi.org/10.1002/2016GL069961
- Berlage, H. P. (1957). Schommelingen van de algemene luchtcirculatie met perioden van meer dan een jaar, hun aard en betekenis voor de weersverwachting op lange termijn [Fluctuations of the general atmospheric circulation of more than one year, their nature and prognostic value]. Mededelingsn en Verhandelingen, No. 69, Koninklijk Nederlands Meteorologisch Instituut, 152 pp.
- Berney, F. L. (1906). Drought and flood in queensland. Emu - Austral Ornithology, 6(1), Article 26. https://doi.org/10.1071/MU906026A
- Betts, A. K., Ball, J. H., Beljaars, A. C. M., Miller, M. J., & Viterbo, P. A. (1996). The land surface-atmosphere interaction: A review based on observational and global modeling perspectives. Journal of Geophysical Research: Atmospheres, 101(D3), 7209–7225. https://doi.org/10.1029/95JD02135
- Bhalme, H. N., & Mooley, D. A. (1980). Large-scale droughts/floods and monsoon circulation. Monthly Weather Review, 108(8), 1197–1211. https://doi.org/10.1175/1520-0493(1980)108%3C1197:LSDAMC%3E2.0.CO;2
- Bhalme, H. N., Mooley, D. A., & Jadhav, S. K. (1983). Fluctuations in the drought/flood area over India and relationships with the Southern oscillation. Monthly Weather Review, 111(1), 86–94. https://doi.org/10.1175/1520-0493(1983)111%3C0086:FITDAO%3E2.0.CO;2
- Bird, B. W., Abbott, M., Rodbell, D., & Vuille, M. (2011). Holocene tropical South American hydroclimate revealed from a decadally resolved lake sediment d18O record. Earth and Planetary Science Letters, 310(3-4), 192–202. https://doi.org/10.1016/j.epsl.2011.08.040
- Bird, B. W., Wilson, J. J., Gilhooly, W. P. III., Steinman, B. A., & Stamps, L. (2017). Midcontinental native American population dynamics and late Holocene hydroclimate extremes. Scientific Reports, 7(1), Article 41628. https://doi.org/10.1038/srep41628
- Birkel, S. D., Mayewski, P. A., Maasch, K. A., Kurbatov, A. V., & Lyon, B. (2018). Evidence for a volcanic underpinning of the Atlantic multidecadal oscillation. NP Journal of Climateate and Atmospheric Science, 1(1), 24. https://doi.org/10.1038/s41612-018-0036-6
- Bjerknes, J. (1937). Die Theorie der aussertropischen Zyklonenbildung. Meteorologische Zeitschrift, 54, 460–466.
- Bjerknes, J. (1969). Atmospheric teleconnections from the equatorial Pacific. Monthly Weather Review, 97(3), 163–172. https://doi.org/10.1175/1520-0493(1969)097%3C0163:ATFTEP%3E2.3.CO;2
- Bjerknes, V. (1916). Uber thermodynamische Maschinen, die unter Mitwirkung der Schwerkraft arbeiten (vol. 35, issue 1, pp. 1–33). Abh. Akad. Wissensch.
- Black, D. E., Abahazi, M., Thunell, R., Kaplan, A., Tappa, E., & Peterson, L. C. (2007). An 8-century tropical Atlantic SST record from the Cariaco basin: Baseline variability, twentieth-century warming, and Atlantic hurricane frequency. Paleoceanography, 22(4), Article PA4204. https://doi.org/10.1029/2007PA001427
- Blanford, H. F. (1884). On the connexion of the Himalayan snowfall with dry winds and seasons of droughts in India. Proceedings of the Royal Society of London, 37(232-234), 3–22. https://doi.org/10.1098/rspl.1884.0003
- Bolin, B. (1950). On the influence of the earth's orography on the general character of the westerlies. Tellus, 2(3), 184–195. https://doi.org/10.3402/tellusa.v2i3.8547
- Boning, C. W., Behrens, E., Biastoch, A., Getzlaff, K., & Bamber, J. L. (2016). Emerging impact of Greenland meltwater on deepwater formation in the North Atlantic Ocean. Nature Geoscience, 9, 523–527. https://doi.org/10.1038/ngeo2740
- Booth, B. B. B., Dunstone, N. J., Halloran, P. R., Andrews, T., & Bellouin, N. (2012). Aerosols implicated as a prime driver of twentieth-century North Atlantic climate variability. Nature, 484, 228–232. https://doi.org/10.1038/nature10946
- Borgaonkar, H. P., Sikdera, A. B., Rama, S., & Panta, G. B. (2010). El Nino and related monsoon drought signals in 523-year-long ring width records of teak (Tectona grandis L.F.) trees from south India. Palaeogeography, Palaeoclimatology, Palaeoecology, 285(1-2), 74–84. https://doi.org/10.1016/j.palaeo.2009.10.026
- Briffa, K. R. (2000). Annual climate variability in the holocene: Interpreting the message of ancient trees. Quaternary Science Reviews, 19(1-5), 87–105. https://doi.org/10.1016/S0277-3791(99)00056-6
- Briffa, K. R., Bartholin, T. S., Eckstein, D., Jones, E. D., Karlrn, W., Schweingruber, E. H., & Zetterberg, P. (1990). A 1,400-year tree-ring record of summer temperatures in Fennoscandia. Nature, 346(6283), 434–439. https://doi.org/10.1038/346434a0
- Briffa, K. R., Jones, P. D., & Hulme, M. (1994). Summer moisture variability across Europe, 1892-1991: An analysis based on the Palmer drought severity index. International Journal of Climatology, 14(5), 475–506. https://doi.org/10.1002/joc.3370140502
- Broecker, W. S. (1987). The biggest chill. Natural History Magazine, 97, 74–82.
- Broecker, W. S. (1992). The great ocean conveyor, in Global Warming: Physics and Facts. In B. G. Levi, D. Hafemeister & R. Scribner (Eds.), (pp. 129–161).
- Broecker, W. S., Olson, E. A., & Orr, P. C. (1960). Radiocarbon measurements and annual rings in cave formations. Nature, 185(4706), 93–94. https://doi.org/10.1038/185093a0
- Brooks, C. E. P. (1928). The influence of forests on rainfall and run-off. Quarterly Journal of the Royal Meteorological Society, 54(225), 1–17. https://doi.org/10.1002/qj.49705422501
- Brooks, C. E. P., & Glasspoole, J. (1922). The drought of 1921. Quarterly Journal of the Royal Meteorological Society, 48(202), 139–168. https://doi.org/10.1002/qj.49704820205
- Brown, P. T., Lozier, M. S., Zhang, R., & Li, W. (2016). The necessity of cloud feedback for a basin-scale Atlantic Multidecadal Oscillation. Geophysical Research Letters, 43, 3955–3963. https://doi.org/10.1002/2016GL068303
- Bryson, R. A. (1973). Drought in Sahelia: Who or what is to blame? The Ecologist Quarterly, 3, 366–371. https://www.degruyter.com/database/IABO/entry/iab19740398/html
- Buckley, B. M., Anchukaitis, K. J., Penny, D., Fletcher, R., Cook, E. R., Sano, M., Nam, L. C., Wichienkeeo, A., Minh, T. T., & Hong, T. M. (2010). Climate as a contributing factor in the demise of Angkor, Cambodia. Proceedings of the National Academy of Sciences, 107(15), 6748–6752. https://doi.org/10.1073/pnas.0910827107
- Buhay, W., Simpson, S., Thorleifson, H., Lewis, M., King, J., Telka, A., Wilkinson, P., Babb, J., Timsic, S., & Bailey, D. (2009). A 1000-year record of dry conditions in the eastern Canadian prairies reconstructed from oxygen and carbon isotope measurements on Lake Winnipeg sediment organics. Journal of Quaternary Science, 24(5), 426–436. https://doi.org/10.1002/jqs.1293
- Buntgen, U., Tegel, W., Nicolussi, K., McCormick, M., Frank, D., Trouet, V., Kaplan, J. O., Herzig, F., Heussner, K.-U., Wanner, H., Luterbacher, J., & Esper, J. (2011). 2500 years of European climate variability and human susceptibility. Science, 331(6017), 578–582. https://doi.org/10.1126/science.1197175
- Burt, S. (2010). British Rainfall 1860-1993. Weather, 65(5), 121–128. https://doi.org/10.1002/wea.603
- Buso, A. A., Pessenda, L. C. R., Mayle, F. E., Lorente, F. L., Volkmer-Ribeiro, C., Schiavo, J. A., Pereira, M. G., Bendassolli, J. A., Macario, K. C. D., & Siqueira, G. S. (2019). Paleovegetation and paleoclimate dynamics during the last 7000 years in the Atlantic forest of southeastern Brazil based on palynology of a waterlogged sandy soil. Review of Palaeobotany and Palynology, 264, 1–10. https://doi.org/10.1016/j.revpalbo.2019.02.002
- Büntgen, U., Allen, K., Anchukaitis, K. J., Arseneault, D., Boucher, E., Bräuning, A., Chatterjee, S., Cherubini, P., Churakova, O. V., Corona, C., & Gennaretti, F. (2021). The influence of decision-making in tree ring-based climate reconstructions. Nature Communications, 12(1), 1–10. https://doi.org/10.1038/s41467-021-23627-6
- Campos, J. L. P. S., Cruz, F. W., Ambrizzi, T., Deininger, M., Vuille, M., Novello, V. F., & Strikis, N. M. (2019). Coherent South American Monsoon variability during the last millennium revealed through high-resolution proxy records. Geophysical Research Letters, 46(14), 8261–8270. https://doi.org/10.1029/2019GL082513
- Cane, M. A., Clement, A. C., Murphy, L. N., & Bellomo, K. (2017). Low-pass filtering, heat flux, & Atlantic multidecadal variability. Journal of Climate, 30, 7529-7553. https://doi.org/10.1175/JCLI-D-16-0810.1
- Chang, F.-C., & Wallace, J. (1987). Meteorological conditions during heat waves and droughts in the United States Great plains. Monthly Weather Review, 115(7), 1253–1269. https://doi.org/10.1175/1520-0493(1987)115%3C1253:MCDHWA%3E2.0.CO;2
- Chao, W. C. (2000). Multiple equilibria of the ITCZ and the origin of monsoon onset. Journal of the Atmospheric Sciences, 57(5), 641–652. https://doi.org/10.1175/1520-0469(2000)057%3C0641:MQEOTI%3E2.0.CO;2
- Chao, W. C., & Chen, B. (2001a). Multiple equilibria of the ITCZ and the origin of monsoon onset. Part II: Rotational ITCZ attractors. Journal of the Atmospheric Sciences, 58(18), 2820–2831. https://doi.org/10.1175/1520-0469(2001)058%3C2820:MQEOTI%3E2.0.CO;2
- Chao, W. C., & Chen, B. (2001b). The origin of monsoons. Journal of the Atmospheric Sciences, 58(22), 3497–3507. https://doi.org/10.1175/1520-0469(2001)058%3C3497:TOOM%3E2.0.CO;2
- Chao, W. C., & Chen, B. (2004). Single and double ITCZ in an aqua-planet model with constant SST and solar angle. Climate Dynamics, 22(4), 447–459. https://doi.org/10.1007/s00382-003-0387-4
- Charney, J. G. (1969). The intertropical convergence zone and the Hadley circulation of the atmosphere. Proceeding of the WMO/IUCG Symposium on Numerical Weather Prediction (pp. 73–79). November 26-December 4, 1968, Tokyo.
- Charney, J. G. (1971). Tropical cyclogenesis and the formation of the intertropical convergence zone. In W. H. Reid (Ed.), Mathematical problems of geophysical fluid dynamics (pp. 355–368). American Mathematics Society.
- Charney, J. G. (1975). Dynamics of deserts and drought in the sahel. Quarterly Journal of the Royal Meteorological Society, 101(428), 193–202. https://doi.org/10.1002/qj.49710142802
- Charney, J. G., & Eliassen, A. (1949). A numerical method for predicting the perturbations of the middle latitude westerlies. Tellus, 1(2), 38–54. https://doi.org/10.3402/tellusa.v1i2.8500
- Charney, J. G., Stone, P., & Quirk, W. (1975). Drought in the Sahara: A biogeophysical feedback mechanism. Science, 187(4175), 434–435. https://doi.org/10.1126/science.187.4175.434
- Charney, J., Quirk, W., Chow, S., & Kornfield, J. (1977). Comparative study of effects of albedo change on drought in semi-arid regions. Journal of the Atmospheric Sciences, 34(9), 1366–1385. https://doi.org/10.1175/1520-0469(1977)034%3C1366:ACSOTE%3E2.0.CO;2
- Chen, P., & Newman, M. (1998). Rossby wave propagation and the rapid development of upper-level anomalous anticyclones during the 1988 U.S. Drought. Journal of Climate, 11(10), 2491–2504. https://doi.org/10.1175/1520-0442(1998)011%3C2491:RWPATR%3E2.0.CO;2
- Chiessi, C., Mulitza, S., Patzold, J., Wefer, G., & Marengo, J. A. (2009). Possible impact of the Atlantic multidecadal oscillation on the South American summer monsoon. Geophysical Research Letters, 36(21), Article L21707. https://doi.org/10.1029/2009GL039914
- Christie, D. A., Boninsegna, J. A., Cleaveland, M. K., Lara, A., Le- Quesne, C., Morales, M. S., Mudelsee, M., Stahle, D., & Villalba, R. (2011). Aridity changes in the temperate-Mediterranean transition of the Andes since AD 1346 reconstructed from tree-rings. Climate Dynamics, 36(7-8), 1505–1521. https://doi.org/10.1007/s00382-009-0723-4
- Chu, P.-S. (1983). Diagnostic studies of rainfall anomalies in northeast Brazil. Monthly Weather Review, 111(8), 1655–1664. https://doi.org/10.1175/1520-0493(1983)111%3C1655:DSORAI%3E2.0.CO;2
- Chung, J. C. (1982). Correlations between the tropical Atlantic trade winds and precipitation in northeastern Brazil. Journal of Climatology, 2(1), 35–46. https://doi.org/10.1002/joc.3370020104
- Clement, A., Bellomo, K., Murphy, L., Cane, M., Mauritsen, T., Radel, G., & Stevens, B. (2015). The Atlantic multidecadal oscillation without a role for ocean circulation. Science, 350, 320–324. https://doi.org/10.1126/science.aab3980
- Clowes, A. J., & Deacon, G. E. R. (1935). The deep-water circulation of the Indian ocean. Nature, 136(3450), 936–938. https://doi.org/10.1038/136936a0
- Coachman, L. K., Hemmingson, E., & Scholader, P. F. (1958). Gases in glaciers. Science, 127(3309), 1288–1289. https://doi.org/10.1126/science.127.3309.1288
- Coats, S., Smerdon, J., Cook, B., & Seager, R. (2015). Are simulated megadroughts in the North American southwest forced? Journal of Climate, 28(1), 124–142. https://doi.org/10.1175/JCLI-D-14-00071.1
- Coats, S., Smerdon, J., Cook, B., Seager, R., Cook, E., & Anchukaitis, K. (2016). Internal ocean-atmosphere variability drives megadroughts in western North America. Geophysical Research Letters, 43(18), 9886–9894. https://doi.org/10.1002/2016GL070105
- Coats, S., Smerdon, J., Karnauskas, K. B., & Seager, R. (2016). The improbable but unexceptional occurrence of megadrought clustering in the American west during the Medieval Climate anomaly. Environmental Research Letters, 11(7), Article 074025. https://doi.org/10.1088/1748-9326/11/7/074025
- Coats, S., Smerdon, J., Seager, R., Cook, B., & Gonzalez-Rouco, J. (2013). Megadroughts in southwestern North America in ECHO-G millennial simulations and their comparison to proxy drought reconstructions. Journal of Climate, 26(19), 7635–7649. https://doi.org/10.1175/JCLI-D-12-00603.1
- Coats, S., Smerdon, J., Seager, R., Griffin, D., & Cook, B. (2015). Winter-to-summer precipitation phasing in southwestern North America: A multicentury perspective from paleoclimatic model-data comparisons. Journal of Geophysical Research: Atmospheres, 120(16), 8052–8064. https://doi.org/10.1002/2015JD023085
- Coelho, C. A. S., de Oliveira, C. P., Ambrizzi, T., Reboita, M. S., Carpenedo, C. B., Campos, J. L. P. S., Tomaziello, A. C. N., Pampuch, L. A., Custódio, M. d. S., Dutra, L. M. M., Da Rocha, R. P., & Rehbein, A. (2016). The 2014 southeast Brazil austral summer drought: Regional-scale mechanisms and teleconnections. Climate Dynamics, 46(11-12), 3737–3752. https://doi.org/10.1007/s00382-015-2800-1
- Cook, B. I., Ault, T., & Smerdon, J. (2015). Unprecedented 21st-century drought risk in the American Southwest and central plains. Science Advances, 1(1), Article e1400082. https://doi.org/10.1126/sciadv.1400082
- Cook, B. I., Cook, E. R., Smerdon, J. E., Seager, R., Williams, A. P., Coats, S., Stahle, D. W., & Díaz, J. V. (2016). North American megadroughts in the common era: Reconstructions and simulations. WIRES Climate Change, 7(3), 411–432. https://doi.org/10.1002/wcc.394
- Cook, B. I., Miller, R. L., & Seager, R. (2009). Amplification of the North American “dust bowl” drought through human-induced land degradation. Proceedings of the National Academy of Sciences, 106(13), 4997–5001. https://doi.org/10.1073/pnas.0810200106
- Cook, B. I., Seager, R., Miller, R. L., & Mason, J. A. (2013). Intensification of North American megadroughts through surface and dust aerosol forcing. Journal of Climate, 26(13), 4414–4430. https://doi.org/10.1175/JCLI-D-12-00022.1
- Cook, B. I., Smerdon, J., Seager, R., & Coats, S. (2014). Global warming and 21st century drying. Climate Dynamics, 43(9-10), 2607–2627. https://doi.org/10.1007/s00382-014-2075-y
- Cook, B. I., Williams, A. P., Smerdon, J. E., Palmer, J. G., Cook, E. R., Stahle, D. W., & Coats, S. (2018). Cold tropical Pacific sea surface temperatures during the late sixteenth-century North American megadrought. Journal of Geophysical Research: Atmospheres, 123(20), 11307–11320. https://doi.org/10.1029/2018JD029323
- Cook, E. R., Anchukaitis, K., Buckley, B., D'Arrigo, R., Jacoby, G., & Wright, W. (2010). Asian monsoon failure and megadrought during the last millennium. Science, 328(5977), 486–489. https://doi.org/10.1126/science.1185188
- Cook, E. R., Esper, J., & D'Arrigo, R. (2004). Extratropical northern hemisphere land temperature variability over the past 1000 years. Quaternary Science Reviews, 23(20-22), 2063–2074. https://doi.org/10.1016/j.quascirev.2004.08.013
- Cook, E. R., & Jacoby, G. C. (1977). Tree-ring-drought relationships in the Hudson Valley, New York. Science, 198(4315), 399–401. DOI: 10.1126/science.198.4315.399
- Cook, E. R., Krusic, P. J., Anchukaitis, K. J., Buckley, B. M., Nakatsuka, T., & Sano, M. (2013). Tree-ring reconstructed summer temperature anomalies for temperate East Asia since 800 CE. Climate Dynamics, 41(11-12), 2957–2972. https://doi.org/10.1007/s00382-012-1611-x
- Cook, E. R., Meko, D., Stahle, D., & Cleaveland, M. (1999). Drought reconstructions for the continental United States. Journal of Climate, 12(4), 1145–1162. https://doi.org/10.1175/1520-0442(1999)012%3C1145:DRFTCU%3E2.0.CO;2
- Cook, E. R., Seager, R., Cane, M., & Stahle, D. (2007). North American droughts: Reconstructions, causes and consequences. Earth-Science Reviews, 81(1-2), 93–134. https://doi.org/10.1016/j.earscirev.2006.12.002
- Cook, E. R., Seager, R., Heim, R. R., Vose, R. S., Herweijer, C., & Woodhouse, C. (2010). Megadroughts in North America: Placing IPCC projections of hydroclimatic change in a long-term palaeoclimate context. Journal of Quaternary Science, 25(1), 48–61. https://doi.org/10.1002/jqs.1303
- Cook, E. R., Seager, R., Kushnir, Y., Briffa, K. R., Büntgen, U., Frank, D., Krusic, P. J., Tegel, W., van der Schrier, G., Andreu-Hayles, L., Baillie, M., Baittinger, C., Bleicher, N., Bonde, N., Brown, D., Carrer, M., Cooper, R., Čufar, K., Dittmar, C., … Zang, C. (2015). Old world megadroughts and pluvials during the common era. Science Advances, 1(10), Article e1500561. https://doi.org/10.1126/sciadv.1500561
- Cook, E. R., Solomina, O., Matskovsky, V., Cook, B. I., Agafonov, L., Berdnikova, A., Dolgova, E., Karpukhin, A., Knysh, N., Kulakova, M., Kuznetsova, V., Kyncl, T., Kyncl, J., Maximova, O., Panyushkina, I., Seim, A., Tishin, D., Ważny, T., & Yermokhin, M. (2020). The European Russia drought Atlas (1400-2016 CE). Climate Dynamics, 54(3-4), 2317–2335. https://doi.org/10.1007/s00382-019-05115-2
- Cook, E. R., Woodhouse, C., Eakin, C., Meko, D., & Stahle, D. (2004). Long-term aridity changes in the western United States. Science, 306(5698), 1015–1018. https://doi.org/10.1126/science.1102586
- Covey, C., Gleckler, P. J., Doutriaux, C., Williams, D. N., Dai, A., Fasullo, J., Trenberth, K., & Berg, A. (2016). Metrics for the diurnal cycle of precipitation: Toward routine benchmarks for climate models. Journal of Climate, 29(12), 4461–4471. https://doi.org/10.1175/JCLI-D-15-0664.1
- Cronin, T. M., Hayo, K., Thunell, R., Dwyer, G., Saenger, C., & Willard, D. (2010). The Medieval climate anomaly and little ice age in chesapeake Bay and the North Atlantic Ocean. Palaeogeography, Palaeoclimatology, Palaeoecology, 297(2), 299–310. https://doi.org/10.1016/j.palaeo.2010.08.009
- Crowley, T. J., & Kim, K. (1999). Modeling the temperature response to forced climate change over the last six centuries. Geophysical Research Letters, 26(13), 1901–1904. https://doi.org/10.1029/1999GL900347
- Cunningham, L. K., Austin, W. E. N., Knudsen, K. L., Eirksson, J., Scourse, J. D., Wanamaker Jr., A. D., Butler, P. G., Cage, A., Richter, T., Husum, K., Hald, M., Andersson, C., Zorita, A., Linderholm, H. W., Gunnarson, B. E., Sicre, M. A., Sejrup, H. P., Jiang, H., & Wilson, R. J. S. (2013). Reconstructions of surface ocean conditions from the northeast Atlantic and nordic seas during the last millennium. The Holocene, 23(7), 921–935. https://doi.org/10.1177/0959683613479677
- Curtis, S. (2008). The Atlantic multidecadal oscillation and extreme daily precipitation over the US and Mexico during the hurricane season. Climate Dynamics, 30(4), 343–351. https://doi.org/10.1007/s00382-007-0295-0
- D'Arrigo, R. D., & Jacoby, G. C. (1991). A 1000-year record of winter precipitation from northwestern New Mexico, USA: A reconstruction from tree-rings and its relation to El Niño and the Southern oscillation. Holocene, 1(2), 95–101. https://doi.org/10.1177/095968369100100201
- D'Arrigo, R., Wilson, R., & Jacoby, G. (2006). On the long-term context for late twentieth century warming. Journal of Geophysical Research, 111(D3), Article D03103. https://doi.org/10.1029/2005JD006352
- Dai, A. (2011). Characteristics and trends in various forms of the Palmer Drought Severity Index during 1900-2008. Journal of Geophysical Research, 116(D12), Article D12115. https://doi.org/10.1029/2010JD015541
- Dai, A., Trenberth, K., & Karl, T. (1998). Global variations in droughts and wet spells: 1900-1995. Geophysical Research Letters, 25(17), 3367–3370. https://doi.org/10.1029/98GL52511
- Dansgaard, W., Johnsen, S., Moller, J., & Langway Jr., C. C. (1969). One thousand centuries of climate record from Camp century on the Greenland Ice sheet. Science, 166(3903), 377–381. https://doi.org/10.1126/science.166.3903.377
- Davis, M. (2001). Late victorian holocausts: El Nino famines and the making of the third world. Verso Books. 470 pp.
- Deardorff, J. (1978). Efficient prediction of ground surface temperature and moisture, with inclusion of a layer of vegetation. Journal of Geophysical Research, 83(C4), 1889–1903. https://doi.org/10.1029/JC083iC04p01889
- Dee, S. G., Steiger, N., Emile-Geay, J., & Hakim, G. (2016). On the utility of proxy system models for estimating climate states over the common era. Journal of Advances in Modeling Earth Systems, 8(3), 1164–1179. https://doi.org/10.1002/2016MS000677
- Delworth, T. L., & Greatbatch, R. J. (2000). Multidecadal thermohaline circulation variability driven by atmospheric surface flux forcing. Journal of Climate, 13, 1481–1495. https://doi.org/10.1175/1520-0442(2000)013%3C1481:MTCVDB%3E2.0.CO;2
- Delworth, T. L., Manabe, S., & Stouffer, R. J. (1993). Interdecadal variations of the thermohaline circulation in a coupled ocean-atmosphere model. Journal of Climate, 6, 1993–2011. https://doi.org/10.1175/1520-0442(1993)006%3C1993:IVOTTC%3E2.0.CO;2
- Delworth, T. L., & Zeng, F. (2012). Multicentennial variability of the Atlantic meridional overturning circulation and its climatic influence in a 4000 year simulation of the GFDL CM2.1 climate model. Geophysical Research Letters, 39(13), Article L13702. https://doi.org/10.1029/2012GL052107
- Delworth, T. L., Zhang, R., & Mann, M. (2007). Decadal to centennial variability of the Atlantic from observations and models. Geophysical Monograph Series, 173, 131–148. https://doi.org/10.1029/173GM10
- Delworth, T. L., Zhang, L., Zhang, R., Vecchi, G., & Yang, X. (2017). The central role of ocean dynamics in connecting the North Atlantic Oscillation to the extratropical component of the Atlantic multidecadal oscillation. Journal of Climate, 30, 3789–3805. https://doi.org/10.1175/JCLI-D-16-0358.1
- Denniston, R. F., Asmerom, Y., Polyak, V., Wanamaker Jr., A., Ummenhofer, C., Humphreys, W., Cugley, J., Woods, D., & Lucker, S. (2017). Decoupling of monsoon activity across the northern and southern indo-Pacific during the late glacial. Quaternary Science Reviews, 176, 101–105. https://doi.org/10.1016/j.quascirev.2017.09.014
- Dickinson, R. E., Henderson-Sellers, A., Kennedy, P., & Wilson, M. (1986). Biosphere-atmosphere transfer scheme (BATS) for the community climate model. NCAR Technical Note NCAR/TN-2751STR, 72 pp. https://doi.org/10.5065/D6668B58
- Dijkstra, H. A., Te Raa, L., Schmeits, M., & Gerrit, J. (2006). On the physics of the Atlantic multidecadal oscillation. Ocean Dynamics, 56, 36–50. https://doi.org/10.1007/s10236-005-0043-0
- Dima, M., & Lohmann, G. (2007). A hemispheric mechanism for the Atlantic multidecadal oscillation. Journal of Climate, 20, 2706–2719. https://doi.org/10.1175/JCLI4174.1
- Dirmeyer, P. A. (1994). Vegetation stress as a feedback mechanism in midlatitude drought. Journal of Climate, 7(10), 1463–1483. https://doi.org/10.1175/1520-0442(1994)007<1463:VSAAFM>2.0.CO;2
- Dirmeyer, P. A. (2011). The terrestrial segment of soil moisture-climate coupling. Geophysical Research Letters, 38(16), Article L16702. https://doi.org/10.1029/2011GL048268
- Dirmeyer, P. A., Chen, L., Wu, J., Shin, C.-S., Huang, B., Cash, B. A., Bosilovich, M. G., Mahanama, S., Koster, R. D., Santanello, J. A., Ek, M. B., Balsamo, G., Dutra, E., & Lawrence, D. M. (2018). Verification of land-atmosphere coupling in forecast models, reanalyses, and land surface models using flux site observations. Journal of Hydrometeorology, 19(2), 375–392. https://doi.org/10.1175/JHM-D-17-0152.1
- Dirmeyer, P. A., Koster, R., & Guo, Z. (2006). Do global models properly represent the feedback between land and atmosphere? Journal of Hydrometeorology, 7(6), 1177–1198. https://doi.org/10.1175/JHM532.1
- Dirmeyer, P. A., Wu, J., Norton, H. E., Dorigo, W. A., Quiring, S. M., Ford, T. W., Santanello, J. A., Bosilovich, M. G., Ek, M. B., Koster, R. D., Balsamo, G., & Lawrence, D. M. (2016). Confronting weather and climate models with observational data from soil moisture networks over the United States. Journal of Hydrometeorology, 17(4), 1049–1067. https://doi.org/10.1175/JHM-D-15-0196.1
- Domeisen, D. I., Garfinkel, C. I., & Butler, A. H. (2019). The teleconnection of El Niño southern oscillation to the stratosphere. Reviews of Geophysics, 57(1), 5–47. https://doi.org/10.1029/2018RG000596
- Doose-Rolinski, H., Rogalla, U. R., Scheeder, G., Luckge, A., & von Rad, U. (2001). High-resolution temperature and evaporation changes during the late Holocene in the northeastern Arabian Sea. Paleoceanography, 16(4), 358–367. https://doi.org/10.1029/2000PA000511
- Douglass, A. E. (1909). Weather cycles in the growth of big trees. Monthly Weather Review, 37(6), 225–237. https://doi.org/10.1175/1520-0493(1909)37[225d:WCITGO]2.0.CO;2
- Douglass, A. E. (1914). A method of estimating rainfall by the growth of trees. Bulletin of the American Geographical Society, 46(5), 321–335. https://doi.org/10.2307/201814
- Druyan, L. M. (1989). Advances in the study of sub-Saharan drought. International Journal of Climatology, 9(1), 77–90. https://doi.org/10.1002/joc.3370090107
- Edwards, T. W. D., Birks, S., Luckman, B., & MacDonald, G. (2008). Climatic and hydrologic variability during the past millennium in the eastern rocky mountains and northern great plains of western Canada. Quaternary Research, 70(2), 188–197. https://doi.org/10.1016/j.yqres.2008.04.013
- Edwards, T. W. D., Hammarlund, D., Newton, B., Sjolte, J., Linderson, H., Sturm, C., Amour, N., Bailey, J., & Nilsson, A. (2017). Seasonal variability in northern hemisphere atmospheric circulation during the medieval climate anomaly and the little ice age. Quaternary Science Reviews, 165, 102–110. https://doi.org/10.1016/j.quascirev.2017.04.018
- Egbert, G. D., & Ray, R. (2000). Significant dissipation of tidal energy in the deep ocean inferred from satellite altimeter data. Nature, 405(6788), 775–778. https://doi.org/10.1038/35015531
- Egbert, G. D., & Ray, R. D. (2003). Semi-diurnal and diurnal tidal dissipation from TOPEX Poseidon altimetry. Geophysical Research Letters, 30(17), 1907. https://doi.org/10.1029/2003GL017676
- Eichler, A., Olivier, S., Henderson, K., Laube, A., Beer, J., Papina, T., Gaggeler, H., & Schwikowski, M. (2009). Temperature response in the Altai region lags solar forcing. Geophysical Research Letters, 36(1), Article L01808. https://doi.org/10.1029/2008GL035930
- Eirìksson, J., Bartels-Jnsdûttir, H., Cage, A., Gudmundsdûttir, E., Klitgaard-Kristensen, D., Marret, F., Rodrigues, T., Abrantes, F., Austin, W., Jiang, H., Knudsen, K., & Sejrup, H. (2006). Variability of the North Atlantic current during the last 2000 years based on shelf bottom water and sea surface temperatures along an open ocean/shallow marine transect in Western Europe. The Holocene, 16(7), 1017–1029. https://doi.org/10.1177/0959683606hl991rp
- Elbert, J., Wartenburger, R., von Gunten, L., Urrutia, R., Fischer, D., Fujak, M., Hamann, Y., Greber, N. D., & Grosjean, M. (2013). Late Holocene air temperature variability reconstructed from the sediments of Laguna Escondida, Patagonia, Chile (45o30'S). Palaeogeography, Palaeoclimatology, Palaeoecology, 369, 482–492. https://doi.org/10.1016/j.palaeo.2012.11.013
- Enfield, D. B. (1996). Relationship of inter-American rainfall to tropical Atlantic and Pacific SST variability. Geophysical Research Letters, 23(23), 3305–3308. https://doi.org/10.1029/96GL03231
- Enfield, D. B., & Alfaro, E. J. (1999). The dependence of Caribbean rainfall on the interaction of the tropical Atlantic and Pacific Oceans. Journal of Climate, 12(7), 2093–2103. https://doi.org/10.1175/1520-0442(1999)012<2093:TDOCRO>2.0.CO;2
- Enfield, D. B., & Mayer, D. A. (1997). Tropical Atlantic sea surface temperature variability and its relation to El Niño-Southern oscillation. Journal of Geophysical Research: Oceans, 102(C1), 929–945. https://doi.org/10.1029/96JC03296
- Enfield, D. B., Mestas-Nunez, A. M., & Trimble, P. J. (2001). The Atlantic multidecadal oscillation and its relation to rainfall and river flows in the continental U.S. Geophysical Research Letters, 28(10), 2077–2080. https://doi.org/10.1029/2000GL012745
- Eslamian, S., Ostad-Ali-Askari, K., Singh, V. P., Dalezios, N. R., Ghane, M., Yihdego, Y., & Matouq, M. (2017). A review of drought indices. International Journal of Constructive Research in Civil Engineering (IJRCRE), 3(4), 48–66. https://doi.org/10.1016/j.jhydrol.2014.09.068
- Esper, J., Cook, E. R., & Schweingruber, F. H. (2002). Low-frequency signals in long tree-ring chronologies for reconstructing past temperature variability. Science, 295(5563), 2250–2253. https://doi.org/10.1126/science.1066208
- Esper, J., Frank, D. C., Timonen, M., Zorita, E., Wilson, R. J. S., Luterbacher, J., Holzkämper, S., Fischer, N., Wagner, S., Nievergelt, D., Verstege, A., & Büntgen, U. (2012). Orbital forcing of tree-ring data. Nature Climate Change, 2(12), 862–866. https://doi.org/10.1038/nclimate1589
- Evans, N. P., Bauska, T. K., Gazquez-sanchez, F., Brenner, M., Curtis, J. H., & Hodell, D. A. (2018). Quantification of drought during the collapse of the classic Maya civilization. Science, 361(6401), 498–501. https://doi.org/10.1126/science.aas9871
- Exner, F. M. (1913). Übermonatliche Witterungsanomalien auf der nördlichen Erdhälfte im Winter. Sitzungsberichte d. Kaiserl, Akad. der Wissenschaften, 122, 1165–1241.
- Fan, F., Mann, M., & Ammann, C. (2009). Understanding changes in the Asian summer monsoon over the past millennium: Insights from a long-term coupled model simulation. Journal of Climate, 22(7), 1736–1748. https://doi.org/10.1175/2008JCLI2336.1
- Fawcett, P. J., Werne, J. P., Anderson, R. S., Heikoop, J. M., Brown, E. T., Berke, M. A., Smith, S., Goff, F., Hurley, L., Cisneros-Dozal, L. M., Schouten, S., Sinninghe Damste, J. S., Huang, Y., Toney, J., Fessenden, J., Wolde Gabriel, G., Atudorei, V., Geissman, J. W., & Allen, C. D. (2011). Extended megadroughts in the southwestern United States during pleistocene interglacials. Nature, 470(7335), 518–521. https://doi.org/10.1038/nature09839
- Feng, J., & Li, J. P. (2013). Contrasting impacts of two types of ENSO on the boreal spring Hadley circulation. Journal of Climate, 26(13), 4773–4789. https://doi.org/10.1175/JCLI-D-12-00298.1
- Flynn, C. M., & Mauritsen, T. (2020). On the climate sensitivity and historical warming evolution in recent coupled model ensembles. Atmospheric Chemistry and Physics, 20(13), 7829–7842. https://doi.org/10.5194/acp-20-7829-2020
- Fohlmeister, J., Vollweiler, N., Spatl, C., & Mangini, A. (2013). COMNISPA II: Update of a mid-European isotope climate record, 11 ka to present. The Holocene, 23(5), 749–754. https://doi.org/10.1177/0959683612465446
- Folland, C. K., Palmer, T., & Parker, D. E. (1986). Sahel rainfall and worldwide sea temperatures, 1901-85. Nature, 320(6063), 602–607. https://doi.org/10.1038/320602a0
- Fontaine, B., Janicot, S., & Moron, V. (1995). Rainfall anomaly patterns and wind field signals over west Africa in August (1958–1989). Journal of Climate, 8(6), 1503–1510. https://doi.org/10.1175/1520-0442(1995)008<1503:RAPAWF>2.0.CO;2
- Forman, S. L., Oglesby, R., & Webb, R. S. (2001). Temporal and spatial patterns of Holocene dune activity on the great plains of North America: Megadroughts and climate links. Global and Planetary Change, 29(1–2), 1–29. https://doi.org/10.1016/S0921-8181(00)00092-8
- Frankcombe, L. M., von der Heydt, A., & Dijkstra, H. A. (2010). North Atlantic multidecadal climate variability: An investigation of dominant time scales and processes. Journal of Climate, 23, 3626–3638. https://doi.org/10.1175/2010JCLI3471.1
- Freise, F. W. (1938). The drought region of northeastern Brazil. Geographical Review, 28(3), 363–378. https://doi.org/10.2307/209736
- Frisinger, H. H. (1977). The history of meteorology to 1800. American Meteorological Society. 89 pp.
- Fritts, H. C. (1965). Tree-ring evidences for climatic changes in western North America. Monthly Weather Review, 93(7), 421–443. https://doi.org/10.1175/1520-0493(1965)093<0421:TREFCC>2.3.CO;2
- Gallicchio, N. (2017). Inventions of weather instruments (1400–1800). In K. Teague, & N. Gallicchio (Eds.), The evolution of meteorology: A look into the past, present, and future of weather and forecasting (pp. 11–17) Wiley. https://doi.org/10.1002/9781119136170.ch2
- Garrett, C. (2003). Internal tides and ocean mixing. Science, 301(5641), 1858–1859. https://doi.org/10.1126/science.1090002
- Gergis, J., Neukom, R., Gallant, A. J. E., & Karoly, D. J. (2016). Australasian temperature reconstructions spanning the last millennium. Journal of Climate, 29(15), 5365–5392. https://doi.org/10.1175/JCLI-D-13-00781.1
- Giannini, A., Saravanan, R., & Chang, P. (2003). Oceanic forcing of Sahel rainfall on interannual to interdecadal time scales. Science, 302(5647), 1027–1030. https://doi.org/10.1126/science.1089357
- Gill, A. (1980). Some simple solutions for heat-induced tropical circulation. Quarterly Journal of the Royal Meteorological Society, 106(449), 447–462. https://doi.org/10.1002/qj.49710644905
- Goddard, L., Barnston, A. G., & Mason, S. J. (2003). Evaluation of the IRI’s ‘net assessment’ seasonal climate forecasts: 1997–2001. Bulletin of the American Meteorological Society, 84(12), 1761–1782. https://doi.org/10.1175/BAMS-84-12-1761
- Gordon, A. L. (1986). Interocean exchange of thermocline water. Journal of Geophysical Research, 91(C4), 5037–5046. https://doi.org/10.1029/JC091iC04p05037
- Gordon, A. L. (1991). The role of thermohaline circulation in global climate change. Lamont-Doherty Geological Observatory 1990 and 1991 Report. Lamont-Doherty Earth Observatory Technical Report (pp. 44–51). https://academiccommons.columbia.edu/doi/10. 7916/D8M04G8H
- Goswami, B. N. (1998). Interannual variations of Indian summer monsoon in a GCM: External conditions versus internal feedbacks. Journal of Climate, 11(4), 501–522. https://doi.org/10.1175/1520-0442(1998)011<0501:IVOISM>2.0.CO;2
- Green, J. S. A. (1977). The weather during July 1976: Some dynamical considerations of the drought. Weather, 32(4), 120–126. https://doi.org/10.1002/j.1477-8696.1977.tb04532.x
- Grew, N. (1681). Musaeum Regalis Societatis Rawlins. pp. 357–358. W. Rawlins: London.
- Griffies, S. M., & Tziperman, E. (1995). A linear thermohaline oscillator driven by stochastic atmospheric forcing. Journal of Climate, 8, 2440–2453. https://doi.org/10.1175/1520-0442(1995)008%3C2440:ALTODB%3E2.0.CO;2
- Griffiths, M. L., Kimbrough, A., Gagan, M., Drysdale, R., Cole, J., Johnson, K., Zhao, J., Cook, B., Hellstrom, J., & Hantoro, W. (2016). Western Pacific hydroclimate linked to global climate variability over the past two millennia. Nature Communications, 7(1), Article 11719. https://doi.org/10.1038/ncomms11719
- Grimm, A. M. (2011). Interannual climate variability in South America: Impacts on seasonal precipitation, extreme events, and possible effects of climate change. Stochastic Environmental Research and Risk Assessment, 25(4), 537–554. https://doi.org/10.1007/s00477-010-0420-1
- Grimm, A. M., & Zilli, M. T. (2009). Interannual variability and seasonal evolution of summer monsoon rainfall in South America. Journal of Climate, 22(9), 2257–2275. https://doi.org/10.1175/2008JCLI2345.1
- Grist, J. P., & Nicholson, S. E. (2001). A study of the dynamic factors influencing the rainfall variability in the West African sahel. Journal of Climate, 14(7), 1337–1359. https://doi.org/10.1175/1520-0442(2001)014<1337:ASOTDF>2.0.CO;2
- Guillet, S., Corona, C., Stoffel, M., Khodri, M., Lavigne, F., Ortega, P., Eckert, N., Sielenou, P. D., Daux, V., Churakova (Sidorova), O., Davi, N., Edouard, J.-L., Zhang, Y., Luckman, B., Myglan, V. S., Guiot, J., Beniston, M., Masson-Delmotte, V., & Oppenheimer, C. (2017). Climate response to the samalas volcanic eruption in 1257 revealed by proxy records. Nature Geoscience, 10(2), 123–128. https://doi.org/10.1038/ngeo2875
- Guinn, J. M. (1890). Exceptional years: A history of California floods and drought. Historical Society of Southern California, 1(5), 33–39. https://doi.org/10.2307/41167825
- Guo, Q. (1992). Teleconnection between the floods/droughts in North China and Indian summer monsoon rainfall. Acta Geographica Sinica, 47, 394–402. https://doi.org/10.11821/xb199205002
- Guo, Z., Dirmeyer, P. A., Koster, R. D., Sud, Y. C., Bonan, G., Oleson, K. W., Chan, E., Verseghy, D., Cox, P., Gordon, C. T., McGregor, J. L., Kanae, S., Kowalczyk, E., Lawrence, D., Liu, P., Mocko, D., Lu, C.-H., Mitchell, K., Malyshev, S., … Xue, Y. (2006). ). GLACE: The global land-atmosphere coupling experiment. Part II: Analysis. Journal of Hydrometeorology, 7(4), 611–625. https://doi.org/10.1175/JHM511.1
- Guttman, N. B., Wallis, J. R., & Hosking, J. R. M. (1992). Spatial comparability of the Palmer Drought Severity Index. Journal of the American Water Resources Association, 28(6), 1111–1119. https://doi.org/10.1111/j.1752-1688.1992.tb04022.x
- Hakim, G. J., Emile-Geay, J., Steig, E., Noone, D., Anderson, D., Tardif, R., Steiger, N., & Perkins, W. (2016). The last millennium climate reanalysis project: Framework and first results. Journal of Geophysical Research: Atmospheres, 121(12), 6745–6764. https://doi.org/10.1002/2016JD024751
- Halley, E. (1686). An historical account of the trade winds and monsoons observable in the seas between and near the tropics with an attempt to assign a physical cause of the said winds. Philosophical Transactions of the Royal Society of London, 16(183), 153–168. https://doi.org/10.1098/rstl.1686.0026
- Hanson, P. R., Arbogast, A., Johnson, W., Joeckel, R., & Young, A. (2010). Megadroughts and late Holocene dune activation at the eastern margin of the Great Plains, north-central kansas, USA. Aeolian Research, 1(3), 101–110. https://doi.org/10.1016/j.aeolia.2009.10.002
- Hao, Z., Zheng, J., Zhang, X., Liu, H., Li, M., & Ge, Q. (2016). Spatial patterns of precipitation anomalies in eastern China during centennial cold and warm periods of the past 2000 years. International Journal of Climatology, 36(1), 467–475. https://doi.org/10.1002/joc.4367
- Hartl-Meier, C. T. M., Buntgen, U., Smerdon, J. E., Zorita, E., Krusic, P. J., Ljungqvist, F. C., Schneider, L., & Esper, J. (2017). Temperature covariance in tree ring reconstructions and model simulations over the past millennium. Geophysical Research Letters, 44(18), 9458–9469. https://doi.org/10.1002/2017GL073239
- Hasumi, H., Yasuda, I., Tatebe, H., & Kimoto, M. (2008). Pacific bidecadal climate variability regulated by tidal mixing around the Kuril Islands. Geophysical Research Letters, 35, L14601, https://doi.org/10.1029/2008GL034406
- Heim, R. (2002). A review of twentieth-century drought indices used in the United States. Bulletin of the American Meteorological Society, 83(8), 1149–1166. https://doi.org/10.1175/1520-0477-83.8.1149
- Helama, S., Merilainen, J., & Tuomenvirta, H. (2009). Multicentennial megadrought in Northern Europe coincided with a global El Nino-Southern Oscillation drought pattern during the medieval climate anomaly. Geology, 37(2), 175–178. https://doi.org/10.1130/G25329A.1
- Helama, S., Seppa, H., Bjune, A. E., & Birks, H. J. B. (2012). Fusing pollen-stratigraphic and dendroclimatic proxy data to reconstruct summer temperature variability during the past 7.5 ka in subarctic Fennoscandia. Journal of Paleolimnology, 48(1), 275–286. https://doi.org/10.1007/s10933-012-9598-1
- Held, I. M. (2019). 100 years of progress in understanding the general circulation of the atmosphere. Meteorological Monographs, 59, 6.1–6.23. https://doi.org/10.1175/AMSMONOGRAPHS-D-18-0017.1
- Held, I. M., Delworth, T., Lu, J., Findell, K., & Knutson, T. (2005). Simulation of Sahel drought in the 20th and 21st centuries. Proceedings of the National Academy of Sciences, 102(50), 17891–17896. https://doi.org/10.1073/pnas.0509057102
- Held, I. M., & Hou, A. Y. (1980). Nonlinear axially symmetric circulations in a nearly inviscid atmosphere. Journal of the Atmospheric Sciences, 37(3), 515–533. https://doi.org/10.1175/1520-0469(1980)037<0515:NASCIA>2.0.CO;2
- Held, I. M., Panetta, R., & Pierrehumbert, R. (1985). Stationary external Rossby waves in vertical shear. Journal of the Atmospheric Sciences, 42(9), 865–883. https://doi.org/10.1175/1520-0469(1985)042<0865:SERWIV>2.0.CO;2
- Henry, A. J. (1930a). The great drought of 1930 in the United States. Monthly Weather Review, 58(9), 351–354. https://doi.org/10.1175/1520-0493(1930)58<351:TGDOIT>2.0.CO;2
- Henry, A. J. (1930b). The great drought of 1930 in the United States - supplemental notes. Monthly Weather Review, 58(10), 396–401. https://doi.org/10.1175/1520-0493(1930)58<396:TGDOIT>2.0.CO;2
- Hess, P. G., Battisti, D., & Rasch, P. (1993). Maintenance of the intertropical convergence zones and the large-scale circulation on a water-covered earth. Journal of the Atmospheric Sciences, 50(5), 691–713. https://doi.org/10.1175/1520-0469(1993)050<0691:MOTICZ>2.0.CO;2
- Hildebrandsson, H. H. (1897). Quelques recherches sur les centres d'action de l'atmosphere. I-IV. Kungliga Svenska Vetenskaps-Akademiens Handlingar, Vol. 29, No. 3, 36 pp.
- Hoerling, M., Hurrell, J., Xu, T., Bates, G., & Phillips, A. (2004). Twentieth century North Atlantic climate change. Part II: Understanding the effect of Indian Ocean warming. Climate Dynamics, 23(3-4), 391–405. https://doi.org/10.1007/s00382-004-0433-x
- Hoerling, M. P., Eischeid, J., Kumar, A., Leung, R., Mariotti, A., Mo, K., Schubert, S., & Seager, R. (2014). Causes and predictability of the 2012 Great Plains drought. Bulletin of the American Meteorological Society, 95(2), 269–282. https://doi.org/10.1175/BAMS-D-13-00055.1
- Hoerling, M. P., & Kumar, A. (2003). The perfect ocean for drought. Science, 299(5607), 691–694. https://doi.org/10.1126/science.1079053
- Holton, J. R. (1992). An introduction to dynamic meteorology. 3rd ed., 511 pp. Academic Press.
- Holton, J. R., Wallace, J., & Young, J. (1971). On boundary layer dynamics and the ITCZ. Journal of the Atmospheric Sciences, 28(2), 275–280. https://doi.org/10.1175/1520-0469(1971)028<0275:OBLDAT>2.0.CO;2
- Horel, J. D., & Wallace, J. (1981). Planetary-scale atmospheric phenomena associated with the southern oscillation. Monthly Weather Review, 109(4), 813–829. https://doi.org/10.1175/1520-0493(1981)109<0813:PSAPAW>2.0.CO;2
- Hoskins, B. J., & Ambrizzi, T. (1993). Rossby wave propagation on a realistic longitudinally varying flow. Journal of the Atmospheric Sciences, 50(12), 1661–1671. https://doi.org/10.1175/1520-0469(1993)050<1661:RWPOAR>2.0.CO;2
- Hoskins, B. J., & Karoly, D. (1981). The steady linear response of a spherical atmosphere to thermal and orographic forcing. Journal of the Atmospheric Sciences, 38(6), 1179–1196. https://doi.org/10.1175/1520-0469(1981)038<1179:TSLROA>2.0.CO;2
- Hoskins, B. J., & Rodwell, M. (1995). A model of the Asian summer monsoon. Part I: The global scale. Journal of the Atmospheric Sciences, 52(9), 1329–1340. https://doi.org/10.1175/1520-0469(1995)052<1329:AMOTAS>2.0.CO;2
- Houze, R. A. (2014). Cloud dynamics (2nd ed). Elsevier.
- Hu, Q., & Feng, S. (2008). Variation of the North American summer monsoon regimes and the Atlantic multidecadal oscillations. Journal of Climate, 21(11), 2371–2383. https://doi.org/10.1175/2007JCLI2005.1
- Huang, B., Thorne, P. W., Banzon, V. F., Boyer, T., Chepurin, G., Lawrimore, J. H., Menne, M. J., Smith, T. M., Vose, R. S., & Zhang, H.-M. (2017). Extended reconstructed Sea surface temperature version 5 (ERSSTv5). upgrades, validations, and intercomparisons. Journal of Climate, 30(20), 8179–8205. https://doi.org/10.1175/JCLI-D-16-0836.1
- Huang, R. X. (1999). Mixing and energetics of the oceanic thermohaline circulation. Journal of Physical Oceanography, 29(4), 727–746. https://doi.org/10.1175/1520-0485(1999)029<0727:MAEOTO>2.0.CO;2
- Huber, B. (1935). Die physiologische Bedeutung der Ring-und Zerstreutporigkeit. Berichte Deutsche Botanische Gesellschaft, 53, 711–719.
- Hurrell, J. W. (1995). Decadal trends in the North Atlantic oscillation regional temperatures and precipitation. Science, 269(5224), 676–679. https://doi.org/10.1126/science.269.5224.676
- Hutchins, D. E. (1889). Cycles of drought and good seasons in South Africa. Wynberg Times Steam Printing Office. 137 pp.
- Huybers, P., & Curry, W. (2006). Links between annual, milankovitch and continuum temperature variability. Nature, 441(7091), 329–332. https://doi.org/10.1038/nature04745
- Isaksson, E., Divine, D., Kohler, J., Martma, T., Pohjola, V., Motoyama, H., & Watanabe, O. (2005). Climate oscillations as recorded in Svalbard ice core ω18o records between ad 1200 and 1997. Geografiska Annaler: Series A, Physical Geography, 87(1), 203–214. https://doi.org/10.1111/j.0435-3676.2005.00253.x
- Isono, D., Yamamoto, M., Irino, T., Oba, T., Murayama, M., Nakamura, T., & Kawahata, H. (2009). The 1,500-year climate oscillation in the mid-latitude North Pacific during the Holocene. Geology, 37, 591–594. https://doi.org/10.1130/g25667a.1
- Jeffreys, H. (1925). On fluid motions produced by differences of temperature and humidity. Quarterly Journal of the Royal Meteorological Society, 51(216), 347–356. https://doi.org/10.1002/qj.49705121604
- Jin, F.-F. (1997). An equatorial ocean recharge paradigm for ENSO. Part I: Conceptual model. Journal of the Atmospheric Sciences, 54, 811–829. https://doi.org/10.1175/1520-0469(1997)054%3C0811:AEORPF%3E2.0.CO;2
- Johnsen, S. J., Dansgaard, W., Clausen, H. B., & Langway, C. C. (1970). Climatic oscillations 1200-2000 A.D. Nature, 227(5257), 482–483. https://doi.org/10.1038/227482a0
- Jones, P. D., Briffa, K. R., Barnett, T. P., & Tett, S. F. B. (1998). High-resolution palaeoclimatic records for the past millennium - interpretation, integration and comparison with general circulation model control-run temperatures. The Holocene, 8(4), 455–471. https://doi.org/10.1191/095968398667194956
- Jones, P. D., Briffa, K. R., Osborn, T. J., Lough, J. M., van Ommen, T. D., Vinther, B. M., Luterbacher, J., Wahl, E. R., Zwiers, F. W., Mann, M. E., Schmidt, G. A., Ammann, C. M., Buckley, B. M., Cobb, K. M., Esper, J., Goosse, H., Graham, N., Jansen, E., Kiefer, T., … Xoplaki, E. (2009). High-resolution palaeoclimatology of the last millennium: A review of current status and future prospects. Holocene, 19(1), 3–49. https://doi.org/10.1177/0959683608098952
- Kanamitsu, M., & Krishnamurti, T. N. (1978). Northern summer tropical circulations during drought and normal rainfall months. Monthly Weather Review, 106(3), 331–347. https://doi.org/10.1175/1520-0493(1978)106<0331:NSTCDD>2.0.CO;2
- Kanner, L. C., Burns, S., Cheng, H., Edwards, R., & Vuille, M. (2013). High-resolution variability of the South American summer monsoon over the last seven millennia: Insights from a speleothem record from the central Peruvian Andes. Quaternary Science Reviews, 75, 1–10. https://doi.org/10.1016/j.quascirev.2013.05.008
- Kapteyn, J. C. (1914). Tree-growth and meteorological factors. Recueil des Travaux Botaniques Nerlandais, 11(1), 70–93. https://natuurtijdschriften.nl/pub/552498
- Karl, T. R., & Koscielny, A. J. (1982). Drought in the United States: 1895-1981. Journal of Climatology, 2(4), 313–329. https://doi.org/10.1002/joc.3370020402
- Karoly, D. J. (1989). Southern Hemisphere circulation features associated with El Niño-Southern Oscillation events. Journal of Climate, 2(11), 1239–1252. https://doi.org/10.1175/1520-0442(1989)002<1239:SHCFAW>2.0.CO;2
- Kaspari, S., Mayewski, P., Kang, S., Sneed, S., Hou, S., Hooke, R., Kreutz, K., Introne, D., Handley, M., Maasch, K., Qin, D., & Ren, J. (2007). Reduction in northward incursions of the South Asian monsoon since ∼1400 AD inferred from a Mt. Everest ice core. Geophysical Research Letters, 34, Article L16701. https://doi.org/10.1029/2007GL030440
- Kayano, M. T., & Capistrano, V. (2014). How the Atlantic multidecadal oscillation (AMO) modifies the ENSO influence on the South American rainfall. International Journal of Climatology, 34(1), 162–178. https://doi.org/10.1002/joc.3674
- Keen, E. P. (1937). Climatic cycles in eastern Oregon indicated by tree rings. Monthly Weather Review, 65, 183–188. https://doi.org/10.1175/1520-0493(1937)65%3C175:CCIEOA%3E2.0.CO;2
- Keigwin, L. D. (1996). The little ice age and medieval warm period in the Sargasso Sea. Science, 274(5292), 1504–1508. https://doi.org/10.1126/science.274.5292.1504
- Kellerhals, T., Brutsch, S., Sigl, M., Knusel, S., Gaggeler, H., & Schwikowski, M. (2010). Ammonium concentration in ice cores: A new proxy for regional temperature reconstruction? Journal of Geophysical Research, 115(D16), Article D16123. https://doi.org/10.1029/2009JD012603
- Kennett, D. J., Breitenbach, S. F. M., Aquino, V. V., Asmerom, Y., Awe, J., Baldini, J. U. L., Bartlein, P., Culleton, B. J., Ebert, C., Jazwa, C., Macri, M. J., Marwan, N., Polyak, V., Prufer, K. M., Ridley, H. E., Sodemann, H., Winterhalder, B., & Haug, G. H. (2012). Development and disintegration of Maya political Systems in response to climate change. Science, 338(6108), 788–791. https://doi.org/10.1126/science.1226299
- Keshavamurty, R. N., & Awade, S. (1974). Dynamical abnormalities associated with drought in the Asiatic summer monsoon. MAUSAM, 25, 257–264. https://doi.org/10.54302/mausam.v25i2.5201
- Keyantash, J., & Dracup, J. (2002). The quantification of drought: An evaluation of drought indices. Bulletin of the American Meteorological Society, 83(8), 1167–1180. https://doi.org/10.1175/1520-0477-83.8.1167
- Kidd, C., Becker, A., Huffman, G. J., Muller, C. L., Joe, P., Skofronick-Jackson, G., & Kirschbaum, D. B. (2017). So, how much of the Earth's surface is covered by rain gauges? Bulletin of the American Meteorological Society, 98(1), 69–78. https://doi.org/10.1175/BAMS-D-14-00283.1
- Kidd, C., & Levizzani, V. (2011). Status of satellite precipitation retrievals. Hydrology and Earth System Sciences, 15(4), 1109–1116. https://doi.org/10.5194/hess-15-1109-2011
- Kilbourne, K. H., Quinn, T., Webb, R., Guilderson, T., Nyberg, J., & Winter, A. (2008). Paleoclimate proxy perspective on Caribbean climate since the year 1751: Evidence of cooler temperatures and multidecadal variability. Paleoceanography, 23(3), Article PA3220. https://doi.org/10.1029/2008PA001598
- King, J. M., Anchukaitis, K. J., Tierney, J. E., Hakim, G. J., Emile-Geay, J., Zhu, F., & Wilson, R. (2021). A data assimilation approach to last millennium temperature field reconstruction using a limited high-sensitivity proxy network. Journal of Climate, 1–64. https://doi.org/10.1175/jcli-d-20-0661.1
- Kingston, D. G., Fleig, A., Tallaksen, L., & Hannah, D. (2013). Ocean-atmosphere forcing of summer streamflow drought in Great Britain. Journal of Hydrometeorology, 14(1), 331–344. https://doi.org/10.1175/JHM-D-11-0100.1
- Kingston, D. G., Stagge, J., Tallaksen, L., & Hannah, D. (2015). European-scale drought: Understanding connections between atmospheric circulation and meteorological drought indices. Journal of Climate, 28(2), 505–516. https://doi.org/10.1175/JCLI-D-14-00001.1
- Kinnard, C., Zdanowicz, C., Fisher, D., Isaksson, E., de Vernal, A., & Thompson, L. (2011). Reconstructed changes in Arctic sea ice over the past 1,450 years. Nature, 479(7374), 509–512. https://doi.org/10.1038/nature10581
- Klein, F., Goosse, H., Graham, N. E., & Verschuren, D. (2016). Comparison of simulated & reconstructed variations in East African hydroclimate over the last millennium. Climate of the Past, 12(7), 1499–1518. https://doi.org/10.5194/cp-12-1499-2016
- Klein, S. A., Soden, B., & Lau, N. (1999). Remote sea surface variations during ENSO: Evidence for a tropical atmospheric bridge. Journal of Climate, 12(4), 917–932. https://doi.org/10.1175/1520-0442(1999)012<0917:RSSTVD>2.0.CO;2
- Klein, W. H. (1952). The weather and circulation of June 1952: A month with a record heat wave. Monthly Weather Review, 80(6), 99–104. https://doi.org/10.1175/1520-0493(1952)080<0099:TWACOJ>2.0.CO;2
- Knudsen, M. F., Jacobsen, B. H., Seidenkrantz, M. S., & Olsen, J. (2014). Evidence for external forcing of the Atlantic multidecadal oscillation since termination of the Little Ice Age. Nature Communications, 5, 3323. https://doi.org/10.1038/ncomms4323
- Koch-Larrouy, A., Atmadipoera, A., van Beek, P., Madec, G., Aucan, J., Lyard, F., Grelet, J., & Souhaut, M. (2015). Estimates of tidal mixing in the Indonesian archipelago from multidisciplinary INDOMIX in-situ data. Deep Sea Research Part I: Oceanographic Research Papers, 106, 136–153. https://doi.org/10.1016/j.dsr.2015.09.007
- Koch-Larrouy, A., Lengaigne, M., Terray, P., Madec, G., & Masson, S. (2010). Tidal mixing in the Indonesian seas and its effect on the tropical climate system. Climate Dynamics, 34(6), 891–904. https://doi.org/10.1007/s00382-009-0642-4
- Kohfeld, K. E., & Harrison, S. P. (2001). DIRTMAP: The geological record of dust. Earth-Science Reviews, 54(1-3), 81–114. https://doi.org/10.1016/S0012-8252(01)00042-3
- Koster, R. D., Dirmeyer, P. A., Guo, Z., Bonan, G., Chan, E., Cox, P., Gordon, C. T., Kanae, S., Kowalczyk, E., Lawrence, D., Liu, P., Lu, C.-H., Malyshev, S., McAvaney, B., Mitchell, K., Mocko, D., Oki, T., Oleson, K., Pitman, A., … Yamada, T. (2004). Regions of strong coupling between soil moisture and precipitation. Science, 305(5687), 1138–1140. https://doi.org/10.1126/science.1100217
- Koster, R. D., Suarez, M. J., Higgins, R. W., & van den Dool, H. (2003). Observational evidence that soil moisture variations affect precipitation. Geophysical Research Letters, 30(5), Article 1241. https://doi.org/10.1029/2002GL016571
- Koster, R. D., Sud, Y. C., Guo, Z., Dirmeyer, P. A., Bonan, G., Oleson, K. W., Chan, E., Verseghy, D., Cox, P., Davies, H., Kowalczyk, E., Gordon, C. T., Kanae, S., Lawrence, D., Liu, P., Mocko, D., Lu, C.-H., Mitchell, K., Malyshev, S., … Xue, Y. (2006). GLACE: The Global Land-Atmosphere Coupling Experiment. Part I: Overview. Journal of Hydrometeorology, 7(4), 590–610. https://doi.org/10.1175/JHM510.1
- Krishnan, R., Kumar, V., Sugi, M., & Yoshimura, J. (2009). Internal feedbacks from monsoon-midlatitude interactions during droughts in the Indian summer monsoon. Journal of the Atmospheric Sciences, 66(3), 553–578. https://doi.org/10.1175/2008JAS2723.1
- Krishnan, R., Ramesh, K., Samala, B., Meyers, G., Slingo, J., & Fennessy, M. (2006). Indian Ocean-monsoon coupled interactions and impending monsoon droughts. Geophysical Research Letters, 33(8), Article L08711. https://doi.org/10.1029/2006GL025811
- Kuhlbrodt, T., Griesel, A., Montoya, M., Levermann, A., Hofmann, M., & Rahmstorf, S. (2007). On the driving processes of the Atlantic meridional overturning circulation. Reviews of Geophysics, 45(2), Article RG2001. https://doi.org/10.1029/2004RG000166
- Kushnir, Y., & Held, I. (1996). Equilibrium atmospheric responses to North Atlantic SST anomalies. Journal of Climate, 9(6), 1208–1220. https://doi.org/10.1175/1520-0442(1996)009<1208:EARTNA>2.0.CO;2
- Kushnir, Y., Robinson, W., Blade, I., Hall, J., Peng, S., & Sutton, R. (2002). Atmospheric GCM response to extratropical SST anomalies: Synthesis and evaluation. Journal of Climate, 15(16), 2233–2256. https://doi.org/10.1175/1520-0442(2002)015<2233:AGRTES>2.0.CO;2
- Lachniet, M. S., Asmerom, Y., Polyak, V., & Bernal, J. P. (2017). Two millennia of mesoamerican monsoon variability driven by Pacific and Atlantic synergistic forcing. Quaternary Science Reviews, 155, 100–113. https://doi.org/10.1016/j.quascirev.2016.11.012
- Laepple, T., & Huybers, P. (2014a). Ocean surface temperature variability: Large model-data differences at decadal and longer periods. Proceedings of the National Academy of Sciences, 111(47), 16682–16687. https://doi.org/10.1073/pnas.1412077111
- Laepple, T., & Huybers, P. (2014b). Global and regional variability in marine surface temperatures. Geophysical Research Letters, 41(7), 2528–2534. https://doi.org/10.1002/2014GL059345
- Lamb, H. H. (1965). The early medieval warm epoch and its sequel. Palaeogeography, Palaeoclimatology, Palaeoecology, 1, 13–37. https://doi.org/10.1016/0031-0182(65)90004-0
- Langway Jr., C. C., Oeschger, H., Alder, B., & Renaud, A. (1965). Sampling polar ice for radiocarbon dating. Nature, 206(4983), 500–501. https://doi.org/10.1038/206500a0
- Latif, M., Boening, C., Willenbrand, J., Biastoch, A., & Keenlyside, N. (2007). Decadal to multidecadal variability of the MOC: Mechanisms and predictability. Geophysical Monograph, 173, 149–166. https://doi.org/10.1029/173GM11
- Latif, M., Martin, T., & Park, W. (2013). Southern Ocean sector centennial climate variability and recent decadal trends. Journal of Climate, 26(19), 7767–7782. https://doi.org/10.1175/JCLI-D-12-00281.1
- Latif, M., Roeckner, E., Botzet, M., Esch, M., Haak, H., Hagemann, S., Jungclaus, J., Legutke, S., Marsland, S., Mikolajewicz, U., & Mitchell, J. (2004). Reconstructing, monitoring, and predicting multidecadal-scale changes in the North Atlantic thermohaline circulation with sea surface temperature. Journal of Climate, 17(7). 1605–1614. https://doi.org/10.1175/1520-0442(2004)017%3C1605:RMAPMC%3E2.0.CO;2
- Lau, K. M. (1985). Elements of a stochastic-dynamical theory of long-term variability of the El Niño-Southern oscillation. Journal of the Atmospheric Sciences, 42(14), 1552–1558. https://doi.org/10.1175/1520-0469(1985)042<1552:EOASDT>2.0.CO;2
- Leavitt, S. W., Follett, R., Kimble, J., & Pruessner, E. (2007). Radiocarbon and d13C depth profiles of soil organic carbon in the U.S. Great Plains: A possible spatial record of paleoenvironment and paleovegetation. Quaternary International, 162–163, 21–34. https://doi.org/10.1016/j.quaint.2006.10.033
- Lechleitner, F. A., Breitenbach, S. F., Rehfeld, K., Ridley, H. E., Asmerom, Y., Prufer, K. M., Marwan, N., Goswami, B., Kennett, D. J., Aquino, V. V., & Polyak, V. (2017). Tropical rainfall over the last two millennia: Evidence for a low-latitude hydrologic seesaw. Scientific Reports, 7(1), Article 45809. https://doi.org/10.1038/srep45809
- Ledwell, J. R., Montgomery, E., Polzin, K., Laurent, L., Schmitt, R., & Toole, J. (2000). Evidence for enhanced mixing over rough topography in the abyssal ocean. Nature, 403(6766), 179–182. https://doi.org/10.1038/35003164
- Lee, S. K., & Wang, C. (2010). Delayed advective oscillation of the Atlantic thermohaline circulation. Journal of Climate, 23, 1254-1261. https://doi.org/10.1175/2009JCLI3339.1
- Li, Y., & Lau, N. (2012). Contributions of downstream eddy development to the teleconnection between ENSO and the atmospheric circulation over the North atlantic. Journal of Climate, 25(14), 4993–5010. https://doi.org/10.1175/JCLI-D-11-00377.1
- Lin, J. L. (2007). The double-ITCZ problem in IPCC AR4 coupled GCMs: Ocean-atmosphere feedback analysis. Journal of Climate, 20(18), 4497–4525. https://doi.org/10.1175/JCLI4272.1
- Lin, J. L., & Qian, T. (2019a). A New picture of the global impacts of El Niño-Southern oscillation. Scientific Reports, 9(1), Article 17543. https://doi.org/10.1038/s41598-019-54090-5
- Lin, J. L., & Qian, T. (2019b). Switch between El Niño and La Niña is caused by subsurface Ocean waves likely driven by Lunar tidal forcing. Scientific Reports, 9(1), Article 13106. https://www.nature.com/articles/s41598-019-49678-w. https://doi.org/10.1038/s41598-019-49678-w
- Lin, J. L., & Qian, T. (2022). The Atlantic multi-decadal oscillation. Atmosphere-Ocean, advanced online publication.
- Lin, J. L., Qian, T., Bechtold, P., Grell, G., Zhang, G., Zhu, P., Freitas, S., Barnes, H., & Han, J. (2022). Atmospheric convection. Atmosphere Ocean, advanced online publication.
- Lindzen, R. S. (1974). Wave-CISK in the tropics. Journal of the Atmospheric Sciences, 31(1), 156–179. https://doi.org/10.1175/1520-0469(1974)031<0156:WCITT>2.0.CO;2
- Liu, A. Z., Ting, M., & Wang, H. (1998). Maintenance of circulation anomalies during the 1988 drought and 1993 floods over the United States. Journal of the Atmospheric Sciences, 55(17), 2810–2832. https://doi.org/10.1175/1520-0469(1998)055<2810:MOCADT>2.0.CO;2
- Ljungqvist, F. C. (2009). Temperature proxy records covering the last two millennia: A tabular and visual overview. Geografiska Annaler: Series A, Physical Geography, 91(A1), 11–29. https://doi.org/10.1111/j.1468-0459.2009.00350.x
- Ljungqvist, F. C. (2010). A new reconstruction of temperature variability in the extra-tropical Northern Hemisphere during the last two millennia. Geografiska Annaler: Series A, Physical Geography, 92(3), 339–351. https://doi.org/10.1111/j.1468-0459.2010.00399.x
- Ljungqvist, F. C., Krusic, P., Brattstrom, G., & Sundqvist, H. (2012). Northern Hemisphere temperature patterns in the last 12 centuries. Climate of the Past, 8(1), 227–249. https://doi.org/10.5194/cp-8-227-2012
- Ljungqvist, F. C., Krusic, P., Sundqvist, H., Zorita, E., Brattstrom, G., & Frank, D. (2016). Northern Hemisphere hydroclimate variability over the past twelve centuries. Nature, 532(7597), 94–98. https://doi.org/10.1038/nature17418
- Ljungqvist, F. C., Seim, A., Krusic, P. J., González-Rouco, J. F., Werner, J. P., Cook, E. R., Zorita, E., Luterbacher, J., Xoplaki, E., Destouni, G., García-Bustamante, E., Aguilar, C. A. M., Seftigen, K., Wang, J., Gagen, M. H., Esper, J., Solomina, O., Fleitmann, D., & Büntgen, U. (2019). European warm-season temperature and hydroclimate since 850 CE. Environmental Research Letters, 14(8), Article 084015. https://iopscience.iop.org/article/10. 1088/1748-9326/ab2c7e/meta. https://doi.org/10.1088/1748-9326/ab2c7e
- Ljungqvist, F. C., Zhang, Q., Brattström, G., Krusic, P. J., Seim, A., Li, Q., Zhang, Q., & Moberg, A. (2019). Centennial-Scale temperature change in last millennium simulations and proxy-based reconstructions. Journal of Climate, 32(9), 2441–2482. https://doi.org/10.1175/JCLI-D-18-0525.1
- Lockyer, N., & Lockyer, W. J. S. (1902). On some phenomena which suggest a short period of solar and meteorological changes. Proceedings of the Royal Society of London, 70(459-466), 500–504. https://doi.org/10.1098/rspl.1902.0053
- Loder, J. W., & Garrett, C. (1978). The 18.6 year cycle of sea surface temperature in shallow seas due to variations in tidal mixing. Journal of Geophysical Research, 83(C4), 1967–1970. https://doi.org/10.1029/JC083iC04p01967
- Loope, G., Thompson, D., & Overpeck, J. (2020). The spectrum of Asian monsoon variability: A proxy system model approach to the hydroclimate scaling mismatch. Quaternary Science Reviews, 240, Article 106362. https://doi.org/10.1016/j.quascirev.2020.106362
- Lu, J., & Delworth, T. (2005). Oceanic forcing of the late 20th century Sahel drought. Geophysical Research Letters, 32, Article L22706. https://doi.org/10.1029/2005GL023316
- Lu, R., Dong, B., & Ding, H. (2006). Impact of the Atlantic multidecadal oscillation on the Asian summer monsoon. Geophysical Research Letters, 33(24), Article L24701. https://doi.org/10.1029/2006GL027655
- Luterbacher, J., Werner, J. P., Smerdon, J. E., Fernández-Donado, L., González-Rouco, F. J., Barriopedro, D., Ljungqvist, F. C., Büntgen, U., Zorita, E., Wagner, S., Esper, J., McCarroll, D., Toreti, A., Frank, D., Jungclaus, J. H., Barriendos, M., Bertolin, C., Bothe, O., Brázdil, R., … Zerefos, C. (2016). European summer temperatures since Roman times. Environmental Research Letters, 11(2), Article 024001. https://doi.org/10.1088/1748-9326/11/2/024001
- Lyon, B. (2014). Seasonal drought in the greater horn of Africa and its recent increase during the march-May long rains. Journal of Climate, 27(21), 7953–7975. https://doi.org/10.1175/JCLI-D-13-00459.1
- Magana, V., Amador, J., & Medina, S. (1999). The midsummer drought over Mexico and Central America. Journal of Climate, 12(6), 1577–1588. https://doi.org/10.1175/1520-0442(1999)012<1577:TMDOMA>2.0.CO;2
- Maher, B. A., Prospero, J., Mackie, D., Gaiero, D., Hesse, P., & Balkanski, Y. (2010). Global connections between aeolian dust, climate and ocean biogeochemistry at the present day and at the last glacial maximum. Earth-Science Reviews, 99(1-2), 61–97. https://doi.org/10.1016/j.earscirev.2009.12.001
- Man, W. M., Zhou, T., & Jungclaus, J. (2012). Simulation of the East Asian summer monsoon during the last millennium with the MPI earth system model. Journal of Climate, 25(22), 7852–7866. https://doi.org/10.1175/JCLI-D-11-00462.1
- Manabe, S. (1969). Climate and the ocean circulation: 1, the atmospheric circulation and the hydrology of the Earth's surface. Monthly Weather Review, 97(11), 739–774. https://doi.org/10.1175/1520-0493(1969)097<0739:CATOC>2.3.CO;2
- Mann, M. E., Bradley, R. S., & Hughes, M. K. (1999). Northern hemisphere temperatures during the past millennium: Inferences, uncertainties, and limitations. Geophysical Research Letters, 26(6), 759–762. https://doi.org/10.1029/1999GL900070
- Mann, M. E., Zhang, Z., Rutherford, S., Bradley, R. S., Hughes, M. K., Shindell, D., Ammann, C., Faluvegi, G., & Ni, F. (2009). Global signatures and dynamical origins of the little ice age and medieval climate anomaly. Science, 326(5957), 1256–1260. https://doi.org/10.1126/science.1177303
- Marengo, J. A., & Espinoza, J. (2016). Extreme seasonal droughts and floods in Amazonia: Causes, trends and impacts. International Journal of Climatology, 36(3), 1033–1050. https://doi.org/10.1002/joc.4420
- Markham, C. G., & McLain, D. (1977). Sea surface temperatures related to rain in Ceara northeastern Brazil. Nature, 265(5592), 320–323. https://doi.org/10.1038/265320a0
- Marriner, N., Flaux, C., Kaniewski, D., Morhange, C., Leduc, G., Moron, V., Chen, Z., Gasse, F., Empereur, J. Y., & Stanley, J. D. (2012). ITCZ and ENSO-like pacing of Nile delta hydro-geomorphology during the holocene. Quaternary Science Reviews, 45, 73–84. https://doi.org/10.1016/j.quascirev.2012.04.022
- Martin, T., Park, W., & Latif, M. (2013). Multi-centennial variability controlled by Southern Ocean convection in the Kiel Climate model. Climate Dynamics, 40(7-8), 2005–2022. https://doi.org/10.1007/s00382-012-1586-7
- Maupin, C. R., Partin, J., Shen, C., Quinn, T., Lin, K., Taylor, F., Banner, J., Thirumalai, K., & Sinclair, D. (2014). Persistent decadal-scale rainfall variability in the tropical South Pacific Convergence Zone through the past six centuries. Climate of the Past, 10(4), 1319–1332. https://doi.org/10.5194/cp-10-1319-2014
- McCabe-Glynn, S., Johnson, K. R., Strong, C., Berkelhammer, M., Sinha, A., Cheng, H., & Edwards, R. L. (2013). Variable North Pacific influence on drought in southwestern North America since AD 854. Nature Geoscience, 6(8), 617–621. https://doi.org/10.1038/ngeo1862
- McGowan, H., Marx, S. K., Moss, P., & Hammond, A. M. (2012). Evidence of ENSO mega-drought triggered collapse of prehistory aboriginal society in northwest Australia. Geophysical Research Letters, 39, Article L22702. https://doi.org/10.1029/2012GL053916
- McGregor, H. V., Evans, M. N., Goosse, H., Leduc, G., Martrat, B., Addison, J. A., Mortyn, P. G., Oppo, D. W., Seidenkrantz, M.-S., Sicre, M.-A., Phipps, S. J., Selvaraj, K., Thirumalai, K., Filipsson, H. L., & Ersek, V. (2015). Robust global ocean cooling trend for the pre-industrial Common Era. Nature Geoscience, 8(9), 671–677. https://doi.org/10.1038/ngeo2510
- McKee, T. B., Doesken, N., & Kleist, J. (1993). Drought monitoring with multiple timescales. Preprints, Eighth Conference on Applied Climatology (pp. 179–184), 17 - 22 January 1993, Anaheim, CA, American Meteorological Society.
- Medina-Elizalde, M., Burns, S., Lea, D., Asmerom, Y., von Gunten, L., Polyak, V., Vuille, M., & Karmalkar, A. (2010). High resolution stalagmite climate record from the Yucatan Peninsula spanning the Maya terminal classic period. Earth and Planetary Science Letters, 298(1–2), 255–262. https://doi.org/10.1016/j.epsl.2010.08.016
- Meehl, G. A., Senior, C. A., Eyring, V., Flato, G., Lamarque, J.-F., Stouffer, R. J., Taylor, K. E., & Schlund, M. (2020). Context for interpreting equilibrium climate sensitivity and transient climate response from the CMIP6 Earth System models. Science Advances, 6(26), Article eaba1981. https://doi.org/10.1126/sciadv.aba1981
- Meng, X. H., Evans, J. P., & McCabe, M. F. (2014). The impact of observed vegetation changes on land-atmosphere feedbacks during drought. Journal of Hydrometeorology, 15(2), 759–776. https://doi.org/10.1175/JHM-D-13-0130.1
- Miao, X., Mason, J., Swinehart, J., Loope, D., Hanson, P., Goble, R., & Liu, X. (2007). A 10,000 year record of dune activity, dust storms, and severe drought in the central Great plains. Geology, 35(2), 119–122. https://doi.org/10.1130/G23133A.1
- Mishra, A. K., & Singh, V. P. (2010). A review of drought concepts. Journal of Hydrology, 391(1–2), 202–216. https://doi.org/10.1016/j.jhydrol.2010.07.012
- Mishra, V., Tiwari, A. D., Aadhar, S., Shah, R., Xiao, M., Pai, D. S., & Lettenmaier, D. (2019). Drought and famine in India, 1870-2016. Geophysical Research Letters, 46(4), 2075–2083. https://doi.org/10.1029/2018GL081477
- Mjell, T. L., Ninnemann, U. S., Kleiven, H. F., & Hall, I. R. (2016). Multidecadal changes in Iceland Scotland Overflow Water vigor over the last 600 years and its relationship to climate. Geophysical Research Letters, 43, 2111–2117. https://doi.org/10.1002/2016GL068227
- Moberg, A., Sonechkln, D. M., Holmgren, K., Datsenko, N. M., & KarlÈn, W. (2005). Highly variable Northern Hemisphere temperatures reconstructed from low- and high-resolution proxy data. Nature, 433(7026), 613–617. https://doi.org/10.1038/nature03265
- Mohino, E., Rodríguez-Fonseca, B., Losada, T., Gervois, S., Janicot, S., Bader, J., Ruti, P., & Chauvin, F. (2011). Changes in the interannual SST-forced signals on West African rainfall. AGCM intercomparison. Climate Dynamics, 37(9-10), 1707–1725. https://doi.org/10.1007/s00382-011-1093-2
- Mooley, D. A., Parthasarathy, B., Sontakke, N. A., & Munot, A. A. (1981). Annual rain-water over India, its variability and impact on the economy. Journal of Climatology, 1(2), 167–186. https://doi.org/10.1002/joc.3370010206
- Moron, V., Bigot, S., & Roucou, P. (1995). Rainfall variability in subequatorial America and Africa and relationships with the main sea-surface temperature modes (1951-1990). International Journal of Climatology, 15(12), 1297–1322. https://doi.org/10.1002/joc.3370151202
- Mossman, R. C. (1919). The rainfall of fortaleza, ceara, Brazil. Quarterly Journal of the Royal Meteorological Society, 45, 69–79. https://doi.org/10.1002/qj.49704518908
- Moura, A. D., & Shukla, J. (1981). On the dynamics of droughts in northeast Brazil: Observation, theory, and numerical experiments with a general circulation model. Journal of the Atmospheric Sciences, 38(12), 2653–2675. https://doi.org/10.1175/1520-0469(1981)038<2653:OTDODI>2.0.CO;2
- Munk, W. (1966). Abyssal recipes I. Deep Sea Research and Oceanographic Abstracts, 13(4), 707–730. https://doi.org/10.1016/0011-7471(66)90602-4
- Munk, W., & Wunsch, C. (1998). Abyssal recipes II: Energetics of tidal and wind mixing. Deep Sea Research Part I: Oceanographic Research Papers, 45(12), 1977–2010. https://doi.org/10.1016/S0967-0637(98)00070-3
- Munz, P. M., Siccha, M., Lückge, A., Böll, A., Kucera, M., & Schulz, H. (2015). Decadal-resolution record of winter monsoon intensity over the last two millennia from planktic foraminiferal assemblages in the northeastern Arabian Sea. The Holocene, 25(11), 1756–1771. https://doi.org/10.1177/0959683615591357
- Mysak, L. A., Stocker, T., & Huang, T. (1993). Century-scale variability in a randomly forced two-dimensional thermohaline ocean model. Climate Dynamics, 8(3), 103–116. https://doi.org/10.1007/BF00208091
- NGRIP members. (2004). High-resolution record of Northern Hemisphere climate extending into the last interglacial period. Nature, 431(7005), 147–151. https://doi.org/10.1038/nature02805
- Namias, J. (1955). Some meteorological aspects of drought with special reference to the summers of 1952-54 over the United States. Monthly Weather Review, 83(9), 199–205. https://doi.org/10.1175/1520-0493(1955)083<0199:SMAOD>2.0.CO;2
- Namias, J. (1960). Factors in the initiation, perpetuation and termination of drought. IASH Commission of Surface Waters Publication, 51, 81–94.
- Namias, J. (1966). Nature and possible causes of the northeastern United States drought during 1962-65. Monthly Weather Review, 94(9), 543–554. https://doi.org/10.1175/1520-0493(1966)094<0543:NAPCOT>2.3.CO;2
- Namias, J. (1972). Influence of northern Hemisphere general circulation on drought in northeast Brazil. Tellus, 24(4), 336–343. https://doi.org/10.3402/tellusa.v24i4.10648
- Namias, J. (1978). Multiple causes of the North American abnormal winter 1976-77. Monthly Weather Review, 106(3), 279–295. https://doi.org/10.1175/1520-0493(1978)106<0279:MCOTNA>2.0.CO;2
- Namias, J. (1982). Anatomy of Great Plains protracted heat waves (especially the 1980 U.S. Summer drought). Monthly Weather Review, 110(7), 824–838. https://doi.org/10.1175/1520-0493(1982)110<0824:AOGPPH>2.0.CO;2
- Namias, J. (1991). Spring and summer 1988 drought over the contiguous United States-Causes and prediction. Journal of Climate, 4(1), 54–65. https://doi.org/10.1175/1520-0442(1991)004<0054:SASDOT>2.0.CO;2
- Needham, J. (1959). Science and civilization in China, Vol. 1. Cambridge University Press.
- Neukom, R., Steiger, N., Gomez-Navarro, J. J., Wang, J., & Werner, J. P. (2019). No evidence for globally coherent warm and cold periods over the preindustrial common era. Nature, 571(7766), 550–554. https://doi.org/10.1038/s41586-019-1401-2
- Newell, R. E. (1971). The Amazon forest and atmospheric general circulation. In W. H. Matthews, W. W. Kellogg, & G. D. Robinson (Eds.), Man's impact on climate (pp. 457–459). Massachusetts Institute of Technology.
- Nicholson, S. E. (1980). The nature of rainfall fluctuations in subtropical West Africa. Monthly Weather Review, 108(4), 473–487. https://doi.org/10.1175/1520-0493(1980)108<0473:TNORFI>2.0.CO;2
- Nicholson, S. E. (1981). Rainfall and atmospheric circulation during drought periods and wetter years in West Africa. Monthly Weather Review, 109(10), 2191–2208. https://doi.org/10.1175/1520-0493(1981)109<2191:RAACDD>2.0.CO;2
- Nicholson, S. E., Dezfuli, A., & Klotter, D. (2012). A two-century precipitation dataset for the continent of Africa. Bulletin of the American Meteorological Society, 93(8), 1219–1231. https://doi.org/10.1175/BAMS-D-11-00212.1
- Nigam, S., Guan, B., & Ruiz-Barradas, A. (2011). Key role of the Atlantic multidecadal oscillation in 20th century drought & wet periods over the Great Plains. Geophysical Research Letters, 38(16), Article L16713. https://doi.org/10.1029/2011GL048650
- Nitta, T. (1986). Long-term variations of cloud amount in the western Pacific region. Journal of the Meteorological Society of Japan. Ser. II, 64, 373–390. https://doi.org/10.2151/jmsj1965.64.3_373
- Novello, V. F., Vuille, M., Cruz, F. W., Stríkis, N. M., de Paula, M. S., Edwards, R. L., Cheng, H., Karmann, I., Jaqueto, P. F., Trindade, R. I. F., Hartmann, G. A., & Moquet, J. S. (2016). Centennial-scale solar forcing of the South American Monsoon system recorded in stalagmites. Scientific Reports, 6(1), Article 24762. https://doi.org/10.1038/srep24762
- Numaguti, A. (1993). Dynamics and energy balance of the Hadley circulation and the tropical precipitation zones: Significance of the distribution of evaporation. Journal of the Atmospheric Sciences, 50(13), 1874–1887. https://doi.org/10.1175/1520-0469(1993)050<1874:DAEBOT>2.0.CO;2
- O'Mara, N. A., Cheung, A. H., Kelly, C. S., Sandwick, S., Herbert, T. D., Russell, J. M., Abella-Gutiérrez, J., Dee, S. G., Swarzenski, P. W., & Herguera, J. C. (2019). Subtropical Pacific Ocean temperature fluctuations in the common era: Multidecadal variability and its relationship with southwestern North American megadroughts. Geophysical Research Letters, 46(24), 14662–14673. https://doi.org/10.1029/2019GL084828
- Obukhov, A. M., Kurganskii, M., & Tatarskaya, M. (1984). Dynamical conditions of drought & other large-scale weather anomalies formation (in Russian). Soviet Meteorology and Hydrology, 10, 5–13.
- Oglesby, R. J., & Erickson III, D. (1989). Soil moisture and the persistence of North American drought. Journal of Climate, 2(11), 1362–1380. https://doi.org/10.1175/1520-0442(1989)002<1362:SMATPO>2.0.CO;2
- Oladipo, E. O. (1985). A comparative performance analysis of three meteorological drought indices. Journal of Climatology, 5(6), 655–664. https://doi.org/10.1002/joc.3370050607
- Oort, A., Anderson, L., & Peixoto, J. (1994). Estimates of the energy cycle of the oceans. Journal of Geophysical Research, 99(C4), 7665–7688. https://doi.org/10.1029/93JC03556
- Oort, A. H., & Yienger, J. (1996). Observed long-term variability in the Hadley circulation and its connection to ENSO. Journal of Climate, 9(11), 2751–2767. https://doi.org/10.1175/1520-0442(1996)009<2751:OIVITH>2.0.CO;2
- Orr, P. C. (1952). Excavations in moaning cave. Santa Barbara Museum Natural History and Anthropology Bulletin, 1, 1–19.
- Orr, P. C. (1953). Speleothem age dating. Texas Archaeological Society Bulletin, 24, 7–17.
- Osafune, S., Kouketsu, S., Masuda, S., & Sugiura, N. (2020). Dynamical ocean response controlling the eastward movement of a heat content anomaly caused by the 18.6-year modulation of localized tidally induced mixing. Journal of Geophysical Research-Oceans, 125(2), e2019JC01551. https://doi.org/10.1029/2019JC015513
- Osafune, S., Masuda, S., & Sugiura, N. (2014). Role of the oceanic bridge in linking the 18.6 year modulation of tidal mixing and long-term SST change in the North Pacific. Geophysical Research Letters, 41, 7284–7290, https://doi.org/10.1002/2014GL061737
- Osafune, S., & Yasuda, I. (2013). Remote impacts of the 18.6 year period modulation of localized tidal mixing in the North Pacific. Journal of Geophysical Research-Oceans, 118, 3128–3137. https://doi.org/10.1002/jgrc.20230
- Otto-Bliesner, B. L., Brady, E. C., Fasullo, J., Jahn, A., Landrum, L., Stevenson, S., Rosenbloom, N., Mai, A., & Strand, G. (2016). Climate variability and change since 850 C.E.: An ensemble approach with the Community Earth System Model (CESM). Bulletin of the American Meteorological Society, 97(5), 735–754. https://doi.org/10.1175/BAMS-D-14-00233.1
- PAGES 2k Consortium. (2013). Centennial-scale temperature variability during the past two millennia. Nature Geoscience, 6(5), 339–346. https://doi.org/10.1038/ngeo1797
- PAGES 2k Consortium. (2017). A global multiproxy database for temperature reconstructions of the common era. Scientific Data, 4, Article 170088. https://doi.org/10.1038/sdata.2017.88
- PAGES Hydro2k Consortium. (2017). Comparing proxy and model estimates of hydroclimate variability and change over the common era. Climate of the Past, 13(12), 1851–1900. https://doi.org/10.5194/cp-13-1851-2017
- PAGES 2k Consortium. (2019). Consistent multidecadal variability in global temperature reconstructions and simulations over the common era. Nature Geoscience, 12(8), 643–649. https://doi.org/10.1038/s41561-019-0400-0
- Palmer, J. G., Cook, E. R., Turney, C. S. M., Allen, K., Fenwick, P., Cook, B. I., O’Donnell, A., Lough, J., Grierson, P., & Baker, P. (2015). Drought variability in the eastern Australia and New Zealand summer drought atlas (ANZDA, CE 1500-2012) modulated by the interdecadal Pacific oscillation. Environmental Research Letters, 10(12), Article 124002. https://doi.org/10.1088/1748-9326/10/12/124002
- Palmer, T. N., & Brankovic, C. (1989). The 1988 US drought linked to anomalous sea surface temperature. Nature, 338(6210), 54–57. https://doi.org/10.1038/338054a0
- Palmer, W. C. (1965). Meteorologic drought. US Department of Commerce, Weather Bureau, Research Paper 45, 58 pp.
- Park, C.-K., & Schubert, S. D. (1997). On the nature of the 1994 East Asian summer drought. Journal of Climate, 10(5), 1056–1070. https://doi.org/10.1175/1520-0442(1997)010<1056:OTNOTE>2.0.CO;2
- Park, W., & Latif, M. (2008). Multidecadal and multicentennial variability of the meridional overturning circulation. Geophysical Research Letters, 35(22), Article L22703. https://doi.org/10.1029/2008GL035779
- Parsons, L. A., Loope, G., Overpeck, J., Ault, T., Stouffer, R., & Cole, J. (2017). Temperature and precipitation variance in CMIP5 simulations and paleoclimate records of the last millennium. Journal of Climate, 30(22), 8885–8912. https://doi.org/10.1175/JCLI-D-16-0863.1
- Partin, J. W., Quinn, T., Shen, C., Emile-Geay, J., Taylor, F., Maupin, C., Lin, K., Jackson, C., Banner, J., Sinclair, D., & Huh, C. (2013). Multidecadal rainfall variability in South Pacific Convergence Zone as revealed by stalagmite geochemistry. Geology, 41(11), 1143–1146. https://doi.org/10.1130/G34718.1
- Pauling, A., Luterbacher, J., Casty, C., & Wanner, H. (2006). Five hundred years of gridded high resolution precipitation reconstructions over Europe and the connection to large-scale circulation. Climate Dynamics, 26(4), 387–405. https://doi.org/10.1007/s00382-005-0090-8
- Pelletier, J. D., & Turcotte, D. L. (1997). Long-range persistence in climatological and hydrological time series: Analysis, modeling and application to drought hazard assessment. Journal of Hydrology, 203(1-4), 198–208. https://doi.org/10.1016/S0022-1694(97)00102-9
- Penland, C., & Sardeshmuhk, P. (1995). The optimal growth of tropical sea surface temperature anomalies. Journal of Climate, 8(8), 1999–2024. https://doi.org/10.1175/1520-0442(1995)008<1999:TOGOTS>2.0.CO;2
- Peters-Lidard, C. D., Hossain, F., Leung, L., McDowell, N., Rodell, M., Tapiador, F., Turk, F., & Wood, A. (2018). 100 years of progress in hydrology. Meteorological Monographs, 59(1), 25.1–25.51. https://doi.org/10.1175/AMSMONOGRAPHS-D-18-0019.1
- Peterson, R., & White, W. (1998). Slow oceanic teleconnections linking the Antarctic circumpolar wave with the tropical El Niño-Southern oscillation. Journal of Geophysical Research: Oceans, 103(C11), 24573–24583. https://doi.org/10.1029/98JC01947
- Picaut, J., Masia, F., & du Penhoat, Y. (1997). An advective-reflective conceptual model for the oscillatory nature of the ENSO. Science, 277(5326), 663–666. https://doi.org/10.1126/science.277.5326.663
- Pielke, R. A., Avissar, R., Raupach, M., Dolman, A. J., Zeng, X. B., & Denning, A. S. (1998). Interactions between the atmosphere and terrestrial ecosystems: Influence on weather and climate. Global Change Biology, 4(5), 461–475. https://doi.org/10.1046/j.1365-2486.1998.t01-1-00176.x
- Pitman, A. J. (2003). The evolution of, and revolution in, land surface schemes designed for climate models. International Journal of Climatology, 23(5), 479–510. https://doi.org/10.1002/joc.893
- Pitman, A. J., de Noblet-Ducoudré, N., Avila, F. B., Alexander, L. V., Boisier, J.-P., Brovkin, V., Delire, C., Cruz, F., Donat, M. G., Gayler, V., van den Hurk, B., Reick, C., & Voldoire, A. (2012). Effects of land cover change on temperature and rainfall extremes in multi-model ensemble simulations. Earth System Dynamics, 3(2), 213–231. https://doi.org/10.5194/esd-3-213-2012
- Pitman, A. J., de Noblet-Ducoudré, N., Cruz, F. T., Davin, E. L., Bonan, G. B., Brovkin, V., Claussen, M., Delire, C., Ganzeveld, L., Gayler, V., van den Hurk, B. J. J. M., Lawrence, P. J., van der Molen, M. K., Müller, C., Reick, C. H., Seneviratne, S. I., Strengers, B. J., & Voldoire, A. (2009). Uncertainties in climate responses to past land cover change: First results from the LUCID intercomparison study. Geophysical Research Letters, 36(14), Article L14814. https://doi.org/10.1029/2009GL039076
- Plumb, A. R., & Hou, A. (1992). The response of a zonally symmetric atmosphere to subtropical thermal forcing: Threshold behavior. Journal of the Atmospheric Sciences, 49(19), 1790–1799. https://doi.org/10.1175/1520-0469(1992)049<1790:TROAZS>2.0.CO;2
- Polozova, L. G., & Grigoryeva, A. (1984). Role of circulation factor in formation of dry periods, helio-physical factors of weather and climate. Proceedings of A. I. Voeikov Main Geophysical Observatory, 471, 50–54.
- Polzin, K. L., Toole, J., Ledwell, J., & Schmitt, R. (1997). Spatial variability of turbulent mixing in the abyssal ocean. Science, 276(5309), 93–96. https://doi.org/10.1126/science.276.5309.93
- Poore, R. Z., Quinn, T., & Verardo, S. (2004). Century-scale movement of the Atlantic intertropical convergence zone linked to solar variability. Geophysical Research Letters, 31(12), Article L12214. https://doi.org/10.1029/2004GL019940
- Qian, T., Dai, A., & Trenberth, K. (2007). Hydroclimatic trends in the Mississippi river basin from 1948-2004. Journal of Climate, 20(18), 4599–4614. https://doi.org/10.1175/JCLI4262.1
- Qian, T., Dai, A., Trenberth, K., & Oleson, K. (2006). Simulation of global land surface conditions from 1948-2004. Part I: Forcing data and evaluation. Journal of Hydrometeorology, 7, 953–975. https://doi.org/10.1175/JHM540.1
- Rahmstorf, S. (2006). Thermohaline ocean circulation. In S. A. Elias (Ed.), Encyclopedia of quaternary sciences (pp. 739–750). Elsevier.
- Ramage, C. S. (1971). Monsoon meteorology. Academic Press, 296 pp.
- Raman, C. R. V., & Rao, Y. (1981). Blocking highs over Asia and monsoon droughts over India. Nature, 289(5795), 271–273. https://doi.org/10.1038/289271a0
- Ramanathan, V., & Collins, W. (1991). Thermodynamic regulation of ocean warming by cirrus clouds deduced from observations of the 1987 El Niño. Nature, 351(6321), 27–32. https://doi.org/10.1038/351027a0
- Ramaswamy, C. (1962). Breaks in the Indian summer monsoon as a phenomenon of interaction between the easterly and the subtropical westerly jet streams. Tellus, 14, 337–349. https://doi.org/10.3402/tellusa.v14i3.9560
- Ramaswamy, C. (1976). Synoptic aspects of droughts in the Asiatic Monsoon area. Proceedings of Symposium on Droughts in Asiatic Monsoon Area, 54, 109–132.
- Randall, D. A., Bitz, C., Danabasoglu, G., Denning, A., Gent, P., Gettelman, A., Griffies, S., Lynch, P., Morrison, H., Pincus, R., & Thuburn, J. (2019). 100 years of Earth system model development. Meteorological Monographs, 59, 12.1–12.66. https://doi.org/10.1175/AMSMONOGRAPHS-D-18-0018.1
- Randel, W. J., & Cobb, J. B. (1994). Coherent variations of monthly mean total ozone and lower stratospheric temperature. Journal of Geophysical Research, 99(D3), 5433–5477. https://doi.org/10.1029/93JD03454
- Randel, W. J., Garcia, R. R., Calvo, N., & Marsh, D. (2009). ENSO influence on zonal mean temperature and ozone in the tropical lower stratosphere. Geophysical Research Letters, 36(15), Article L15822. https://doi.org/10.1029/2009GL039343
- Ratcliffe, R. A. S. (1978). Meteorological aspects of 1975-1976 droughts. Proceedings of the Royal Society of London, 363, 3–20. https://doi.org/10.1098/rspa.1978.0152
- Ray, R. D., & Susanto, R. S. (2016). Tidal mixing signatures in the Indonesian seas from high-resolution sea surface temperature data. Geophysical Research Letters, 43(15), 8115–8123. https://doi.org/10.1002/2016GL069485
- Raymond, D. J. (2000). The Hadley circulation as a radiative-convective instability. Journal of the Atmospheric Sciences, 57(9), 1286–1297. https://doi.org/10.1175/1520-0469(2000)057<1286:THCAAR>2.0.CO;2
- Reuter, J., Stott, L., Khider, D., Sinha, A., Cheng, H., & Edwards, R. (2009). A new perspective on the hydroclimate variability in Northern South America during the Little Ice Age. Geophysical Research Letters, 36(21), Article L21706. https://doi.org/10.1029/2009GL041051
- Reynolds, D. J., Scourse, J., Halloran, P., Nederbragt, A., Wanamaker, A., Butler, P., Richardson, C., Heinemeier, J., Eiriksson, J., Knudsen, K., & Hall, I. (2016). Annually resolved North Atlantic marine climate over the last millennium. Nature Communications, 7(1), Article 13502. https://doi.org/10.1038/NCOMMS13502
- Riehl, H. (1954). Tropical meteorology. McGraw Hill. 92 pp.
- Riehl, H. (1979). Climate and weather in the tropics. Academic. 611 pp.
- Rodriguez-Fonseca, B., Janicot, S., Mohino, E., Losada, T., Bader, J., Caminade, C., Chauvin, F., Fontaine, B., García-Serrano, J., Gervois, S., Joly, M., Polo, I., Ruti, P., Roucou, P., & Voldoire, A. (2011). Interannual and decadal SST-forced responses of the West African monsoon. Atmospheric Science Letters, 12(1), 67–74. https://doi.org/10.1002/asl.308
- Rodriguez-Fonseca, B., Mohino, E., Mechoso, C. R., Caminade, C., Biasutti, M., Gaetani, M., Garcia-Serrano, J., Vizy, E. K., Cook, K., Xue, Y., Polo, I., Losada, T., Druyan, L., Fontaine, B., Bader, J., Doblas-Reyes, F. J., Goddard, L., Janicot, S., Arribas, A., … Voldoire, A. (2015). Variability and predictability of West African droughts: A review of the role of sea surface temperature anomalies. Journal of Climate, 28(10), 4034–4060. https://doi.org/10.1175/JCLI-D-14-00130.1
- Rodwell, M. J., & Hoskins, B. (1995). A model of the Asian summer monsoon, Part II: Cross-equatorial flow and PV behavior. Journal of the Atmospheric Sciences, 52(9), 1341–1356. https://doi.org/10.1175/1520-0469(1995)052<1341:AMOTAS>2.0.CO;2
- Ropelewski, C. F., & Halpert, M. (1986). North American precipitation and temperature associated with the E1 Nino Southern oscillation (ENSO). Monthly Weather Review, 114(12), 2352–2362. https://doi.org/10.1175/1520-0493(1986)114<2352:NAPATP>2.0.CO;2
- Ropelewski, C. F., & Halpert, M. (1987). Global and regional scale precipitation patterns associated with the E1 Nino/Southern oscillation. Monthly Weather Review, 115(8), 1606–1626. https://doi.org/10.1175/1520-0493(1987)115<1606:GARSPP>2.0.CO;2
- Ropelewski, C. F., & Halpert, M. (1989). Precipitation patterns associated with the high index phase of the Southern oscillation. Journal of Climate, 2(3), 268–284. https://doi.org/10.1175/1520-0442(1989)002<0268:PPAWTH>2.0.CO;2
- Rossby, C. G. (1939). Relation between variations in the intensity of the zonal circulation of the atmosphere and the displacements of the semi-permanent centers of action. Journal of Marine Research, 2(1), 38–55. https://images.peabody.yale.edu/publications/jmr/jmr02-01-06.pdf. https://doi.org/10.1357/002224039806649023
- Routson, C. C., Woodhouse, C., & Overpeck, J. (2011). Second century megadrought in the Rio Grande headwaters, Colorado: How unusual was medieval drought? Geophysical Research Letters, 38(22), Article L22703. https://doi.org/10.1029/2011GL050015
- Rowell, D. P. (2001). Teleconnections between the tropical Pacific and the sahel. Quarterly Journal of the Royal Meteorological Society, 127(575), 1683–1706. https://doi.org/10.1002/qj.49712757512
- Rudnick, D. L., Boyd, T. J., Brainard, R. E., Carter, G. S., Egbert, G. D., Gregg, M. C., Holloway, P. E., Klymak, J. M., Kunze, E., Lee, C. M., Levine, M. D., Luther, D. S., Martin, J. P., Merrifield, M. A., Moum, J. N., Nash, J. D., Pinkel, R., Rainville, L., & Sanford, T. B. (2003). From tides to mixing along the Hawaiian Ridge. Science, 301(5631), 355–357. https://doi.org/10.1126/science.1085837
- Sagawa, T., Kuwae, M., Tsuruoka, K., Nakamura, Y., Ikehara, M., & Murayama, M. (2014). Solar forcing of centennial-scale East Asian winter monsoon variability in the mid-to late holocene. Earth and Planetary Science Letters, 395, 124–135. https://doi.org/10.1016/j.epsl.2014.03.043
- Saji, N. H., Goswami, B., Vinayachandran, P., & Yamagata, T. (1999). A dipole mode in the tropical Indian ocean. Nature, 401, 360–363. https://doi.org/10.1038/43854
- Sandstrom, J. W. (1908). Dynamische versuche mit meerwasser. Annals in Hydrodynamic Marine Meteorology, 36, 6–23.
- Sandstrom, J. W. (1916). Meteorologische Studien im Schwedischen Hochgebirge, Go-teborgs K. Vetensk. Vitterhetssamha-llets Handkl., 27, 48 pp.
- Sankar, S., Svendsen, L., Gokulapalan, B., Joseph, P. V., & Johannessen, O. M. (2016). The relationship between Indian summer monsoon rainfall and Atlantic multidecadal variability over the last 500 years. Tellus A: Dynamic Meteorology and Oceanography, 68(1), Article 31717. https://doi.org/10.3402/tellusa.v68.31717
- Sano, M., Buckley, B. M., & Sweda, T. (2009). Tree-ring based hydroclimate reconstruction over northern Vietnam from fokienia hodginsii: Eighteenth century mega-drought and tropical Pacific influence. Climate Dynamics, 33(2-3), 331–340. https://doi.org/10.1007/s00382-008-0454-y
- Saunders, K. M., Grosjean, M., & Hodgson, D. (2013). A 950 yr temperature reconstruction from duckhole lake, southern tasmania, Australia. The Holocene, 23(6), 771–783. https://doi.org/10.1177/0959683612470176
- Schlesinger, M. E., & Ramankutty, N. (1994). An oscillation in the global climate system of period 65-70 years. Nature, 367(6465), 723–726. https://doi.org/10.1038/367723a0
- Schneider, E. K. (1977). Axially symmetric steady-state models of the basic state for instability and climate studies. Part II. Nonlinear calculations. Journal of the Atmospheric Sciences, 34(2), 280–296. https://doi.org/10.1175/1520-0469(1977)034<0280:ASSSMO>2.0.CO;2
- Schneider, E. K., & Lindzen, R. S. (1977). Axially symmetric steady-state models of the basic state for instability and climate studies. Part I. Linearized calculations. Journal of the Atmospheric Sciences, 34(2), 263–279. https://doi.org/10.1175/1520-0469(1977)034<0263:ASSSMO>2.0.CO;2
- Schneider, L., Smerdon, J., Buntgen, U., Wilson, R., Myglan, V., Kirdyanov, A., & Esper, J. (2015). Revising midlatitude summer temperatures back to A.D. 600 based on a wood density network. Geophysical Research Letters, 42(11), 4556–4562. https://doi.org/10.1002/2015GL063956
- Schneider, T., Bischoff, T., & Haug, G. H. (2014). Migrations and dynamics of the intertropical Convergence zone. Nature, 513(7516), 45–53. https://doi.org/10.1038/nature13636
- Schneider, T., & Bordoni, S. (2008). Eddy-mediated regime transitions in the seasonal cycle of a Hadley circulation and implications for monsoon dynamics. Journal of the Atmospheric Sciences, 65(3), 915–934. https://doi.org/10.1175/2007JAS2415.1
- Schneider, U., Ziese, M., Meyer-Christoffer, A., Finger, P., Rustemeier, E., & Becker, A. (2016). The new portfolio of global precipitation data products of the Global Precipitation Climatology Centre suitable to assess and quantify the global water cycle and resources. Proceedings of the International Association of Hydrological Sciences, 374, 29–34. https://doi.org/10.5194/piahs-374-29-2016
- Scholander, P. F., deVries, H., Dansgaard, W., Coachman, L. K., Nutt, D. C., & Hemmingsen, E. (1962). Radio-carbon age and oxygen-18 content of Greenland icebergs. Meddelelser om Grønland, 165, 1–26. https://www.iceandclimate.nbi.ku.dk/publications/_radio-carbon_age_and_oxygen-18_content_of_greenland_icebergs/
- Scholz, C. A., Johnson, T. C., Cohen, A. S., King, J. W., Peck, J. A., Overpeck, J. T., Talbot, M. R., Brown, E. T., Kalindekafe, L., Amoako, P. Y. O., Lyons, R. P., Shanahan, T. M., Castañeda, I. S., Heil, C. W., Forman, S. L., McHargue, L. R., Beuning, K. R., Gomez, J., & Pierson, J. (2007). East African megadroughts between 135 and 75 thousand years ago and bearing on early-modern human origins. Proceedings of the National Academy of Sciences, 104(42), 16416–16421. https://doi.org/10.1073/pnas.0703874104
- Schubert, S. D., Gutzler, D., Wang, H., Dai, A., Delworth, T., Deser, C., Findell, K., Fu, R., Higgins, W., Hoerling, M., Kirtman, B., Koster, R., Kumar, A., Legler, D., Lettenmaier, D., Lyon, B., Magana, V., Mo, K., Nigam, S., … Zeng, N. (2009). A USCLIVAR Project to Assess and compare the responses of global climate models to drought-related SST forcing patterns: Overview and results. Journal of Climate, 22(19), 5251–5272. https://doi.org/10.1175/2009JCLI3060.1
- Schubert, S. D., Stewart, R. E., Wang, H., Barlow, M., Berbery, E. H., Cai, W., Hoerling, M. P., Kanikicharla, K. K., Koster, R. D., & Lyon, B. (2016). Global meteorological drought: a synthesis of current understanding with a focus on SST drivers of precipitation deficits. Journal of Climate, 29(11), 3989–4019. https://doi.org/10.1175/JCLI-D-15-0452.1
- Schubert, S. D., Suarez, M. J., Pegion, P. J., Koster, R. D., & Bacmeister, J. T. (2004a). On the cause of the 1930s dust bowl. Science, 303(5665), 1855–1859. https://doi.org/10.1126/science.1095048
- Schubert, S. D., Suarez, M. J., Pegion, P. J., Koster, R. D., & Bacmeister, J. T. (2004b). Causes of long-term drought in the U.S. Great plains. Journal of Climate, 17, 485–503. https://doi.org/10.1175/1520-0442(2004)017%3C0485:COLDIT%3E2.0.CO;2
- Schubert, S. D., Wang, H., Koster, R., Suarez, M., & Groisman, P. (2014). Northern eurasian heat waves and droughts. Journal of Climate, 27(9), 3169–3207. https://doi.org/10.1175/JCLI-D-13-00360.1
- Schubert, S. D., Wang, H., & Suarez, M. (2011). Warm season subseasonal variability and climate extremes in the Northern Hemisphere: The role of stationary Rossby waves. Journal of Climate, 24(18), 4773–4792. https://doi.org/10.1175/JCLI-D-10-05035.1
- Schulman, E. (1947). An 800-year Douglas fir at mesa verde. Tree-Ring Bulletin, 14(1), 2–8. http://hdl.handle.net/10150/255316
- Scroxton, N., Burns, S. J., McGee, D., Hardt, B., Godfrey, L. R., Ranivoharimanana, L., & Faina, P. (2017). Hemispherically in-phase precipitation variability over the last 1700 years in a Madagascar speleothem record. Quaternary Science Reviews, 164, 25–36. https://doi.org/10.1016/j.quascirev.2017.03.017
- Seager, R. (2007). The turn of the century North American drought: Dynamics, global context, and prior analogs. Journal of Climate, 20(22), 5527–5552. https://doi.org/10.1175/2007JCLI1529.1
- Seager, R., Burgman, R., Kushnir, Y., Clement, A., Cook, E., Naik, N., & Miller, J. (2008). Tropical Pacific forcing of North American Medieval megadroughts: Testing the concept with an atmosphere model forced by coral-reconstructed SSTs. Journal of Climate, 21(23), 6175–6190. https://doi.org/10.1175/2008JCLI2170.1
- Seager, R., & Hoerling, M. (2014). Atmosphere and ocean origins of North American drought. Journal of Climate, 27(12), 4581–4606. https://doi.org/10.1175/JCLI-D-13-00329.1
- Seager, R., Kushnir, Y., Ting, M. F., Cane, M., Naik, N., & Velez, J. (2008). Would advance knowledge of 1930s SSTs have allowed prediction of the dust bowl drought? Journal of Climate, 21(13), 3261–3281. https://doi.org/10.1175/2007JCLI2134.1
- Seftigen, K., Goosse, H., Klein, F., & Chen, D. (2017). Hydroclimate variability in Scandinavia over the last millennium—insights from a climate model–proxy data comparison. Climate of the Past, 13(12), 1831–1850. https://doi.org/10.5194/cp-13-1831-2017
- Sellers, P. J., Mintz, Y., Sud, Y., & Dalcher, A. (1986). A simple biosphere model (SIB) for use within general circulation models. Journal of the Atmospheric Sciences, 43(6), 505–531. https://doi.org/10.1175/1520-0469(1986)043<0505:ASBMFU>2.0.CO;2
- Shamasastry, R. (1915). Translation of ‘Arthasastra’ by Kautilya. Government Oriental Library Series, Bibliotheca Sanskrita, No. 37, Part 2, Bangalore.
- Shanahan, T. M., Overpeck, J., Anchukaitis, K., Beck, J., Cole, J., Dettman, D., Peck, J., Scholz, C., & King, J. (2009). Atlantic forcing of persistent drought in West Africa. Science, 324(5925), 377–380. https://doi.org/10.1126/science.1166352
- Sheffield, J., Andreadis, K., Wood, E., & Lettenmaier, D. (2009). Global and continental drought in the second half of the twentieth century: Severity-area-duration analysis and temporal variability of large-scale events. Journal of Climate, 22(8), 1962–1981. https://doi.org/10.1175/2008JCLI2722.1
- Sheffield, J., Wood, E. F., & Roderick, M. L. (2012). Little change in global drought over the past 60 years. Nature, 491(7424), 435–438. https://doi.org/10.1038/nature11575
- Sheppard, P. R., Tarasov, P. E., Graumlich, L. J., Heussner, K.-U., Wagner, M., Osterle, H., & Thompson, L. G. (2004). Annual precipitation since 515 BC reconstructed from living and fossil juniper growth of northeastern Qinghai province, China. Climate Dynamics, 23(7-8), 869–881. https://doi.org/10.1007/s00382-004-0473-2
- Sherwood, S. C., Webb, M. J., Annan, J. D., Armour, K. C., Forster, P. M., Hargreaves, J. C., Hegerl, G., Klein, S. A., Marvel, K. D., Rohling, E. J., Watanabe, M., Andrews, T., Braconnot, P., Bretherton, C. S., Foster, G. L., Hausfather, Z., von der Heydt, A. S., Knutti, R., Mauritsen, T., … Zelinka, M. D. (2020). An assessment of earth’s climate sensitivity using multiple lines of evidence. Reviews of Geophysics, 58(4), Article e2019RG000678. https://doi.org/10.1029/2019RG000678
- Shi, F., Zhao, S., Guo, Z., Goosse, H., & Yin, Q. (2017). Multi-proxy reconstructions of May-September precipitation field in China over the past 500 years. Climate of the Past, 13(12), 1919–1938. https://doi.org/10.5194/cp-13-1919-2017
- Shi, H., Wang, B., Cook, E. R., Liu, J., & Liu, F. (2018). Asian summer precipitation over the past 544 years reconstructed by merging tree rings and historical documentary records. Journal of Climate, 31(19), 7845–7861. https://doi.org/10.1175/JCLI-D-18-0003.1
- Shinoda, M. (1990). Long term Sahelian drought from the late 1960s to the mid 1980s and its relation to the atmospheric circulation. Journal of the Meteorological Society of Japan. Ser. II, 68, 613–624. https://doi.org/10.2151/jmsj1965.68.5_613
- Shukla, J., & Mintz, Y. (1982). Influence of land-surface evapotranspiration on the Earth's climate. Science, 215(4539), 1498–1501. https://doi.org/10.1126/science.215.4539.1498
- Shvedov, F. N. (1892). Tree as a chronicle of droughts. Meteorological Herald, 5, 163–178.
- Sicre, M.-A., Yiou, P., EirÌksson, J., Ezat, U., Guimbaut, E., Dahhaoui, I., Knudsen, K., Jansen, E., & Turon, J. (2008). A 4500-year reconstruction of sea surface temperature variability at decadal time scales off North Iceland. Quaternary Science Reviews, 27(21-22), 2041–2047. https://doi.org/10.1016/j.quascirev.2008.08.009
- Sikka, D. R. (1980). Some aspects of the large scale fluctuations of summer monsoon rainfall over India in relation to fluctuations in the planetary and regional scale circulation parameters. Journal of Earth System Science, 89, 179–195. https://doi.org/10.1007/BF02913749
- Sikka, D. R., & Gadgil, S. (1980). On the maximum cloud zone and the ITCZ over India longitude during the southwest monsoon. Monthly Weather Review, 108(11), 1840–1853. https://doi.org/10.1175/1520-0493(1980)108<1840:OTMCZA>2.0.CO;2
- Simmonds, I., Bi, D., & Hope, P. (1999). Atmospheric water vapor flux and its association with rainfall over China in summer. Journal of Climate, 12(5), 1353–1367. https://doi.org/10.1175/1520-0442(1999)012<1353:AWVFAI>2.0.CO;2
- Simpson, G. (1921). The south-west monsoon. Quarterly Journal of the Royal Meteorological Society, 47(17), 151–173. https://doi.org/10.1002/qj.49704719901
- Singh, D., Seager, R., Cook, B. I., Cane, M., Ting, M., Cook, E., & Davis, M. (2018). Climate and the Global Famine of 1876-78. Journal of Climate, 31(23), 9445–9467. https://doi.org/10.1175/JCLI-D-18-0159.1
- Sinha, A., Berkelhammer, M., Stott, L., Mudelsee, M., Cheng, H., & Biswas, J. (2011a). The leading mode of Indian summer monsoon precipitation variability during the last millennium. Geophysical Research Letters, 38(15), Article L15703. https://doi.org/10.1029/2011GL047713
- Sinha, A., Cannariato, K., Stott, L., Cheng, H., Edwards, R., Yadava, M., Ramesh, R., & Singh, I. (2007). A 900-year (600 to 1500 A.D.) record of the Indian summer monsoon precipitation from the core monsoon zone of India. Geophysical Research Letters, 34(16), Article L16707. https://doi.org/10.1029/2007GL030431
- Sinha, A., Stott, L., Berkelhammer, M., Cheng, H., Edwards, R., Buckley, B., Aldenderfer, M., & Mudelsee, M. (2011b). A global context for megadroughts in monsoon Asia during the past millennium. Quaternary Science Reviews, 30(1-2), 47–62. https://doi.org/10.1016/j.quascirev.2010.10.005
- Sloyan, B. M., & Rintoul, S. (2001). The Southern Ocean limb of the global deep overturning circulation. Journal of Physical Oceanography, 31(1), 143–173. https://doi.org/10.1175/1520-0485(2001)031<0143:TSOLOT>2.0.CO;2
- Smagorinsky, J. (1953). The dynamical influence of large-scale heat sources and sinks on the quasi-stationary mean motions of the atmosphere. Quarterly Journal of the Royal Meteorological Society, 79(341), 342–366. https://doi.org/10.1002/qj.49707934103
- Spinoni, J., Naumann, G., Vogt, J., & Barbosa, P. (2015). The biggest drought events in Europe from 1950 to 2012. Journal of Hydrology: Regional Studies, 3, 509–524. https://doi.org/10.1016/j.ejrh.2015.01.001
- Stahle, D. W., Cleaveland, M., & Hehr, J. (1985). A 450-year drought reconstruction for Arkansas, United States. Nature, 316(6028), 530–532. https://doi.org/10.1038/316530a0
- Stahle, D. W., Cook, E. R., Burnette, D. J., Villanueva, J., Cerano, J., Burns, J. N., Griffin, D., Cook, B. I., Acuna, R., Torbenson, M. C. A., Szejner, P., & Howard, I. M. (2016). The Mexican Drought Atlas: Three-ring reconstructions of the soil moisture balance during the late pre-Hispanic, colonial, and modern eras. Quaternary Science Reviews, 149, 34–60. https://doi.org/10.1016/j.quascirev.2016.06.018
- Stahle, D. W., Cook, E. R., Cleaveland, M. K., Therrell, M. D., Meko, D. M., Grissino-Mayer, H. D., Watson, E., & Luckman, B. H. (2000). Tree-ring data document 16th century megadrought over North America. Eos, Transactions American Geophysical Union, 81(12), 121–125. https://doi.org/10.1029/00EO00076
- Steig, E. J., Ding, Q., White, J. W. C., Küttel, M., Rupper, S. B., Neumann, T. A., Neff, P. D., Gallant, A. J. E., Mayewski, P. A., Taylor, K. C., Hoffmann, G., Dixon, D. A., Schoenemann, S. W., Markle, B. R., Fudge, T. J., Schneider, D. P., Schauer, A. J., Teel, R. P., Vaughn, B. H., … Korotkikh, E. (2013). Recent climate and ice-sheet changes in west Antarctica compared with the past 2,000 years. Nature Geoscience, 6(5), 372–375. https://doi.org/10.1038/ngeo1778
- Steiger, N. J., Smerdon, J. E., Cook, B. I., Seager, R., Williams, A. P., & Cook, E. R. (2019). Oceanic and radiative forcing of medieval mega-droughts in the American southwest. Science Advances, 5(7), Article eaax0087. https://doi.org/10.1126/sciadv.aax0087
- Steiger, N. J., Smerdon, J. E., Cook, E. R., & Cook, B. I. (2018). A reconstruction of global hydroclimate and dynamical variables over the Common Era. Scientific Data, 5(1), Article 180086. https://doi.org/10.1038/sdata.2018.86
- Steinman, B. A., Abbott, M., Mann, M., Stansell, N., & Finney, B. (2012). 1,500 year quantitative reconstruction of winter precipitation in the Pacific northwest. Proceedings of the National Academy of Sciences, 109(29), 11619–11623. https://doi.org/10.1073/pnas.1201083109
- Stevenson, S., Timmermann, A., Chikamoto, Y., Langford, S., & DiNezio, P. (2015). Stochastically generated North American megadroughts. Journal of Climate, 28(5), 1865–1880. https://doi.org/10.1175/JCLI-D-13-00689.1
- Stine, S. (1994). Extreme and persistent drought in California and Patagonia during mediaeval time. Nature, 369(6481), 546–549. https://doi.org/10.1038/369546a0
- Stockton, C. W., & Jacoby, G. (1976). Long-term surface water supply and streamflow levels in the upper Colorado River basin. Lake Powell Research Project Bulletin 18, Institute of Geophysics and Planetary Physics, University of California, Los Angeles, 70 pp.
- Stockton, C. W., & Meko, D. M. (1975). A long-term history of drought occurrence in western United States as inferred from tree rings. Weatherwise, 28(6), 244–249. https://doi.org/10.1080/00431672.1975.9931775
- Stoffel, M., Khodri, M., Corona, C., Guillet, S., Poulain, V., Bekki, S., Guiot, J., Luckman, B. H., Oppenheimer, C., Lebas, N., Beniston, M., & Masson-Delmotte, V. (2015). Estimates of volcanic-induced cooling in the Northern Hemisphere over the past 1,500 years. Nature Geoscience, 8(10), 784–788. https://doi.org/10.1038/ngeo2526
- Strangeways, I. C. (2010). A history of rain gauges. Weather, 65(5), 133–138. https://doi.org/10.1002/wea.548
- Suarez, M. J., & Schopf, P. (1988). A delayed action oscillator for ENSO. Journal of the Atmospheric Sciences, 45(21), 3283–3287. https://doi.org/10.1175/1520-0469(1988)045<3283:ADAOFE>2.0.CO;2
- Sud, Y. C., & Fennessy, M. (1982). A study of the influence of surface albedo on July circulation in semiarid regions using the GLASS GCM. Journal of Climatology, 2(2), 105–125. https://doi.org/10.1002/joc.3370020202
- Sud, Y. C., & Fennessy, M. (1984). Influence of evaporation in semiarid regions on the July circulation: A numerical study. Journal of Climatology, 4(4), 383–398. https://doi.org/10.1002/joc.3370040404
- Sud, Y. C., & Smith, W. E. (1985). The influence of surface roughness of deserts on the July circulation - a numerical study. Boundary-Layer Meteorology, 33(1), 15–49. https://doi.org/10.1007/BF00137034
- Sun, C., Li, J., & Jin, F.-F. (2015). A delayed oscillator model for the quasi-periodic multidecadal variability of the NAO. Climate Dynamics, 45, 2083–2099. https://doi.org/10.1007/s00382-014-2459-z
- Sun, Q., Miao, C., Duan, Q., Ashouri, H., Sorooshian, S., & Hsu, K.-L. (2018). A review of global precipitation data sets: Data sources, estimation, and intercomparisons. Reviews of Geophysics, 56(1), 79–107. https://doi.org/10.1002/2017RG000574
- Sutton, R. T., & Hodson, D. (2005). Atlantic Ocean forcing of North American and European summer climate. Science, 309(5731), 115–118. https://doi.org/10.1126/science.1109496
- Sutton, R. T., McCarthy, G., Robson, J., Sinha, B., Archibald, A., & Gray, L. J. (2018). Atlantic multidecadal variability and the U.K. ACSIS Program. Bulletin of the American Meteorological Society, 99, 415–425. https://doi.org/10.1175/BAMS-D-16-0266.1
- Talley, L. D. (2013). Closure of the global overturning circulation through the Indian, Pacific, and Southern Oceans: Schematics and transports. Oceanography, 26(1), 80–97. https://doi.org/10.5670/oceanog.2013.07
- Tan, L., Cai, Y., Cheng, H., An, Z., & Edwards, R. (2009). Summer monsoon precipitation variations in central China over the past 750 years derived from a high-resolution absolute-dated stalagmite. Palaeogeography, Palaeoclimatology, Palaeoecology, 280(3-4), 432–439. https://doi.org/10.1016/j.palaeo.2009.06.030
- Tan, M., Liu, T., Hou, J., Qin, X., Zhang, H., & Li, T. (2003). Cyclic rapid warming on centennial-scale revealed by a 2650-year stalagmite record of warm season temperature. Geophysical Research Letters, 30(12), Article 1617. https://doi.org/10.1029/2003GL017352
- Tanaka, Y., Yasuda, I., Hasumi, H., Tatebe, H., & Osafune, S. (2012). Effects of the 18.6-year modulation of tidalmixing on the North Pacific bidecadal climate variability in a coupled climate model. Journal of Climate, 25, 7625–7642. https://doi.org/10.1175/JCLI-D-12-00051.1
- Tardif, R., Hakim, G. J., Perkins, W. A., Horlick, K. A., Erb, M. P., Emile-Geay, J., Anderson, D. M., Steig, E. J., & Noone, D. (2019). Last Millennium Reanalysis with an expanded proxy database and seasonal proxy modeling. Climate of the Past, 15(4), 1251–1273. https://doi.org/10.5194/cp-15-1251-2019
- Tatebe, H., Tanaka, Y., Komuro, Y. & Hasumi, H. (2018). Impact of deep ocean mixing on the climatic mean state in the Southern Ocean. Scientific Reports, 8(1), 14479. https://doi.org/10.1038/s41598-018-32768-6
- Te Raa, L. A., & Dijkstra, H. A. (2002). Instability of the thermohaline ocean circulation on interdecadal time scales. Journal of Physical Oceanography, 32, 138–160. https://doi.org/10.1175/1520-0485(2002)032%3C0138:IOTTOC%3E2.0.CO;2
- Teuling, A. J., Van Loon, A. F., Seneviratne, S. I., Lehner, I., Aubinet, M., Heinesch, B., Bernhofer, C., Grünwald, T., Prasse, H., & Spank, U. (2013). Evapotranspiration amplifies European summer drought. Geophysical Research Letters, 40(10), 2071–2075. https://doi.org/10.1002/grl.50495
- Thirumalai, K., Quinn, T. M., Okumura, Y., Richey, J. N., Partin, J. W., Poore, R. Z., & Moreno- Chamarro, E. (2018). Pronounced centennial-scale Atlantic Ocean climate variability correlated with Western Hemisphere hydroclimate. Nature Communications, 9(1), Article 392. https://doi.org/10.1038/s41467-018-02846-4
- Thompson, L. G., Mosley-Thompson, E., Davis, M., Henderson, K., Brecher, H., Zagorodnov, V., Mashiotta, T., Lin, P., Mikhalenko, V., Hardy, D., & Beer, J. (2002). Kilimanjaro ice core records: Evidence of Holocene climate change in tropical Africa. Science, 298(5593), 589–593. https://doi.org/10.1126/science.1073198
- Thompson, L. G., Mosley-Thompson, E., Davis, M., Zagorodnov, V., Howat, I., Mikhalenko, V., & Lin, P. (2013). Annually resolved ice core records of tropical climate variability over the past ∼1800 years. Science, 340(6135), 945–950. https://doi.org/10.1126/science.1234210
- Thompson, L. G., Yao, T., Davis, M., Henderson, K., Mosley-Thompson, E., Lin, P., Beer, J., Synal, H., Cole-Dai, J., & Bolzan, J. (1997). Tropical climate instability: The last glacial cycle from a Qinghai-Tibetan ice core. Science, 276(5320), 1821–1825. https://doi.org/10.1126/science.276.5320.1821
- Thompson, L. G., Yao, T., Mosley-Thompson, E., Davis, M., Henderson, K., & Lin, P. (2000). A high-resolution millennial record of the South Asian monsoon from Himalayan ice cores. Science, 289(5486), 1916–1919. https://doi.org/10.1126/science.289.5486.1916
- Timmermann, A., Latif, M., Voss, R., & Groetzner, A. (1998). Northern Hemispheric interdecadal variability: A coupled air-sea mode. Journal of Climate, 11, 1906–1931. https://doi.org/10.1175/1520-0442(1998)011%3C1906:NHIVAC%3E2.0.CO;2
- Tippett, M. K. (2006). Filtering of GCM simulated Sahel precipitation. Geophysical Research Letters, 33(1), Article L01804. https://doi.org/10.1029/2005GL024923
- Toggweiler, J. R., & Samuels, B. (1993). Is the magnitude of the deep outflow from the Atlantic Ocean actually governed by Southern Hemisphere winds? The Global Carbon Cycle, NATO ASI Series, 15, 303–331. https://doi.org/10.1007/978-3-642-84608-3_13
- Toggweiler, J. R., & Samuels, B. (1995). Effect of drake passage on the global thermohaline circulation. Deep Sea Research Part I: Oceanographic Research Papers, 42(4), 477–500. https://doi.org/10.1016/0967-0637(95)00012-U
- Toggweiler, J. R., & Samuels, B. (1998). On the ocean’s large scale circulation in the limit of no vertical mixing. Journal of Physical Oceanography, 28(9), 1832–1852. https://doi.org/10.1175/1520-0485(1998)028<1832:OTOSLS>2.0.CO;2
- Towneley, R. (1694). Observations on the quantity of rain falling monthly for several years successively. A Letter from Richard Townley. Philosophical Transactions of the Royal Society of London, 18, 51–58. https://doi.org/10.1098/rstl.1694.0014
- Trenberth, K. E., Branstator, G., & Arkin, P. (1988). Origins of the 1988 North American drought. Science, 242(4886), 1640–1645. https://doi.org/10.1126/science.242.4886.1640
- Trenberth, K. E., Branstator, G. W., Karoly, D., Kumar, A., Lau, N.-C., & Ropelewski, C. (1998). Progress during TOGA in understanding and modeling global teleconnections associated with tropical sea surface temperatures. Journal of Geophysical Research: Oceans, 103(C7), 14291–14324. https://doi.org/10.1029/97JC01444
- Trenberth, K. E., & Fasullo, J. (2012). Climate extremes and climate change: The Russian heat wave and other climate extremes of 2010. Journal of Geophysical Research: Atmospheres, 117(D17), Article D17103. https://doi.org/10.1029/2012JD018020
- Trenberth, K. E., & Guillemot, C. (1996). Physical processes involved in the 1988 drought and 1993 floods in North America. Journal of Climate, 9(6), 1288–1298. https://doi.org/10.1175/1520-0442(1996)009<1288:PPIITD>2.0.CO;2
- Trenberth, K. E., Stepaniak, D. P., & Caron, J. M. (2000). The global monsoon as seen through the divergent atmospheric circulation. Journal of Climate, 13(22), 3969–3992. https://doi.org/10.1175/1520-0442(2000)013<3969:TGMAST>2.0.CO;2
- Treydte, K. S., Schleser, G., Helle, G., Frank, D., Winiger, M., Haug, G., & Esper, J. (2006). The twentieth century was the wettest period in northern Pakistan over the past millennium. Nature, 440(7088), 1179–1182. https://doi.org/10.1038/nature04743
- Trouet, V., Diaz, H. F., Wahl, E. R., Viau, A. E., Graham, R., Graham, N., & Cook, E. R. (2013). A 1500-year reconstruction of annual mean temperature for temperate North America on decadal-to-multidecadal time scales. Environmental Research Letters, 8(2), Article 024008. https://iopscience.iop.org/article/10. 1088/1748-9326/8/2/024008/meta. https://doi.org/10.1088/1748-9326/8/2/024008
- Ukkola, A. M., Pitman, A. J., De Kauwe, M. G., Abramowitz, G., Herger, N., Evans, J. P., & Decker, M. (2018). Evaluating CMIP5 model agreement for multiple drought metrics. Journal of Hydrometeorology, 19(6), 969–988. https://doi.org/10.1175/JHM-D-17-0099.1
- van Hengstum, P. J., Donnelly, J., Kingston, A., Williams, B., Scott, D., Reinhardt, E., Little, S., & Patterson, W. (2015). Low-frequency storminess signal at Bermuda linked to cooling events in the North Atlantic region. Paleoceanography, 30(2), 52–76. https://doi.org/10.1002/2014PA002662
- van Loon, H., & Labitzke, K. (1987). The Southern oscillation. Part V: The anomalies in the lower stratosphere of the Northern Hemisphere in winter and a comparison with the quasi-biennial oscillation. Monthly Weather Review, 115(2), 357–369. https://doi.org/10.1175/1520-0493(1987)115<0357:TSOPVT>2.0.CO;2
- van Rooy, M. P. (1965). A rainfall anomaly index independent of time and space. Weather Bureau South Africa, 14, 43–48.
- Vellinga, M., & Wu, P. (2004). Low-Latitude freshwater influence on centennial variability of the Atlantic thermohaline circulation. Journal of Climate, 17(23), 4498–4511. https://doi.org/10.1175/3219.1
- Vinther, B. M., Clausen, H., Fisher, D., Koerner, R., Johnsen, S., Andersen, K., Dahl-Jensen, D., Rasmussen, S., Steffensen, J., & Svensson, A. (2008). Synchronizing ice cores from the renland and agassiz ice caps to the Greenland Ice core chronology. Journal of Geophysical Research, 113(D8), Article D08115. https://doi.org/10.1029/2007JD009143
- Vinther, B. M., Jones, P., Briffa, K., Clausen, H., Andersen, K., Dahl-Jensen, D., & Johnsen, S. (2010). Climatic signals in multiple highly resolved stable isotope records from Greenland. Quaternary Science Reviews, 29(3-4), 522–538. https://doi.org/10.1016/j.quascirev.2009.11.002
- Voarintsoa, N. R., Brook, G., Liang, F., Marais, E., Hardt, B., Cheng, H., Edwards, R., & Railsback, L. (2017). Stalagmite multi-proxy evidence of wet and dry intervals in northeastern Namibia: Linkage to latitudinal shifts of the inter-tropical convergence zone and changing solar activity from AD 1400 to 1950. The Holocene, 27(3), 384–396. https://doi.org/10.1177/0959683616660170
- Voronin, V. I., Tartakovsky, V. A., Volkov, Y., Schleser, G. H., Helle, G., & Nesvetailo, V. D. (2008). Tree-ring isotope chronologies of the baikal region and their connection with ice isotope chronology of Greenland. Atmospheric and Oceanic Optics, 21, 50–54. https://gfzpublic.gfz-potsdam.de/pubman/faces/ViewItemFullPage.jsp?itemId=item_247901_2
- Wada, Y. (1911). Korean Rain-gauges of the Fifteenth Century. Quarterly Journal of the Royal Meteorological Society, 37(157), 83–86. https://doi.org/10.1002/qj.49703715710
- Walker, G. T. (1923). Correlation in seasonal variations of weather. VIII: A preliminary study of world weather. Memoirs of India Meteorological Department, 24, 75–131.
- Walker, G. T. (1924). Correlation in seasonal variations of weather, IX: A further study of world weather. Memoirs of India Meteorological Department, 24, 275–332.
- Walker, G. T. (1928). World Weather III. Memoirs of the Royal Meteorological Society, 11(17), 97–106.
- Walker, G. T. (1937). World Weather VI. Memoirs of the Royal Meteorological Society, IV(39), 119–139.
- Walker, G. T., & Bliss, E. W. (1930). World Weather IV: Some Applications to seasonal forecasting. Memoirs of the Royal Meteorological Society, 3(24), 81–95.
- Walker, G. T., & Bliss, E. W. (1932). World Weather v. Memoirs of the Royal Meteorological Society, 4(36), 53–84.
- Walker, J., & Rowntree, P. (1977). The effect of soil moisture on circulation and rainfall in a tropical model. Quarterly Journal of the Royal Meteorological Society, 103(435), 29–46. https://doi.org/10.1002/qj.49710343503
- Wallace, J. M. (1992). Effect of deep convection on the regulation of tropical sea surface temperature. Nature, 357(6375), 230–231. https://doi.org/10.1038/357230a0
- Wallace, J. M., & Hobbs, P. (1977). Atmospheric Science: an introductory survey. Academic Press. 467 pp.
- Wang, A., Lettenmaier, D., & Sheffield, J. (2011). Soil moisture drought in China, 1950-2006. Journal of Climate, 24(13), 3257–3271. https://doi.org/10.1175/2011JCLI3733.1
- Wang, C., & Enfield, D. (2001). The tropical Western Hemisphere warm pool. Geophysical Research Letters, 28(8), 1635–1638. https://doi.org/10.1029/2000GL011763
- Wang, C., Enfield, D., Lee, S., & Landsea, C. (2006a). Influences of the Atlantic warm pool on Western Hemisphere summer rainfall and Atlantic hurricanes. Journal of Climate, 19(12), 3011–3028. https://doi.org/10.1175/JCLI3770.1
- Wang, H., Schubert, S., Koster, R., Ham, Y., & Suarez, M. (2014). On the role of SST forcing in the 2011 and 2012 extreme U.S. heat and Drought: A Study in Contrasts. Journal of Hydrometeorology, 15, 1255–1273. https://doi.org/10.1175/JHM-D-13-069.1
- Wang, J., Yang, B., Ljungqvist, F., Luterbacher, J., Osborn, T., Briffa, K., & Zorita, E. (2017). Internal and external forcing of multidecadal Atlantic climate variability over the past 1200 years. Nature Geoscience, 10, 512–517. https://doi.org/10.1038/ngeo2962
- Wang, W., Anderson, B. T., Entekhabi, D., Huang, D., Kaufmann, R. K., Potter, C., & Myneni, R. B. (2006). Feedbacks of vegetation on summertime climate variability over the North American grasslands. Part II: A coupled stochastic model. Earth Interactions, 10, 1–30. https://doi.org/10.1175/EI197.1
- Wang, Y., Cheng, H., Edwards, R., He, Y., Kong, X., An, Z., Wu, J., Kelly, M., Dykoski, C., & Li, X. (2005). The Holocene Asian monsoon: Links to solar changes and North Atlantic climate. Science, 308(5723), 854–857. https://doi.org/10.1126/science.1106296
- Wang, Y., Li, S., & Luo, D. (2009). Seasonal response of Asian monsoonal climate to the Atlantic multidecadal oscillation. Journal of Geophysical Research, 114(D2), Article D02112. https://doi.org/10.1029/2008JD010929
- Waple, A. M., Mann, M., & Bradley, R. (2002). Long-term patterns of solar irradiance forcing in model experiments and proxy-based surface temperature reconstructions. Climate Dynamics, 18(7), 563–578. https://doi.org/10.1007/s00382-001-0199-3
- Wassenburg, J. A., Immenhauser, A., Richter, D. K., Nieder-mayr, A., Riechelmann, S., Fietzke, J., Scholz, D., Jochum, K. P., Fohlmeister, J., Schorder-Ritzrau, A., Sabaooui, A., Riechelmann, D. F. C., Schneider, L., & Esper, J. (2013). Moroccan speleothem and tree ring records suggest a variable positive state of the North Atlantic Oscillation during the mediaeval warm period. Earth and Planetary Science Letters, 375, 291–302. https://doi.org/10.1016/j.epsl.2013.05.048
- Weakly, H. E. (1965). Recurrence of drought in the Great Plains during the last 700 years. Agricultural Engineering, 46, 85.
- Webb, D. J., & Suginohara, N. (2001). Vertical mixing in the ocean. Nature, 409(6816), Article 37. https://doi.org/10.1038/35051171
- Webster, P. J. (1987). The elementary monsoon. In J. S. Fein, & P. L. Stephens (Eds.), Monsoons (pp. 3–32). Wiley.
- Webster, P. J., Magana, V., Palmer, T., Shukla, J., Tomas, R., Yanai, M., & Yasunari, T. (1998). Monsoons: Processes, predictability, and the prospects for prediction. Journal of Geophysical Research: Oceans, 103(C7), 14451–14510. https://doi.org/10.1029/97JC02719
- Webster, P. J., Moore, A., Loschnigg, J., & Leben, R. (1999). Coupled ocean-atmosphere dynamics in the Indian Ocean during 1997–98. Nature, 401(6751), 356–360. https://doi.org/10.1038/43848
- Weisberg, R. H., & Wang, C. (1997). A western Pacific oscillator paradigm for the El Niño-Southern oscillation. Geophysical Research Letters, 24(7), 779–782. https://doi.org/10.1029/97GL00689
- Werner, J. P., Divine, D. V., Charpentier Ljungqvist, F., Nilsen, T., & Francus, P. (2018). Spatio-temporal variability of Arctic summer temperatures over the past 2 millennia. Climate of the Past, 14(4), 527–557. https://doi.org/10.5194/cp-14-527-2018
- Wiles, G. C., D'Arrigo, D., Villalba, R., Calkin, P., & Barclay, D. (2004). Century-scale solar variability and alaskan temperature change over the past millennium. Geophysical Research Letters, 31(15), Article L15203. https://doi.org/10.1029/2004GL020050
- Wilhite, D. A. (2000). Drought as a natural hazard: Concepts and definitions. Drought: A Global Assessment, 1, 3–18.
- Wilhite, D. A. (2016). Droughts: A global assessment. Routledge. 752 pp.
- Wilhite, D. A., & Glantz, M. H. (1985). Understanding the drought phenomenon: The role of definitions. Water International, 10(3), 111–120. https://doi.org/10.1080/02508068508686328
- Wilson, R., Anchukaitis, K., Briffa, K. R., Büntgen, U., Cook, E., D'Arrigo, R., Davi, N., Esper, J., Frank, D., Gunnarson, B., Hegerl, G., Helama, S., Klesse, S., Krusic, P. J., Linderholm, H. W., Myglan, V., Osborn, T. J., Rydval, M., Schneider, L., … Zorita, E. (2016). Last millennium northern hemisphere summer temperatures from tree rings: Part I: The long term context. Quaternary Science Reviews, 134, 1–18. https://doi.org/10.1016/j.quascirev.2015.12.005
- Winstanley, D. (1973a). Recent rainfall trends in Africa, the Middle East and India. Nature, 243(5408), 464–465. https://doi.org/10.1038/243464a0
- Winstanley, D. (1973b). Rainfall patterns and general atmospheric circulation. Nature, 245(5422), 190–194. https://doi.org/10.1038/245190a0
- Wittenberg, A. T., Rosati, A., Lau, N., & Ploshay, J. (2006). GFDL's CM2 global coupled climate models. Part III: Tropical Pacific climate and ENSO. Journal of Climate, 19(5), 698–722. https://doi.org/10.1175/JCLI3631.1
- Woodhouse, C. A., & Overpeck, J. T. (1998). 2000 years of drought variability in the central United States. Bulletin of the American Meteorological Society, 79(12), 2693–2714. https://doi.org/10.1175/1520-0477(1998)079<2693:YODVIT>2.0.CO;2
- World Bank. (2021). World population data. https://data.worldbank.org/indicator/SP.POP.TOTL
- Wortham, B. E., Wong, C. I., Silva, L., McGee, D., Montanez, I., Rasbury, E., Cooper, K., Sharp, W., Glessner, J., & Santos, R. (2017). Assessing response of local moisture conditions in central Brazil to variability in regional monsoon intensity using speleothem 87Sr/86Sr values. Earth and Planetary Science Letters, 463, 310–322. https://doi.org/10.1016/j.epsl.2017.01.034
- Wu, J. L., Yu, Z. C., Zeng, H. A., & Wang, N. L. (2009). Possible solar forcing of 400-year wet-dry climate cycles in northwestern China. Climatic Change, 96(4), 473–482. https://doi.org/10.1007/s10584-009-9604-4
- Wust, G. (1935). The stratosphere of the Atlantic Ocean. Amerind Publishing. 112 pp.
- Xu, G. C., & Zhang, Z. (1983). The effect of Qinghai-Xizang Plateau on the formation of dry climate over the northwest China (in Chinese). Plateau Meteorology, 2, 9–16.
- Xu, J., Ren, L. L., Ruan, X. H., Liu, X. F., & Yuan, F. (2012). Development of a physically based PDSI and its application for assessing the vegetation response to drought in northern China. Journal of Geophysical Research: Atmospheres, 117(D8). https://doi.org/10.1029/2011JD016807
- Yang, J., Liu, Q., Xie, S., Liu, Z., & Wu, L. (2007). Impact of the Indian Ocean SST basin mode on the Asian summer monsoon. Geophysical Research Letters, 34(2), Article L02708. https://doi.org/10.1029/2006GL028571
- Yang, W., Seager, R., Cane, M., & Lyon, B. (2014). The East African long rains in observations and models. Journal of Climate, 27(19), 7185–7202. https://doi.org/10.1175/JCLI-D-13-00447.1
- Ye, D. (1981). Some characteristics of the summer circulation over the Qinghai-Xizang (Tibet) Plateau and its neighborhood. Bulletin of the American Meteorological Society, 62(1), 14–19. https://doi.org/10.1175/1520-0477(1981)062<0014:SCOTSC>2.0.CO;2
- Yin, L., Fu, R., Shevliakova, E., & Dickinson, R. E. (2013). How well can CMIP5 simulate precipitation and its controlling processes over tropical South America? Climate Dynamics, 41(11-12), 3127–3143. https://doi.org/10.1007/s00382-012-1582-y
- Yoon, J. H., & Zeng, N. (2010). An Atlantic influence on Amazon rainfall. Climate Dynamics, 34(2-3), 249–264. https://doi.org/10.1007/s00382-009-0551-6
- Yu, F., & Ito, E. (1999). Possible solar forcing of century-scale drought frequency in the northern Great plains. Geology, 27(3), 263–266. https://doi.org/10.1130/0091-7613(1999)027<0263:PSFOCS>2.3.CO;2
- Yu, H., Zhang, Q., Xu, C., Du, J., Sun, P., & Hu, P. (2019). Modified Palmer Drought Severity Index: Model improvement and application. Environment International, 130, Article 104951. https://doi.org/10.1016/j.envint.2019.104951
- Yuan, T., Oreopoulos, L., Zelinka, M., Yu, H., Norris, J., Chin, M., Platnick, S., & Meyer, K. (2016). Positive low cloud and dust feedbacks amplify tropical North Atlantic Multidecadal Oscillation. Geophysical Research Letters, 43, 1349–1356. https://doi.org/10.1002/2016GL067679
- Zargar, A., Sadiq, R., Naser, B., & Khan, F. I. (2011). A review of drought indices. Environmental Reviews, 19(NA), 333–349. https://doi.org/10.1139/a11-013
- Zaron, E. D., & Egbert, G. (2006). Estimating open-ocean barotropic tidal dissipation: The Hawaiian ridge. Journal of Physical Oceanography, 36(6), 1019–1035. https://doi.org/10.1175/JPO2878.1
- Zelinka, M. D., Myers, T. A., McCoy, D. T., Po-Chedley, S., Caldwell, P. M., Ceppi, P., Klein, S. A., & Taylor, K. E. (2020). Causes of higher climate sensitivity in CMIP6 models. Geophysical Research Letters, 47(1), Article e2019GL085782. https://doi.org/10.1029/2019GL085782
- Zeng, N., & Neelin, J. D. (2000). The role of vegetation-climate interaction and interannual variability in shaping the African savanna. Journal of Climate, 13(15), 2665–2670. https://doi.org/10.1175/1520-0442(2000)013<2665:TROVCI>2.0.CO;2
- Zeng, N., Neelin, J., Lau, W., & Tucker, C. (1999). Enhancement of interdecadal climate variability in the Sahel by vegetation interaction. Science, 286(5444), 1537–1540. https://doi.org/10.1126/science.286.5444.1537
- Zhang, H., Werner, J. P., García-Bustamante, E., González-Rouco, F., Wagner, S., Zorita, E., Fraedrich, K., Jungclaus, J. H., Ljungqvist, F. C., Zhu, X., Xoplaki, E., Chen, F., Duan, J., Ge, Q., Hao, Z., Ivanov, M., Schneider, L., Talento, S., Wang, J., … Luterbacher, J. (2018). East Asian warm season temperature variations over the past two millennia. Scientific Reports, 8(1), Article 7702. https://doi.org/10.1038/s41598-018-26038-8
- Zhang, L., & Wang, C. (2013). Multidecadal North Atlantic sea surface temperature and Atlantic meridional overturning circulation variability in CMIP5 historical simulations. Journal of Geophysical Research, 118, 5772–5791. https://doi.org/10.1002/jgrc.20390
- Zhang, L., & Zhou, T. (2015). Drought over East Asia: A review. Journal of Climate, 28(8), 3375–3399. https://doi.org/10.1175/JCLI-D-14-00259.1
- Zhang, P., Cheng, H., Edwards, R. L., Chen, F., Wang, Y., Yang, X., Liu, J., Tan, M., Wang, X., Liu, J., An, C., Dai, Z., Zhou, J., Zhang, D., Jia, J., Jin, L., & Johnson, K. R. (2008). A test of climate, Sun and culture relation- ships from an 1810-year Chinese cave record. Science, 322(5903), 940–942. https://doi.org/10.1126/science.1163965
- Zhang, R., & Delworth, T. (2006). Impact of Atlantic multidecadal oscillations on India/Sahel rainfall and Atlantic hurricanes. Geophysical Research Letters, 33(17), Article L17712. https://doi.org/10.1029/2006GL026267
- Zhang, Z., & Krishnamurti, T. N. (1996). A generalization of gill's heat-induced tropical circulation. Journal of the Atmospheric Sciences, 53(7), 1045–1052. https://doi.org/10.1175/1520-0469(1996)053<1045:AGOGHI>2.0.CO;2
- Zhou, T., & Yu, R. (2005). Atmospheric water vapor transport associated with typical anomalous summer rainfall patterns in China. Journal of Geophysical Research, 110(D8), Article D08104. https://doi.org/10.1029/2004JD005413
- Zhu, J., Otto-Bliesner, B. L., Brady, E. C., Poulsen, C. J., Tierney, J. E., Lofverstrom, M., & DiNezio, P. (2021). Assessment of equilibrium climate sensitivity of the Community Earth System Model version 2 through simulation of the Last Glacial maximum. Geophysical Research Letters, 48, Article e2020GL091220. https://doi.org/10.1029/2020GL091220
- Zhu, J., Poulsen, C. J., & Otto-Bliesner, B. L. (2020). High climate sensitivity in CMIP6 model not supported by paleoclimate. Nature Climate Change, 10(5), 378–379. https://doi.org/10.1038/s41558-020-0764-6
- Zorita, E., Gonzalez-Rouco, F., & Legutke, S. (2003). Testing the Mann et al. (1998) approach to paleoclimate reconstructions in the context of a 1000-yr control simulation with the ECHO-G coupled climate model. Journal of Climate, 16(9), 1378–1390. https://doi.org/10.1175/1520-0442(2003)16<1378:TTMEAA>2.0.CO;2