
ABSTRACT
The Northwest Passage is often referred to as the “Holy Grail” of ship navigation as it provides a shorter route connecting the Atlantic and Pacific Oceans compared to the Northern Sea Route, Panama Canal, Suez Canal, and transiting around Cape Horn. Here, we summarize 52 years of observed multi-year ice (MYI) conditions from 1968 to 2020 in the western Canadian Arctic regions of the Northwest Passage updating a previous study that considered 1968–2006. Results indicate that on average, MYI area anomalies during the shipping season were +28% from 1968 to 2006 but −33% from 2007 to 2020 relative to the 1991–2020 climatology. The frequency of negative MYI area anomalies from 2007 to 2020 was unprecedented over the 52-year record. 13 of the past 14 years were negative in the Beaufort Sea, Franklin, and the Western Arctic Waterway; 10 of the past 14 years were negative in Western Parry Channel and Queen Elizabeth Islands; and 9 of the past 14 years were negative in the M’Clintock Channel. Despite strong and frequent negative MYI anomalies from 2007 to 2020, MYI recovery from first-year ice (FYI) aging and MYI dynamic import continued, but was reduced by 47% and 22%, respectively compared to 1968–2006. We demonstrate that from 2007 to 2020 (i) MYI dynamic recovery decreased because Arctic Ocean MYI has been primarily flowing into the Canadian Arctic via the smaller apertures in the Queen Elizabeth Islands and not from the Beaufort Sea via the M’Clure Strait and (ii) FYI aging decreased because recent changes in thermodynamic forcing have contributed to more melt. Overall, our results re-affirm that light MYI years in the Northwest Passage may occur more frequently as the Arctic continues to warm, but MYI recovery will continue to present a significant hazard to navigation for the foreseeable future.
RÉSUMÉ [Traduit par la redaction]
Le passage du Nord-Ouest est souvent considéré comme le « Saint Graal » de la navigation maritime, car il offre une route plus courte pour relier les océans Atlantique et Pacifique que la route maritime du Nord, le canal de Panama, le canal de Suez et le passage du Cap Horn. Nous résumons ici 52 années de conditions de glace plusieurs années observées de 1968 à 2020 dans les régions de l’Arctique canadien occidental du passage du Nord-Ouest, en actualisant une étude précédente qui portait sur la période 1968–2006. Les résultats indiquent qu’en moyenne, les anomalies de la zone de glace de plusieurs années pendant la saison de navigation étaient de +28% de 1968 à 2006 mais de −33% de 2007 à 2020 par rapport à la climatologie 1991–2020. La fréquence des anomalies négatives de la zone de glace de plusieurs années entre 2007 et 2020 est sans précédent sur les 52 ans d’enregistrement: 13 des 14 dernières années ont été négatives dans la mer de Beaufort, à Franklin et dans la voie navigable de l’Arctique de l’Ouest; 10 des 14 dernières années ont été négatives dans le chenal Parry de l’Ouest et dans les îles Reine Elizabeth; et 9 des 14 dernières années ont été négatives dans le chenal M’Clintock. Malgré des anomalies négatives fortes et fréquentes de 2007 à 2020, la récupération de la glace de plusieurs années attribuable au vieillissement de la glace de première année et à l’importation dynamique de glace pluriannuelle s’est poursuivie, mais a été réduite de 47% et 22%, respectivement, par rapport à la période 1968–2006. Nous démontrons que, de 2007 à 2020, (i) la récupération dynamique de la glace de plusieurs années a diminué parce que la glace de plusieurs années de l’océan Arctique s’est écoulée principalement dans l’Arctique canadien par les plus petites ouvertures des îles Reine Elizabeth et non de la mer de Beaufort par le détroit de M’Clure; et (ii) le vieillissement de la glace de première année a diminué parce que les récents changements dans le forçage thermodynamique ont contribué à une plus grande fonte. Dans l’ensemble, nos résultats réaffirment que les années de glace légère de plusieurs années dans le passage du Nord-Ouest peuvent se produire plus fréquemment à mesure que l’Arctique continue de se réchauffer, mais que la récupération de glace de plusieurs années continuera de présenter un danger important pour la navigation dans un avenir prévisible.
1 Introduction
Over the past several decades, sea ice in the Arctic has declined in extent (Comiso, Citation2012; Meier et al., Citation2014), thickness (Kacimi & Kwok, Citation2022; Kwok, Citation2018), and age (Tschudi et al., Citation2020). Future decreases in sea ice are projected by the latest state-of-the climate models and a sea ice-free Arctic during the summer months could be realized by 2050 (Notz & SIMIP Community, Citation2020). Several studies have used model projections to suggest that future navigation throughout the Arctic could become more practical with decreasing summer sea ice replaced by increasing areas of open water (e.g. Crawford et al., Citation2021; Melia et al., Citation2016; Mudryk et al., Citation2021; Smith & Stephenson, Citation2013; Wei et al., Citation2020). Ship navigation through the Arctic provides shorter routes that connect the Pacific and Atlantic Oceans through the Northwest Passage and the Northern Sea Route as opposed to the Panama and Suez Canals or transiting around Cape Horn.
The Northwest Passage is often referred to as the “Holy Grail” of ship navigation with possible shipping routes located in the Canadian Arctic (). Ship traffic has been increasing in the Canadian Arctic (Dawson et al., Citation2018; Pizzolato et al., Citation2016) and even the luxury cruise liner Crystal Serenity made two successful transits through the southern route of the Northwest Passage in 2017 and 2018. Navigating the Northwest Passage is particularly challenging in the western Canadian Arctic regions of the passage () because there is usually a considerable amount of multi-year ice (MYI) that is inherently thicker and stronger than seasonal ice. As a result, MYI can persist through the summer melt season, remaining a hazard to navigation at the peak of the shipping season in summer and early fall. Recent observations indicate that MYI is still relatively thick within the western Canadian Arctic regions of the Northwest Passage (Babb et al., Citation2020; Haas & Howell, Citation2015; Kwok, Citation2018). Moreover, climate models project that MYI will remain present in many regions of the Canadian Arctic even when a significant portion of the Arctic Ocean is sea ice-free during the summer months (Laliberté et al., Citation2015; Mudryk et al., Citation2021).
Fig. 1 Regions of the Northwest Passage located in the western Canadian Arctic.
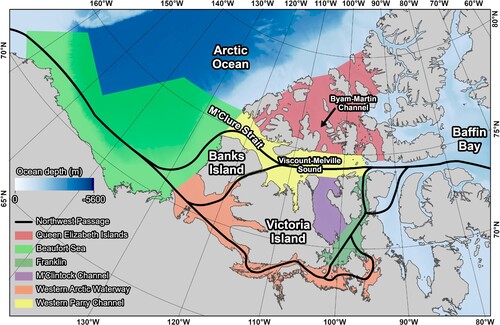
A previous study by Howell et al. (Citation2008) investigated MYI conditions in the western Canadian Arctic regions of the Northwest Passage () from 1968 to 2006. The key result was that the imprint of warming from climate change had not yet resulted in markedly lighter MYI conditions in these regions over the period of 1968–2006. Howell et al. (Citation2008) further demonstrated that stability of MYI in many of the Northwest Passage regions within the western Canadian Arctic was the result of a combination of first-year ice (FYI) aging to MYI and MYI import from the Arctic Ocean. Specifically, MYI from both sources was found to flow southward through the western Canadian Arctic regions of the Northwest Passage during the melt season and accumulate in both M’Clintock Channel and Franklin regions (). This process operates as a “drain-trap mechanism” thereby maintaining a high concentration of MYI in the Northwest Passage.
It has been 14 years since the previous assessment of MYI conditions in the Northwest Passage regions of the Canadian Arctic by Howell et al. (Citation2008) and dramatic changes with respect to pan-Arctic sea ice have since occurred. Most notably, the last 14 years have exhibited the lowest minimum pan-Arctic September sea ice extents in the 43-year satellite passive microwave record (NSIDC, Citation2020). The Beaufort Sea was virtually ice-free during the summer for the first time in 2012 (Babb et al., Citation2016) and then again in 2016 (Babb et al., Citation2019). The northern route of the Northwest Passage became almost completely ice-free for the first time during the satellite era in 2007 (Howell et al., Citation2009) with even lighter conditions in 2011 (Howell, Wohlleben, Komarov, et al., Citation2013). Polynyas have recently formed in regions that contain the oldest and thickest sea ice in the Arctic (Ludwig et al., Citation2019; Moore et al., Citation2018; Moore et al., Citation2021).
Considering these recent and dramatic changes, our study here updates the previous analysis by Howell et al. (Citation2008) from 1968 to 2006 to include changes over the last 14 years (i.e. for a record spanning 1968–2020). Specifically, for the western Canadian Arctic regions covering the Northwest Passage we (i) discuss MYI variability by comparing 1968–2006 to 2007–2020 and (ii) discuss recent changes in the dynamic and thermodynamic processes that regulate MYI concentration along the Northwest Passage.
2 Data and methods
We use sea ice data from the Canadian Ice Service Digital Archive (CISDA), which is a compilation of weekly ice charts from the Canadian Ice Service (CIS) from 1968 to 2020. The weekly CIS ice charts integrate all available sea ice information from various sources with the primary source being synthetic aperture radar (SAR) from RADARSAT-1 (1996−2007), RADARSAT-2 (2008−2020), or RADARSAT Constellation Mission (2020-present). The ice charts provide polygons of the partial sea ice concentration of different ice types (e.g. FYI and MYI), different stage of ice development and the sea ice floe size distribution. A complete description of the CISDA is available in Tivy et al. (Citation2011) and the data is available at: https://iceweb1.cis.ec.gc.ca/Archive/page1.xhtml?lang = en.
The main concern with using the CISDA to quantify long-term sea ice variability and change is that the source information used in ice chart preparation has changed over time (Canadian Ice Service Archive Documentation Series, Citation2007a). The CIS has previously identified six time periods as being significant in the history of CIS ice chart preparation (). Accordingly, a quality index was developed by the CIS for regions in the Canadian Arctic as a metric to quantify changes in technology for these six time periods and is fully described in the Canadian Ice Service Archive Documentation Series (Citation2007b). The quality index for the regions used in this study are shown in and range from 0 (poor) to 5 (excellent) with 3 being average. To our knowledge, the CIS has not identified a new period since 2005, but with the recent availability of even more satellites (e.g. RADARSAT-2, Sentinel-1, and the RADARSAT Constellation Mission) quality is expected to be similar if not higher than 1996−2005.
Table 1 Source information for six time periods identified as being significant in the history of the Canadian Ice Service with respect to ice chart preparation.
Table 2 Quality index score for the regions in the western Canadian Arctic regions of the Northwest Passage for the six time periods identified as being significant in the history of the Canadian Ice Service with respect to ice chart preparation.
Looking at reveals a well-known bias of the CISDA in that MYI concentration is overestimated during earlier periods, particularly in the Queen Elizabeth Islands because ice chart analysts assumed any ice in the region was MYI (Tivy et al., Citation2011). Therefore, estimates of MYI within the Canadian Arctic prior to the availability of real-time satellite data are likely too high. Tivy et al. (Citation2011) performed a comprehensive comparison against existing datasets and found no evidence of a time varying basis in MYI when considering the 17-week shipping season even after the shift to the RADARSAT period in 1996. Despite this, we still avoid calculating trends to minimize potential technological changes in our analysis. However, we note when MYI conditions from the pre-satellite period are inter-compared or compared with the recent satellite period changes, they may be artificially enhanced. This uncertainty is unquantifiable and therefore when we compare MYI conditions from 2007–2020 to 1968–2006 we also compare them to the 1978–2006 satellite period MYI conditions in order to provide a range of potential uncertainty.
For each year from 1968 to 2020, we extracted the average MYI area over a 17-week time period from 25 June to 15 October for the study regions shown in . The 17-week time period represents the outermost bounds for the shipping season in the Canadian Arctic and average sea ice conditions over this time period have been used to assess sea ice trends and variability (Derksen et al., Citation2018; Tivy et al., Citation2011). We present the time series of MYI area for the regions in as a percent difference (anomalies) from the 1991–2020 average which is the current World Meteorological Organization (WMO) climatological standard normal. We also present the average of the MYI area percent differences for each region from 1968 to 2006 and 2007 to 2020, both relative to the 1991–2020 climatology.
Following Howell et al. (Citation2008) we also used the CISDA to estimate the amount of MYI created by FYI aging and the amount of MYI dynamically imported/exported for the regions of the Northwest Passage within the Canadian Arctic. FYI that survives the summer melt season is promoted to MYI on October 1st. Accordingly, the amount of FYI being promoted to MYI (i.e. FYI aging) in our study regions was estimated by taking the amount of FYI present on the last ice chart in September (i.e. the ice chart prior to the October 1st birthday). To estimate the MYI dynamically exchanged within a region we subtracted MYI area on last ice chart in September from MYI area from the first ice chart of the shipping season (i.e. 25th June). Positive values indicate a net gain of MYI, which means that ice import exceeded ice melt/export within the region. Conversely, negative values indicate a net loss of MYI loss via melt and/or export out of the region.
We also made use of surface skin temperature and albedo from the extended Advanced Very High Resolution Radiometer (AVHRR) Polar Pathfinder (APP-x; Wang & Key, Citation2005) from 1982 to 2020 available at: https://www.ncei.noaa.gov/access/metadata/landing-page/bin/iso?id = gov.noaa.ncdc:C00941 The data is available at a spatial resolution of 25 km and the uncertainties for surface skin temperature and albedo are 1.98 K and 0.10, respectively (Wang & Key, Citation2005). While 2 m air temperature is the most common metric to assess long time temperature change, surface skin temperature has also been shown to be a useful climate indictor (e.g. Wang & Key, Citation2003). Moreover, the APP-x is the only dataset that provides long term and consistent satellite observations of both surface skin temperature and albedo over Arctic sea ice. We use both surface skin temperature and albedo to provide insight in changes that have occurred with respect to surface conditions with western Canadian Arctic regions of the Northwest Passage.
3 MYI variability: 1968–2006 vs 2007–2020
shows the percentage of MYI concentration from 1968 to 2006, 1978 to 2006, and 2007 to 2020 for regions of the Northwest Passage in the Canadian Arctic during the shipping season (25 June to 15 October). All regions have between 41 and 62% less MYI for 2007–2020 compared to 1968–2006 with the exception of the Queen Elizabeth Islands, which has only 12% less (). Spatially, the contrast is striking in these regions when the MYI concentration from 1968 to 2006 is compared against the MYI concentration from 2007 to 2020 (). When MYI conditions from 2007 to 2020 are compared against MYI conditions from 1978 to 2006 (i.e. the satellite period) the percent change is similar to 1968–2006 and within ±1−3%.
Fig. 2 Spatial distribution of the average MYI concentration from 25 June to 15 October for 1968–2006 (a), 2007–2020 (b), and (c) the difference of 2007–2020 minus 1968–2006 for the western Canadian Arctic. The extent of Canadian Ice Service ice charts did not fully cover the Arctic Ocean from 1972 to 1996.
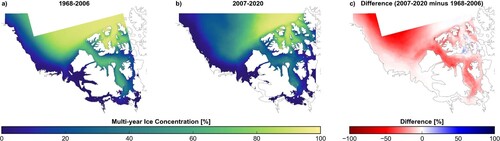
Table 3 Percentage of MYI concentration from 1968 to 2006, 1978 to 2006, and 2007 to 2020 in the regions of the Northwest Passage and percentage change from 1968–2006 to 2007–2020 and 1978–2006 to 2007–2020 with the standard deviation in brackets. These percentages represent the average from 1968 to 2006, 1978 to 2006, and 2007 to 2020 based on each year’s 17-week shipping season average. MYI is scaled by the total area for each region.
illustrates the time series of the percent MYI area difference relative to the MYI area 1991–2020 climatology over the shipping season in the selected regions of the Northwest Passage for 1968–2006 (blue) and 2007–2020 (red). The most noticeable feature in is the considerable negative anomalies in all regions since 2007. On average, the MYI area anomalies were 33% less from 2007 to 2020. In the Western Parry Channel, which is the most direct route through the Northwest Passage, 1999 remained the lightest MYI year during the shipping season with a negative anomaly of 71% (). In terms of frequency, negative anomalies occurred for 13 of the past 14 years in the Beaufort Sea, Franklin, and the Western Arctic Waterway; 10 of the past 14 years in Western Parry Channel and Queen Elizabeth Islands; and 9 of the past 14 years in the M’Clintock Channel.
Fig. 3 Time series of the percent MYI area difference during the shipping season from the 1991–2020 climatology for the western Canadian Arctic regions of the Northwest Passage from 1968 to 2020. The annotated text corresponds to the average percent MYI difference for the 1968–2006 period (blue) and 2007–2020 period (red). The shipping season is defined as the 17-week time period from 25 June to 15 October.
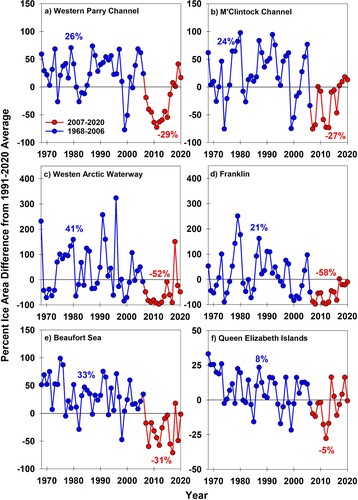
The processes contributing to extreme light ice years (i.e. 1998, 1999, 2007, 2011, and 2012) within these regions of the Northwest Passage are discussed elsewhere (e.g. Alt et al., Citation2006; Howell et al., Citation2010; Howell, Wohlleben, Komarov, et al., Citation2013). However, the point we wish to emphasize is that 1999 visibly stands out as anomalous over the 1968–2006 period, yet MYI conditions quickly recovered within 2–3 years (). When we look at the 2007–2020 period, there was a prolonged reduction in MYI conditions with negative anomalies between 2007 and 2016, before a gradual recovery within the Western Parry Chanel during recent years ().
Clearly, the number of negative MYI anomalies experienced by all of these regions from 2007 to 2020 during the shipping season was unprecedented over the entire 52-year record. However, the oscillating nature of the MYI time series for these regions of the Northwest Passage illustrated in is indicative of MYI recovery processes operating within the CAA itself. These processes can act over timescales of one to several years depending on whether they are thermodynamic and/or dynamic in origin (e.g. Alt et al., Citation2006; Howell & Brady, Citation2019; Howell, Wohlleben, Komarov, et al., Citation2013; Melling, Citation2002). We now investigate changes to MYI recovery within these regions to put the recent period of 2007–2020 within historical context.
4 MYI recovery within the Canadian Arctic archipelago
MYI recovery within the CAA is a function of MYI import from the Arctic Ocean together with FYI aging (Alt et al., Citation2006; Howell et al., Citation2008; Melling, Citation2002). MYI is transported southward through the western regions of the CAA where the M’Clintock Channel and Franklin regions act as a drain-trap provided there is sufficient leeway (i.e. open water in the channels) to accommodate the MYI from northern latitudes (Howell et al., Citation2008). Arctic Ocean MYI is almost always imported into the CAA via the Queen Elizabeth Islands but the ice exchange between the Beaufort Sea and the Western Parry Channel (i.e. through M’Clure Strait) is more variable with import during summer (i.e. August and September) and export during fall (i.e. October and November) (Howell, Wohlleben, Dabboor, et al., Citation2013). MYI also accumulates in the Western Parry Channel when it is exported from the Queen Elizabeth Islands via Byam-Martin Channel (Howell et al., Citation2009; Melling, Citation2002) in addition to local FYI aging (Howell et al., Citation2016). These processes are important for MYI recovery within the western regions because when they are sufficient to establish a MYI tongue in the Western Parry Channel (e.g. , left) that is connected to the Beaufort Sea, the import flux pushes MYI in the Western Parry Channel toward the M’Clintock Channel where it can subsequently flow southward and enter the drain trap (Howell et al., Citation2008).
MYI recovery within the CAA can be most intense following a year with considerable MYI loss, as a cycle of ice replenishment is initialized. Traditionally, in the years following anomalously light sea ice conditions within the CAA (e.g. 1982 and 1998; ), there has been a period of recovery operating over several years. However, since 2007 the processes of MYI recovery have in many regions struggled to replenish MYI as easily as they have in the past, with fewer positive anomalies following low MYI years from 2007 to 2020 ().
The percentage of MYI area change of the amount of FYI aging and MYI dynamic transport averaged over 1968−2006, 1979−2006, and 2007–2020 for the western regions of the Northwest Passage is shown in and time series of these components are illustrated in . Dynamic MYI area exchange was reduced by 22% for the 2007–2020 period compared to 1968–2006 and indicates less MYI was available to migrate southward. The amount of FYI aging was also reduced by 47% for the 2007–2020 period compared to 1968–2006 and indicates a smaller area of FYI was able to survive summer melting after 2007 compared to beforehand. When then satellite period of 1978–2006 is compared against 2007−2020, the magnitude of recovery for dynamic MYI area exchange reduced by 30% and FYI aging area reduced by 44%.
Fig. 4 Time series of changes in MYI recovery and loss components (%) for the western Canadian Arctic regions of the Northwest Passage from 1968 to 2020. The pink dashed line marks the cutoff between our focus periods in 1968–2006 and 2007–2020. MYI is scaled by the total area for each region.
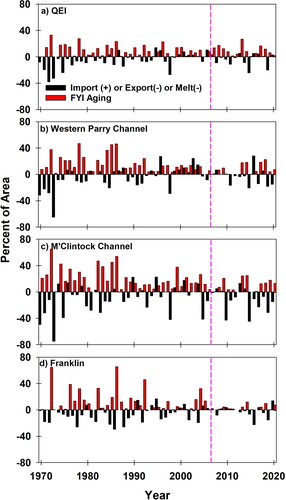
Table 4 Percentage of MYI dynamic exchange and FYI aging from 1968 to 2006, 1978 to 2006, and 2007 to 2020 in the regions of the Northwest Passage with the standard deviation in brackets. These percentages represent the average from 1968 to 2006, 1978 to 2006, and 2007 to 2020. MYI is scaled by the total area for each region.
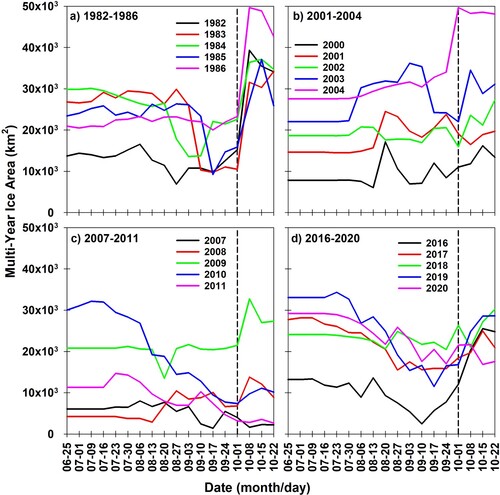
To better understand the recent decline in MYI recovery after 2007, we compare the mechanisms of recovery following historically light MYI years in previous decades (i.e. 1982–1986 and 1999−2004). For this comparison we also show the first CIS ice chart in October for 1982–1986 () 1999–2004 (), and 2007–2020 () which illustrate both components of recovery (i.e. FYI aging and MYI dynamic import) across the region. We also highlight the weekly evolution of MYI conditions in the M’Clintock Channel for selected years ().
Fig. 5 Spatial distribution of MYI concentration on the first Canadian Ice Service ice chart in October from 1982 to 1987. Note the severing before 1984 then reestablishment of the MYI tongue connecting the Beaufort Sea to the Western Parry Channel in subsequent years.
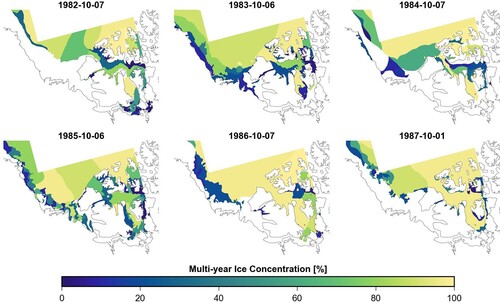
Fig. 6 Spatial distribution of MYI concentration on the first Canadian Ice Service ice chart in October from 1999 to 2004.
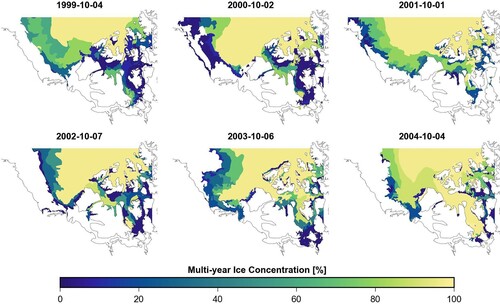
Fig. 7 Spatial distribution of MYI concentration on the first Canadian Ice Service ice chart in October from 2007 to 2020.
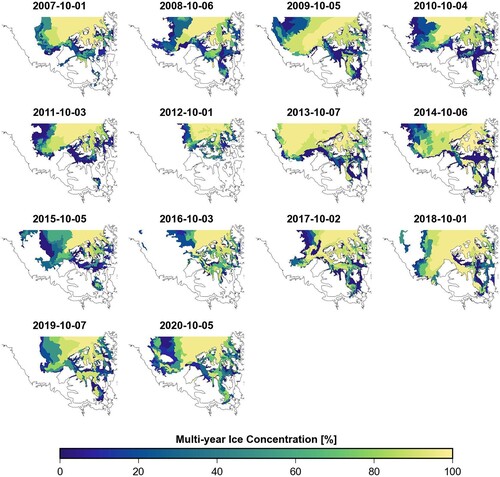
Fig. 8 Weekly evolution of MYI area in the M’Clintock Channel for (a) 1982–1986, (b) 2001–2004, (c) 2007–2011, and (d) 2016–2020. The vertical dashed line indicates the date (1 October) when FYI is promoted to MYI.
a Historical MYI recovery from 1982 to 1986 and 1999 to 2004
In the Queen Elizabeth Islands, Western Parry Channel, Franklin, and M’Clintock Channel regions, MYI recovery following the light ice years of 1982 and 1983 was dominated by FYI aging (). Howell et al. (Citation2009) previously found that shorter melt seasons contributed to more FYI aging during this time period. The weekly evolution of MYI conditions in the M’Clintock Channel from 1982 to 1986 also illustrates considerable FYI aging from the bump in the time series following October 1st; however, the MYI oscillations prior to October 1st also indicate southward MYI transport (). It is difficult to isolate the source of Arctic Ocean MYI import (i.e. the M’Clure Strait and/or Queen Elizabeth Islands) using the CISDA without including ice drift and unfortunately that data is not available during this period. However, manual inspection of the CISDA weekly ice charts during August and September from 1984 to 1986 show MYI from the Queen Elizabeth Islands being flushed southward through Byam-Martin Channel (not shown). Together, FYI aging and gradual MYI import filled-up the southern regions with MYI and re-established the MYI tongue connecting the Beaufort Sea to the Western Parry Channel that disconnected in 1982 and 1983 ().
MYI recovery from 1999 to 2004 was different from the 1982 to 1986 period because it was the result of a combination of FYI aging as well as MYI import (). The weekly evolution of MYI conditions in the M’Clintock Channel also illustrates the combined recovery processes with MYI area increasing during the melt season (i.e. dynamic import) followed by further increases after October 1st (i.e. FYI aging) (). This combined MYI recovery process has been described in detail by Howell et al. (Citation2008) and Howell et al. (Citation2009) and more recent studies using tracked sea ice drift confirmed Arctic Ocean MYI import occurred at both the M’Clure Strait and Queen Elizabeth Islands (Howell et al., Citation2013; Howell & Brady, Citation2019). illustrates that MYI from both sources flowed southward together with locally grown MYI filling up the M’Clintock Channel and Franklin and re-establishing the MYI tongue connecting the Beaufort Sea to the Western Parry Channel. The increase in dynamic MYI recovery and reduced FYI aging during this period has been attributed to a longer melt season that provided greater opportunity for MYI import to occur from the Arctic Ocean and additional FYI melt (Howell et al., Citation2009).
b Recent changes in MYI recovery from 2007 to 2020
The period from 2007 to 2020 was marked by several light MYI years within the western CAA regions of the Northwest Passage (). Only within the Queen Elizabeth Islands was the frequency and magnitude of MYI recovery consistent during this period (; ). For regions south of the Queen Elizabeth Islands from 2007 to 2020, FYI aging decreased by approximately 50% for the Western Parry Channel and M’Clintock Channel and approximately 77% for the Franklin compared to 1968–2006 (). Moreover, the regions south of the Queen Elizabeth Islands exhibited minimal MYI recovery from 2007 to 2012 compared to the entire 1968–2020 period (). These regions were almost MYI-free during summer 2012 (). However, following 2012, recovery began to increase again for regions south of Queen Elizabeth Islands with only the Franklin region not returning to levels approaching those from the 2000s ().
1 Changes in MYI dynamic exchange
The first question that we address is whether the MYI drain-trap mechanism has continued to operate from 2007 to 2020. Although less frequent compared to previous years, the time series of MYI recovery components from 2007 to 2020 still indicates several years where these drain-trap regions have experienced dynamic MYI import (). The spatial distribution of MYI from 2007 to 2020 indicates that during the particularly light MYI period from 2007 to 2012 as well as 2015, MYI can be seen drifting southward out of the Queen Elizabeth Islands (). Both these observations provided evidence for the southward transport of MYI through the western CAA from 2007 to 2020. Moreover, looking at the weekly evolution of MYI conditions in the M’Clintock Channel from 2007 to 2020 indicates that MYI mobility started earlier in this period compared to previous years (). The MYI oscillations during the melt season provide additional evidence that MYI was transiting southward, albeit with muted variability between 2007 and 2020 compared to the period before 2007.
Overall, it is apparent that the MYI drain-trap mechanism has remained operational from 2007 to 2020 and continues to act as a major supply route for MYI in the southern regions of the CAA. So, if the drain-trap mechanism remains active, why has MYI dynamic recovery been muted since 2007 compared to 1999−2004? We suggest that it is because Arctic Ocean MYI has been primarily flowing into the CAA via the smaller apertures in Queen Elizabeth Islands and not from the Beaufort Sea via M’Clure Strait during the 2007–2020 period. Support for this process is provided by Howell and Brady (Citation2019) who used RADARSAT imagery and found a significant increase in the sea ice area flux from the Arctic Ocean into the Queen Elizabeth Islands, but no trend through M’Clure Strait from 1997 to 2018. Further support is provided by c which illustrates MYI concentration has increased in the Byam-Martin Channel region from 2007 to 2020 indicating more MYI is being flushed southward through the Queen Elizabeth Islands. MYI transport through the Queen Elizabeth Islands is intermittent because of the number of small channels and inlets, and the potential for ice arches or general ice congestion to impede MYI transport. Indeed, the Western Parry Channel receives MYI from the Queen Elizabeth Islands and the Beaufort Sea. However, while the region did experience net dynamic import from 2007 to 2010, 2016, and 2018, only 2016 was as high at 28% (). MYI recovery in the Western Parry Channel has been primarily caused by FYI aging () and the MYI tongue connecting the Beaufort Sea to the Western Parry Channel was only fully established in 2018 (). In summary, while the drain-trap mechanism remains active, it has reduced in efficiency from 2007 to 2020.
Historically, MYI transited very slowly through the CAA as a result of ice congestion and a shorter melt season (Howell et al., Citation2009). As a result, Melling (Citation2002) suggested that under a warmer climate Arctic Ocean MYI reaching the southern channels of the CAA (i.e. M’Clintock Channel and Franklin) could be thicker because of faster transit (i.e. less seasonal ablation and more open water to accommodate MYI from higher latitudes). The faster transit process is likely apparent since 2007 and also supported by the sea ice area flux estimates from Howell and Brady (Citation2019), meaning that MYI may now have relatively less time to thin before reaching the southern channels. However, the MYI is unlikely to be thicker as Haas and Howell (Citation2015) found no evidence of thicker ice in the M’Clintock Channel and Franklin regions compared to higher latitude regions of the Northwest Passage in May 2011 and April 2015 using airborne electromagnetic ice thickness surveys. In fact, Haas and Howell (Citation2015) identified that average thickness in the CAA decreases from north to south but still reported very thick ice throughout the western CAA regions of the Northwest Passage with the thickest in the Byam-Martin Channel region of the Queen Elizabeth Islands. Melling (Citation2022) recently reported ice thickness values within the Queen Elizabeth Islands in 2009 were similar to 1970s and provided evidence that the processes that facilitates the creation of thick MYI in the region have not stopped. Furthermore, c provides no evidence that MYI concertation north of the Queen Elizabeth Islands where thick MYI is created has decreased appreciably from 2007 to 2020.
2 FYI aging changes
Turning our attention to the FYI aging, we suggest that recent changes to several thermodynamic factors have impacted the ability of FYI to survive the summer melt season in our study regions from 2007 to 2020. Looking at the time series of APP-x surface skin temperature for all study regions indicates anomalies have been primarily positive for years from 2007 to 2020 (). All regions have also experienced a significant trend in skin temperature ranging from 0.83°C per decade in the Queen Elizabeth Islands to 1.39°C per decade in the Franklin region (). Zhang et al. (Citation2019) reported that annual average air temperature in northern Canadian Arctic has increased by 2.3°C over the period of 1948–2016 and relative to 1986−2005. There are statistically significant de-trended correlations between FYI aging and skin temperature in all regions (). Based on these anomalies, trends and correlations, we suggest that warmer temperatures have helped to reduce FYI aging in our study regions.
Fig. 9 Time series of the surface (a) skin temperature and (b) albedo anomalies during the shipping season in the western Canadian Arctic regions of the Northwest Passage from 1982 to 2020. The pink dashed line marks the cutoff between our focus periods in 1982–2006 and 2007–2020.
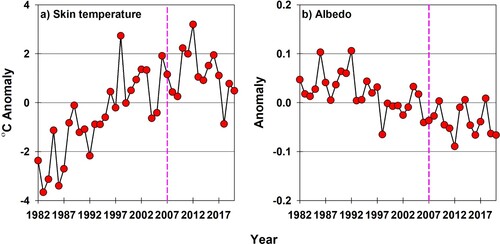
Table 5 Linear slope of shipping season average surface skin temperature and albedo over the period of 1982–2020 in the regions of the Northwest Passage. All trends are significant at the 95% confidence level.
Table 6 De-trended correlations between average shipping season surface skin temperature and FYI aging and between average June to October albedo and FYI aging over the period of 1982–2020 in the regions of the Northwest Passage. Correlations are significant at the 95% confidence level as in bold.
It is important to note, however, that although significant, the de-trended correlations between FYI aging and surface skin temperature are relatively low (approximately 0.4) and indicate other factors also contribute to recent reduced FYI aging. For instance, there are also decreasing trends in albedo for all regions that indicates a transition from MYI to FYI (). Since the albedo of FYI is lower than MYI, a transition from MYI to FYI has been shown to increase solar heat absorbed into the sea ice and enhance melt (Perovich et al., Citation2002; Perovich & Polashenski, Citation2012; Stroeve et al., Citation2014). Moreover, smooth landfast FYI forming in the CAA can support some of the highest surface melt pond coverages of sea ice in the Arctic (Landy et al., Citation2014) which would further facilitate an increase in solar heat absorption. Statistically significant de-trended correlations between FYI aging and albedo are indeed present in all our study regions ().
Another potential thermodynamic factor contributing to reductions in FYI aging is a longer melt season. The melt season length within the CAA has increased by 5.1 days per decade from 1979 to 2018 (Howell & Brady, Citation2019) and a longer melt season has been statistically linked to decreases in FYI aging (Howell et al., Citation2009). Finally, an indirect thermodynamic factor that could also contribute to the recent decreases in FYI aging is thinner FYI that would have more difficulty surviving the melt season. Howell et al. (Citation2016) demonstrated that landfast FYI thickness at several sites within the CAA has thinned by approximately 25 cm over the last 50+ years.
5 Conclusions
We summarized 52 years of MYI conditions within the western Canadian Arctic regions of the Northwest Passage, updating the previous analysis by Howell et al. (Citation2008) from 1968 to 2006 to include changes over the last 14 years (i.e. 1968–2020 in total). On average, the MYI area anomalies during the shipping season were approximately 33% lower from 2007 to 2020 relative to the 1991–2020 climatology. The frequency of negative anomalies from 2007 to 2020 was unprecedented over the 52-year record: 13 of the past 14 years were negative in the Beaufort Sea, Franklin, and the Western Arctic Waterway; 10 of the past 14 years were negative in Western Parry Channel and Queen Elizabeth Islands; and 9 of the past 14 years were negative in the M’Clintock Channel. The components of MYI recovery also declined over the period of 2007–2020 with FYI aging being reduced by approximately 47% and dynamic MYI exchange by approximately 21% when compared to 1968−2006.
Although the 2007–2020 period was marked by unprecedented negative MYI anomalies, the dynamic and thermodynamic processes of MYI recovery, which maintain the presence of MYI in these regions, continued to operate albeit at reduced magnitude. This result confirms the suggestion of Howell et al. (Citation2008) that the process of MYI recovery operating within the western CAA regions of the Northwest Passage can facilitate the continued presence of MYI under anthropogenic warming exemplified by anomalously low MYI conditions from 2007 to 2020. Moreover, the region north of the Queen Elizabeth Islands that serves a reservoir for MYI that flows southward into Northwest Passage has exhibited virtually no change since 2007. As the Arctic Ocean MYI continues to decline in thickness and as FYI aging continues to decrease within the CAA, MYI recovery within the Northwest Passage will also decline. However, until both these MYI recovery processes stop, MYI will remain a considerable hazard to the practical usage of the Northwest Passage as a shipping route. Overall, this study presents a reality check for studies that use climate models to propose regular ice-free shipping opportunities through the Northwest Passage in the near future.
Acknowledgements
The authors dedicate this paper to the late Dr. David Barber who was a pioneer of sea ice research in Canada. The authors would like to thank Damien Ringeisen and an anonymous reviewer who greatly improved the quality of this paper. J. L. acknowledges support from the Centre for Integrated Remote Sensing and Forecasting for Arctic Operations (CIRFA) project through the Research Council of Norway (RCN) under Grant #237906 and the project air-snow-ice-ocean INTERactions transforming Atlantic Arctic Climate (INTERAAC) through RCN Grant #328957. D.B. is supported by the Natural Sciences and Engineering Research Council of Canada (NSERC) and acknowledges support from both D. Barber and R. Galley.
Disclosure statement
No potential conflict of interest was reported by the author(s).
References
- Alt, B., Wilson, K., & Carrieres, T. (2006). A case study of old ice import and export through Peary and Sverdrup channels in the Canadian Arctic archipelago: 1998–2004. Annals of Glaciology, 44, 329–338. https://doi.org/10.3189/172756406781811321
- Babb, D. G., Galley, R. J., Barber, D. G., & Rysgaard, S. (2016). Physical processes contributing to an ice free Beaufort Sea during September 2012. Journal of Geophysical Research: Oceans, 121(1), 267–283. https://doi.org/10.1002/2015JC010756
- Babb, D. G., Landy, J. C., Barber, D. G., & Galley, R. J. (2019). Winter sea ice export from the Beaufort Sea as a preconditioning mechanism for enhanced summer melt: A case study of 2016. Journal of Geophysical Research: Oceans, 124(9), 6575–6600. https://doi.org/10.1029/2019JC015053
- Babb, D. G., Landy, J. C., Lukovich, J. V., Haas, C., Hendricks, S., Barber, D. G., & Galley, R. J. (2020). The 2017 reversal of the Beaufort Gyre: Can dynamic thickening of a seasonal ice cover during a reversal limit summer ice melt in the Beaufort Sea? Journal of Geophysical Research: Oceans, 125, e2020JC016796. https://doi.org/10.1029/2020JC016796
- Canadian Ice Service (CIS). (2007a). Regional charts: History, accuracy, and caveats, Can. Ice Serv. Archive Doc. Ser. 1, Gatineau, Que., Canada. http://ice.ec.gc.ca/IA_DOC/cisads_no_001_e.pdf
- Canadian Ice Service (CIS). (2007b). Regional charts: Canadian Ice Service Ice Regime Regions (CISIRR) and sub-regions with associated data quality indices, Can. Ice Serv. Archive Doc. Ser. 3, Gatineau, Que., Canada. http://ice.ec.gc.ca/IA_DOC/cisads_no_003_e.pdf
- Comiso, J. C. (2012). Large decadal decline of the Arctic multiyear ice cover. Journal of Climate, 25(4), 1176–1193. https://doi.org/10.1175/JCLID-11-00113.1
- Crawford, A., Stroeve, J., Smith, A., & Jahn, A. (2021). Arctic open-water periods are projected to lengthen dramatically by 2100. Communications Earth & Environment, 2(1), 109. https://doi.org/10.1038/s43247-021-00183-x
- Dawson, J., Pizzolato, L., Howell, S. E. L., Copland, L., & Johnston, M. E. (2018). Temporal and Spatial Patterns of Ship Traffic in the Canadian Arctic from 1990 to 2015 + Supplementary Appendix 1: Figs. S1–S7 (See Article Tools). Arctic, 71(1), 15. https://doi.org/10.14430/arctic4698
- Derksen, C., Burgess, D., Duguay, C., Howell, S., Mudryk, L., Smith, S., Thackeray, C., & Kirchmeier-Young, M. (2018). Changes in snow, ice, and permafrost across Canada: Chapter 5. In E. Bush, & D. S. Lemmen (Eds.), Canada's changing climate report (pp. 194–260). Government of Canada. https://changingclimate.ca/CCCR2019/chapter/5-0/
- Haas, C., & Howell, S. E. L. (2015). Ice thickness in the Northwest Passage. Geophysical Research Letters, 42(18), 7673–7680. https://doi.org/10.1002/2015GL065704
- Howell, S. E. L., & Brady, M. (2019). The dynamic response of sea ice to warming in the Canadian Arctic Archipelago. Geophysical Research Letters, 46(22), 13119–13125. https://doi.org/10.1029/2019GL085116
- Howell, S. E. L., Duguay, C. R., & Markus, T. (2009). Sea ice conditions and melt season duration variability within the Canadian Arctic archipelago: 1979–2008. Geophysical Research Letters, 36(10), L10502. https://doi.org/10.1029/2009GL037681
- Howell, S. E. L., Laliberté, F., Kwok, R., Derksen, C., & King, J. (2016). Landfast ice thickness in the Canadian Arctic archipelago from observations and models. The Cryosphere, 10, https://doi.org/10.5194/tc-10-1463-2016
- Howell, S. E. L., Tivy, A., Agnew, T., Markus, T., & Derksen, C. (2010). Extreme low sea ice years in the Canadian Arctic archipelago: 1998 versus 2007. Journal of Geophysical Research: Oceans, 115, C10053. https://doi.org/10.1029/2010JC006155
- Howell, S. E. L., Tivy, A., Yackel, J. J., & McCourt, S. (2008). Multi-year sea ice conditions in the Western Canadian Arctic archipelago section of the Northwest Passage: 1968-2006. Atmosphere-Ocean, 46(2), 229–242. https://doi.org/10.3137/ao.460203
- Howell, S. E. L., Wohlleben, T., Dabboor, M., Derksen, C., Komarov, A., & Pizzolato, L. (2013). Recent changes in the exchange of sea ice between the Arctic Ocean and the Canadian Arctic archipelago. Journal of Geophysical Research: Oceans, 118(7), 3595–3607. https://doi.org/10.1002/jgrc.20265
- Howell, S. E. L., Wohlleben, T., Komarov, A., Pizzolato, L., & Derksen, C. (2013). Recent extreme light sea ice years in the Canadian Arctic archipelago: 2011 and 2012 eclipse 1998 and 2007. The Cryosphere, 7(6), 1753–1768. https://doi.org/10.5194/tc-7-1753-2013
- Kacimi, S., & Kwok, R. (2022). Arctic snow depth, ice thickness, and volume from ICESat-2 and CryoSat-2: 2018–2021. Geophysical Research Letters, 49(5), e2021GL097448. https://doi.org/10.1029/2021GL097448
- Kwok, R. (2018). Arctic sea ice thickness, volume, and multiyear ice coverage: Losses and coupled variability (1958–2018). Environmental Research Letters, 13(10), 105005. https://doi.org/10.1088/1748-9326/aae3ec
- Laliberté, F., Howell, S. E. L., & Kushner, P. J. (2016). Regional variability of a projected sea ice-free Arctic during the summer months. Geophysical Research Letters, 43(1), 256–263. https://doi.org/10.1002/2015GL066855
- Landy, J., Ehn, J., Shields, M., & Barber, D. (2014). Surface and melt pond evolution on landfast first-year sea ice in the Canadian Arctic archipelago. Journal of Geophysical Research: Oceans, 119(5), 3054–3075. https://doi.org/10.1002/2013JC009617
- Ludwig, V., Spreen, G., Haas, C., Istomina, L., Kauker, F., & Murashkin, D. (2019). The 2018 North Greenland polynya observed by a newly introduced merged optical and passive microwave sea-ice concentration dataset. The Cryosphere, 13(7), 2051–2073. https://doi.org/10.5194/tc-13-2051-2019
- Meier, W. N., Hovelsrud, G., van Oort, B., Key, J., Kovacs, K., Michel, C., Granskog, M., Gerland, S., Perovich, D., Makshtas, A. P., & Reist, J. (2014). Arctic sea ice in transformation: A review of recent observed changes and impacts on biology and human activity. Reviews of Geophysics, 51(3), 185–217. https://doi.org/10.1002/2013RG000431
- Melia, N., Haines, K., & Hawkins, E. (2016). Sea ice decline and 21st century trans-Arctic shipping routes. Geophysical Research Letters, 43(18), 9720–9728. https://doi.org/10.1002/2016GL069315
- Melling, H. (2002). Sea ice of the northern Canadian Arctic archipelago. Journal of Geophysical Research: Oceans, 107(C11), 3181. https://doi.org/10.1029/2001JC001102
- Melling, H. (2022). Sea-ice thickness on the northern Canadian polar shelf: A second look after 40 years. The Cryosphere, 16, 3181–3197. https://doi.org/10.5194/tc-16-3181-2022
- Moore, G. W. K., Howell, S. E. L., & Brady, M. (2021). First observations of a transient polynya in the last Ice area north of Ellesmere Island. Geophysical Research Letters, 48, e2021GL095099. https://doi.org/10.1029/2021GL095099
- Moore, G. W. K., Schweiger, A., Zhang, J., & Steele, M. (2018). What caused the remarkable February 2018 North Greenland polynya? Geophysical Research Letters, 45, 13342–13350. https://doi.org/10.1029/2018GL080902
- Mudryk, L., Dawson, J. P., Howell, S. E. L., Derksen, C., Zagon, T., & Brady, M. (2021). Impact of 1°, 2°, and 4°C of global warming on ship navigation in the Canadian Arctic. Nature Climate Change, 11(8), 673–679. https://doi.org/10.1038/s41558-021-01087-6
- Notz, D. & SIMIP Community. (2020). Arctic sea ice in CMIP6. Geophysical Research Letters, 47(10), e2019GL086749. https://doi.org/10.1029/2019GL086749
- NSIDC. (2020). Arctic Sea Ice News and Analysis, September 2020. https://nsidc.org/arcticseaicenews/2020/09/
- Perovich, D. K., Grenfell, T. C., Light, B., & Hobbs, P. V. (2002). Seasonal evolution of the albedo of multiyear Arctic sea ice. Journal of Geophysical Research: Oceans, 107(C10), 8044. https://doi.org/10.1029/2000JC000438
- Perovich, D. K., & Polashenski, C. (2012). Albedo evolution of seasonal Arctic sea ice. Geophysical Research Letters, 39(8), L08501. https://doi.org/10.1029/2012GL051432
- Pizzolato, L., Howell, S. E. L., Dawson, J., Laliberté, F., & Copland, L. (2016). The influence of declining sea ice on shipping activity in the Canadian Arctic. Geophysical Research Letters, 43(23), 12146–12154. https://doi.org/10.1002/2016GL071489
- Smith, L. C., & Stephenson, S. R. (2013). New trans-Arctic shipping routes navigable by midcentury. Proceedings of the National Academy of Sciences of the United States of America, 110(13), E1191–E1195. https://doi.org/10.1073/pnas.1214212110
- Stroeve, J. C., Markus, T., Boisvert, L., Miller, J., & Barrett, A. (2014). Changes in Arctic melt season and implications for sea ice loss. Geophysical Research Letters, 41(4), 1216–1225. https://doi.org/10.1002/2013GL058951
- Tivy, A., Howell, S. E. L., Alt, B., McCourt, S., Chagnon, R., Crocker, G., Carrieres, T., & Yackel, J. J. (2011). Trends and variability in summer sea ice cover in the Canadian Arctic based on the Canadian ice service digital archive, 1960–2008 and 1968–2008. Journal of Geophysical Research, 116(C3), C03007. https://doi.org/10.1029/2009JC005855
- Tschudi, M. A., Meier, W. N., & Stewart, J. S. (2020). An enhancement to sea ice motion and age products at the National Snow and Ice Data Center (NSIDC). The Cryosphere, 14(5), 1519–1536. https://doi.org/10.5194/tc-14-1519-2020
- Wang, X., & Key, J. R. (2003). Recent trends in Arctic surface, cloud, and radiation properties from space. Science, 299(5613), 1725–1728. https://doi.org/10.1126/science.1078065
- Wang, X., & Key, J. R. (2005). Arctic surface, cloud, and radiation properties based on the AVHRR Polar Pathfinder dataset. Part I: Spatial and temporal characteristics. Journal of Climate, 18(14), 2575–2593. https://doi.org/10.1175/JCLI3439.1
- Wei, T., Yan, Q., Qi, W., Ding, W., & Wang, C. (2020). Projections of Arctic sea ice conditions and shipping routes in the twenty-first century using CMIP6 forcing scenarios. Environmental Research Letters, 15(10), 104079. https://doi.org/10.1088/1748-9326/abb2c8
- Zhang, X., Flato, G., Kirchmeier-Young, M., Vincent, L., Wan, H., Wang, X., Rong, R., Fyfe, J., Li., G., & Kharin, V. V. (2019). Changes in temperature and precipitation across Canada; chapter 4. In E. Bush, & D. S. Lemmen (Eds.), Canada's changing climate report (pp. 112–193). Government of Canada. https://changingclimate.ca/CCCR2019/chapter/4-0/