Abstract
A detached leaf assay was developed to assess disease response of Lupinus albus to phomopsis leaf blight caused by Diaporthe toxica. A spore concentration of 1 × 10⁷ spores mL−1 using spray inoculation gave the greatest discrimination between genotypes. The effect of leaf position was studied using the first five fully expanded leaves above the cotyledons. Leaf position did not alter the disease response for genotypes with a resistant reaction, but older leaves were more susceptible in less-resistant genotypes. There was good agreement between disease response using detached leaves and leaves inoculated in planta, indicating the utility of the detached leaf assay. In this study, 110 Lupinus albus cultivars were evaluated for resistance to phomopsis leaf blight caused by Diaporthe toxica in two detached leaf experiments. In one experiment, 95 genotypes were assessed for phomopsis leaf blight resistance and phomopsis stem blight resistance after the leaves used in this study were removed. There was no correlation between the stem scores and the leaf scores, indicating that a detached leaf assay cannot be used to predict the reaction of L. albus to phomopsis stem blight. Genetic resistance to phomopsis stem and leaf blight may be under independent genetic control. Sixteen genotypes were identified as having useful resistance to phomopsis leaf blight. Relying on a detached leaf assay to detect overall disease resistance in L. albus may lead to some false positives (apparent resistance) but the assay was generally capable of detecting susceptible genotypes.
Résumé
Un essai de feuilles détachées a été développé pour évaluer la réponse de la maladie Lupinus albus à la brûlure des feuilles causée par phomopsis Diaporthe toxica. Une concentration de spores de 1 × 10⁷ spores par mL en utilisant inoculation par pulvérisation a donné la plus grande discrimination entre les génotypes. L'effet de la position de la feuille a été étudiée en utilisant les cinq premières feuilles entièrement étendues au-dessus des cotylédons, et position de la feuille ne modifie pas la réponse à la maladie pour les génotypes présentant une réaction résistante, mais les feuilles plus âgées étaient plus susceptibles en moins génotypes résistants. Il y avait une bonne concordance entre la réponse la maladie en utilisant des feuilles détachées et les feuilles inoculées in planta indiquant l'utilité de l'analyse des feuilles détachées. Dans cette étude 110 Lupinus albus cultivars ont été évalués pour la résistance à la brûlure de la feuille causée par phomopsis Diaporthe toxica dans deux expériences de feuilles détachées. Dans une expérience, 95 génotypes ont été évalués pour résistance à la brûlure des feuilles et phomopsis résistance à la brûlure phomopsis tige après que les feuilles utilisées dans cette étude ont été retirés. Il n'y avait pas de corrélation entre les scores souches et les scores des feuilles indiquant qu'un test sur feuilles détachées ne peut pas être utilisée pour prédire la réaction de L. albus à la brûlure tige phomopsis. La résistance génétique à la tige de phomopsis et brûlure de la feuille peut être sous contrôle génétique indépendante. Seize génotypes ont été identifiés comme ayant une résistance utile de brûlure de la feuille phomopsis. S'appuyant sur une analyse des feuilles détachées pour détecter la résistance globale de la maladie chez L. albus peut conduire à des faux positifs (résistance apparente), mais l'essai a été généralement capables de détecter des génotypes sensibles.
Introduction
Lupinus albus L. is an important legume crop in higher-rainfall regions in New South Wales, Australia, with a production forecast of ∼ 51 KT in 2011, but production has reached 100 KT in previous years (www.pulseaus.com.au, accessed 1 Aug 2011). Lupinus albus is primarily used as stock feed for sheep and cattle (May et al., Citation1993; Hill, Citation2006) and has potential as an inclusion into human diets (Lee et al., Citation2006).
This study was prompted by an outbreak of phomopsis blight caused by Diaporthe toxica Williamson, Highet, Gams & Sivasith. in southern NSW in 2004 which resulted in the death of some sheep (Cowley et al., Citation2010). Previously, D. toxica was regarded as only a minor pathogen of L. albus in Australia and received minimal breeding effort, although it is a common pathogen of L. angustifolius L. (Cowling & Wood, Citation1989; Shankar et al., Citation1996). A virulent isolate of D. toxica capable of invading all plant parts of L. albus was collected from the 2004 outbreak and has been used to identify lines with genetic resistance in stems (Cowley et al., Citation2012) and pods (Cowley et al., Citation2011).
In the field, foliar lesions caused by D. toxica infection are rarely observed in L. albus since leaf decay and premature leaf senescence can easily be attributed to other causes. In L. angustifolius, premature leaf senescence caused by phomopsis leaf blight and pycnidia formation under field conditions have been reported (Brown, Citation1984), and have been implicated in the within-crop spread of D. toxica. Genotypic differences in L. albus to phomopsis leaf blight have been reported in glasshouse screening, with a significant correlation (r = 0.74, P < 0.001) between phomopsis stem blight and phomopsis leaf blight, suggesting that a leaf test may provide a surrogate assay to predict resistance to stem infection (Cowley et al., Citation2010). The advantages of a detached leaf assay are that it would not be fatal to the plants and could be repeated on the same plants after suitable regrowth, if required.
Detached leaf assays have been used to study numerous host–pathogen interactions (Warkentin et al., Citation1995; Olmstead et al., Citation2000; Herath et al., Citation2001; Baranski et al., Citation2006; Bradley et al., Citation2006). The main attraction of a detached leaf screening assay is the ability to minimize or remove environmental or field-based sources of variation in the dependent variables measured. To be of value in plant selection for resistance, the level of disease detected using a detached leaf assay needs to be equivalent, or correlated, to that observed on whole plants. Consequently, most researchers have aimed at determining the correlation between detached leaf assays and glasshouse or field disease screening assays (Warkentin et al., Citation1995; Foolad et al., Citation2000; Brennan et al., Citation2005; Twizeyimana et al., Citation2007). Such investigations are examples of two-phase experiments that belong to the bigger class of multi-phase experiments (Smith et al., Citation2006; Butler et al., Citation2009 b; Cowley et al., Citation2011). The first phase of a multi-phase experiment is to grow plants either in a field or in a more controlled environment. The second phase is the assay used to score disease incidence or other aspects of disease development in the laboratory or other controlled environment. Multi-phase experiments using detached plant parts offer pathologists, geneticists and breeders an opportunity to assess genotypic disease reaction without compromising seed production, since the original plants from which tissues (leaves, pods, etc.) are removed and are not exposed to the pathogen. However, due consideration needs to be given to the design and analysis of multi-phase experiments in plant pathology to ensure that non-genetic sources of variation are accounted for and evaluation of true genetic effects are optimized (Cowley et al., Citation2011).
The specific aims of this study were to establish a detached leaf screening assay that can be used to identify L. albus lines resistant to phomopsis leaf blight, and to determine if a leaf assay can be used to predict the phomopsis stem blight response.
Materials and methods
Experimental design
In each experiment, the spatial arrangement of lupin genotypes in both phases, where applicable, was optimized using DiGGer design software (available from http://www.austatgen.org/files/software/downloads). All experiments were analyzed using ASReml (Butler et al., Citation2009 a) in R (R Development Core Team, Citation2010) using the method described in Cowley et al. (Citation2011).
Inoculum preparation
A single spore isolate of D. toxica, DAR80114 (Living Culture Collection at NSW Department of Primary Industries, Orange, NSW, Australia) (2010), was used in all experiments in this study. Inoculum was prepared by culturing on oatmeal agar as described in Cowley et al. (Citation2010). The spore concentration was calculated using a haemocytometer and adjusted to the required concentration for the experiment being conducted. Spore suspensions were either stored at 4 °C and used on the same day they were prepared, or were frozen at −18 °C and thawed as required.
Development of detached leaf screening assay
In the first experiment, six concentrations of D. toxica spore suspension and a water-only control were used; control (water only), 1×10², 1×10³, 1×10⁴, 1×10⁵, 1×10⁶ and 1×10⁷ spores mL−1. The spore suspensions were used on the same day they were prepared.
Seven L. albus genotypes – ‘Kiev-Mutant’, ‘Luxor’, ‘Neuland’, ‘Rosetta’, ‘Start’, ‘Ultra’ and a breeding line WK264 – were used based on their differential response to phomopsis leaf blight in a previous experiment (Cowley et al., Citation2010). They were sown in single 2 m rows in a screen-house at Wagga Wagga, NSW (35°03′07″S; 147°21′06″E) in a chromic luvisol field soil (FAO–UNESCO, Citation1974) of pH 5.3. At 16 weeks after sowing, 21 most recently fully expanded leaves below an inflorescence were sampled for each genotype. The leaves were usually taken from the main stem but occasionally from the first-order branches. Lupins have palmate leaves and each leaf comprises 5–7 leaflets. The detached leaves were placed in plastic bags and transported on ice to the laboratory. The leaves were carefully arranged on paper towels (which had been wrapped in foil and sterilized in an autoclave) in a laminar flow cabinet, and the upper leaf surface was sprayed to run-off using an atomizer with one of the D. toxica spore suspensions. Three leaves of each genotype were placed in order on the paper towel and all were inoculated at the same time. The water control was completed first, followed by 1 × 10², then 1 × 10³, and so on. The final concentration used was 1 × 10⁷ spores mL−1. The laminar flow was swabbed with 70% ethanol between treatments. After inoculation, each leaf was then placed on water agar (10 g technical agar, Difco) amended with 10 mg kinetin and 0.1 g aueromycin L−1 in an individual 9 cm-diameter Petri dish with the lid on but left unsealed to aid scoring. The cut end of the petiole was pressed into the agar medium and the leaflets evenly spread and separated across the dish. The addition of the hormone kinetin helped to delay leaf senescence to avoid confounding natural senescence with symptoms caused by the pathogen (Twizeyimana et al., Citation2007). This protocol was followed for all subsequent detached leaf assays that were inoculated by spraying a spore suspension.
Petri dishes were arranged on culture room shelving in a randomized complete block with a 30 × 5 × 3 three-dimensional array (range × row × shelf). Three replicate leaves of each genotype × concentration combination were used, with only one representative of each combination on a single culture room shelf. The culture room was maintained at 20 °C with 12-h light per day supplied using a combination of cool and warm white fluorescent lights. This temperature and light regime was used for all subsequent detached leaf assays.
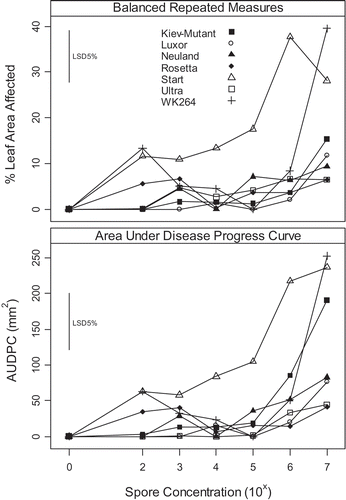
Each leaflet was scored as percentage leaf area affected at 3, 5 and 7 days after inoculation. The area under the disease progress curve (AUDPC) was calculated using the audpc function in the package ‘agricolae’ in R (De Mendiburu, Citation2009). In addition, a balanced repeated measures analysis was performed using ASReml-R. Fitting a balanced repeated measures to this data allowed for the multivariate data (scoring times) to account for all possible sources of error, as it follows that the score on day 5 is not independent from the score at day 3, and so on. ASReml-R can accommodate this experimental structure in the analysis (Butler et al., Citation2009 a). Variance components from both analyses are presented in .
Table 1. Summary of REML estimates for the random effects (also expressed as a percentage of total variance) of the AUDPC and balanced repeated measures analysis for Experiment 1
A second experiment was conducted to determine the effect of leaf position on the disease response using detached leaves. Five L. albus parental lines of existing mapping populations – ‘Kiev-Mutant’, P27174, P27593, P28096 and ‘Rosetta’ – were sown in sandy-loam in 30 cm pots on 28 February 2008 in an evaporative-cooled glasshouse at Wagga Wagga in a 2-replicate randomized experiment. The effect of leaf age and position on the stem was compared in this experiment by sampling the first five leaves above the cotyledons when the fifth leaf was fully expanded. Each plant sampled was removed from the pot and placed into individually labelled bags and transported on ice to the laboratory. The leaves were removed in order with leaf one being the first true leaf.
The leaves were placed on water agar in the same manner described above. Inoculum was prepared as above and the concentration of the spore suspension adjusted to 1×10⁷ spores mL−1. In this experiment, two droplet-size treatments were used (5 μL and 10 μL) with all the leaves collected from an individual plant assigned to one droplet size. Addition of Tween 20 (0.02%, vol/vol) was required to form a stable droplet on the leaf surface (Jia et al., Citation2003). Lesion development was measured (diameter in mm) at 36, 72 and 108 h after inoculation. The lesion measurements were converted to area (mm2) and analyzed using balanced repeated measures only (see Results, ). The variance components outputs for this experiment are shown in . Genotype, droplet size, leaf position on the plant, and their interactions were fitted as fixed effects.
Table 2. Summary of REML estimates for the random effects (also expressed as a percentage of total variance) for the balanced repeated measures analysis used to assess disease reaction to Diaporthe toxica when applied as droplets to leaflets of Lupinus albus in a detached leaf assay (Experiment 2)
The third experiment was conducted to determine if foliar lesions could be elicited in planta to validate the suitability of data collected from a detached leaf assay. Seedlings of the same genotypes used in the previous experiment were sown into sand in standard nursery propagation trays with clear plastic vented lids (tray dimensions of 30 × 35 × 5 cm, the lid is 15 cm high). Seeds were spaced with the aid of a peg board to ensure even spacing and sowing depth. Six replicates were sown, with each replicate consisting of 5 plants. Sixteen days after sowing, each leaflet on the first two leaves was inoculated by placing a 5 μL droplet of D. toxica spore suspension (adjusted to 1×10⁷ spores mL−1 and Tween 20 added as described above) in the centre of each leaflet. A clear plastic lid was placed over the trays after inoculation with the vent closed, and the dew period was maintained for 72 h. The disease progression was slower than occurs in the detached leaf assays in the laboratory. Consequently, the experiment was scored for the presence or absence of disease symptoms 35 days after inoculation, but prior to any leaf senescence. The frequency of infected leaflets per leaf was counted and analyzed.
Detached leaf screening experiment
A screening experiment was performed that contained 95 L. albus genotypes (Cowley et al., Citation2012) sown on 20 October 2008 in 175 mm pots in sandy-loam in an evaporative-cooled glasshouse at Wagga Wagga. These genotypes were the same set used to assess genetic diversity in L. albus landraces and breeding lines (Raman et al., Citation2008). The pots were arranged in a two-replicate randomized complete block design. Five genotypes, ‘Kiev-Mutant’, P27174, P27593, P28096 and ‘Rosetta’, were sown into two pots within each replicate.
Leaves were collected from the plants 35 days after sowing, transported to the laboratory and inoculated in the manner described above. The Petri dishes were arranged in a culture room in an 18 × 6 × 6 three-dimensional array (range × row × shelf) in a randomized incomplete block. A total of 648 leaves were assessed in this experiment, with up to seven leaflets scored on each leaf. Leaves were assessed for disease symptoms using a visual assessment of percentage leaf area affected. The same donor plants were later sprayed with a spore suspension of D. toxica and examined for phomopsis stem blight. Lesion length on stems was measured (mm) 28 days after inoculation and square-root transformed for analysis, as described in Cowley et al. (Citation2012).
Results
Comparison between AUDPC analysis and balanced repeated measures analysis
The effect of genotype, spore concentration and their interaction were significant (P < 0.001) for both the AUDPC and the balanced repeated measures analysis in experiment 1. The predicted values for both analyses were similar and highly correlated (r = 0.97, P < 0.001, see ). However, the analysis using AUDPC resulted in a large residual error, primarily because non-genetic sources of error had not been well-accounted for in the analysis (94.08% of total error variance, ). In contrast, the residual error for the balanced repeated measures analysis was 0.10% of total error variance (). Accounting for all non-genetic sources of variation is important to improve the accuracy of phenotyping (Smith et al., Citation2006; Butler et al., Citation2009 b); consequently, the balanced repeated measures analysis was used for subsequent experiments where appropriate.
Fig. 1. Effect of spore concentration of phomopsis leaf blight symptoms (caused by Diaporthe toxica) on detached leaves of Lupinus albus expressed as increase from the control. Comparison between two analyses: either balance repeated measures or calculated area under disease progress curve ().
Effect of spore concentration on phomopsis leaf blight using a detached leaf assay
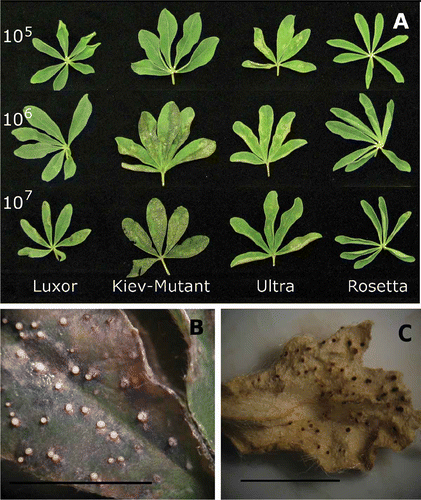
As spore concentration increased, the level of disease symptoms increased in most genotypes. The rate of increase varied with genotype (). Lupinus albus cultivars ‘Rosetta’, ‘Ultra’ and ‘Luxor’ had the lowest levels of disease at a spore concentration of 107 spores mL−1 (). The breeding line WK264 and ‘Neuland’ had the highest level of disease symptoms overall. In the detached leaf assay, a spore concentration of 1 × 10⁶ to 1 × 10⁷ spores mL−1 gave the greatest discrimination between genotypes () and the ranking of genotypes for disease response was similar to previous glasshouse screening experiments (Cowley et al., Citation2010).
Fig. 2. (A) Effect of spore concentration on expression of phomopsis leaf blight in Lupinus albus using a detached leaf assay. (B) ‘Kiev-Mutant’ sprayed with spore concentration 1 × 10⁷ Diaporthe toxica spores ml−1 7 days after inoculation showing actively sporulating pycnidia. (C) Pycnidia formation on a dried leaflet in a glasshouse screening experiment, data reported elsewhere (Cowley et al., Citation2010). Bars approximately equal 10 mm.
Effect of leaf age on the expression of resistance on phomopsis leaf blight using a detached leaf assay
The effect of genotype and leaf position was significant (P < 0.001). The volume of the droplet applied, and all interactions involving volume, were not significant. The glasshouse random components (Phase 1) accounted for 4.66% of total variance and the laboratory component (Phase 2) accounted for only 1.04%. The balanced repeated measures components accounted for 73.35% of total variance and the residual error was 20.94% ().
Leaf position for ‘Kiev-Mutant’, P27174 and P27593 was significant (P < 0.001) when 5 μL droplets were applied; however, leaf position had little effect on disease response of P28096 and ‘Rosetta’ (). Leaves 1 and 2 (the oldest leaves from each plant) were significantly more susceptible in P27174 and P27593 than leaves 3 to 5; however, their lesion size was smaller than ‘Kiev-Mutant’ ().
Fig. 3. Effect of leaf position and volume of spore suspension (at 1 × 10⁷ Diaporthe toxica spores ml−1) applied to detached leaves of Lupinus albus in Experiment 2. Leaf 1 was the first true leaf and the next leaves (up to five) were taken in successive order up the stem from the cotyledons.
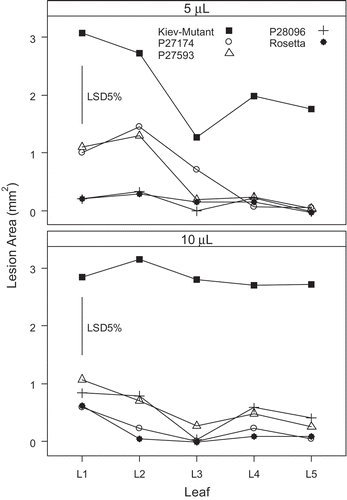
When 10 μL droplets were applied, ‘Kiev-Mutant’ had the largest lesion size in this experiment and leaf position had no effect. ‘Kiev-Mutant’ had a susceptible response and all other lines had a resistant response.
Effect of phomopsis leaf blight on attached seedlings leaves
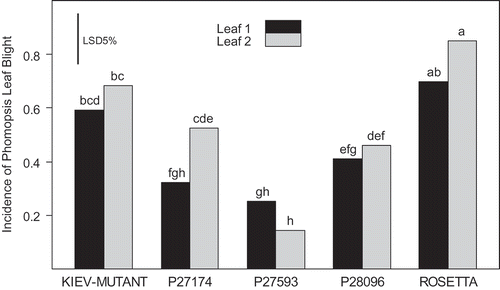
Genotype differences were significant (P < 0.001), while the effect of leaf and their interaction were not significant. ‘Rosetta’ and ‘Kiev-Mutant’ had the highest incidence of lesion formation on the leaves (0.69 and 0.85 for leaves 1 and 2 for ‘Rosetta’; 0.59 and 0.68 for leaves 1 and 2 for ‘Kiev-Mutant’; ). P27593 had the lowest incidence of lesion formation (0.25 and 0.14 for leaves 1 and 2, respectively). P27174 was the only genotype to record a significant difference between leaf 1 and leaf 2 ().
Fig. 4. Development of foliar lesions after inoculating Lupinus albus seedling leaves with 5 μL of a 1 × 10⁷ spore suspension of Diaporthe toxica. Bars with the same letters are not significantly different (P < 0.05).
Screening for resistance to phomopsis leaf blight
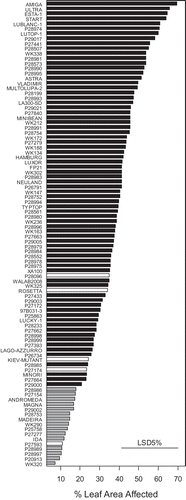
In the screening experiment, genotype effects were significant (P < 0.001). P27593 was resistant to phomopsis leaf blight in this experiment (predicted mean 10.95, ). P28096, ‘Rosetta’, ‘Kiev-Mutant’ and P27174 were not significantly different from one another (predicted means 34.95, 34.14, 24.26 and 23.24. respectively). The most resistant genotypes to phomopsis leaf blight were WK320, P20913, P28997, P28989 and ‘Ida’ (predicted means 7.14, 9.40, 10.42, 10.59 and 11.91, respectively). Sixteen genotypes were identified as having resistance to phomopsis leaf blight (shown in grey in ). We have previously reported other L. albus genotypes resistant to phomopsis leaf blight (Cowley et al., Citation2011).
Fig. 5. Predicted means using a detached leaf assay for a diverse selection of Lupinus albus genotypes screened for resistance to phomopsis leaf blight caused by Diaporthe toxica in a screening experiment. Genotypes with white bars are the five parents of existing mapping populations used in Experiments 2 and 3. The grey bars highlight genotypes considered resistant.
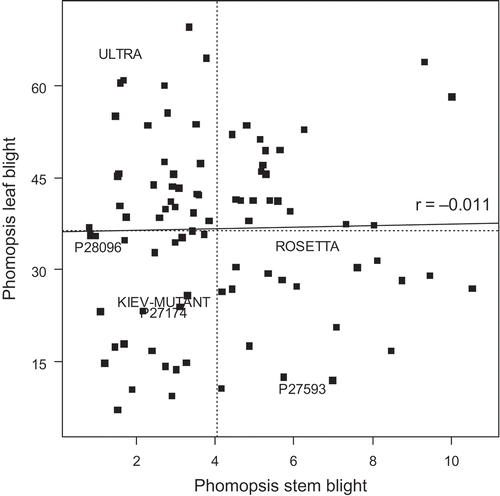
Relationship between phomopsis leaf and stem blight
The effect of genotype was significant for the phomopsis stem blight lesion length (P < 0.001). There was no correlation between the detached leaf data and the stem data (). The breeding line WK320 and landraces P28997 and P20913 were the most resistant genotypes to both phomopsis leaf and stem blight. ‘Start’ and P29017 were susceptible in both leaves and stems. Numerous genotypes were partially resistant to either leaf blight or stem blight but not both (). In this experiment, the control genotypes ‘Rosetta’ and P27593 were moderately susceptible in stems (predicted square-root transformed means 6.35 and 6.20, respectively). The control genotypes P28096, P27174 and ‘Kiev-Mutant’ were resistant to phomopsis stem blight (predicted square-root transformed means 1.01, 2.68 and 2.68, respectively). The L. albus cultivar ‘Ultra’ has been reported as resistant to phomopsis stem blight (Wood & Allen, Citation1980) and was resistant to phomopsis stem blight here (predicted square-root transformed mean 1.60); however, it was not resistant to phomopsis leaf blight in this study (predicted mean 65.60, ).
Fig. 6. Correlation between phomopsis leaf blight of Lupinus albus using a detached leaf assay (% leaf area affected) and phomopsis stem blight (square-root of lesion length). The same plants were used in both assessments. The horizontal and vertical dotted lines indicate the mean values for phomopsis leaf blight and phomopsis stem blight respectively. The solid line is the correlation line between the two measures. Genotype names (where used) are centred on the data position.
Discussion
The objective of this research was to determine if genetic resistance to phomopsis leaf blight could be detected in L. albus using a detached leaf assay. The optimal spore concentration for such an assay was found to be 1 × 10⁷ spores mL−1. This is comparable with optimal spore concentration for glasshouse screening of phomopsis stem blight on L. angustifolius (Williamson & Sivasithamparam, Citation1994; Shankar et al., Citation1996). In this study, leaf position did not alter the disease response for genotypes with a resistant reaction, especially when a 10 μL droplet of spore suspension was used. For the genotypes ‘Kiev-Mutant’, P27174 and P27593 inoculated with a 5 μL droplet, leaves 4 and 5 (youngest leaves tested) were more resistant than the older leaves 1 and 2. Similar variation in leaf response to a detached leaf assay have been reported when assessing fusarium head blight in wheat, where Browne et al. (Citation2006) found that detached leaf 3 (youngest leaf) was more resistant than leaves 1 and 2 when a range of incubation regimes were tested. In contrast, Dolar et al. (Citation1994) found that older chickpea leaves (leaves 1 and 2) were more resistant than younger leaves to ascochyta blight.
Placing droplets of spore suspensions to inoculate detached leaves with a pathogen has been used in numerous studies (Dorrance & Inglis, Citation1997; Foolad et al., Citation2000; Browne et al., Citation2006; Hwang et al., Citation2006). Similarly, spray inoculation on detached leaves, usually to runoff, is widely reported (Dolar et al., Citation1994; Carisse & Peyrachon, Citation1999; Brennan et al., Citation2005; Twizeyimana et al., Citation2007). In this study, both techniques were suitable for ensuring good disease expression. Droplet inoculation enables greater control over the number of spores applied and allows the progression of the resultant lesion growth to be measured accurately. Spray inoculation, in contrast, is easier to apply and still provides adequate data if the aim of the screening is to identify resistant lines, or cull susceptible lines.
When phomopsis leaf blight was assessed in planta, ‘Rosetta’ had the highest incidence of foliar lesions. This was in contrast to the previous methodology experiments reported here, where ‘Rosetta’ was one of the better performing genotypes. The remaining genotypes tested performed as expected. Dorrance & Inglis (Citation1997) caution that in detached leaf assays, false negatives (that is an apparent resistance response) can sometimes be due to inoculation failure. Relying on a detached leaf assay may lead to some false negatives (apparent resistance) but generally, this approach is capable of detecting susceptible genotypes (for example ‘Kiev-Mutant’ in this study). In a breeding programme, testing in an early generation may be adequate to remove the most susceptible material. Further testing in a later generation, prior to release, would most likely eliminate any ‘escapes’.
The detached leaf assay was able to identify L. albus genotypes resistant to phomopsis leaf blight. In this study, P27593 was consistently among the most resistant genotypes, although it is not resistant to phomopsis stem blight. P27593 is a landrace from the Azores that is also resistant to pleiochaeta root rot (Luckett et al., Citation2009). P25758, also resistant to pleiochaeta root rot (Luckett et al., Citation2009), was found to have resistance to both phomopsis leaf and stem blight (Cowley et al., Citation2012). Breeding line WK320 and landraces P28997 and P20913 are the most suitable lines for inclusion as resistant parents in breeding programmes as they have the highest resistance to both phomopsis leaf and stem blight.
The relationship between genetic resistance to phomopsis leaf blight and phomopsis stem or pod blight is unresolved, although it would appear from our work that they are under independent control. Previous data suggest that stem infection is not dependent on leaf infection, and D. toxica spores are capable of germinating directly on stem tissue resulting in stem lesions (Cowley et al., Citation2012). Using a principal component analysis in a glasshouse disease screening experiment, Cowley et al. (Citation2010) suggested that phomopsis leaf blight and phomopsis stem blight responses were similar, whereas phomopsis pod blight response was dissimilar. In contrast, Cowling & Wood (Citation1989) found positive correlations between phomopsis stem and pod blight in L. angustifolius. The data reported here indicate that a detached leaf assay is not useful for predicting resistance to phomopsis stem blight.
In previously reported experiments (Cowley et al., Citation2011), we have shown that ‘Kiev-Mutant’ and ‘Rosetta’ had similar levels of disease using a detached leaf assay; however, ‘Kiev-Mutant’ developed a higher number of sporulating pycnidia on infected leaf tissues. The capacity to restrict pycnidia production on infected leaves may be important in limiting the within-crop spread of the disease and does not appear to be related to the severity of disease symptoms on the leaves. The exact role of leaf infection in the epidemiology of the pathogen has not been determined. With phomopsis leaf blight in L. angustifolius, Wood & Hamblin (Citation1981) suggested that leaf infection is a possible means of secondary spread within crops, but this was not detected in the field trials examined. In subsequent research, leaf lesions were noted on L. angustifolius leaves in field trials and were implicated in within-crop spread of the pathogen (Brown, Citation1984). Wood & Sivasithamparam (Citation1989) concluded, however, that the role of leaf infection in spreading the pathogen is of little importance, although no data were presented to support this statement. Further research is needed to understand the epidemiology and within-crop spread of the pathogen D. toxica in L. albus. It may be similar to that described for L. angustifolius (Wood, Citation1986).
Acknowledgements
Mark Richards, David Roberts and Cina Zacharia are thanked for technical assistance. This research has been funded by growers through the Grains Research and Development Corporation (GRDC).
References
- Baranski , R. , Kramer , R. and Klocke , E. 2006 . A laboratory leaf assay of carrot susceptibility to Botrytis cinerea . J. Phytopathol , 154 : 637 – 640 .
- Bradley , C.A. , Henson , R.A. , Porter , P.M. , LeGare , D.G. , del Rio , L.E. and Khot , S.D. 2006 . Response of canola cultivars to Sclerotinia sclerotiorum in controlled and field environments . Plant Dis , 90 : 215 – 219 .
- Brennan , J.M. , Leonard , G. , Cooke , B.M. and Doohan , F.M. 2005 . Analysis of head and leaf reaction towards Microdochium nivale . Eur. J. Plant Pathol , 112 : 79 – 83 .
- Brown , A. 1984 . Within crop spread of Phomopsis leptostromiformis on lupins . Australas. Plant Path , 13 : 11 – 12 .
- Browne , R.A. , Bequain , C. and Mascher , F. 2006 . Components of partial disease resistance detected using a detached leaf assay in CIMMYT Fusarium head blight resistant wheat germplasm . Eur. J. Plant Pathol , 116 : 199 – 210 .
- Butler , D.G. , Cullis , B.R. , Gilmour , A.R. and Gogle , B.J. 2009a . ASReml-R Reference Manual, Release 3 , Technical report. Queensland Department of Primary Industries .
- Butler , D.G. , Tan , M.K. and Cullis , B.R. 2009b . Improving the accuracy of selection for late maturity alpha-amylase in wheat using multi-phase designs . Crop Pasture Sci , 60 : 1202 – 1208 .
- Carisse , O. and Peyrachon , B. 1999 . Influence of temperature, cultivar, and time on sporulation of Mycosphaerella fragariae on detached strawberry leaves . Can. J. Plant Pathol , 21 : 276 – 283 .
- Cowley , R.B. , Ash , G. , Harper , J.D.I. and Luckett , D.J. 2010 . Evidence that Diaporthe toxica infection of Lupinus albus is an emerging concern for the Australian lupin industry . Australas. Plant Pathol , 39 : 146 – 153 .
- Cowley , R.B. , Ash , G.J. , Harper , J.D.I. and Luckett , D.J. 2012 . Evaluation of resistance to Phomopsis stem blight (caused by Diaporthe toxica) in Lupinus albus . Eur. J. Plant Pathol , 133 : 631 – 644 .
- Cowley , R.B. , Ash , G.J. , Harper , J.D.I. , Smith , A.B. , Cullis , B.R. and Luckett , D.J. 2011 . Application of multi-phase experiments in plant pathology to identify genetic resistance to Diaporthe toxica in Lupinus albus . Euphytica , Published online 14 September. DOI: 10.1007/s10681-10011-10529–10684
- Cowling , W.A. and Wood , P.M. 1989 . Resistance to Phomopsis stem and pod blight of narrow-leafed lupin in a range of environments and its association with reduced Phomopsis seed infection . Aust. J. Exp. Agric , 29 : 43 – 50 .
- De Mendiburu , F. 2009 . A Statistical Analysis Tool for Agricultural Research , Lima-Peru : Masters Thesis, Systems Engineering, Universidad Nacional de Ingenieria .
- Dolar , F.S. , Tenuta , A. and Higgins , V.J. 1994 . Detached leaf assay for screening chickpea for resistance to ascochyta blight . Can. J. Plant Pathol , 16 : 215 – 220 .
- Dorrance , A.E. and Inglis , D.A. 1997 . Assessment of greenhouse and laboratory screening methods for evaluating potato foliage for resistance to late blight . Plant Dis , 81 : 1206 – 1213 .
- FAO–Unesco . 1974 . Soil Map of the World , Vol. 1 , 59 Paris : UNESCO . Legend
- Foolad , M.R. , Ntahimpera , N. , Christ , B.J. and Lin , G.Y. 2000 . Comparison of field, greenhouse, and detached-leaflet evaluations of tomato germplasm for early blight resistance . Plant Dis , 84 : 967 – 972 .
- Herath , I.H.M.H.B. , Stoddard , F.L. and Marshall , D.R. 2001 . Evaluating faba beans for rust resistance using detached leaves . Euphytica , 117 : 47 – 57 .
- Hill , G.D. The utilization of lupins in animal nutrition . Proceedings of the 11th International Lupin Conference: Mexico, where Old and New World Lupins Meet . May 4–9 2005 , Mexico . Edited by: Santen , E.v. and Hill , G.D. pp. 288 – 305 . Canterbury , , New Zealand : International Lupin Association .
- Hwang , S.F. , Zhang , R. , Chang , K.F. , Gossen , B.D. , Turnbull , G.D. and Bing , D.J. 2006 . Comparison of three methods for assessing disease reaction to Mycosphaerella pinodes in field pea (Pisum sativum) . J. Plant Dis. Protect , 113 : 20 – 23 .
- Jia , Y. , Valent , B. and Lee , F.N. 2003 . Determination of host responses to Magnaporthe grisea on detached rice leaves using a spot inoculation method . Plant Dis , 87 : 129 – 133 .
- Lee , Y.P. , Mori , T.A. , Sipsas , S. , Barden , A. , Puddey , I.B. , Burke , V. , Hall , R.S. and Hodgson , J.M. 2006 . Lupin-enriched bread increases satiety and reduces energy intake acutely . Am. J. Clin. Nutr , 84 : 975 – 980 .
- Luckett , D.J. , Cowley , R.B. , Richards , M.F. and Roberts , D.M. 2009 . Breeding Lupinus albus for resistance to the root pathogen Pleiochaeta setosa . Eur. J. Plant Pathol , 125 : 131 – 141 .
- May , M.G. , Otterby , D.E. , Linn , J.G. , Hansen , W.P. , Johnson , D.G. and Putnam , D.H. 1993 . Lupins (Lupinus albus) as a protein-supplement for lactating Holstein dairy-cows . J. Dairy Sci , 76 : 2682 – 2691 .
- Olmstead , J.W. , Lang , G.A. and Grove , G.G. 2000 . A leaf disk assay for screening sweet cherry genotypes for susceptibility to powdery mildew . HortScience , 35 : 274 – 277 .
- R Development Core Team (2010). R: A Language and Environment for Statistical Computing. Vienna: R Foundation for Statistical Computing http://www.R-project.org (http://www.R-project.org)
- Raman , R. , Luckett , D.J. and Raman , H. Estimation of genetic diversity in albus lupins (Lupinus albus L.) using DArT and genic markers . 12th International Lupin Conference . September 2008 , Fremantle , Western Australia.
- Shankar , M. , Cowling , W.A. and Sweetingham , M.W. 1996 . The expression of resistance to latent stem infection by Diaporthe toxica in narrow-leafed lupin . Phytopathology , 86 : 692 – 697 .
- Smith , A.B. , Lim , P. and Cullis , B.R. 2006 . The design and analysis of multi-phase plant breeding experiments . J. Agr. Sci , 144 : 393 – 409 .
- Twizeyimana , M. , Ojiambo , P.S. , Ikotun , T. , Hartman , G.L. and Bandyopadhyay , R. 2007 . Comparison of field, greenhouse, and detached-leaf evaluations of soybean germplasm for resistance to Phakopsora pachyrhizi . Plant Dis , 91 : 1161 – 1169 .
- Warkentin , T.D. , Rashid , K.Y. and Zimmer , R.C. 1995 . Effectiveness of a detached leaf assay for determination of the reaction of pea-plants to powdery mildew . Can. J. Plant Pathol , 17 : 87 – 89 .
- Williamson , P.M. and Sivasithamparam , K. 1994 . Factors influencing the establishment of latent infection of narrow-leafed lupins by Diaporthe toxica . Aust. J. Agric. Res , 45 : 1387 – 1394 .
- Wood , P. Epidemiology of Phomopsis leptostromiformis . Proceedings of the Fourth International Lupin Conference . August 15–22 1986 . pp. 220 – 229 . Geraldton , , Australia
- Wood , P. and Sivasithamparam , K. 1989 . Diaporthe woodii (anamorph Phomopsis leptostromiformis) – a toxigenic fungus infecting cultivated lupins . Mycopathologia , 105 : 79 – 86 .
- Wood , P.M. and Allen , J.G. 1980 . Control of ovine lupinosis: use of a resistant cultivar of Lupinus albus – cv. Ultra . Aust J. Exp. Agric , 20 : 316 – 318 .
- Wood , P.M. and Hamblin , J. 1981 . Direct and indirect evidence for the secondary spread of Phomopsis leptostromiformis on lupin species . Australas. Plant Pathol , 10 : 4 – 5 .