
Abstract
Rhizoctonia solani causes destructive diseases in many crops throughout the world, resulting in significant yield and quality losses. Early detection of R. solani would facilitate deployment of timely disease management strategies and prevention of spread of asymptomatic infected plant material. The aim of this study was to develop a simple, rapid and sensitive loop-mediated isothermal amplification (LAMP) method for the detection of R. solani in plants and soil samples. LAMP primers, based on the internal transcribed spacer DNA sequence, were designed for detecting most anastomosis groups of R. solani. Using these primers, a LAMP protocol was developed, which in sensitivity tests was shown to detect very low levels of DNA of R. solani and R. zeae, but not R. oryzae. This LAMP protocol successfully detected R. solani on inoculated plant tissues and soil samples. For onsite application in the field, the LAMP protocol was implemented in a generic anti-biotin and anti-fluorescein antibody-based LFD. LAMP reactions were performed using biotin-labelled primers, which were hybridized with a fluorescein amidite (FAM)-labelled hybridization probe and detected with the LFD. This LAMP-LFD successfully detected R. solani in infected plant tissues. The LAMP-LFD procedure presented here is simple and rapid, and is comparable to quantitative real-time PCR. It has potential for onsite diagnosis of R. solani in infected plant samples, seeds, vegetative cuttings and soil samples.
Résumé
Rhizoctonia solani cause des maladies destructrices chez plusieurs plantes cultivées dans le monde entier, ce qui engendre d’importantes pertes de rendement et de qualité. La détection précoce de R. solani faciliterait le déploiement opportun de stratégies de gestion et la prévention de la dissémination de végétaux infectés asymptomatiques. Le but de cette étude était de développer une méthode d’amplification isotherme médiée par boucle (LAMP) simple, rapide et sensible pour détecter R. solani dans des échantillons de végétaux et de sol. Les amorces propres à LAMP, basées sur la séquence de l’espaceur transcrit interne de l’ADN, ont été conçues pour détecter la majorité des catégories d’anastomoses de R. solani. Un protocole LAMP a été développé à partir de ces amorces, qui, lors des tests de conformité, a permis de détecter de très faibles taux d’ADN de R. solani et de R. zeae, mais pas de R. oryzae. Ce protocole a permis de détecter R. solani avec succès sur des tissus végétaux inoculés et dans des échantillons de sol. En vue d’utilisations sur le terrain, le protocole a été appliqué conformément à un dispositif de flux latéral (LFD) générique fondé sur les anticorps anti-biotine et anti-fluorescéine. Les réactions LAMP ont été effectuées à l’aide d’amorces marquées à la biotine qui ont été hybridées avec une amorce d’hybridation marquée à l’amidite de fluorescéine (FAM) et détectée avec le LFD. La méthode LAMP-LFD a permis de détecter R. solani avec succès dans des tissus végétaux infectés. La méthode présentée dans cet article est simple et rapide et se compare à la PCR quantitative en temps réel. Elle permet d’identifier R. solani sur le terrain, dans des échantillons de végétaux infectés, des semences, des boutures, ainsi que dans des échantillons de sol.
Introduction
Rhizoctonia solani Kühn (teleomorph: Thanatephorus cucumeris [A.B. Frank] Donk) is a wide-host range soil-borne pathogen, which infects many different crops worldwide. Although R. solani can infect susceptible plant species at various stages of their growth, it primarily infects roots of herbaceous plants at the early seedling stage. Primary symptoms include root and crown rot, damping off, seed decay, blights, wilts and at times whole plant death. Depending on the initial inoculum levels, environmental factors and the types of host species, R. solani can cause significant yield and economic losses (Schoeny et al. Citation2001; Smith et al. Citation2003). Other species of Rhizoctonia, namely R. zeae and R. oryzae, also cause diseases on various crops, including many ornamentals, turf grasses, forage, sugar and oilseed crops (Bolkan & Ribeiro Citation1985; Chase Citation1991; Wrather et al. Citation1997; Demirci Citation1998; Pascual & Hyakumachi Citation2000; Hietala et al. Citation2005).
Current disease control strategies for R. solani include fungicide application and cultural methods such as crop rotation. Effective host resistance against R. solani is not available in many economically important crops. Efficient management of disease requires proper pathogen identification, preferably at early stages of the disease cycle or before symptoms develop. Symptoms caused by R. solani are often very similar to those caused by other soil-borne plant pathogens, thus leading to misdiagnosis, which could result in inappropriate and ineffective disease management strategies. Identification based on hyphal growth and sclerotial characteristics on culture plates is frequently used but requires pathogen culture and microscopic examination, which are time-consuming. Accurate identification of R. solani is made difficult by the absence of spores, which are commonly used for fungal identification and classification.
Several antibody- and DNA-based methods such as dot-blot hybridization (Grönberg et al. Citation2003), enzyme-linked immunosorbent assay (ELISA) (Yuen et al. Citation1994), polymerase chain reaction (PCR) and quantitative real-time PCR (qRT-PCR) have been used to detect Rhizoctonia spp. (Mazzola et al. Citation1996; Johanson et al. Citation1998; Grosch et al. Citation2007; Sayler & Yang Citation2007; Okubara et al. Citation2008). These methods are expensive and require a sufficiently equipped laboratory with trained staff, thus resulting in slow disease diagnosis. Therefore, methods that can be performed on-site in the field can significantly reduce time spent on diagnosis. One such method is loop-mediated isothermal amplification (LAMP), which can be performed inexpensively using a simple water bath or heating block in less than an hour (Notomi et al. Citation2000; Tomlinson et al. Citation2010b). In contrast to PCR, which depends on temperature cycling, LAMP works at isothermal temperature for synthesis of large amounts of DNA in a short time. LAMP uses large fragments of the Bst DNA polymerase, which has strand displacement 5′→3′ polymerase activity but lacks 5′→3′ exonuclease activity. In most LAMP protocols, sets of two inner (FIP, Forward Inner Primer and BIP, Backward Inner Primer) and outer primers (F3 and B3) are designed targeting a specific genomic region. Initially LAMP reaction utilizes all four primers but later only the inner primers are used for strand displacement DNA synthesis () (Notomi et al. Citation2000). Positive LAMP reactions result in the accumulation of a byproduct visible as a whitish precipitate, which can be assessed visually. However, visual assessment could be ambiguous and therefore quantitative readouts are needed to improve interpretation and in-field applicability of LAMP methods.
Table 1. Primers for loop-mediated isothermal amplification designed from ITS region of Rhizoctonia solani.
In this study, we investigated integrating LAMP with lateral flow devices (LFDs), which are more efficient, less time consuming and have potential for in-field application. The primary objectives of this study were to: (i) develop a robust LAMP-based assay for the detection of R. solani from infected plant tissues and soil samples; and (ii) implement the developed LAMP protocols using a generic LFD.
Materials and methods
Isolates of R. solani and DNA extraction
A total of four R. solani isolates, 97–82, 95–36, 93–70, 87–122, all belonging to anastomosis group 4 recovered from Dypsis lutescens, Fittonia, Dianthus and Begonia, respectively, were used for standardizing LAMP protocol in this study. These isolates were confirmed to be R. solani using internal transcribed spacer (ITS) sequencing. DNA isolated from these isolates was amplified using ITS-specific primers (White et al. Citation1990). Amplified PCR products were gel-purified (Qiagen) and sequenced. Basic Local Alignment Search Tool (BLAST) of the National Center for Biotechnology and Information (NCBI) was then used to confirm identity of the sequenced PCR products.
LAMP primer design and optimization of LAMP reaction
Rhizoctonia solani is a species complex and is divided into 14 described anastomosis groups (AG) (Guillemaut et al. Citation2003). These groups are further divided in a total of 30 subgroups (Fig. S1) (Guillemaut et al. Citation2003). LAMP protocol was tested on R. solani isolates belonging to AG-1, AG-2, AG-3, AG-4 and AG-5, two R. zeae isolates and one R. oryzae isolate (). These isolates were recovered from infected plants, shown in , at the University of Florida (Norman DJ; Chase AR; Elliot M; unpublished data). They were assigned to anastomosis groups based on mating with the reference isolates from different anastomosis groups (Chase Citation1991).
Table 2. Measurement of turbidity of LAMP products with a spectrophotometer.
All isolates were grown on potato dextrose agar (Difco Laboratories, Sparks, MD) with a 16 h light:8 h dark cycle at 22/18°C temperature for 5–7 days. The mycelia were scraped off using a sterile spatula and transferred into a sterile 1.5 mL tube. DNA was extracted as described by Aljanabi & Martinez (Citation1997).
To amplify these anastomosis groups, four specific primers and a probe were designed based on the aligned R. solani ITS sequences (Fig. S1, Accession numbers [anastomosis subgroups]: AB000017[1-IA]; AB000039[1-IB]; AB000029[1-IC]; AB000026[2–1]; AB054853[2–1(Nt)]; U57878[2–1(2-t)]; AJ238157[2-2IIIB]; AJ238164[2-2IV]; AB054869[2-2LP]; U57740[2–3]; AB054878[2–4]; AB019006[3]; AB019024[3-PT]; AB000001[3-TB]; AB000012[4-HGI]; U19958[4-HGII]; AF354077[4-HGIII]; AB000021[5]; AF153784[6]; AF354101[6-GV]; AF153779[6-HGI]; AB000003[7]; AB000011[8]; AF153795[8ZG1-1]; AF153797[8BZG1-2]; AF354068[8ZG1-3]; AF153799[8ZG1-4]; AF354109[9]; AB000037[9TX]; AB000046[9TP]; AB019026[10]; AF354079[11]; AF153803[12]; AB054875[BI];). These primers were designed using online software Primer Explorer V4 (available from http://primerexplorer.jp/e/). These four primers recognize ITS1 and 5.8 s rRNA regions of R. solani (; ).
Fig. 1 Schematic diagram of ITS (ITS1 and 5.8 s rRNA) sequence of Rhizoctonia solani showing location of LAMP primers.
The LAMP assay was conducted in a total of 25 µL of reaction mixture containing 0.2 µM of each outer primers (F3 and B3), 2 µM of each inner primer (FIP and BIP) [], 0.5 mM dNTPs, 2–6 mM Mg2+, 0.8 M betaine (Sigma-Aldrich, St Louis, MO), 8 U of Bst DNA polymerase (New England Biolab, Ipswich, MA), 1× ThermoPol reaction buffer (New England Biolab, Ipswich, MA) and, depending on the experimental objective, appropriate amount of DNA template. LAMP reaction was optimized using different Mg2+ concentrations (2, 3, 4, 5, 6 mM), reaction temperatures (25, 35, 45, 55 and 65°C) and reaction durations (15, 30, 45 and 60 min). All LAMP reaction products were incubated at 80°C for 5 min to terminate the activity of Bst DNA polymerase. LAMP products were analysed by electrophoresis on a 1.3% agarose gel. Optimization of Mg2+ concentration assays showed that at least 4 mM Mg2+ is necessary for DNA synthesis and therefore, subsequent LAMP assays contained 4 mM Mg2+. Sensitivity of LAMP protocols were determined using a 10-fold dilution series of R. solani DNA (100–10–8 ng) spiked into 100 ng of tomato DNA in a total of 25 µL reaction.
Sensitivity of LAMP protocols
Sensitivity of the LAMP protocols in detecting R. solani in soil samples was performed as follows. Four grams wet mycelia of R. solani (isolate 93–70) representing AG 4 grown in PDB at 25°C for 1 week was blended in 100 mL sterile water in a Waring commercial blender (New Hartford, CT) for 1 min. This mixture, containing 40 mg R. solani mL−1, was serially diluted in sterile water to 4, 4×10−1,10–2, 10–3, 10–4, 10–5, 10–6, 10–7 and 10–8 mg mL−1, and 0.250 mL of each dilution was mixed with 0.250 gm of a potting mix (Fabard, Canadian peat moss, Pine bark and perlite). DNA from R. solani-amended soil samples was isolated using a generic DNA extraction protocol from soil samples. Briefly, a slurry of 250 mg soil mixed with 250 uL of R. solani dilutions as described above was suspended in 1 mL of extraction buffer (100 mM Tris-HCl [pH 8.0], 100 mM sodium EDTA [pH 8.0], 150 mM NaCl and 2% SDS). The mixture was homogenized for 45 s × 5 at 4 m s−1 in a FastPrep FP120 in the presence of 100 mg of 100 µm diameter silica beads and one 1/4′′ ceramic sphere (cat# 6540–424, Savant Bio 101, Carlsbad, CA). The tubes were incubated at 65°C for 15 min, and centrifuged at 3000 × g for 5 min at room temperature. The supernatant was transferred to new tubes and extracted twice with equal volume of phenol:chloroform (1:1). The supernatant was transferred to a new tube and DNA was precipitated by adding equal volume of isopropanol, followed by incubation at −20°C for 30 min and centrifugation at 10 000 × g for 30 min. The DNA pellet was washed twice with 70% ethanol, dried and dissolved in 100 µL of TE, and further purified using the Qiagen DNAeasy kit (cat# 69104).
Biotin-labelled LAMP reaction and hybridization with fluorescein amidite (FAM)-labelled probe
LAMP reactions were carried out using the same procedure as described for normal LAMP but with 5′ biotin-labelled FIP primer. Probe (TCGAATCTTTGAACGCACCTT) was labelled with FAM at the 5′ end (Bio Basic Inc). At the end of 60 min incubation at 65°C, 2.5 µL of 10 µM FAM-labelled probe (0.74 µM final concentration) was added to the biotin-labelled LAMP product and the reaction was continued for another 5 min at 65°C for hybridization. Reactions were terminated at 80°C for 5 min. Successful amplification of LAMP reaction was verified though agarose gel electrophoresis.
Quantitative real-time PCR
qRT-PCR was performed using the SYBR green dye-based PCR detection system on LightCycler® 480 (Roche) using the F3 and B3 primers designed for the LAMP protocol. Each qRT-PCR reaction (20 µL) consisted of 1× SYBR® Green PCR Master Mix (Applied Biosystems), 300 nM each F3 and B3 primers, and a range of R. solani DNA (20 000 fg – 0.2 fg). Thermal cycling conditions consisted of an initial DNA polymerase activation step at 95°C for 10 min followed by 45 cycles of 95°C for 15 s, 55°C for 15 s, and 72°C for 1 min. Threshold determination and data analyses were performed using the LightCycler software v 1.5. Sensitivity was determined as the minimum DNA concentration detected up to 40 qRT-PCR cycles. CT values vs log-transformed DNA concentrations were fitted to linear regression curve: CT = mx+ b, (where x = log [DNA concentration], m and b are the slope and intercept of the regression equation) using Prism 6 (GraphPad software, Inc.). Efficiency, defined as increase in PCR product every cycle, was calculated using the formula: 10(−1/slope)−1
Analysis of LAMP product
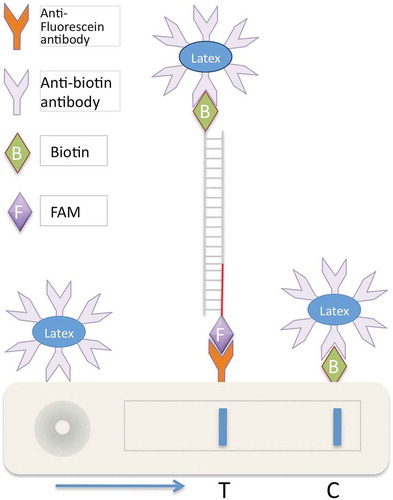
In addition to agarose gel electrophoresis, three other methods were used to analyse DNA amplification in the LAMP product as follows. (1) The turbidity caused by the accumulation of magnesium pyrophosphate, a byproduct of the LAMP reaction, was measured at OD400 nm and OD600 nm using the NanoDrop 2000C Spectrophotometer (Thermo Fischer Scientific, Waltham, MA). (2) The LAMP product was directly detected with naked eye by adding 1 µL of 1/10 dilution of SYBR Green I (Thermo Fisher Scientific) into the LAMP tube; colour change of the solution was observed. (3) For implementation in LFDs, we used a generic LFD device, which has anti-fluorescein antibody to detect double-stranded amplicons labelled with fluorescein amidite (FAM); for a principle of LAMP-LFD (see ). LAMP products labelled with biotin were hybridized to a FAM-labelled probe and 2 µL of the hybridized LAMP product was added to 1 mL of dilution buffer (PCRD2, Forsite Diagnostics) in a 1.5 ml tube. A 75 µL aliquot of this mixture was applied to the sample well of LFD (Forsite Diagnostic) (). Test results appeared within 2–10 min.
Fig. 2 (Colour online) Schematic illustration of chromatographic loop-mediated isothermal amplification combined with lateral flow devices (LAMP-LFD). Using biotin-labelled primers, LAMP amplicons are labelled with biotin and then hybridized to a target-specific ssDNA probe labelled with a fluorescein-containing label, in this case fluorescein amidite. When loaded on the LFD device, these amplicons capture coloured latex beads coated with anti-biotin antibodies. These latex beads/LAMP complexes, when passing through the LFD device, are selectively captured and enriched by anti-fluorescein antibody at the test line ‘T’ showing a strong colour, in this case blue. Unbound excess latex beads/anti-biotin antibody complexes are captured and enriched at the control line ‘C’ by biotin.
Inoculation of plants with R. solani and sample collection
The LFD-LAMP assays were tested and validated on inoculated plant tissues as follows. Five different plant genera: Impatiens ‘Orange accent’, Dieffenbachia ‘Camile’, Spathiphyllum ‘Petite’, Philodendron ‘Hope’ and tomato ‘Patio’ were inoculated with R. solani (isolate 87–122) representing AG 4 by placing four 5 mm diameter mycelial plugs at the base of the main stem. Control plants received 5 mm PDA plugs without the pathogen. Both inoculated and control plants were provided humidity by mist for 15 s, every 10 min in a greenhouse for up to 12 days. Temperature range was 20–30°C. All plants developed characteristic symptoms due to R. solani infection, which ranged from mild brown discolouration (tomato, spathiphyllum, philodendron) to complete collapse of leaves or plants (impatiens and dieffenbachia). A stem of diseased and healthy impatiens plants was collected 6 days after inoculation. Similarly, a stem of diseased and healthy dieffenbachia, tomato, spathiphyllum and philodendron was collected 12 days after inoculation. For initial standardization of LFD-LAMP, DNA was extracted using the Qiagen DNeasy kit. However, for in field implementation of LAMP protocol, crude DNA from diseased plant samples was extracted by vigorous manual shaking of plant tissues in a 15-mL tube that contained a 1/4′′ ceramic sphere (cat# 6540–424, Savant Bio 101, Carlsbad, CA) and 1 mL sodium acetate buffer (50 mM sodium acetate, pH 5.5, 30 mM NaCl, 30 mM ascorbic acid and 0.05% Tween 20).
Results
Optimization of LAMP assays
LAMP reactions depend on various factors including Mg2+ concentration, temperature and reaction duration. The concentration of Mg2+ in a LAMP reaction affects synthesis of target DNA. Therefore, five different concentrations of Mg2+ were tested to determine the optimal concentration needed for LAMP of R. solani. Based on previous LAMP results with other microorganisms (Notomi et al. Citation2000; Tomlinson et al. Citation2010b), we initially chose to perform our experiments at 65°C for 60 min. Reactions containing ≥3 mM Mg2+ concentrations showed LAMP products, shown as bands in agarose gel (). The reaction consisting of 3 mM Mg2+ showed relatively light bands compared with the reaction consisting of 4, 5 and 6 mM Mg2+ concentration. Reactions containing < 3 mM Mg2+ ion concentrations or no template (negative control) did not show any band.
Fig. 3 Optimization of Mg2+ concentration (A), reaction temperature (B) and reaction duration (C) of LAMP assays for the detection of Rhizoctonia solani. (A) Lane M, 1Kb+ DNA ladder; Lane 1, Negative no template control; Lanes 2, 3, 4, 5 and 6 had 2, 3, 4, 5 and 6 mM final Mg2+ concentrations, respectively in a 25 µL LAMP reaction. (B and C) Lanes labelled ‘Rs’ contained 10 ng R. solani DNA mixed with 100 ng tomato DNA in a 25 µL reaction. Lanes labelled ‘0’ contained only 100 ng tomato DNA. LAMP reactions were run on 1.3% agarose gel and stained with ethidium bromide.
We also determined the optimal temperature and duration of LAMP reaction for detecting R. solani. An assay of five different temperatures showed that the R. solani LAMP reaction can be performed at 45, 55 and 65oC but not at 35oC and below (b). However, to avoid any non-specific DNA amplification, reactions should be performed at highest temperatures of 65°C. Similarly, screening of different reaction durations revealed that a minimum of 45 min were required for a successful LAMP (c). Reactions containing no DNA or only tomato DNA did not show any bands. For consistency, in subsequent experiments LAMP reactions were performed with 5 mM Mg2+ at 65°C for 60 min. A test of this LAMP method on DNA of four R. solani isolates collected from four different plant species, showed positive results manifested as bands in agarose gel ().
Fig. 4 Detection of four different Rhizoctonia solani isolates recovered from four different ornamental plants with LAMP. Lane M, 1Kb+ DNA ladder; isolates and their hosts are as follows: 97–82 (host: Dypsis lutescens); 95–36 (host: Fittonia sp.); 93–70 (host: Dianthus sp.); 87–122 (host: Begonia sp.).
Sensitivity of LAMP protocol for detecting R. solani
To determine lower DNA limits that can be detected with the LAMP protocol developed in this study, we performed LAMP reactions using a range of 10-fold dilution series of R. solani DNA in the presence of a representative plant (tomato) DNA. As shown in , clear bands were detected with DNA as low as 10 fg, which is equivalent to approximately 1 copy of a 87.1 Mb genome of R. solani (Wibberg et al. Citation2013). No bands were detected in repeated LAMP reactions with DNA lower than 10 fg indicating that 10 fg is the lowest DNA limit that can be detected using LAMP reaction on agarose gels. To determine if LAMP reactions that were not detected on a gel could be detected with other reporter systems, LAMP products were simultaneously assayed using a generic lateral flow device, turbidity and CYBR green staining. These analyses showed that 10 fg DNA was the lowest limit that was readily detected using LFD (b), but not with turbidity and CYBR Green staining (data not shown).
Fig. 5 (Colour online) Sensitivity of LAMP for detection of Rhizoctonia solani and R. zeae. (A) LAMP reactions contained the indicated amounts of DNA of R. solani (upper panel) or R. zeae (lower panel) in a total of 25 µL reaction. (B) Detection sensitivity of LAMP reactions performed with indicated amounts of R. solani DNA templates were compared by running on 1.3% agarose gel or a PCRD2 Lateral Flow Device (Forsite Diagnostics). Appearance of blue lines next to ‘T’ indicates positive detection of test samples; blue lines next to ‘C’ indicate that the LFD device is functional. Lanes labelled ‘Foo’ and ‘Pp’ are negative controls, and contained 30 ng DNA of Fusarium oxysporum f. sp. oxysporum and Phytophthora parasitica, respectively. ‘H2O’ had no template DNA. Lane M, 1Kb+ DNA ladder.
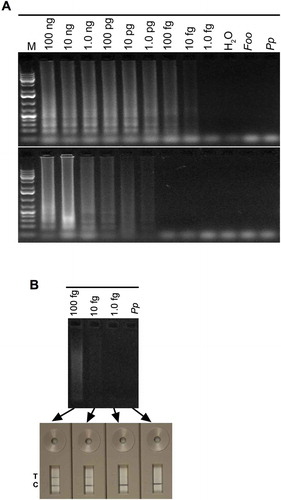
Fig. 6 (Colour online) Sensitivity of LAMP for detection of Rhizoctonia solani in soil samples. (A) LAMP reactions (25 µL) contained 5 µL of total DNA isolated from soil samples amended with the indicated amounts of R. solani wet hyphae; the DNA pellet of each soil sample was dissolved in 50 µL H2O. (B) Detection sensitivity of LAMP reactions performed with DNA isolated form R. solani-amended soil samples were compared by running on 1.3% agarose gel or a PCRD2 Lateral Flow Device (LFD). Appearance of blue lines next to ‘T’ indicates positive detection of test samples; blue line next to ‘C’ indicates that the LFD device is functional. Lanes labelled ‘Pp’ and ‘H2O’ contained 30 ng Phytophthora parasitica DNA, and no DNA, respectively, as negative controls. Lane M, 1Kb+ DNA ladder.
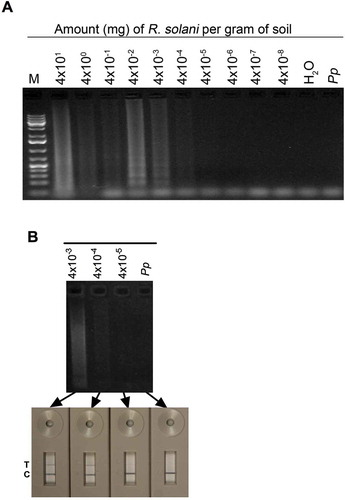
Fig. 7 (Colour online) Quantitative real-time PCR analyses of R. solani. (A) Scatter plot of mean qRT-PCR threshold cycles [CT] versus log-transformed DNA concentration. In the regression equation, −4.276 is the slope, 41.65 is the intercept and x is DNA concentration in fg. (B) Amplification curves showing PCR cycles (x-axis) and fluorescence on y-axis. Red horizontal line is the threshold, which when crossed by the curve indicates presence of DNA.
![Fig. 7 (Colour online) Quantitative real-time PCR analyses of R. solani. (A) Scatter plot of mean qRT-PCR threshold cycles [CT] versus log-transformed DNA concentration. In the regression equation, −4.276 is the slope, 41.65 is the intercept and x is DNA concentration in fg. (B) Amplification curves showing PCR cycles (x-axis) and fluorescence on y-axis. Red horizontal line is the threshold, which when crossed by the curve indicates presence of DNA.](/cms/asset/4fbce503-d0c1-4f2b-930c-fe310e708678/tcjp_a_996610_f0007_oc.jpg)
Rhizoctonia zeae is closely related to R. solani, and it causes leaf and sheath lesions on several economically important grasses such as St. Augustine grass, tall fescue, bentgrass, Bermuda grass and centipedegrass. Although R. zeae is not widespread in occurrence, it has been found in conjunction with R. solani (Smiley et al. Citation2005). The ITS sequences of R. zeae differ in 1 bp in F3, 2 bp in F2 and 1 bp in B2 primers, suggesting that it might be detected by our LAMP protocol. To test this possibility, we performed LAMP reaction with 10-fold serial dilutions of R. zeae DNA. These analyses showed that the R. solani LAMP protocol can also detect R. zeae (, lower panel). The detection limit for R. zeae was 1 pg, which was two orders of magnitude higher than the R. solani detection limit (). The LAMP protocol was specific as it did not amplify any amplicon with negative control DNA isolated from Fusarium oxysporum f. sp. oxysporum, Phytophthora parasitica (), R. oryzae (), and several healthy host plants including tomato, dieffenbachia, spathiphyllum, philodendron and impatiens (see ).
Table 3. Rhizoctonia species and isolates used for comparing LAMP and qRT-PCR methods.
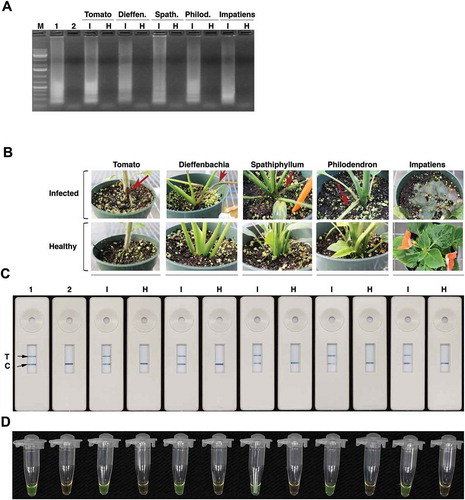
Fig. 8 (Colour online) Application of LAMP-LFD for the detection of R. solani in infected plant samples. (A) Gel picture of LAMP reactions. Lane M, 1Kb+ DNA ladder; Lane 1 is a positive control which has DNA from R. solani isolate 87–122. Lane 2 is no template negative control. Lanes ‘I’ (infected) and ‘H’ (healthy) have LAMP products amplified using DNA isolated from infected (I) or healthy (H) tomato, dieffenbachia, spathiphyllum, philodendron and impatiens tissues. (B) R. solani-infected tomato, dieffenbachia, spathiphyllum, philodendron and impatiens plants. Red arrows indicate disease symptoms on inoculated plants. (C) PCRD2 LFD devices that were loaded with LAMP products amplified using template DNA from either infected (I) or healthy (H) samples shown in panel (B). Lane 1 is a positive control, which has DNA from R. solani isolate 87–122 and lane 2 is no template control. (D) The same LAMP products stained with SYBR green.
Sensitivity of LAMP protocol for detecting R. solani in soil samples
To test the applicability of LAMP for detecting R. solani in soil samples, LAMP reactions were performed using DNA isolated from soil samples amended with R. solani. These analyses showed that R. solani in soil can also be detected in LAMP reactions performed at 65°C for 60 min (). Detection limit was 5 µg R. solani wet hyphae per gram soil. In repeated experiments, no strong correlation between amount of R. solani and detection by LAMP was observed. This is evident from variation in the intensities of bands in with some soil samples amended with more R. solani (4 × 10° and 4 × 10⁻¹ mg gm−1) showing fainter bands than samples amended with lower (4 × 10⁻²) or higher amounts (40 mg gm−1). Apparent lack of this correlation could be due to variation in DNA preparations, with some samples carrying inhibitors that could have interfered with LAMP reactions. A comparison of the in-gel method with other reporter systems showed that LFD could detect LAMP reactions performed with as low as 4 × 10⁻⁴ mg mL−1 R. solani DNA (b). Overall, the LAMP protocol developed in this study can also detect R. solani in soil.
Comparison of LAMP and qRT-PCR assays for detecting R. solani
Sensitivity of the LAMP protocol was compared with the qRT-PCR method. The F3 and B3 LAMP primers, which would amplify a 187 bp fragment, were evaluated for use in qRT-PCR assays. These primers successfully amplified R. solani DNA indicated by significant increase in fluorescence over the threshold level determined automatically by the Roche 480 cycler software. Amplification efficiency was 71.34%, and the threshold cycle (CT) value was 18–21 for 20 ng of R. solani DNA, suggesting that these two primers are suitable for qRT-PCR. Sensitivity of the qRT-PCR was determined using the F3 and B3 primers and six 10-fold serial dilutions of R. solani DNA (2 × 10⁴ – 2 fg) spiked into 100 ng tomato DNA. Relationship between CT values and DNA concentration (log transformed) was linear with high R2 values (0.98), indicating that qRT-PCR specifically amplified R. solani DNA (). Using the Phytophthora parasitica DNA as negative control template, no non-specific increase in fluorescence above the threshold level was observed up to 45 cycles. Considering <40 CT as the positive detection threshold, 2–20 fg DNA was detected in several independent experiments (b). Based on these observations, 2 fg was considered as the minimum detection limit. No false positive or false negative results were obtained in several independent qRT-PCR up to 45 cycles. Using the same R. solani DNA preparations that were used in qRT-PCR, LAMP reactions were performed with 100, 10 and 1 fg DNA, and tested with LFD. These analyses showed that up to 10 fg DNA could be detected reliably with no false positive or false negative results (b). The LAMP protocol and qRT-PCR method also displayed similar sensitivity when tested on several additional R. solani anastomosis groups and two R. zeae isolates (). Rhizoctonia oryzae was not detected even at 10-fold higher template DNA concentration (200 ng) than R. solani in LAMP or qRT-PCR reactions. Overall, these analyses suggest that our LAMP protocol is approximately five-fold less sensitive than the qRT-PCR method.
Application of the LAMP protocol for the detection of R. solani in infected plant tissues
To determine if diseased plant tissues infected by R. solani can be accurately diagnosed by the LAMP protocol developed in this study, diseased leaf samples from five different plant species (tomato, spathiphyllum, philodendron, dieffenbachia and impatiens) were tested as templates in a LAMP assay. Visual assessment of LAMP products revealed higher turbidity (white precipitate) in samples from diseased plant tissues compared with healthy plant tissue (data not shown). To measure the level of turbidity, optical absorbance of each LAMP reaction was measured at 400 nm and 600 nm (). These results showed that positive samples have higher absorbance value (10–31 fold) than negative samples. The spectrophotometer readings were corroborated by gel electrophoresis (). All LAMP reactions performed with disease leaf samples showed bands, whereas those from healthy leaf samples did not show any bands (). As an alternative to visual assessment of turbidity, staining with SYBR green, which stains DNA and emits green colour without excitation with UV, was also evaluated. All positive LAMP products turned green while negative samples did not (). These results suggest that our LAMP assay is suitable for the detection of R. solani from infected plants.
Implementation of LAMP in LFD for the detection of R. solani
Under field conditions, gel electrophoresis or measuring turbidity are not practical methods for the detection of LAMP products. Although visual assessment of turbidity can provide a quick and inexpensive means of judging LAMP reactions, its qualitative nature can lead to false positive or false negative results. In this study, we investigated if a chromatographic LFD can be used as a more robust and reliable tool for the detection of R. solani LAMP products. To test this, we used a generic LFD, which contains coloured latex beads coated with anti-biotin antibody at the launch pad, and a test line coated with anti-fluorescein antibody and a control line coated with biotin downstream from the launch pad (). LAMP products of R. solani-infected plants were labelled with biotin by including biotin-labelled FIP primer in LAMP reactions. Biotin-labelled LAMP products were then hybridized to FAM-labelled probes and loaded into the LFD sample wells. Within 10 min, a blue colour showed at control lines, indicating that the devices were functional. All positive samples showed a blue colour both at the test line ‘T’ and control ‘C’ lines on LFDs (c). All negative samples showed a blue line only at the control line. These results show that LAMP can be easily implemented in generic LFD for the detection of R. solani.
For implementation in the field, it is necessary to develop a DNA isolation method that does not inhibit LAMP reactions. Using a manual crude DNA extraction method that involves vigorously shaking plant tissues in the presence of a ceramic bead in a 15-mL tube provided DNA of sufficient amount and quality for LAMP. Testing of this method on infected ornamental plants resulted in 21 positive of the 22 total tested samples, reflecting approximately 95% success rate ().
Discussion
Timely and accurate detection of R. solani in plant tissues, especially propagation material such as cuttings and seeds, is essential for deploying appropriate curative and prophylactic disease control methods. Because of their dependence on laboratory equipment, most existing molecular methods for the detection of Rhizoctonia spp. are too complex for routine use (Yuen et al. Citation1994; Grönberg et al. Citation2003; Grosch et al. Citation2007; Sayler & Yang Citation2007). In this study, we developed a highly sensitive and simple LFD-based LAMP assay for detecting R. solani. This method detected R. solani and R. zeae from various infected plants and soil. LAMP sensitivity results from this study showed that very small quantities of R. solani and R. zeae DNA can be detected. Considering an approximate 87.1 Mb diploid genome size of R. solani (Wibberg et al. Citation2013), as low as 1 copy of genome can be detected with the LAMP protocol developed in this study. This provides us with a highly sensitive detection method, which can be applied to asymptomatic tissues infected with very little R. solani. The R. solani ITS DNA sequences targeted by LAMP primers were searched in the NCBI GenBank database using Blastn to find any off-target DNA sequences. The BLAST results matched ITS regions of only Rhizoctonia spp. Based on their hyphal compatibility, R. solani isolates are grouped into 14 anastomosis groups (Guillemaut et al. Citation2003). Most anastomosis groups are further classified into subgroups resulting in a total of 30 characterized groups (Guillemaut et al. Citation2003). An alignment of the ITS sequences of these 30 groups and the sequences of LAMP primers revealed that most anastomosis groups will be detected readily with the LAMP protocol developed in this study (S). Similarly, a comparison of ITS sequences of R. solani and R. zeae revealed that R. zeae (NCBI GI: 347309145) has a 1 bp difference in F3, 2 bp in F2 and 1 bp in B2 primers used in this study. These one or two base pairs differences in LAMP primers were not sufficient in discriminating these two Rhizoctonia spp. (), and therefore the LAMP protocol developed here will also be useful in detecting R. zeae.
Simplicity and convenience of using LFDs are favoured over gel electrophoresis, turbidity measurement and DNA staining with dyes. Field deployment of LAMP will require at least three major developments: setting up, performing and reporting LAMP assays. In contrast to a conventional laboratory setting, which is equipped with pipettors, tips, PCR tubes etc., setting up a LAMP reaction in field settings is less convenient. This problem can be avoided by premixing and packaging LAMP reagents in a ready-to-use format such as those developed for conventional PCR. When needed, DNA from suspected samples can be added directly to these pre-packaged LAMP tubes. Although LAMP does not require thermal cyclers, it still requires a heating device. Several portable devices that are battery-operated are being investigated and should be adaptable for field deployment of LAMP (Science/AAAS Citation2008; Asiello & Baeumner Citation2011). After a LAMP reaction is complete, an increase in turbidity in assay samples compared with negative control can be considered as positive results (Notomi et al. Citation2000). Visual assessment, however, is subjective and is prone to false positive and negative interpretations. In this study we used a generic LFD, which works by immunodetecting and reporting labels that are incorporated in LAMP primers and hybridization probes. In our study, this strategy provided results within 5 min. In contrast to PCR, the use of generic LFD does not require extensive skills and special equipment.
The potential usefulness of LAMP-LFD for the diagnosis was confirmed by its ability to detect R. solani from several different infected plants representing diverse families ( and ). These results indicate that combining LAMP and LFD can provide a suitable reporting system. The larger amounts of target DNA synthesized in LAMP could lead to cross-contamination of subsequent assays after opening the tubes and handling of LAMP products. In our experiments, we occasionally observed cross-contamination of subsequent samples. This problem was avoided by opening the LAMP reaction tubes under a hood using a dedicated set of pipettors. This problem could also be overcome by developing modular systems, where the LAMP reaction module and reporting modules are packaged in one sealed system. In addition, using quantitative turbidity- or fluorescence-based real-time LAMP assays (Tomlinson et al. Citation2010a; Nagdev et al. Citation2011; Kim et al. Citation2012), where reaction tubes are never opened, are suitable alternatives. Availability of fully portable and battery-operated devices e.g. Loopamp real-time turbidimeters or portable fluorescence-based devices offers affordable field deployment of LAMP assays (Tomlinson et al. Citation2010a).
For comparing LAMP assays to qRT-PCR, ideally similar DNA regions should be targeted in both assays. The outer F3 and B3 LAMP primers provided an excellent choice for comparing these two methods. Using these primers, we found that LAMP assays when implemented in LFD are comparable to qRT-PCR. In sensitivity tests, the R. solani DNA detection limit of our LAMP-LFD protocol was 10 fg, which is comparable to the detection limit of the qRT-PCR method, which in our hands detected 2 fg R. solani DNA. These results are consistent with the qRT-PCR reported by Okubara et al. (Citation2008), who reported detecting 2 fg R. solani DNA reliably. However, the primer sets used by Okubara et al. (Citation2008) specifically detect certain R. solani AGs. Our LAMP protocol was capable of detecting several R. solani AG and also R. zeae, and therefore would be useful for the diagnosis of these two pathogens. In terms of sensitivity, the LAMP protocol developed in this study did not perform better than the qRT-PCR, but it is simpler and easier to perform unlike the qRT-PCR method, which require using a real-time PCR machine and skilled personnel to accurately interpret results.
After rigorous testing, the LAMP-LFD method developed in this study could potentially be deployed at quarantine offices for quick diagnosis, which would help approval of the consignments either for export or import. Moreover, it can be also be implemented by diagnostic labs and extension plant pathologists to recommend appropriate control measures to growers and to help in containing Rhizoctonia diseases. In the future, combining several multiplex systems for major disease groups caused by other pathogens would provide a useful tool for plant disease diagnosticians, growers, quarantine officials and extension personnel.
Conflict of interest
No conflict of interest declared.
Supplemental data
Supplemental data for this article can be accessed here: http://dx.doi.org/10.1080/07060661.2014.996610.
Supplemental Material
Download PNG Image (165.6 KB)
Acknowledgements
We are grateful to Dr Norman for critically reading the manuscript. This work was supported by funds to G.S.A. from the Florida Agriculture Experiment Station of the Institute of Food and Agricultural Sciences at the University of Florida and Florida Nursery Growers and Landscape Association.
References
- Aljanabi SM, Martinez I. 1997. Universal and rapid salt-extraction of high quality genomic DNA for PCR-based techniques. Nucleic Acids Res. 25:4692–4693.
- Asiello PJ, Baeumner AJ. 2011. Miniaturized isothermal nucleic acid amplification, a review. Lab Chip. 11:1420–1430.
- Bolkan HA, Ribeiro WRC. 1985. Anastomosis groups and pathogenicity of Rhizoctonia solani isolates from Brazil. Plant Dis. 69:599–601.
- Chase AR. 1991. Characterization of Rhizoctonia species isolated from ornamentals in Florida. Plant Dis. 75:234–238.
- Demirci E. 1998. Rhizoctonia species and anastomosis groups isolated from barley and wheat in Erzurum, Turkey. Plant Pathol. 47:10–15.
- Grönberg H, Paulin L, Sen R. 2003. ITS probe development for specific detection of Rhizoctonia spp. and Suillus bovinus based on Southern blot and liquid hybridization-fragment length polymorphism. Mycol Res. 107:428–438.
- Grosch R, Schneider JHM, Peth A, Waschke A, Franken P, Kofoet A, Jabaji-Hare SH. 2007. Development of a specific PCR assay for the detection of Rhizoctonia solani AG 1-IB using SCAR primers. J Appl Microbiol. 102:806–819.
- Guillemaut C, Edel-Hermann V, Camporota P, Alabouvette C, Richard-Molard M, Steinberg C. 2003. Typing of anastomosis groups of Rhizoctonia solani by restriction analysis of ribosomal DNA. Can J Microbiol. 49:556–568.
- Hietala AM, Mehli L, Nagy NE, Kvaalen H, La Porta N. 2005. Rhizoctonia solani AG 2-1 as a causative agent of cotyledon rot on European beech (Fagus sylvatica). For Pathol. 35:397–410.
- Johanson A, Turner HC, McKay GJ, Brown AE. 1998. A PCR-based method to distinguish fungi of the rice sheath-blight complex, Rhizoctonia solani, R. oryzae and R. oryzae-sativae. FEMS Microbiol Lett. 162:289–294.
- Kim DW, Kilgore PE, Kim EJ, Kim SA, Anh DD, Dong BQ, Kim JS, Seki M. 2012. The enhanced pneumococcal LAMP assay: a clinical tool for the diagnosis of meningitis due to Streptococcus pneumoniae. PLoS One. 7:e42954.
- Mazzola M, Wong O, Cook RJ, Wong OT. 1996. Virulence of Rhizoctonia oryzae and R solani AG-8 on wheat and detection of R oryzae in plant tissue by PCR. Phytopathology. 86:354–360.
- Nagdev KJ, Kashyap RS, Parida MM, Kapgate RC, Purohit HJ, Taori GM, Daginawala HF. 2011. Loop-mediated isothermal amplification for rapid and reliable diagnosis of tuberculous meningitis. J Clin Microbiol. 49:1861–1865.
- Notomi T, Okayama H, Masubuchi H, Yonekawa T, Watanabe K, Amino N, Hase T. 2000. Loop-mediated isothermal amplification of DNA. Nucleic Acids Res. 28:E63.
- Okubara PA, Schroeder KL, Paulitz TC. 2008. Identification and quantification of Rhizoctonia solani and R. oryzae using real-time polymerase chain reaction. Phytopathology. 98:837–847.
- Pascual CB, Hyakumachi M. 2000. Distribution of vegetatively compatible populations of Rhizoctonia solani AG1-IA in a field planted with different host species. J Gen Plant Pathol. 66:206–209.
- Sayler RJ, Yang YN. 2007. Detection and quantification of Rhizoctonia solani AG-1 IA, the rice sheath blight pathogen, in rice using real-time PCR. Plant Dis. 91:1663–1668.
- Schoeny A, Jeuffroy M-H, Lucas P. 2001. Influence of take-all epidemics on winter wheat yield formation and yield loss. Phytopathology. 91:694–701.
- Science/AAAS. 2008. Palm-size thermocycler: products and materials. Science. 321:1511.
- Smiley RW, Dernoeden PH, Clarke BB. 2005. Compendium of turfgrass diseases. 3rd ed. St. Paul (MN): APS Press.
- Smith JD, Kidwell KK, Evans MA, Cook RJ, Smiley RW. 2003. Assessment of spring wheat genotypes for disease reaction to Rhizoctonia solani AG-8 in controlled environment and direct-seeded field evaluations. Crop Sci. 43:694–700.
- Tomlinson JA, Dickinson MJ, Boonham N. 2010a. Detection of Botrytis cinerea by loop-mediated isothermal amplification. Lett Appl Microbiol. 51:650–657.
- Tomlinson JA, Dickinson MJ, Boonham N. 2010b. Rapid detection of Phytophthora ramorum and P. kernoviae by two-minute DNA extraction followed by isothermal amplification and amplicon detection by generic lateral flow device. Phytopathology. 100:143–149.
- White TJ, Bruns T, Lee S, Taylor J. 1990. Amplification and direct sequencing of fungal ribosomal RNA genes for phylogenetics. In: Innis MA, Gelfland DH, Sninsky JJ, White TJ, editors. PCR protocols: a guide to methods and applications. San Diego: Academic Press; p. 315–322.
- Wibberg D, Jelonek L, Rupp O, Hennig M, Eikmeyer F, Goesmann A, Hartmann A, Borriss R, Grosch R, Pühler A, Schlüter A. 2013. Establishment and interpretation of the genome sequence of the phytopathogenic fungus Rhizoctonia solani AG1-IB isolate 7/3/14. J Biotechnol. 167:142–155.
- Wrather JA, Anderson TR, Arsyad DM, Gai J, Ploper LD, Porta-Puglia A, Ram HH, Yorinori JT. 1997. Soybean disease loss estimates for the top 10 soybean producing countries in 1994. Plant Dis. 81:107–110.
- Yuen GY, Kim K-N, Horst GL. 1994. Use of ELISA and isolation for determining the distribution of Rhizoctonia solani and other Rhizoctonia spp. in asymptomatic creeping bentgrass. Crop Prot. 13:296–300.