
Abstract
Real-time PCR assays using locked nucleic acid (LNA) probes and high resolution melt (HRM) analysis were developed for molecular differentiation of Pseudoperonospora cubensis and P. humuli, causal agents of cucurbit and hop downy mildew, respectively. The assays were based on a previously identified single nucleotide polymorphism (SNP) in the cytochrome oxidase subunit II (cox2) gene that differentiates the two species. Sequencing of the same region from 15 P. cubensis isolates collected in New York State for the current study confirmed that all isolates shared the conserved SNP. LNA probes were specific and sensitive, detecting as few as 10 sporangia for both species and as little as 1 fg P. cubensis total DNA and 10 fg P. humuli total DNA. The LNA assay detected both pathogens from air sampled using spore traps placed in vegetable fields and a hop yard during the summers of 2013 and 2014 and correctly diagnosed symptomatic leaf tissue. High resolution melt analysis (HRM) correctly identified all tested isolates as well as those isolates from symptomatic plants collected in the field. The LNA and HRM assays correctly identified both organisms when tested independently in a second laboratory. The results confirm that the LNA and HRM assays developed can provide reliable identification of both species despite the high molecular similarity of the cox2 gene.
Résumé
Des tests basés sur la PCR en temps réel avec amorces contenant des acides nucléiques bloqués (LNA) et une analyse des courbes de fusion à haute résolution (HRM) ont été conçus en vue de la différenciation moléculaire de Pseudoperonospora cubensis et de P. humuli, agents causals du mildiou chez les cucurbitacées et le houblon, respectivement. Les tests étaient basés sur un polymorphisme mononucléotidique (SNP) préalablement identifié dans le gène de la sous-unité II de la cytochrome oxydase (cox2) qui différencie les deux espèces. Le séquençage de la même région de 15 isolats de P. cubensis, collectés dans l’État de New York pour l’étude en cours, a confirmé que tous les isolats partageaient le SNP conservé. Les amorces de LNA étaient spécifiques et sensibles, détectant aussi peu que 10 sporanges pour les deux espèces et à peine 1 fg d’ADN total chez P. cubensis et 10 fg d’ADN total chez P. humuli. Le test avec amorces de LNA a permis de détecter les deux agents pathogènes dans l’air échantillonné des pièges à spores placés dans des champs de légumes et dans une houblonnière durant les étés de 2013 et de 2014, et de correctement diagnostiquer les tissus foliaires symptomatiques. L’analyse des courbes de fusion à haute résolution a permis d’identifier correctement tous les isolats testés de même que ceux provenant de plantes symptomatiques collectées sur le terrain. Les tests avec amorces de LNA et basés sur l’analyse des HRM ont permis d’identifier correctement les deux organismes lorsqu’ils ont tété analysés séparément dans un deuxième laboratoire. Les résultats confirment que les tests avec amorces de LNA et ceux basés sur l’analyse des HRM nouvellement conçus peuvent permettre d’identifier précisément les deux espèces malgré la forte similarité moléculaire du gène de la cox2.
Introduction
Pseudoperonospora cubensis (Berk. & M.A. Curtis) and P. humuli (Miyabe & Takah.) are closely related obligate biotrophic plant pathogens which cause cucurbit downy mildew (CDM) and hop downy mildew (HDM), respectively. CDM is a foliar disease, which can cause dramatic plant health decline, greatly impacting fruit yields (Savory et al. Citation2011). It afflicts members of the Cucurbitaceae family worldwide, with the most economically important species being cucumber (Cucumis sativus L.), cantaloupe and muskmelon (Cucumis melo L.), squash and pumpkin (Cucurbita pepo L., C. maxima Duchesne and C. moschata Duchesne ex Poir) and watermelon (Citrulus lanatus Thunb. Matsum & Nakai) (Lebeda & Cohen Citation2011). In 2013 for New York State alone, there were 1290 hectares of cucumber grown, valued at $17 million (USDA Citation2013), with CDM imposing the greatest threat to yield (Cornell Vegetable Program Citation2015). HDM results in a reduction in yield and quality of hop cones (Humulus lupus L.), as well as stunted growth and potential death of the perennial root system (Skotland & Johnson Citation1983). New York State was home to a thriving hop production industry in the mid 1800s, producing the majority of the nation’s hops (Bissel Citation1877). However, market factors, hop powdery mildew, and HDM caused the industry to collapse by the 1920s (Skotland & Johnson Citation1983; Sirrine et al. Citation2010). The disease is now endemic in hop production regions throughout the northern hemisphere and in Argentina (Royle & Kremheller Citation1981; Pérez et al. Citation2003). With the introduction of various resistant cultivars, the development of integrated pest management (IPM) strategies and registration of targeted, systemic fungicides, the hop industry in New York, as well as incidence of HDM, is growing once again (Northeast Hop Alliance Citation2012).
Resistant cultivars provide an important defence against crop damage from downy mildews. However, cucumber resistance to CDM was overcome in the United States in 2004, dramatically increasing the need for fungicides (Savory et al. Citation2011). In addition, disease pressure from CDM is increasing in northern latitudes; whereas P. cubensis has been known to perennate on cucurbits grown in Florida and then annually re-infect more northern latitudes by long-distance dispersal, cucumbers are now being grown in hothouses in the northeastern US and Canada, potentially providing inoculum much earlier in the season (Ojiambo & Holmes Citation2011). Pseudoperonospora cubensis may also have perennial hosts that could allow overwintering farther north (Runge & Thines Citation2012) and recent reports indicate P. cubensis may be transmitted through seed (Cohen et al. Citation2014).
For both CDM and HDM, disease prediction is another important component of IPM systems. The CDM IPM-Pest Information Platform for Extension and Education (PIPE) compiles weather and disease reports to alert growers of infection risk as the pathogen spreads through the country, and therefore, provides information important for initiating fungicide application (Ojiambo & Holmes Citation2011). Unlike P. cubensis, P. humuli overwinters in its perennial host (Coley-Smith Citation1962). Thus, disease risks are predicted based on weather, and if available, airborne inoculum level (Royle & Kremheller Citation1981).
If inoculum data are combined with weather data, a disease prediction system provides a more accurate assessment of infection risk (West et al. Citation2008). This has the potential to provide growers with more tools with which to manage disease outbreaks and reduce fungicide use (Gent et al. Citation2013). A system for detection of P. humuli sporangia was developed in 2009, utilizing PCR to detect the internal transcribed spacer (ITS) region of the pathogen (Gent et al. Citation2009). However, because P. humuli and P. cubensis share a high level of sequence similarity in the genes investigated thus far (Choi et al. Citation2005), it was not possible to design primers specific to P. humuli (Gent et al. Citation2009). In 2011, one conserved and three semi-conserved single nucleotide polymorphisms (SNPs) in the cytochrome oxidase subunit II (cox2) gene were found to differentiate the two species (Mitchell et al. Citation2011). Thus, we utilized the one conserved SNP to design two assays allowing for specific diagnosis and detection of both pathogens: 5ʹ nuclease locked nucleic acid (LNA) probes and high resolution melt (HRM) analysis.
Real-time PCR utilizing 5ʹ nuclease probes labelled with different fluorophores allows for the detection of various SNPs in one reaction (Livak Citation1999). However, when a single SNP is the differentiating factor between alleles, there can be cross-reactivity (Klosterman et al. Citation2014). In a mixed-DNA sample, cross-reactivity can complicate the detection of a specific pathogen (Klosterman et al. Citation2014). In this situation, LNA hybridization probes can be used to increase the specificity of an assay. These probes contain LNA bases, RNA analogues modified to contain a bridge on the ribose ring which ‘locks’ the ring into the ideal conformation for base stacking (Koshkin et al. Citation1998a, Citation1998b). This increases the melting temperature (Tm), allowing for greater specificity (Koshkin et al. Citation1998a, Citation1998b). The probes are designed so that a single mismatch will require a lower Tm for successful binding, thus preventing non-specific hybridization at the reaction annealing temperature (Johnson et al. Citation2004; Ugozzoli et al. Citation2004).
High resolution melt analysis (HRM) is a faster and relatively less expensive alternative to fluorogenic probes for genotyping and diagnostics (Wittwer Citation2009). HRM requires a real-time PCR machine and specialized software, but after these initial start-up costs, it can be readily applied to differentiate SNPs, or even microsatellites (Mackay et al. Citation2008). HRM utilizes conventional primers, with amplification taking place in the presence of a saturating intercalating dye that specifically binds to double-stranded DNA and fluoresces brightly when bound. After amplification is complete, the temperature of the reaction is slowly raised to induce denaturation of the double-stranded amplicon, while reduction in fluorescence, caused by release of a dye from the DNA duplex, is measured. A single SNP difference results in a measurable variation in melting temperature recorded over time (Garritano et al. Citation2009).
The goal of this study was to develop assays for identification of P. cubensis and P. humuli based on the conserved SNP described above. LNA probes were designed to provide specific detection of both P. cubensis and P. humuli from a mixed-DNA sample. A HRM analysis assay was developed as a relatively cheaper diagnostic tool.
Materials and methods
Pathogen isolates
Pseudoperonospora cubensis
Fifteen P. cubensis isolates were collected from fields with symptomatic hosts in New York State (8 counties) during the summers of 2012 and 2013 (). Ten of these samples were from cucumber, two from cantaloupe, two from squash and one from pumpkin. Diseased leaves were placed in a moist chamber overnight to induce sporulation. Sporangia were harvested and inoculated onto leaves of the susceptible cucumber cultivar ‘Straight Eight’. Cucumber plants were grown in a potting mix composed of peat, perlite and vermiculite in a 4:1:1 ratio and produced in a greenhouse free of downy mildew. Clonal isolates were obtained by inoculating 7-day-old cucumber seedlings with sporangia from a single lesion of each isolate. Sporangia were sprayed on seedlings using an air pressurized sprayer (Nalgene, Rochester, NY). This single lesion process was repeated three times per isolate to reduce the possibility of a mixed isolate. Inoculated plants were placed in dark moist chambers at 16°C overnight then moved to a greenhouse with a 24/18°C day/night temperature setting and a 14 h light/10 h dark photoperiod. Once lesions appeared on the cucumber seedlings, the plants were placed in a moist chamber (>90% relative humidity) in the dark at 16°C for 24 to 48 h until prolific sporulation was observed. Isolates were stored on cucumber tissue at −80°C.
Table 1. Identity, host and origin of organisms used to develop LNA probe and HRM assays designed to detect Pseudoperonospora cubensis and P. humuli based on a conserved single nucleotide polymorphism at base 105 in the cox2 gene. Results for multiplexed LNA probe assays are given in threshold cycle (Cq) values (mean±standard deviation, n = 3), where probes were labelled with HEX/FAM for P. cubensis and P. humuli, respectively.
Pseudoperonospora humuli
Hop shoots with signs of systemic infection were collected from hop yards and monosporangial isolates of P. humuli were derived as described previously (Gent et al. Citation2008) or by depositing a single sporangium onto a leaf disc using a MoFlo flow cytometer (Beckman Coulter, Inc., Brea, CA). For the latter method, leaf discs were cut from greenhouse-produced hop plants (‘Pacific Gem’) with a #10 cork borer and the adaxial surface placed onto 1% water agar in a 24-well serological plate. A suspension of sporangia from a given sample of P. humuli, cultured as described by Mitchell et al. (Citation2011), was loaded into a flow cytometer calibrated to deliver a single sporangium onto each leaf disc. After deposition of sporangia, the leaf discs were misted with sterile deionized water using an airbrush sprayer and incubated in a growth chamber set to 13°C for 7–14 days. Isolates were subsequently increased and maintained using the methods of Mitchell et al. (Citation2011).
DNA extraction and cox2 gene sequencing
Sporangia were collected for DNA extraction by gently rinsing sporangia from leaves using type-1 water. Sporangia were then pelleted by centrifugation at 1000 × g for 5 min. DNA from P. cubensis and P. humuli isolates was extracted using a CTAB procedure as described (Keb-Llanes et al. Citation2002), with modifications to buffer A; beta-mercaptoethanol and polyvinylpyrrolidone were omitted as they were not necessary to obtain high quality DNA from sporangial tissue. The concentration of DNA was assessed using a Qubit fluorometer and Qubit double-stranded DNA High Sensitivity Assay Kit (Life Technologies, Grand Island, NY), which measures fluorescence emitted when the dye in the assay reagents bind selectively to intact DNA. The cox2 region of the P. cubensis and P. humuli isolates used in the development of the assay () was amplified using previously described FM35 and FM36 primers (Mitchell et al. Citation2011). PCR was carried out with 1× GoTaq Green reaction buffer containing 1.5 mM MgCl2 (Promega, Madison, WI), 0.2 mM dNTPs (Promega), 0.2 µM each primer (Integrated DNA Technologies, Coralville, IA), 2 units GoTaq DNA polymerase (Promega), 2.5 µg bovine serum albumin (Roche, Basel, Switzerland) and 2 µL (10 ng) of total DNA in a 50 µL reaction. Negative controls lacking DNA template were included. The following PCR cycling conditions were used: 95°C for 2 min; 40 cycles of 95°C for 30 s, 50°C for 30 s and 72°C for 1 min; followed by 5 min at 72°C. DNA fragments were electrophoresed in 1% agarose Tris-acetate EDTA gels stained with ethidium bromide and visualized using an ultraviolet transilluminator. Amplicons were then sequenced using primers F26 and R557 (), which were designed using the cox2 gene sequences published in Genbank by Mitchell et al. (Citation2011). Sequencing was performed on a 3730XL (Sanger) DNA Analyzer (Applied Biosystems) at the Cornell University Life Sciences Core Laboratories Center. Sequences were aligned using the programme Seaview (Gouy et al. Citation2010) and submitted to GenBank, with the accession numbers listed in .
Table 2. Primers and probes designed for assays differentiating Pseudoperonospora cubensis and P. humuli using the SNP at base 105 in the cox2 gene target region.
Primer/probe design and qPCR protocols
Real-time PCR with LNA probes
All qPCR detection assays were designed and implemented in accordance with the ‘Minimum Information for Publication of Quantitative Real-Time Experiments’ (MIQE) guidelines (Bustin et al. Citation2009). Primers (RT33F-RT182R) and LNA probes (CUBprobeSNP105 and HUMprobeSNP105) targeting the conserved SNP at base 105 of the cox2 gene were designed by IDT, using the cox2 gene sequences published in GenBank by Mitchell et al. (Citation2011). A 20 µL multiplexed reaction was used containing 1× IQ Supermix (Bio-rad, Hercules, CA), 500 nM of each primer and 250 nM of each probe. One ng total DNA was used as template. Negative control reactions lacking DNA template were included. The PCR protocol, run on a CFX 96 Touch qPCR system (Bio-rad) in 96-well white plates (Bio-rad MLL9651), included an initial denaturation at 95°C for 3 min then 35 cycles of a 95°C denaturation for 10 s and annealing/extension step at 65°C for 45 s, plus a plate read. Three technical replicates of each sample were run and the average Cq and standard deviation were calculated using Bio-rad CFX Manager software (version 3.1). For the isolates used in the calculation of the standard curve, two biological replicates with three technical replicates each were used.
The LNA assay also was conducted independently in the Gent laboratory (US Department of Agriculture) at Oregon State University to ensure its reproducibility. PCR reagents and conditions, including the real-time PCR system, were exactly as described above. Isolates of P. cubensis and P. humuli used in the development of the assays () were tested, as were nine other isolates of P. humuli that were not used in assay development (). This resulted in a total of 15 single-lesion P. cubensis isolates () and 16 single-sporangial P. humuli isolates (, ).
Table 3. Identity, host and origin of isolates used to validate real-time LNA probe and HRM PCR assays designed to detect Pseudoperonospora cubensis and P. humuli based on the conserved single nucleotide polymorphism at base 105 of the cox2 gene target region. Results for multiplexed LNA probe assays are given in threshold cycle (Cq) values (mean± standard deviation, n = 3), where probes were labelled with HEX/FAM for P. cubensis and P. humuli, respectively.
High Resolution Melt curve (HRM) analysis
Real-time PCR with HRM analysis utilized the same primers as those used for the LNA assay (RT33F-RT182R) which flank the conserved SNP at base 105 of the cox2 amplicon. Precision Melt Supermix (Bio-rad) and 500 nM of each primer were mixed with 1 ng (3 µL) template in 20 µL reaction volumes. Negative control reactions lacking DNA template were included. The reaction was run on a CFX 96 Touch qPCR system and followed the suggested program from the manufacturer’s supermix protocol, with 2 min denaturation at 95°C followed by 42 cycles of denaturation 95°C, 10 s; annealing + extension + plate read 63°C, 30 s; then denaturation 95°C, 30 s; heteroduplex formation 60°C, 1 min; high resolution melt + plate read 65 to 95°C, in 0.2°C increments at 10 s per step. Two technical replicates of each sample were run. Following amplification, temperature-shifted melt curves and difference plots produced by the Precision Melt analysis software (Bio-rad) were evaluated to detect separation of melt curves between P. cubensis and P. humuli isolates.
The HRM assay was conducted independently in the Gent laboratory to ensure reproducibility. PCR reagents and conditions, including the real-time PCR system, were exactly as described above. As with the LNA assay, isolates used in the development of assays () and nine other monosporangial isolates of P. humuli () were tested. Again, this resulted in a total of 15 P. cubensis isolates () and 16 P. humuli isolates (, ).
Sensitivity of real-time PCR with LNA probes
The three methods below were used to determine the sensitivity and detection limit of the LNA diagnostic assay.
Sporangial detection
Sensitivity was quantified by testing DNA obtained from 10 independent extractions for each of the following: 0, 1, 10, 50, 100 and 500 P. cubensis and P. humuli sporangia. In order to extract DNA from 1 and 10 sporangia, dilutions of sporangia were spread on a thin layer of 0.5% agarose on a microscope slide, a dilute suspension of sporangia was spread on the solidified agarose, sporangia were located with the aid of a dissecting microscope, and removed with a small section of agarose. Similarly sized pieces of agarose to those included in the above extractions were also added to 10 negative control extractions containing no sporangia. For extractions of 100 and 500 sporangia, the number of sporangia within a suspension was quantified using a hemocytometer and an appropriate aliquot was taken for extraction. DNA was extracted using a MoBio UltraClean Soil DNA Isolation Kit (MoBio, Carlsbad, CA) following manufacturer’s instructions, with 0.02 g mL−1 of polyvinyl pyrrolidone (PVP) added to buffer S1. DNA was quantified using a Qubit fluorometer. Real-time PCR with LNA probes was performed as described above. Two technical replicates of each sample were run and the average Cq of the two replicates was used to calculate the average and standard deviation of the Cq for all 10 samples per sporangial number (0, 1, 10, 50, 100 and 500) for each species.
Dilutions of total DNA
The sensitivity of the species-specific LNA probes was also quantified by testing 10-fold dilutions of genomic DNA ranging from 1 ng to 1 fg. Two separate DNA extractions of pathogen isolates, CDM12-6 and HDM NY 2012, were used for each dilution series. Three technical replicates for each biological replicate and sample dilution were tested and the average Cq values with standard deviation were calculated using Bio-rad CFX Manager software. Mean Cq values were plotted against log10 (template DNA concentration) and used to generate standard curves for the P. cubensis and P. humuli-specific LNA assays. Linear regression analysis was conducted and the slope was used to determine the R2 value of each reaction using MatLab version 13a.
Mixed-DNA samples
The third method used to determine sensitivity tested the ability to detect each pathogen in mixed-DNA samples. A portion of the cox2 gene (the F26-R557 amplicon) from P. cubensis isolate CDM13-58 and P. humuli isolate HDM NY 2013 was amplified and the amplicon was cloned using the TopoTA cloning kit (Life Technologies), according to manufacturer’s recommendations, then sequenced. Ten-fold dilutions of plasmid DNA were made from 10 ng to10 pg and used as template, both separately and mixed in varying concentrations () for the LNA assay described above. Two technical replicates of each concentration and mixture were run and the average Cq and standard deviations were calculated using Bio-rad CFX Manager software.
Table 4. Threshold cycle (Cq) values (mean± standard deviation, n = 2) for multiplexed real-time PCR LNA probe assays using a cox2 gene fragment cloned from P. cubensis or P. humuli individually or mixed together at varying concentrations.
Specificity of LNA and HRM assays
The specificity of each assay was tested using DNA from 13 microbes: four downy mildew pathogens and nine other oomycetes and fungi commonly associated with cucurbits or hops or producing airborne spores. As well, DNA was tested from cucumber ‘Straight Eight’, summer squash ‘Multipick’ and hop ‘Pacific Gem’ (). To ensure that lack of amplification of non-target organisms was not due to inhibition in the PCR, fungal and oomycete samples were also tested with PCR using primers ITS4-ITS5, while plant samples were tested using primers ITS4-ITS1, which amplify the internal transcribed spacer region using a previously described protocol (White et al. Citation1990).
Detection from plant samples
Symptomatic plant samples collected from the field
To test if the LNA and HRM assays would be appropriate for diagnosing disease from field samples containing minimal sporulation and presence of other organisms, six symptomatic leaves infected with P. cubensis were collected from six different cucurbit fields (). Sporangia were washed from the leaf surface using water and collected by centrifugation at 1000 × g for 5 min. DNA was extracted from sporangia and each assay was performed as described above, using 1 ng template.
Non-sporulating plant samples
To test if the assays could detect the pathogens within plant tissue prior to sporulation, each assay was performed on DNA extracted from plant tissue presenting lesions, but having no observable sporulation under a dissecting microscope. Samples of P. cubensis were tested at Cornell University and P. humuli samples were tested at Oregon State University (). To produce diseased samples, young cucumber and hop plants were inoculated and incubated as described above. Control plants were mock-inoculated with sterile distilled water and processed similarly. At approximately 3 days post-inoculation, leaves with lesions but no sporulation were collected. For P. cubensis, DNA from one symptomatic leaf from each of five isolates, as well as three negative controls, was extracted using the CTAB method described above (Keb-Llanes et al. Citation2002). For P. humuli, 10 plants were inoculated with isolate HDM 490 using the methods of Mitchell et al. (Citation2011). Three days after inoculation, one angular lesion without sporulation was excised from each inoculated plant using a #10 cork borer. DNA was extracted from each leaf disc separately (for 10 biological replications per isolate), as well as three negative controls, using a rapid one-step extraction procedure (Steiner et al. Citation1995). The experiment was later repeated using isolate HDM 502.
For the LNA assay, three technical replicates of each plant sample described above were performed. For the cucumber samples infected with P. cubensis, the average Cq values and standard deviations were calculated using Bio-rad CFX Manager. For the hop samples infected with P. humuli, the Cq values and standard deviations were averaged from the 10 biological replicates per isolate (separate inoculations and DNA extractions) and three technical replications per biological replication, for a total of 30 replications averaged into one set of values per isolate. In addition, the HRM analysis was performed on these samples as described above in both laboratories.
Detection from air samples
To detect pathogen sporangia from air samples, spore traps were placed in a commercial hop yard and vegetable fields during the spring and summer of 2013 and 2014. The custom-built spore traps, similar to those previously described (Falacy et al. Citation2007; Gent et al. Citation2009) sampled air by rapidly spinning two stainless steel sample collection rods (stainless steel tig, 3 cm long, 1.2 mm diameter; J.W. Harris Co., Mason, Ohio), lightly coated with silicon high vacuum grease (Dow, Corning). The sampling rods were perpendicularly attached to each end of a horizontal rod (9 cm), which was fixed at its centre to a solar-powered motor (Mabuchi FR-500T-10750, 1950 rpm) (Gent et al. Citation2009). This allows approximately 106 litres of air to be sampled per minute, calculated using Pappus’s Theorem for volumes applied to spore traps (Frenz & Boire Citation1999). The rods were positioned at 1.5 m above the ground.
A total of 31 air samples were collected in 2013; in 2014, a total of 211 samples were collected (). In 2013, one trap located in a hop yard in Ontario County, NY was placed at 2 m distance from the edge of hop plantings. In 2014, seven spore traps were used, with one being placed in the same hop yard, three in vegetable fields in Ontario County, NY and three in vegetable fields in Suffolk County, NY (). For Field A (Ontario County), one spore trap was placed at the edge of a vegetable field at approximately 300 m distance from cucurbit crops. Two spore traps were placed in each of Fields B (Ontario County) and D (Suffolk County), where the traps were located at the opposite edges of the fields. The spore trap in Field C (Suffolk County) was at Cornell University field facility on Long Island (LIHREC). The spore traps in Fields B and C were less than 10 m and approximately 300 m, respectively, away from cucurbit sentinel plots. The spore traps in Field D were next to an organic mixed-vegetable plot on a farm that did not contain cucurbits and was located 3.5 km away from the sentinel plot containing cucurbits near Field C. Rods were collected and replaced two times a week in Ontario County and once a week in Suffolk County. Both rods per trap were placed in a single tube and DNA was extracted using a MoBio UltraClean Soil DNA Isolation Kit (MoBio) following manufacturer’s instructions, with 0.02 g mL−1 of polyvinyl pyrrolidone (PVP) added to buffer S1. Real-time PCR using LNA probes was performed twice per sample as described above, using 3 µL template. Real-time PCR was also conducted for a subset of samples on 1:2 and 1:10 dilutions of template and template spiked with 0.01 ng of total DNA (for both P. cubensis and P. humuli assays) to test for inhibition. To verify positive results, amplicons from spore trap DNA template were periodically cloned and sequenced, as described above.
Table 5. Spore trap placement in New York counties in 2013 and 2014.
Detection of P. cubensis was compared with timing of disease outbreaks occurring in the monitored region and when the CDM-IPM-PIPE system (Ojiambo & Holmes Citation2011) predicted inoculum was in the vicinity.
Results
Sequencing of the targeted cox2 gene region
A 534 bp portion of the cox2 gene was sequenced using the F26-R557 primers designed for this experiment () for the 15 P. cubensis and two P. humuli isolates collected in NY, which were used to develop the LNA and HRM assays. The sequences from the P. cubensis isolates aligned to previously sequenced GenBank accessions (Mitchell et al. Citation2011) with 100% identity and contained the one conserved SNP (at base 105) and semi-conserved SNPs at bases 343, 414 and 468, except for the isolates collected from squash: CDM13-10, CDM13-12 and CDM13-13. These three P. cubensis isolates instead matched the P. humuli cox2 sequence at bases 343, 414 and 468. However, the SNP at base 105 differentiated all P. cubensis and P. humuli isolates evaluated. The sequences have been deposited in GenBank ().
Sensitivity of real-time PCR with LNA probes
Sporangial detection
For both P. cubensis and P. humuli, the LNA assay detected DNA from extractions containing 10, 50, 100 and 500 sporangia in 10 out of 10 reactions. Neither assay could detect DNA from a single sporangium. Negative control reactions (n = 10) containing no sporangia yielded no amplification. The average Cq and standard deviations for the amplification of P. cubensis sporangia were: 10 sporangia, 29.71 ± 1.26 (<10 pg µL−1); 50 sporangia, 26.43 ± 1.94 (<10 pg µL−1); 100 sporangia, 26.12 ± 3.54 (90 pg µL−1); 500 sporangia, 25.02 ± 1.31 (93 pg µL−1). The average Cq and standard deviations for the amplification of P. humuli sporangia were: 10 sporangia, 33.32 ± 0.95 (<10 pg µL−1); 50 sporangia, 22.64 ± 0.96 (<10 pg µL−1); 100 sporangia, 23.75 ± 1.04 (106 pg µL−1); 500 sporangia, 22.70 ± 1.36 (111 pg µL−1).
Dilutions of total DNA
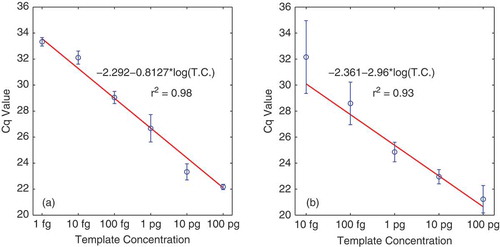
The HEX-labelled LNA probe specific to P. cubensis detected this pathogen with total DNA template at concentrations from 0.1 ng to 1 fg, with R2 = 0.98 (). The FAM-labelled LNA probe specific to P. humuli was able to detect dilutions from 0.1 ng to 10 fg, with R2 = 0.93 ().
Fig. 1 (Colour online) Linear regression of 10-fold dilutions of Pseudoperonospora cubensis (a) and P. humuli (b) DNA against corresponding mean quantification cycle values (Cq). Data points represent the means and standard deviations from three technical replicates for each of two biological replicates.
Mixed-DNA sample
To test the ability to detect each pathogen in mixed-DNA samples, the assay was performed with cloned fragments mixed at varying concentration ratios. Using the cloned fragment from either P. cubensis or P. humuli individually, amplification was observed for all DNA concentrations tested (). When 10 ng or 1 ng of plasmid DNA containing the P. cubensis sequence was mixed with 10 pg of plasmid DNA containing the P. humuli sequence, no detection of P. humuli DNA was observed. Detection of P. cubensis was observed in all mixtures. However, when 10 ng or 1 ng of DNA containing the P. humuli sequence was mixed with 10 pg of plasmid DNA containing the P. cubensis sequence, detection of P. cubensis occurred at much higher Cq values than reactions including only 10 pg of plasmid DNA containing the P. cubensis sequence ().
Specificity of LNA and HRM assays
Real-time PCR with LNA probes
The LNA assay correctly identified the 15 P. cubensis and seven P. humuli isolates used to develop the assay (). The Cq values from the detection of fluorescence from each LNA probe varied between single-lesion isolates, from 14.82 ± 0.22 (CDM13-12) to 25.07 ± 0.18 (CDM13-3) for P. cubensis isolates and from15.12 ± 0.24 (HDM 500) to 23.96 ± 1.47 (HDM NY 2013) for P. humuli isolates (). The nine additional P. humuli isolates tested at Oregon State University had Cq values that ranged from 27.52 ± 0.69 (HDM 503) to 32.38 ± 0.51 (HDM 505) (). No amplification was observed in negative control reactions lacking DNA template. There were no false positive detections among the 16 non-target organisms tested, including host plant DNA (see for microbe and plant DNA tested). The DNA from these non-target organisms did amplify using the ITS4-ITS5 or ITS4-ITS1 primers (White et al. Citation1990), ensuring the lack of amplification using the assay was not due to inhibition (data not shown).
High Resolution Melt curve (HRM) analysis
The HRM assay correctly identified the 15 P. cubensis and seven P. humuli isolates used to develop the assay (), as well as the nine additional P. humuli isolates tested at Oregon State University used to validate the assay (). The P. humuli target cox2 region melted at a slightly lower temperature than the P. cubensis target region due to the presence of the SNP, allowing differentiation between the two species (, ). No amplification was observed in negative control reactions lacking DNA template. There were no false positive detections among the 16 non-target organisms tested, including host plant DNA (see for microbe and plant DNA tested). depicts the HRM run which contained all of the samples listed in , all P. cubensis field-collected plant samples and P. cubensis-infected non-sporulating isolates, as well as non-target species for which no amplification or melt curves resulted. The HRM assay correctly differentiated P. cubensis from P. humuli when repeated at the laboratory at Oregon State University when tested with P. humuli isolates used for assay development or validation ().
Fig. 2 (Colour online) Melt (a) and difference (b) curves from a High Resolution Melt curve assay (HRM) for Pseudoperonospora cubensis and P. humuli samples. Each isolate was tested in duplicate. The assay differentiates the two species based on a single nucleotide polymorphism variation which allows for thermal denaturation divergence. The two species’ melting curves cluster separately, where P. cubensis samples are coloured red and P. humuli samples are coloured green. The run included DNA from all isolates listed in , including non-target controls, which did not amplify, and thus, do not appear on the graphs. In addition, this run included P. cubensis field samples, P. cubensis non-sporulating plant samples and two negative control wells.
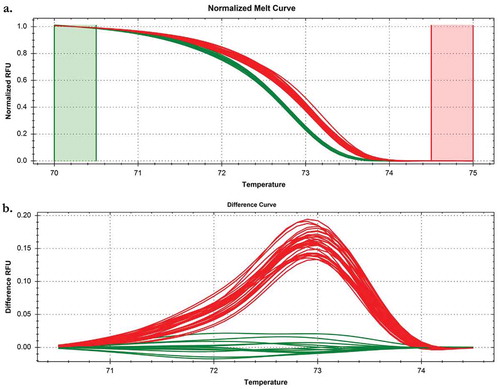
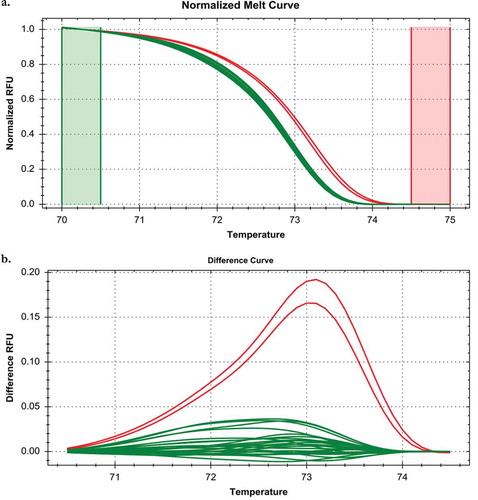
Fig. 3 (Colour online) Melt (a) and difference (b) curves from a High Resolution Melt curve assay for Pseudoperonospora cubensis and P. humuli conducted in a laboratory at Oregon State University. Each isolate was run in duplicate. Isolate CDM12-58 of P. cubensis is shown in red. Isolates of P. humuli are coloured in green, and include five isolates (HDM 490, 496, 500, 501 and 510) used for assay development and the nine isolates listed in used for assay validation.
Detection from plant samples
Real-time PCR with LNA probes accurately identified the six samples of P. cubensis sporangia washed from symptomatic leaves collected from the field and the five non-sporulating, symptomatic, leaves. The Cq values from field samples ranged from 20.14 ± 0.24 to 30.61 ± 0.65 (). The Cq values from non-sporulating samples ranged from 20.37 ± 0.61 to 23.51 ± 0.41 (). The assay also correctly identified P. humuli from infected non-sporulating lesions when performed at Oregon State University, with Cq values ranging from 29.01 ± 1.97 to 32.29 ± 3.35 in the first run of the experiment and 26.67 ± 1.29 to 29.44 ± 4.97 in the second run of the experiment. Averages of these value ranges are presented in for the first (non-sporulating 1) and second (non-sporulating 2) run of the experiment.
HRM melt curves from field and non-sporulating samples of P. cubensis () and non-sporulating samples of P. humuli (data not shown) clustered with the melt curves of single-lesion isolates from the correct species. No amplification was observed in negative control reactions lacking DNA template or from healthy plant tissue (negative controls are included in reaction results shown in , where no amplification curve from those reactions are visible).
Detection from air samples
Detection of P. cubensis
P. cubensis was not detected in the 31 samples collected in 2013 from the spore trap placed in the hop yard, nor the 56 samples from the hop yard in 2014. From the 165 air samples collected from cucurbit fields during 2014, four were positive for P. cubensis. The positive sampling dates were from Ontario County in field B (from spore trap #4 located at the west of the field) for the following dates in September: the 12th (Cq 32.73 ± 0.85), the 15th (27.55 ± 0.76), the 26th (34.14 ± 0.27) and the 29th (32.00 ± 0.60). This spore trap was within 10 m of cucurbit plantings and CDM was observed in the sentinel plot in this field on 11 September, one day prior to detection from air samples. The samples collected from Field A and Suffolk County did not test positive for P. cubensis. The spore traps in Suffolk County were 300 m to 3.5 km away from sentinel plots containing cucurbit crops, where only a small amount of CDM was observed on 2 September.
Detection of P. humuli
In 2013, a year when HDM was observed only periodically in the hop yard, P. humuli was detected intermittently by the LNA assay on various dates (from 3 May to 30 August) throughout the hop growing season (Supplementary Table 1). LNA assay detection of P. humuli in 2014 was limited to three sampling dates in late summer during the hop harvests (26 August, 5 September and 9 September; Supplementary Table 1). HDM symptoms were not observed in the hop yard in 2014. Pseudoperonospora humuli was also not detected from any spore traps located in vegetable fields in 2014. No hop plants or P. humuli inoculum was known to be near the vegetable fields where the spore traps were placed.
Discussion
Two assays were designed for the detection and diagnosis of P. cubensis and P. humuli. Real-time PCR with LNA probes and HRM protocols were based on SNP differences in the mitochondrial cox2 gene observed in a previous study investigating the relatedness of the two pathogens. In that study, Mitchell et al. (Citation2011) found that 18 of 21 isolates of P. cubensis contained four SNPs that differentiated them from 14 isolates of P. humuli, while for the three remaining isolates of P. cubensis, three of the four SNPs mentioned above matched those of P. humuli. One of the four SNPs was conserved among all isolates examined (Mitchell et al. Citation2011). These results were similar to those obtained in the present study, where 12 of 15 isolates of P. cubensis collected in NY contained the same four SNPs, while three isolates contained the same three of four SNPs mentioned above, which match those of P. humuli. Interestingly, in both the current study and that of Mitchell et al. (Citation2011), each of the P. cubensis isolates containing the non-conserved SNPs matching those of P. humuli originated from squash plants. These results support previous findings showing that P. cubensis isolates exhibit host specificity, as variations in virulence and pathogenicity of isolates have been observed on different cucurbit species (Thomas et al. Citation1987, Citation2014; Lebeda & Widrlechner Citation2003). More recently, whole-genome sequencing of isolates from different cucurbit hosts identified two distinct lineages among P. cubensis isolates, with isolates from cucumber and cantaloupe clustering separately from isolates of squash and watermelon, with the lineages exhibiting low cross-infectivity (Thomas et al. Citation2014).
The assays developed in this study are based on the conserved SNP at base 105 of the targeted cox2 region and are the first to allow specific detection of P. cubensis and P. humuli. A previous study successfully monitored P. humuli inoculum in a hop yard using a PCR assay targeting a portion of the ITS region (Gent et al. Citation2009). However, the primers used in the assay also may amplify P. cubensis DNA, and thus may be employed in areas where only one of the pathogens is found (Gent et al. Citation2009). In contrast, the LNA probes designed in this study correctly identified 15 isolates of P. cubensis and 16 isolates of P. humuli (, ), as well as infected leaves with or without sporulation (). The Cq values obtained by testing the different isolates of each pathogen varied, which could be due to varying amounts of host plant DNA in the template. This variation could not be avoided due to the obligate nature of the pathogens. The probes were sensitive, detecting as few as 10 sporangia (in 10 out of 10 biological replications) for both pathogens and as little as 1 fg P. cubensis total DNA and 10 fg P. humuli total DNA. Probe detection was also sensitive in the presence of non-target DNA, as observed in the mixed-species template tests, although we were unable to detect P. humuli when P. cubensis was present at 100–1000 fold greater concentrations. These results are similar to those reported by Rogers et al. (Citation2009) in their assay used to detect Sclerotinia sclerotiorum.
One unexpected result included the observation of similar Cq values for the detection of 50, 100 and 500 sporangia from both species. This trend is not believed to be due to the probes, but rather to the DNA extraction procedure. For example, from 100 and 500 P. cubensis and P. humuli sporangia, the DNA yields were similar. The yields were also low, on average 90–111 pg µL−1, with extractions from 50 sporangia yielding <10 pg µL−1, the minimum threshold for detection using the Qubit High Sensitivity DNA assay. The similar yields from the different numbers (100 and 500) of sporangia suggest that there may be some issue with isolating sporangial DNA using this kit. We do not think it is poor performance of the kit in general, since extractions from air sampling rods, which collect a small quantity of material, yielded, on average, 0.5–2 ng µL−1. We used the MoBio kits for the sensitivity test in order to maintain consistency with the DNA extraction from air samples. These kits were chosen because they were previously used to detect P. humuli from air samples; however, the previous assay relied on conventional PCR and therefore, does not provide Cq values or DNA quantities for comparison to our assay (Gent et al. Citation2009).
HRM analysis was accurate for all tested isolates using the cytosine/thymine SNP at base 105 in the cox2 gene fragment. This mismatch results in a large curve shift for genotypic differentiation (Venter et al. Citation2001). Accurate results from the testing of symptomatic leaf tissues indicate this would be a satisfactory diagnostic tool for field samples. HRM has been successfully used to diagnose pathogens from field-derived samples, such as pathovars of the olive bacterial pathogen, Pseudomonas savastanoi (Gori et al. Citation2012), closely related fungal Phyllosticta species on banana (Wong et al. Citation2013) and grapevine-leafroll virus variant groups (Bester et al. Citation2012). In these three studies, co-infected plant samples were identified by observing bifurcation of melt curves (Bester et al. Citation2012; Gori et al. Citation2012; Wong et al. Citation2013). However, with air samples, HRM did not reliably detect both pathogens in mixed-DNA samples (data not shown). We observed that the HRM assay detected the presence of the most dominant species, which could result in false-negative results depending on which organisms are actually present in the sample.
Because both P. cubensis and P. humuli were present in the geographic areas sampled, LNA probes were selected to detect P. cubensis and P. humuli from air samples, as they were highly specific and could accurately identify both species in a mixed-DNA sample (unlike the HRM assay). In Suffolk County, NY, there were no positive detections of P. cubensis from the three spore traps in 2014 (46 samples total). This was not surprising, as disease appeared late in the season (28 August) and disease severity remained low in the sentinel plots, which were at least 300 m away from the spore traps. Pseudoperonospora cubensis was detected in Ontario County, NY, starting on 12 September, which is about the time the disease was observed in the field (11 September). The pathogen was detected in only one spore trap, which was placed 10 m to the west of a cucurbit sentinel plot. In contrast, using a volumetric spore sampler and observation of sporangia using microscopy, Granke et al. (Citation2014) observed P. cubensis sporangia prior to planting crops and throughout the cucurbit growing season in Michigan. However, this method requires significantly more time and expertise to successfully employ (West et al. Citation2008). In addition, the presence of closely related species, such as P. humuli, can make morphological distinction difficult. PCR protocols have successfully detected pathogens prior to disease onset, such as Erysiphe necator, causal agent of powdery mildew of grape (Falacy et al. Citation2007). However, in other air sampling studies utilizing PCR, including the one previously designed to detect P. humuli (Gent et al. Citation2009), the pathogen was not detected until after disease symptoms were observed. Still, detecting increases in inoculum levels after disease onset contributes valuable information towards disease management programmes (West et al. Citation2008) and various experiments have focused efforts towards this goal (Carisse et al. Citation2009; Gent et al. Citation2009; Rogers et al. Citation2009; Duvivier et al. Citation2013; Klosterman et al. Citation2014).
In 2013, P. humuli was detected by LNA probes in the hop yard where the spore trap was located starting on 3 May, and sporadically during the growing season. This was expected, since HDM overwinters in the plant and sporulates on young basal shoots as they emerge (Coley-Smith Citation1962). Symptoms were observed periodically throughout the season on the hop plants in this yard, and the grower treated the vines with fungicide. In 2014, however, HDM was not observed in the field and the pathogen was not detected from spore traps until 22 August, when hop harvesting had begun and plants were disturbed. Based on the presence of disease symptoms, we assume the inoculum levels in 2013 were greater than in 2014, thereby facilitating detection throughout the season. These results are similar to those found by Gent et al. (Citation2009) in Oregon, where P. humuli was consistently detected only when disease was present.
Because previous experiments have observed PCR inhibition due to the grease used on the spore-trapping rods (Falacy et al. Citation2007; Klosterman et al. Citation2014), we randomly selected DNA extracted from rods that were negative for detection of our target pathogens and tested them in two ways: spiking samples with target pathogen DNA and dilution of samples (as described above) to ensure we did not report false negatives. No evidence of PCR inhibition was observed in DNA extracted from grease-coated rods.
In conclusion, the two assays described here are the first which allow for differentiation between the closely related pathogens P. cubensis and P. humuli. The LNA assays can be used for the detection of both pathogens from samples that could have mixtures of them, such as air samples, while both the LNA and HRM can be used for diagnosis of CDM and HDM from infected plant samples, including field and non-sporulating lesions.
Disclaimer
Mention of a trademark, proprietary product, or vendor does not constitute a guarantee or warranty of the product by the USDA and does not imply its approval to the exclusion of the products or vendors that may also be suitable.
Supplemental data
Supplemental data for this article can be accessed here: http://dx.doi.org/10.1080/07060661.2015.1053989.
Supplemental Material
Download MS Word (18 KB)Acknowledgements
We thank Holly Lange for supporting research in the laboratory and field.
Additional information
Funding
References
- Bester R, Jooste AE, Maree HJ, Burger JT. 2012. Real-time RT-PCR high resolution melting curve analysis and multiplex RT-PCR to detect and differentiate grapevine leafroll-associated associated virus 3 variant groups I, II, III and VI. Virol J. 9:219.
- Bissel E. 1877. Hop culture in New York. Am J Pharm. 49:538–543.
- Bustin SA, Benes V, Garson JA, Hellemans J, Huggett J, Kubista M, Mueller R, Nolan T, Pfaffl MW, Shipley GL, et al. 2009. The MIQE guidelines: minimum information for publication of quantitative real-time PCR experiments. Clinical Chem. 55:611–622.
- Carisse O, Tremblay DM, Lévesque CA, Gindro K, Ward P, Houde A. 2009. Development of a TaqMan real-time PCR assay for quantification of airborne conidia of Botrytis squamosa and management of botrytis leaf blight of onion. Phytopathology. 99:1273–1280.
- Choi Y-J, Hong S-B, Shin H-D. 2005. A re-consideration of Pseudoperonospora cubensis and P. humuli based on molecular and morphological data. Mycol Res. 109:841–848.
- Cohen Y, Rubin AE, Galperin M, Ploch S, Runge F, Thines M. 2014. Seed transmission of Pseudoperonospora cubensis. PlosOne. 9:e109766.
- Coley-Smith JR. 1962. Overwintering of hop downy mildew Pseudoperonospora humuli (Miy. and Tak.) Wilson. Ann Appl Biol. 50:235–243.
- Cornell Vegetable Program, Cornell Cooperative Extension. 2015. Cucumbers. [Internet]. [revised 2014 Jul 7; cited 2015 Feb 12]. Available from: http://cvp.cce.cornell.edu/crop.php?id=11
- Duvivier M, Dedeurwaerder G, Proft M, Moreau J-M, Legrève A. 2013. Real-time PCR quantification and spatio-temporal distribution of airborne inoculum of Mycosphaerella graminicola in Belgium. Eur J Plant Pathol. 137:325–341.
- Falacy JS, Grove GG, Mahaffee WF, Galloway H, Glawe DA, Larsen RC, Vandemark GJ. 2007. Detection of Erysiphe necator in air samples using the polymerase chain reaction and species-specific primers. Phytopathology. 97:1290–1297.
- Frenz DA, Boire AA. 1999. Pollen recovery in atmospheric samples collected with the rotorod sampler over multiple-day periods such as weekends. Ann Allergy Asthma Immunol. 83:217–221.
- Garritano S, Gemignani F, Voegele C, Nguyen-Dumont T, Le Calvez-Kelm F, De Silva D, Lesueur F, Landi S, Tavtigian SV. 2009. Determining the effectiveness of high resolution melting analysis for SNP genotyping and mutation scanning at the TP53 locus. BMC Genet. 10:5.
- Gent DH, Mahaffee WF, McRoberts N, Pfender WF. 2013. The use and role of predictive systems in disease management. Annu Rev Phytopathol. 51:267–289.
- Gent DH, Nelson M, Grove G. 2008. Persistence of phenylamide insensitivity in Pseudoperonospora humuli. Plant Dis. 92:463–468.
- Gent DH, Nelson ME, Farnsworth JL, Grove GG. 2009. PCR detection of Pseudoperonospora humuli in air samples from hop yards. Plant Pathol. 58:1081–1091.
- Gori A, Cerboneschi M, Tegli S. 2012. High-resolution melting analysis as a powerful tool to discriminate and genotype Pseudomonas savastanoi pathovars and strains. PLoS One. 7:1–13.
- Gouy M, Guindon S, Gascuel O. 2010. SeaView version 4 : a multiplatform graphical user interface for sequence alignment and phylogenetic tree building. Mol Biol Evol. 27:221–224.
- Granke LL, Morrice JJ, Hausbeck MK. 2014. Relationships between airborne Pseudoperonospora cubensis sporangia, environmental conditions, and cucumber downy mildew severity. Plant Dis. 98:674–681.
- Johnson MP, Haupt LM, Griffiths LR. 2004. Locked nucleic acid (LNA) single nucleotide polymorphism (SNP) genotype analysis and validation using real-time PCR. Nucleic Acids Res. 32:e55.
- Keb-Llanes M, Gonzalez G, Chi-Manzanero B, Infant ED. 2002. A rapid and simple method for small-scale DNA extraction in Agavaceae and other tropical plants. Plant Mol Biol Report. 20:299–299.
- Klosterman SJ, Anchieta A, McRoberts N, Koike ST, Subbarao K, Voglmayr H, Choi Y, Thines M, Martin FN. 2014. Coupling spore traps and quantitative PCR assays for detection of the downy mildew pathogens of spinach (Peronospora effusa) and beet (P. schachtii). Phytopathology. 104:1349–1359.
- Koshkin AA, Nielsen P, Meldgaard M, Rajwanshi VK, Singh SK, Wengel J. 1998a. LNA (Locked Nucleic Acid): an RNA mimic forming exceedingly stable LNA:LNA duplexes. J Amer Chem Soc. 120:13252–13253.
- Koshkin AA, Singh SK, Nielsen P, Rajwanshi VK, Kumar R, Meldgaard M, Olsen CE, Wengel J. 1998b. LNA (Locked Nucleic Acids): synthesis of the adenine, cytosine, guanine, 5-methylcytosine, thymine and uracil bicyclonucleoside monomers, oligomerisation, and unprecedented nucleic acid recognition. Tetrahedron. 54:3607–3630.
- Lebeda A, Cohen Y. 2011. Cucurbit downy mildew (Pseudoperonospora cubensis)—biology, ecology, epidemiology, host-pathogen interaction and control. Eur J Plant Pathol. 129:157–192.
- Lebeda A, Widrlechner MP. 2003. A set of Cucurbitaceae taxa for differentiation of Pseudoperonospora cubensis pathotypes. J Plant Dis Prot. 110:337–349.
- Livak KJ. 1999. Allelic discrimination using fluorogenic probes and the 5′ nuclease assay. Genet Anal. 14:143–149.
- Mackay JF, Wright CD, Bonfiglioli RG. 2008. A new approach to varietal identification in plants by microsatellite high resolution melting analysis: application to the verification of grapevine and olive cultivars. Plant Meth. 4:8.
- Mitchell MN, Ocamb CM, Grünwald NJ, Mancino LE, Gent DH. 2011. Genetic and pathogenic relatedness of Pseudoperonospora cubensis and P. humuli. Phytopathology. 101:805–818.
- Northeast Hop Alliance. 2012. NYS hops educators [Internet]. [revised 2015 Feb 13; cited 2015 Feb 18]. Available from: http://nehopalliance.org/
- Ojiambo PS, Holmes GJ. 2011. Spatiotemporal spread of cucurbit downy mildew in the eastern United States. Phytopathology. 101:451–461.
- Pérez B, Martinez E, Barreto D. 2003. Recent outbreaks of hop downy mildew in the south Andean region of Argentina. Phytopathology. 93:S71. (abstr.).
- Rogers SL, Atkins SD, West JS. 2009. Detection and quantification of airborne inoculum of Sclerotinia sclerotiorum using quantitative PCR. Plant Pathol. 58:324–331.
- Royle DJ, Kremheller HT. 1981. Downy mildew of the hop. In: Spencer DM, editor. The downy mildews. New York: Academic Press; p. 395–419.
- Runge F, Thines M. 2012. Reevaluation of host specificity of the closely related species Pseudoperonospora humuli and P. cubensis. Plant Dis. 96:55–61.
- Savory EA, Granke LL, Quesada-Ocampo LM, Varbanova M, Hausbeck MK, Day B. 2011. The cucurbit downy mildew pathogen Pseudoperonospora cubensis. Mol Plant Pathol. 12:217–226.
- Sirrine RJ, Rothwell N, Lizotte E, Goldy R, Marquie S, Brown-Rytlewski DE. 2010. Sustainable hops production in the Great Lakes region. Michigan State University Extension Bulletin E-3083. Publisher: Michigan State University Extension.
- Skotland CB, Johnson DA. 1983. Control of downy mildew of hops. Plant Dis. 67:1183–1185.
- Steiner JJ, Poklemba CJ, Fjellstrom RG, Elliott LF. 1995. A rapid one-tube genomic DNA extraction process for PCR and RAPD analyses. Nucleic Acids Res. 23:2569–2570.
- Thomas A, Carbone I, Ojiambo P. 2014. Comparative genomic analysis of Pseudoperonospora cubensis to elucidate the genetic basis of host specialization. Phytopathology. 104:118. (abstr.).
- Thomas CE, Inaba T, Cohen Y. 1987. Physiological specialization in Pseudoperonospora cubensis. Phytopathology. 77:1621–1624.
- Ugozzoli LA, Latorra D, Pucket R, Arar K, Hamby K. 2004. Real-time genotyping with oligonucleotide probes containing locked nucleic acids. Anal Biochem. 324:143–152.
- USDA National Agricultural Statistics Service. 2013. Vegetable summary [Internet]. [revised 2013 Mar; cited 2015 Feb 8]. Available from: http://www.nass.usda.gov/Publications/Todays_Reports/reports/vgan0314.pdf
- Venter JC, Adams MD, Myers EW, Li PW, Mural RJ, Sutton GG, Smith HO, Yandell M, Evans CA, Holt RA, et al. 2001. The sequence of the human genome. Science. 291:1304–1351.
- West JS, Atkins SD, Emberlin J, Fitt BDL. 2008. PCR to predict risk of airborne disease. Trends Microbiol. 16:380–387.
- White TJ, Bruns T, Lee S, Taylor J. 1990. Amplification and direct sequencing of fungal ribosomal RNA genes for phylogenetics. In: Innis MA, Gelfand DH, Sninsky JJ, White TJ, editors. PCR protocols: a guide to methods and applications. New York: Academic Press.
- Wittwer CT. 2009. High-resolution DNA melting analysis: advancements and limitations. Hum Mutat. 30:857–859.
- Wong M-H, Henderson J, Drenth A. 2013. Identification and differentiation of Phyllosticta species causing freckle disease of banana using high resolution melting (HRM) analysis. Plant Pathol. 62:1285–1293.