
Abstract
Moniliophthora roreri – the causal agent of frosty pod rot (FP) disease – is one of the most devastating cacao pathogens in Ecuador and worldwide. The centre of diversity of this pathogen is believed to be in areas near Ecuador or Colombia but molecular, morphological and growth studies of this pathogen in Ecuador are scarce. Monosporic cultures of M. roreri from the six cacao-producing regions of Ecuador, including Esmeraldas, El Oro, Los Rios, Guayas, Manabi and Amazon were obtained. Morphological characteristics, such as mycelial growth, colony shape, colour and texture, as well as type and size of meiospores, were recorded for each isolate. Molecular variation was assessed by direct sequencing the ITS1, 5.8 s, and ITS2 rDNA regions as well as by RFLP analyses on the same regions. Results showed little variation of morphological traits across isolates. Mycelial growth rate fitted to a Gompertz model with parameters estimates that were significantly affected by mycelial colour. Molecular analysis data showed an average polymorphism of 48.98% and Shannon’s diversity index of 0.21. Multiple discriminant analyses carried out on the RFLP patterns showed a 100% accurate grouping by both sampling province and mycelial colour.
Résumé
Moniliophthora roreri – l’agent causal de la maladie de la pousse gelée – est un des agents pathogènes les plus dévastateurs du cacao en Équateur et partout dans le monde. On croit que le centre de la diversité génétique de cet agent pathogène est situé dans les régions bordant l’Équateur ou la Colombie, mais, en Équateur, les études moléculaires, morphologiques et de croissance sur le sujet sont rares. Des cultures de spores individuelles de M. roreri provenant des six régions productrices de cacao de l’Équateur, y compris Esmeraldas, El Oro, Los Rios, Guayas, Manabi et Amazone, ont été obtenues. Les caractéristiques morphologiques de chaque isolat, telles que la croissance mycélienne, la forme de la colonie, la couleur et la texture, de même que le type et la grosseur des méiospores, ont été notées. La variation moléculaire a été évaluée par séquençage direct des régions de l’ITS1, 5.8s, et de l’ITS2 de l’ADNr, ainsi que par analyse du RFLP des mêmes régions. Les résultats ont montré, chez tous les isolats, peu de variations quant aux traits morphologiques. Le taux de croissance mycélienne a correspondu à un modèle de Gompertz dont les évaluations des paramètres étaient significativement influencées par la couleur du mycélium. Les données de l’analyse moléculaire ont affiché un polymorphisme moyen de 48.98% et un indice de Shannon de 0.21. L’analyse discriminante multiple appliquée aux bandes du RFLP a affiché un regroupement précis à 100% par province d’échantillonnage et couleur de mycélium.
Introduction
Cacao (Theobroma cacao) trees are the source of chocolate, one of the most consumed products worldwide, and cacao beans can be classified as ‘fine flavour’ or ‘bulk/ordinary’ depending on the aroma of the beans (Argout et al. Citation2008). Among the fine flavour group, the Ecuador-native ‘Nacional’ type of cacao is one of the most preferred by consumers because of its excellent aroma (CacaoWeb Citation2003). However, fine flavour cacao – especially the Nacional cacao – are more susceptible to diseases such as frosty pod rot (FP) when compared with bulk cacao (Loor et al. Citation2009).
Ecuador is the top producer and exporter of fine flavour cacao (Freire Citation2012) with extensive production zones located in the provinces of Esmeraldas, Manabi, Guayas, Los Ríos and El Oro, as well as in the Amazon region (Pino Citation2010). Fine flavour cacao is also a significant source of income for other countries of South America (CacaoWeb Citation2003). Fungal diseases, such as FP caused by Moniliophthora roreri (Cif & Par) Evans et al. have caused significant losses in the cacao production areas of Ecuador and Costa Rica with continuous spread to Mexico and Peru (Argout et al. Citation2008). FP disease is considered a major threat to the production of fine flavour cacao in developing countries and around 25% of the production of Nacional cacao has been downgraded to bulk cacao in Ecuador mostly because of FP (Loor et al. Citation2009).
Ecuador has traditionally been considered as the origin of FP but recent studies have shown higher levels of genetic diversity in Colombia, where the origin of the disease might actually have occurred (Phillips-Mora et al. Citation2007), suggesting the upper Magdalena Valley as the possible centre of origin of M. roreri (Ali et al. Citation2015). Phillips-Mora et al. (Citation2007) reported intermediate molecular variability of the isolates from Ecuador but the variability within the country’s regions was not assessed.
Fungal diversity can be assessed through evaluation of the internal transcriber spacer (ITS) regions of rDNA by direct sequencing or by analysis of restriction fragment length polymorphism (RFLP), among other variants. Analysis of ITS-RFLP is considered a better tool for detecting polymorphism when compared with ITS sequencing (Nakamura et al. Citation1998; Choi & Min Citation2000) but the latter allows comparison with sequences deposited in databases. Analysis of ITS-RFLP has allowed diversity assessment of important fungal and fungal-like species, including Fusarium oxysporum Schltdl. (Dubey et al. Citation2010), Ampelomyces quisqualis Ces. (Kiss Citation1997), Phytophthora spp. (Bonants et al. Citation2000), Trametes, Phanerochaete and Gloeophyllum spp. (Prewitt et al. Citation2008). Similar diversity analyses including amplified fragment length polymorphism (AFLP) and inter-simple sequence repeat (ISSR) have been carried out on M. roreri isolates (Phillips-Mora et al. Citation2007) but no RFLP analyses of the pathogen can be found in the literature.
Morphological characteristics of fungi – including mycelial colour – can provide insights about various molecular and functional traits of pathogens. Significant correlations between mycelial colour and growth rate have been described in several fungal species (Mamede et al. Citation2006; Sharma & Atri Citation2013). Additionally, a complete morphological characterization of fungi can provide important information for preliminary identification of pathogens. Mycelial colour and meiospore shape have been used as an initial means of identification of M. roreri on first reports of the pathogen in Belize (Phillips-Mora et al. Citation2006), Mexico (Phillips-Mora et al. Citation2006) and Bolivia (Phillips-Mora et al. Citation2015). Additionally, other studies have also assessed the morphological characteristics of M. roreri isolates from Mexico (Cuervo-Parra et al. Citation2011) and Colombia (Arbelaez Citation2010). However, some morphological and physiological characteristics of the pathogen are still unresolved (Aime & Phillips-Mora Citation2005) and no morphological characterization of Ecuadorian isolates of M. roreri can be found in the literature.
The aim of this research was to characterize the morphological and molecular diversity of M. roreri isolates from the top six cacao-producing regions of Ecuador, namely Esmeraldas, Manabí, Guayas, Los Rios, El Oro and the Amazon regions. Understanding the molecular and morphological diversity of this pathogen is an important step towards the establishment of an effective resistance breeding programme and other control mechanisms (Ali et al. Citation2015).
Materials and methods
Moniliophthora roreri isolates
Four-month-old pods of Theobroma cacao showing FP symptoms, including pod deformation, premature ripening and chocolate-coloured pod lesions with creamy-coloured mycelium, as well as internal pod tissues showing a necrotic compact mass surrounded by a decaying watery substance (Phillips-Mora et al. Citation2006), were collected from the Ecuadorian cacao-producing provinces of Esmeraldas, Manabí, Los Ríos, Guayas and El Oro as well as the Amazon region. Two farms of each selected region were sampled, and a total of 20 symptomatic and five non-symptomatic-control pods were randomly collected from each farm. The distance between sample collection points in each farm was about 10–15 metres. Prior to farm selection, the presence of FP in each farm was preliminarily estimated by calculating the proportion of symptomatic cacao pods. The presence of other diseases, including witches’ broom and black pod rot, was also estimated and samples were collected from farms with the lowest rates of non-FP diseases to avoid interference. Sampled pods that showed symptoms of other diseases were not considered for this study.
Cacao pods showing intermediate or initial stages of necrosis were cut into small sections and placed onto MEA (malt extract agar, Oxoid), and incubated at 27°C for 48 h to allow the formation of small pieces of mycelia distinctive of M. roreri. Selected mycelia were then transferred to MEA plates and incubated at 27°C for 7 days. Meiospores formed on the Petri plates were then suspended in water (106 meiospore mL−1) and 10 µL of the suspension were transferred to WA (water agar, Oxoid) and incubated at 27°C for 24-48 h. With the aid of a stereomicroscope, germinated meiospores were then transferred to MEA plates and incubated at 27°C for 20 days. Fungal mycelial plugs (4 mm diameter) were then transferred to MEA and kept at 27°C for 15 days prior to morphological evaluation. A total of 90 isolates were obtained.
Morphological identification
All 90 isolates of M. roreri were evaluated on colour, radial growth, texture, colony edge and meiospore shape using the classification scale shown in , modified from Arbelaez (Citation2010). Growth of M. roreri isolates was assessed by daily measurement of the fungal colony radius when growing in MEA for 15 days at 27°C in sealed plates incubated without light. Radial growth was reported as the average of measurements from the centre of the colony to five different points of the edge. Four replicates of each isolate were used, and data were fitted to the Gompertz model for fungal growth shown in the following equation (Mamede et al. Citation2006):
Table 1. Morphological variables of M. roreri isolates observed after 15 days growth on malt extract agar at 27°C.
Y = exp {α exp [− exp (β − γ X)]} where Y is the radial growth in mm, X is the time in days, and α, β and γ are the model parameters. Equation fit was carried out using the non-linear function in XLSTAT 2013.5.01 (Addinsoft, NY, USA).
ITS-RFLP and sequencing
Fungal mycelia were transferred to yeast malt broth (3 g L−1 malt extract, 3 g L−1 yeast extract, 5 g L−1 peptone and 10 g L−1 glucose) and incubated in darkness with agitation at 120 rpm for 15 days at 27°C. A 2-μm filter was used to separate the fungal mycelia from the liquid medium. Mycelia were then washed with distilled water and dried at 60°C for 48 h. Dried mycelia were ground, and DNA was extracted exactly as described elsewhere (Blin & Stafford Citation1976), and the rDNA internal transcribed spacer region (ITS) was amplified using the protocol described in previous studies (Phillips-Mora et al. Citation2007). Briefly, a reaction mix containing 2 μL of DNA, 0.5 μL of dNTP (final concentration of 0.20 mM), 0.5 μL each of the forward and reverse primers ITS5 (5′GGAAGTAAAAG TCGTAACAAGG3′) and ITS4 (5′-TCCTCCGCTTATTGATATGC-3′), 18.17 μL of water, 2.5 μL of 10× Amplitaq® Gold Buffer (Applied Biosystems, USA), 1 μL of MgCl2 (2 mM) and 0.33 μL of Amplitaq® Gold Taq polymerase (1U μL−1) in a total reaction volume of 25 μL was prepared. The PCR amplification was performed with an initial heating of 94°C for 1 min, followed by 30 cycles of 94°C for 1 min, 52°C for 30 s and 72°C for 1 min (extension), followed by a final step at 72°C for 10 min. The cleaned PCR products of 64 representative isolates of the sampled-regions and colour groups were submitted for sequencing and typical sequences were deposited into GenBank with accession numbers KF640238–KF640246. For RFLP analyses, PCR products were digested using the enzymes HaeIII, Hha I, RsaI and Alu I separately, following the manufacturer’s protocol. The fragments generated were electrophoresed in a 1.0% agarose gel run in TAE 1× (Tris base, boric acid and EDTA 0.5 M, pH 8.0) at 120 volts for 20 min using 5 μL of PCR product with 1 μL of loading dye (Promega, USA). Gel images were analysed using the program Imager Gel Doc XR (Bio-Rad, Philadelphia, PA), and the size of each DNA fragment was estimated using 100 bp Low DNA Mass™ Ladder (Invitrogen™).
Statistical analysis
Bands generated by RFLP were recorded onto a data matrix by assigning a value of 0 or 1 for every time a band was absent or present, respectively. The program Popgene 32 (https://sites.ualberta.ca/~fyeh/popgene) was used to determine the Shannon’s diversity index (Hs), and the software AFLP-SURV (Vekemans et al. Citation2002) was used to calculate the percentage of polymorphism (PL) at the 5% level and the expected heterozygosity (He) – Nei’s gene diversity (Nei Citation1973) – following the Lynch and Milligan (Citation1994) method. Additionally, a dendrogram of the ITS-RFLP profile was built using DendroUPGMA (Garcia-Vallve et al. Citation1999; Santi Citation2009) with 100 bootstrap replicates, and a multiple discriminant analysis (MDA) was carried out using XLSTAT 2013.5.01 (Addinsoft, NY, USA) using sampling region or mycelial colour as the discriminatory variables.
Phylogenetic analysis of sequence data were performed using the program MEGA 5.2 (Tamura et al. Citation2011) and the consensus sequences were aligned with sequences of M. roreri isolates obtained from NCBI. A phylogenetic tree was obtained using the Neighbour-joining method using sequences from this study and others reported in the NCBI database. All analyses were conducted using 2000 bootstrap interactions and nodes showing bootstrap values above 60 were labelled. All statistical analyses were carried out in XLSTAT 2013.5.01 and significance was reported at P < 0.05.
Results
Morphological characterization of M. roreri strains
A total of 90 isolates of M. roreri were obtained as follows: 34 isolates were from the Amazon region, 14 from El Oro, 10 from Esmeraldas, 15 from Los Rios, three from Guayas, and 14 from Manabí (Supplementary ). The presence of FP averaged 65, 53, 27, 64 and 47% in the farms from Esmeraldas, Manabi, Guayas, Los Rios and El Oro, respectively.
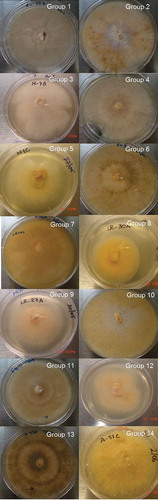
Each isolate was classified into one of the 14 colour groups (). Representative isolates of each colour group are shown in . Colour groups 1, 2, 5 and 14 contained the highest numbers of isolates with 12.2, 12.2, 10 and 13.3% of the isolates tested, respectively. No significant relationship (P = 0.07) between colour groups and province was found by Chi-square tests.
Table 2. Percentage of isolates of M. roreri classified into each group described in .
Fig. 1 (Colour online) Representative images of isolates belonging to the colour groups from 1 to 14 described in . The number in each figure represents the colour group from .
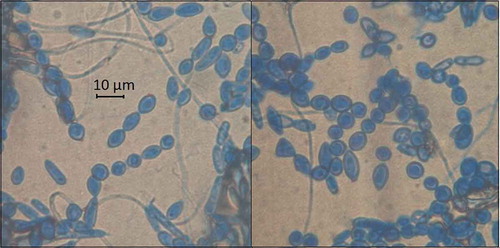
All the isolates of M. roreri showed regular colony edges and powdery texture. However, the shape of the meiospores was uniformly distributed among globose (35.7%), subglobose (35.7%) and elliptical (28.6%). No significant differences (P < 0.05) were found when comparing meiospore shapes in proportion to M. roreri isolates. Meiospore size ranged from 9.3–11.6 µm in length by 6.3–7.5 µm in width. shows the meiospore of representative isolates of the pathogen.
Fig. 2 (Colour online) Representative meiospore of M. roreri strains isolated from six regions of Ecuador.
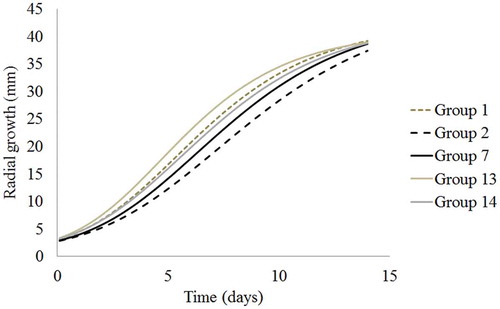
Radial growth of each strain was fitted to the Gompertz model with an R2 value of 0.994 or higher and a mean square error (MSE) of 1.14 or lower. Results showed a significant effect (P < 0.05) of the colour grouping on the model parameters α, β and γ but no significant effect of the sampling province on the model parameters was observed. Similarly, a significant effect of the colour grouping on the model parameters α, β and γ was observed within each region sampled. Therefore, further analyses were based on colour groups. shows the parameter estimates of α, β and γ. The parameter γ showed the highest influence on the mycelial growth rate and was used to classify M. roreri into very fast, fast, intermediate, moderate and slow growing isolates. Moniliophthora roreri isolates from groups 3, 12 and 13 showed a very fast growth (P < 0.05). A fast growth was observed in strains from groups 1 and 8. Strains from group 14 showed an intermediate growth while isolates from groups 4, 5, 6, 7, 10 and 11 showed a moderate growth rate. Finally, the slowest growth (P < 0.05) was found in isolates from group 2 ().
Table 3. Parameter estimates based on the Gompertz model fitted to the growth of M. roreri isolates classified according to the colour groupings from .
Fig. 3 (Colour online) Growth curve of M. roreri isolates from colour groups that showed significant growth differences (P < 0.05) fitted to a Gompertz model.
Molecular analyses
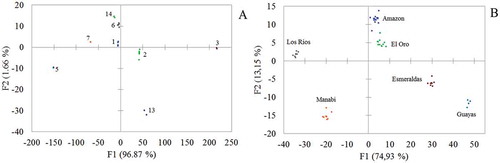
To determine the molecular variation of M. roreri isolates from Ecuador, ITS-RFLP was run on each isolate. shows representative gel photographs of the ITS-RFLP tests. The average heterozygosity (He) and per cent polymorphism (PL) were 0.18 and 48.98%, respectively (). The genetic diversity values obtained by Nei’s and Shannon indexes for the whole sampled population were 0.118 and 0.20, respectively. Expected heterozygosity and Shannon’s index are traditional measures of fungal genetic diversity (Dighton et al. Citation2010). A UPGMA dendrogram using Nei’s genetic distance was built but no significant correlation with either sampling province or colour group was observed. Multiple discriminant analyses using the ITS-RFLP band profile were carried out and 100% discrimination was observed when using sampling province or colour groups as dependent variables ().
Table 4. Genetic diversity of the six groups of M. roreri strains.
Fig. 4 Representative gel photograph of PCR-RFLP of the ITS1-ITS2 regions of M. roreri using restriction enzymes. The lane numbers on the gels correspond to the sample codes in Supplementary . M indicates the DNA ladder.
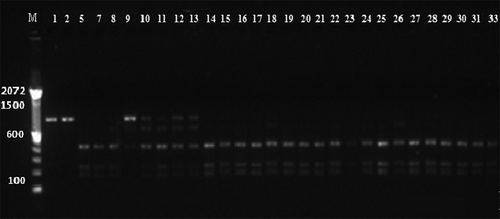
Fig. 5 (Colour online) Factors 1 and 2 (F1 and F2) of the multiple discriminant analyses of ITS-RFLP patterns of M. roreri isolates grouped by colour (a) and provinces (b).
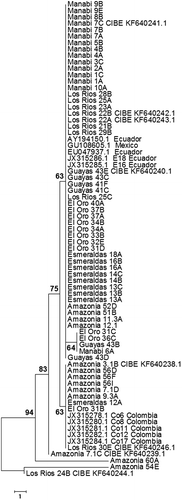
The ITS sequences obtained from this study were compared with those from the NCBI database. The greatest similarity (98% or higher) was observed with sequences from accessions GU108605.1 from Mexico, as well as accessions AY194150.1 and EU047937.1 from Ecuador and accessions JX315278.1, JX315280.1, JX315281.1, JX315282.1, JX315284.1 from Colombia. The phylogenetic tree () showed that most of the Ecuadorian isolates grouped with isolates from Mexico and Ecuador in one single clade, whereas various isolates from the Amazon region as well as one isolate from Esmeraldas, El Oro and Los Rios, respectively, grouped with the Colombian isolates in a separate clade. Isolates Amazon 54E and Los Rios 24B did not show close similarity with the rest of the sequences from the tree (). To determine the polymorphic nucleotides in the ITS1, 5.8 s and ITS2 regions, sequences obtained in this study were aligned to selected sequences of Ecuadorian isolates found in GenBank. Seven polymorphic nucleotides were observed ().
Table 5. Polymorphic nucleotides detected in the ITS1, 5.8 s, and ITS2 regions of representative isolates of M. roreri obtained in this study and compared with isolates from Ecuador previously deposited in GenBank.
Fig. 6 Neighbor-joining tree of the ITS1, 5.8 s and ITS2 region of the representative isolates obtained in this study and the most similar isolates from GenBank. The bootstrap values of 2000 interaction are also shown.
Discussion
The highest number of isolates of M. roreri was obtained from the Amazon region while the lowest was from the Guayas province. The Guayas province is known to have the lowest incidence of FP disease in Ecuador due to weather conditions less favourable to the disease (Villavicencio Citation2010). Other diseases such as witches’ broom and black pod rot were also present in all sampled provinces. To avoid sampling pods at pre-symptomatic stages of non-FP diseases, farms with the lowest presence of non-FP diseases were sampled.
The mycelial colours observed in this study are in agreement with those reported in previous studies. Considerable colour variability ranging from white to cream-salmon to dark brown has been observed in the mycelia of M. roreri cultivated in either modified V8 media (Phillips-Mora et al. Citation2006), PDA (Cuervo-Parra et al. Citation2011) or MEA (Arbelaez Citation2010). Differences in M. roreri mycelial colour tones have previously been associated with fungal growth stages (Phillips-Mora et al. Citation2006; Cuervo-Parra et al. Citation2011). In this study, mycelial colour variability was observed at the same point of the growth curve, suggesting that this trait does not necessarily correlate to the growth stage but is rather a phenotypic characteristic of each strain and a diversity indicator.
All the M. roreri strains showed regular colony edges and powdery texture similar to the characteristics previously reported (Evans Citation1986). Strong evidence that M. roreri conidia are in fact meiospores can be found in the literature (Evans et al. Citation2003), and discussion about amending the generic description of the genus or establishing a new genus for M. roreri has been proposed (Evans et al. Citation2013). In this study, we refer to the M. roreri spores as meiospores. Meiospore shape and size were also within the ranges described elsewhere, including previous studies reporting 59% of globose/subglobose and 34% of ellipsoid meiospores ranging from 5–11 × 8–20 µm in size (Phillips-Mora et al. Citation2006).
Growth of M. roreri isolates was within the range of 1.6 to 6.2 mm day−1 as previously reported (Phillips-Mora Citation2003). However, no attempt to model the mycelial growth of the pathogen can be found in the literature. In this study, the growth of M. roreri followed the Gompertz model previously used for describing the growth of other fungal species (Mamede et al. Citation2006). A significant effect of the mycelial colour on the parameter estimates of the Gompertz model was observed. Relationships between mycelial colour and growth rate have been described in several fungal species (Mamede et al. Citation2006; Sharma & Atri Citation2013) but this is the first quantitative description of mycelial growth and its association to colour in M. roreri. Further research is needed to establish the potential molecular connections between mycelial growth and colour.
Analysis of the ITS region showed high levels of genetic diversity among the M. roreri isolates. A previous study showed a lower diversity of Ecuadorian M. roreri when compared with Colombian isolates. Colombian isolates showed values of PL of 46.6% and a Shannon’s diversity index (Hs) of 0.2 ± 0.06 while Ecuadorian isolates presented values of PL and Hs of 38.1% and 0.15 ± 0.04, respectively, suggesting Colombia as the centre of diversity of M. roreri (Phillips-Mora et al. Citation2007). However, the statistical significance of the observed differences was not stated but a close examination of the reported means, standard errors and sample sizes (36 for Ecuador and 16 for Colombia) by t-tests suggests that there were no significant diversity differences between Ecuadorian and Colombian groups of M. roreri. In our research the observed values of PL of 48.98% and a Hs of 0.21 were not significantly different from those obtained in previous studies for Ecuadorian and Colombian isolates (Phillips-Mora et al. Citation2007) but the number of polymorphic nucleotides was lower when compared with previous reports (Phillips-Mora et al. Citation2007; Cuervo-Parra et al. Citation2011). Interestingly, M. roreri sample groups from Los Rios and Manabi presented levels of polymorphism of 100% and 93.8%, respectively. Similarly, the molecular diversity as determined by the expected heterozygosity was the highest in Los Rios and Manabi provinces. The high diversity of Ecuadorian isolates was particularly observed in isolates Amazon 54E and Los Rios 24B which did not cluster with the other M. roreri groups in the phylogenetic tree (). Expected heterozygosity results are within the range of those reported in previous studies (Melo et al. Citation2014). However, recent reports found no heterozygosity in single nucleotide polymorphism markers of M. roreri isolates analysed through RNA sequencing (Ali et al. Citation2015).
Clustering was carried out by UPGMA and MDA. Clustering by UPGMA relies on pairwise similarities of the samples analysed with no relationship to response variable. On the other hand, MDA attempts to explain a response variable through a linear combination of quantitative characteristics. As data behaviour may differ from one kind of sample to another, a single clustering method might not always be optimal or effective in revealing genetic associations (Mohammadi & Prasanna Citation2003). No clustering was observed when using UPGMA but a 100% grouping accuracy was achieved by both sampling province and mycelial colour when using MDA. Despite some favourable attributes in UPGMA, the underlying assumptions might not be met, affecting the overall results (Mohammadi & Prasanna Citation2003). Discriminant analyses have been carried out in RFLP-based studies showing high levels of sample discrimination (Park et al. Citation2006). The high accuracy obtained in this study suggests the potential use of MDA as a tool for verification of the origin of M. roreri isolates. In conclusion, Ecuadorian isolates of M. roreri showed a high morphological and molecular diversity and the mycelial colour of the pathogen can be associated with growth rate or ITS-RFLP profile.
Supplementary Table 1
Download MS Word (55.4 KB)Additional information
Funding
Related Research Data
References
- Aime MC, Phillips-Mora W. 2005. The causal agents of witches’ broom and frosty pod rot of cacao (chocolate, Theobroma cacao) form a new lineage of Marasmiaceae. Mycologia. 97:1012–1022.
- Ali SS, Shao J, Strem MD, Phillips-Mora W, Zhang D, Meinhardt LW, Bailey BA. 2015. Combination of RNAseq and SNP nanofluidic array reveals the center of genetic diversity of cacao pathogen Moniliophthora roreri in the upper Magdalena Valley of Colombia and its clonality. Front Microbiol. 6:1–13.
- Arbelaez L. 2010. Analisis de la diversidad intraespecie de Moniliophthora roreri por medio de marcadores morfologicos y geneticos. [dissertation]. Medellín: Universidad Nacional de Colombia sede Medellin.
- Argout X, Fouet O, Wincker P, Gramacho K, Legavre T, Sabau X, Risterucci AM, Da Silva C, Cascardo J, Allegre M, et al. 2008. Towards the understanding of the cocoa transcriptome: production and analysis of an exhaustive dataset of ESTs of Theobroma cacao L. generated from various tissues and under various conditions. BMC Genomics. 9:512.
- Blin N, Stafford DW. 1976. A general method for isolation of high molecular weight DNA from eukaryotes. Nucleic Acids Res. 3:2303–2308.
- Bonants PJ, Hagenaar-de Weerdt M, ManInt Veld WA, Baayen RP. 2000. Molecular characterization of natural hybrids of Phytophthora nicotianae and P. cactorum. Phytopathology. 90:867–874.
- CacaoWeb. 2003. About the Cacao Tree. About Cacao Tree [Internet].Cacao Web. [ Cited on 2014 Oct 20]. Available from: http://www.cacaoweb.net/cacao-tree.html
- Choi Y, Min B. 2000. PCR-RFLP and sequence analysis of the rDNA ITS region in the Fusarium spp. J Microbiol. 38:66–73.
- Cuervo-Parra JA, Sanchez-Lopez V, Ramirez-Suero M, Ramirez-Lepe M. 2011. Morphological and molecular characterization of Moniliophthora roreri causal agent of frosty pod rot of cocoa tree in Tabasco, Mexico. Plant Pathol J. 10:122–127.
- Dighton J, White J, Oudemans P. 2010. The Fungal Community: Its Organization and Role in the Ecosystem. In: Dighton J, White J, Oudemans P, editors. Mycology. Vol. 23. 3rd ed. CRC Taylor & Francis. Boca Raton, FL, USA.
- Dubey SC, Tripathi A, Singh SR. 2010. ITS-RFLP fingerprinting and molecular markers for detection of Fusarium oxysporum f.sp. ciceris. Folia Microbiol. 55:629–634.
- Evans HC. 1986. A reassessment of Moniliophthora (Monilia) pod rot of cocoa. Cocoa Growers’ Bulletin. 37:34–43.
- Evans HC, Bezerra JL, Barreto RW. 2013. Of mushrooms and chocolate trees: aetiology and phylogeny of witches’ broom and frosty pod diseases of cacao. Plant Pathol. 62:728–740.
- Evans HC, Holmes KA, Reid AP. 2003. Phylogeny of the frosty pod rot pathogen of cocoa. Plant Pathol. 52:476–485.
- Freire J. 2012. Proyecto de Reactivacion del Cacao Nacional Fino o de Aroma. [Internet]. Cocoa Connect. [ Cited 2014 Oct 20]. Available from: http://www.cocoaconnect.org/presentation/proyecto-de-reactivacion-del-cacao-nacional-fino-o-de-aroma
- Garcia-Vallve S, Palau J, Romeu A. 1999. Horizontal gene transfer in glycosyl hydrolases inferred from codon usage in Escherichia coli and Bacillus subtilis. Mol Biol Evol. 16:1125–1134.
- Kiss L. 1997. Genetic diversity in Ampelomyces isolates, hyperparasites of powdery mildew fungi, inferred from RFLP analysis of the rDNA ITS region. Mycol Res. 101:1073–1080.
- Loor RG, Risterucci AM, Courtois B, Fouet O, Jeanneau M, Rosenquist E, Amores F, Vasco A, Medina M, Lanaud C. 2009. Tracing the native ancestors of the modern Theobroma cacao L. population in Ecuador. Tree Genet Genomes. 5:421–433.
- Lynch M, Milligan BG. 1994. Analysis of population genetic structure with RAPD markers. Mol Ecol. 3:91–99.
- Mamede R, Montini DC, Raimundo J, Passos DS, Ferreira A. 2006. Digital monitoring of mycelium growth kinetics and vigor of Shiitake (Lentinula edodes (Berk.) Pegler) on agar medium. Braz J Microbiol. 37:90–95.
- Melo BLB, De Souza JT, Santos RMF, Rehner SA, Solis KH, Suarez C, Hebbar PK, Lemos LSL, Gramacho KP. 2014. Development of microsatellites for the cacao frosty pod rot pathogen Moniliophthora roreri. Forest Pathol. 44:320–324.
- Mohammadi SA, Prasanna BM. 2003. Analysis of genetic diversity in crop plants — Salient statistical tools and considerations. Crop Sci. 43:1235–1248.
- Nakamura H, Kaneko S, Yamaoka Y, Kakishima M. 1998. Differentiation of Melampsora rust species on willows in Japan using PCR-RFLP analysis of ITS regions of ribosomal DNA. Mycoscience. 39:105–113.
- Nei M. 1973. Analysis of gene diversity in subdivided populations. Proc Natl Acad Sci USA. 70:3321–3323.
- Park S, Ku YK, Seo MJ, Kim DY, Yeon JE, Lee KM, Jeong S-C, Yoon WK, Harn CH, Kim HM. 2006. Principal component analysis and discriminant analysis (PCA–DA) for discriminating profiles of terminal restriction fragment length polymorphism (T-RFLP) in soil bacterial communities. Soil Biol Biochem. 38:2344–2349.
- Phillips-Mora W. 2003. Origin, biogeography, genetic diversity and taxonomic affinities of the cacao (Theobroma cacao L.) fungus Moniliophthora roreri (Cif.) Evans et al. as determined using molecular, phytopathological and morpho-physiological evidence. [dissertation]. Reading (UK): The University of Reading.
- Phillips-Mora W, Aime MC, Wilkinson MJ. 2007. Biodiversity and biogeography of the cacao (Theobroma cacao) pathogen Moniliophthora roreri in tropical America. Plant Pathol. 56:911–922.
- Phillips-Mora W, Baqueros F, Melnick RL, Bailey BA. 2015. First report of frosty pod rot caused by Moniliophthora roreri on cacao in Bolivia. Plant Pathol. 31:29.
- Phillips-Mora W, Cawich J, Garnett W, Aime MC. 2006. First report of frosty pod rot (moniliasis disease) caused by Moniliophthora roreri on cacao in Belize. Plant Pathol. 55:584–584.
- Pino S. 2010. La cadena de valor del cacao en el Ecuador: Diagnostico actual. Guayaquil: Ministry of Agriculture, Livestock, Aquaculture, and Fisheries.
- Prewitt ML, Diehl SV, Mcelroy TC, Diehl WJ. 2008. Comparison of general fungal and basidiomycete-specific ITS primers for identification of wood decay fungi. Forest Products J. 58:66–71.
- Santi G-V. 2009. DendroUPGMA: a dendrogram construction utility [Internet]. DendroUPGMA. [ Cited 2014 Jun 10]. Available from: http://genomes.urv.cat/UPGMA/index.php?entrada=Example2
- Sharma S, Atri NP. 2013. Study on mycelial growth pattern of five wild Lentinus species. Eur J Appl Sci. 5:71–75.
- Tamura K, Peterson D, Peterson N, Stecher G, Nei M, Kumar S. 2011. MEGA5: molecular evolutionary genetics analysis using maximum likelihood, evolutionary distance, and maximum parsimony methods. Mol Biol Evol. 28:2731–2739.
- Vekemans X, Beauwens T, Lemaire M, Roldán-Ruiz I. 2002. Data from amplified fragment length polymorphism (AFLP) markers show indication of size homoplasy and of a relationship between degree of homoplasy and fragment size. Mol Ecol. 11:139–151.
- Villavicencio M. 2010. Caracterización morfológica, fisiológica y patogénica de Moniliophthora roreri aislados de cinco Provincias de la Costa Ecuatoriana. [dissertation]. Guayaquil: ESPOL.