
Abstract
Ergot of cereals, caused by Claviceps purpurea, results in yield loss and downgrading of infested grain because of toxic alkaloids in the sclerotia. Resistant wheat genotypes are known, but their effectiveness against different C. purpurea isolates over geographic regions has not been studied. The objective of this study was to examine the pathogenic variability among isolates of C. purpurea on wheat lines differing in resistance. Under controlled environmental conditions, 41 single spore isolates of C. purpurea were obtained from Canadian and UK collections and inoculated onto a set of wheat genotypes composed of durum wheat lines ‘Melita’, ‘Kyle’ and 9260B-173A, and hexaploid spring wheat lines ‘Cadillac’, ‘Vista’, ‘Kenya Farmer’, ‘Lee’ and HY630. Honeydew production and weight of sclerotia produced per spike were assessed. There were significant differences among the wheat genotypes for overall reactions to the pathogen isolates, and among pathogen isolates for geographic origin and host origin. Twenty virulence phenotypes were identified using the honeydew production data, and 23 virulence phenotypes identified using the sclerotial weight data from the 41 isolates. The existence of different virulence phenotypes indicates that variability in virulence exists in populations of C. purpurea, and knowledge of virulence phenotypes is necessary to effectively breed for resistant commercial lines.
Résumé
L’ergot des céréales, causé par Claviceps purpurea, engendre des pertes de rendement et la dégradation du grain infesté à cause des alcaloïdes toxiques contenus dans les sclérotes. Il existe des génotypes de blé résistants, mais leur efficacité contre divers isolats de C. purpurea dans différentes régions n’a pas été étudiée. Le but de cette étude était d’examiner la variabilité pathogénique d’isolats de C. purpurea dans des lignées de blé de résistance différente. Dans des conditions environnementales contrôlées, 41 isolats à pore unique de C. purpurea ont été obtenus de collections provenant du Canada et du Royaume-Uni et inoculés à un ensemble de génotypes de blé composé des lignées de blé dur ‘Melita’, ‘Kyle’ et 9260B-173A, ainsi que des lignées hexaploïdes de blé de printemps ‘Cadillac’, ‘Vista’, ‘Kenya Farmer’, ‘Lee’ et HY630. La production de miellat et le poids des sclérotes produits par épi ont été évalués. Il y a eu des différences significatives chez les génotypes de blé quant à l’ensemble des réactions aux isolats de l’agent pathogène ainsi que chez les isolats des agents pathogènes quant à l’origine géographique et l’origine de l’hôte. En se basant sur les données fournies par les 41 isolats, 20 phénotypes de virulences ont été identifiés en utilisant les données relatives à la production de miellat et 23 l’ont été en fonction de celles relatives au poids des sclérotes. L’existence de différents phénotypes de virulence fait état de la variabilité de la virulence dans les populations de C. purpurea et suggère que la connaissance des phénotypes de virulence est essentielle à une sélection efficace de lignées commerciales résistantes.
Introduction
Ergot of cereals, caused by Claviceps purpurea (Fr.) Tul., is a common disease in holoarctic regions of the world (Linder Citation1948; Gaudet et al. Citation2000). Its most conspicuous symptom is the formation of dark purple to black ergot bodies or sclerotia that are visible on infected cereal spikes, or in the harvested grain. This disease does not often result in large yield losses, but can have a large impact on cereal production because of the downgrading of grain infested with sclerotia (Canadian Grain Commission Citation2012). The ergot bodies contain various alkaloids toxic to humans and livestock, which can cause severe health problems if ingested. Ergot is often considered a disease of the Middle Ages, as it was common during that period and resulted in many thousands of people dying from consuming ergot-infested grain. As more became known about this disease, such as how to control ergot and avoid contaminated grain, it became less of a problem. The last major outbreak of ergotism affecting people was recorded in 1951 in France (Gabbai et al. Citation1951).
Ergot was not reported at significant levels throughout most of the 1980s and 1990s on the Canadian Prairies. In 1999, surveys conducted by the Grain Research Laboratory as part of the Harvest Survey Program of the Canadian Grain Commission (Canadian Grain Commission Citation2013) revealed that 12% of all samples of Canadian Western Red Spring (CWRS) wheat and 4% of Canada Western Amber Durum (CWAD) contained ergot bodies. In Saskatchewan, 17% of the CWRS wheat delivered to the elevators was infested with ergot. Ergot was a problem in Manitoba in 2005, when 10% of CWRS wheat samples were infested with ergot sclerotia (Menzies & Turkington Citation2015). This was followed by ergot infestation levels of CWRS wheat samples in Alberta, Saskatchewan and Manitoba of 12%, 15% and 13%, respectively, in 2008. These levels declined in 2009, but in 2011, ergot infestation levels rose to 29%, 19% and 15% in Alberta, Saskatchewan and Manitoba, respectively. The 2012 levels of ergot infestation of CWRS wheat declined by 50% or more from 2011 onwards, but in Alberta and Saskatchewan, they were still 3–5 times greater than what was reported in 2002–2007. The ergot infestation of grain on the Canadian prairies has resulted in decreased returns to farmers, since ergot-infested grain must have the ergot bodies removed, or shipments become downgraded or rejected at point of sale, and there can be increased risk to livestock as some of the ergot infested grain is used as feed.
The increased incidence and severity of this pathogen in fields of wheat in western Canada has led to greater interest in the biology and control of this disease. The identification of possible sources of resistance to C. purpurea in wheat, and the development of resistant commercial lines, are being explored. Studies examining the presence of ergot resistance in lines of wheat have been conducted by Platford & Bernier (Citation1970, Citation1976), Puranik & Mathre (Citation1971), Darlington & Mathre (Citation1976), Watkins & Littlefield (Citation1976), Coley-Smith & Watkinson (Citation1987), Pageau et al. (Citation1994), Menzies (Citation2004) and Bayles et al. (Citation2009). Puranik & Mathre (Citation1971) inoculated male sterile lines of barley and wheat and observed no differences among the lines in terms of percentage of florets infected. However, the other studies observed differences in resistance among lines of wheat, although the most resistant lines were often not suitable for commercial production. These results are significant in that they reveal that differences in susceptibility among genotypes of wheat to C. purpurea do occur, even if some of the differences are not great.
The identification of lines of wheat resistant to C. purpurea is a good step towards the development of resistant commercial lines, but often only a few isolates of the pathogen have been used in identifying resistant genotypes. The effectiveness of these resistant sources against all or the majority of the strains in a local area, or from different geographic regions, has not been addressed. Variability in pathogenicity of different strains of C. purpurea has not been extensively studied, so little is known about the amount of pathogenic variability that a resistant host line may encounter in nature. Campbell (Citation1957) studied the host specificity of 423 isolates of this fungus on 38 different host species and observed no host specificity among the isolates. He reported that each grass species became infected and concluded that indigenous and forage grasses constituted a reservoir of ergot inoculum for cereal grain hosts. Darlington et al. (Citation1977) inoculated 48 isolates of the pathogen onto eight lines of barley and four lines of wheat to determine if specific biotypes or races could be identified. They did not find good evidence of the occurrence of specific races, but did observe differences in the per cent infection of florets among the isolates. Cagaš & Macháč (Citation2002) inoculated seven lines of Kentucky bluegrass with three European isolates and one isolate from the USA and found significant differences in the number and weight of sclerotia between the European isolates and the isolate from the USA. The isolate from the USA produced more and heavier sclerotia than the European isolates. The differences in per cent infection of florets of isolates of C. purpurea led Darlington et al. (Citation1977) to recommend that plant breeders use a mixture of isolates in screening germplasm for resistance to ergot.
The objective of this research was to determine if pathogenic variability exists among different isolates of C. purpurea collected from Canada and the UK on lines of wheat differing in their levels of susceptibility/resistance.
Materials and methods
Pathogen isolates collection and maintenance
Thirty-seven samples of C. purpurea collected from Manitoba, Saskatchewan and Alberta, Canada, and four cultures from the UK were used (). Twenty-six of the 37 samples from Canada were obtained as sclerotia in grain samples from Randy Clear (Canadian Grain Commission, Winnipeg, MB) as part of the CGC’s 2000 harvest survey programme. Four sclerotia were collected from field plots at the University of Manitoba, Winnipeg, in 1996, and seven sclerotia were collected during annual barley, oat and wheat disease surveys in 1996, 1997 and 2005. The sclerotia were used to produce mycelial isolates. Each sclerotium was surface sterilized by immersion and shaking in 95% ETOH for 30 s followed by igniting the sclerotia with a flame. The surface-sterilized sclerotia were then cut into small pieces using a sterile scalpel. Pieces of the sclerotia were placed onto acidified malt extract agar (6 g dextrose (Fisher Scientific), 3 g malt extract, 3 g yeast extract and 12 g bacto agar (Becton, Dickenson and Company) in 1 L H2O, acidified with 450 µL of 2.5% lactic acid after autoclaving) in Petri dishes and incubated for up to one week or until mycelium started to grow on the agar at room temperature (21°C) under ambient light. Small plugs of agar with growing mycelium were transferred to new malt agar Petri dishes, allowed to grow for a few days at room temperature, and then maintained at 5°C. The four cultures originating in the UK were supplied as mycelial isolates and were also maintained on malt agar at 5°C.
Table 1. Single spore isolates of Claviceps purpurea (Fr.) Tul. assessed for pathogenic variation on lines of hexaploid wheat (Triticum aestivum L.) and durum wheat (T. turgidum L. var. durum).
Single-spore isolates of each culture were established by inoculating 125 mL of 2% potato sucrose broth in a 500 mL Erlenmeyer flask with a small agar plug with growing mycelium and incubating the culture for 14 days at room temperature under ambient light on a rotary shaker at 150 rpm. The mature cultures were filtered through sterile cheesecloth, and the spore suspensions diluted to 103 spores mL−1 with the aid of a hemocytometer. An aliquot of each spore suspension was streaked on 2% water agar using an inoculation loop, and incubated at room temperature under ambient light for 24 h. Single germinating spores were identified using a dissecting microscope, and the single spores transferred onto Petri dishes containing malt extract agar. The single spore isolates were maintained on malt extract agar slants at 5°C.
The isolates were determined to be C. purpurea by comparing ITS region sequences with those of Pažoutová et al. (Citation2015) (confirmed by K.A. Seifert and M. Liu, Ottawa Research and Development Centre, AAFC-AAC, Ottawa, ON).
Inoculum preparation
Inoculum was produced following the procedure of Menzies (Citation2004), and stored for a maximum 2 months at 5°C until used (Platford & Bernier Citation1976). An aliquot of each sucrose spore suspension was mixed in distilled water with one drop of Tween 20 (polyethylene glycol sorbitan monolaurate) per L to make a final concentration of 104 spores per mL as determined using a hemocytometer, prior to use as inoculum (Platford & Bernier Citation1970, Citation1976).
Wheat differential set
A differential set of spring wheat lines which varied in their response to infection by C. purpurea was established based on the assessments by Platford & Bernier (Citation1970, Citation1976) and Menzies (Citation2004). The differential set included the durum wheat (Triticum aestivum L. var. durum) lines ‘Melita’, ‘Kyle’ and 9260B-173A, and the hexaploid spring wheat (T. aestivum L.) lines ‘Cadillac’, ‘Vista’, ‘Kenya Farmer’ ‘Lee’ and HY630. ‘Melita’, ‘Cadillac’ and ‘Vista’ were chosen as susceptible genotypes, and the others were selected because they had shown some level of resistance in previous tests (Platford & Bernier Citation1970, Citation1976; Menzies Citation2004).
Inoculation procedure
Wheat lines were sown separately into 15 cm diameter pots containing a 3:1 mix of top soil and sunshine mix 4 (HJS Wholesale, Winkler, MB), and grown in growth cabinets at a temperature of 16°C night/22°C day with a 15 h/9 h light/dark period. Twelve seeds were sown per pot. Ten to 12 spikes were allowed to develop per pot, and nine spikes inoculated per pot. The spikes were inoculated prior to anthesis (Platford & Bernier Citation1970), when the spikes had just completely emerged from the boot. Twenty florets were inoculated per spike by selecting five healthy spikelets on each side of the spike and injecting a spore suspension into the primary and secondary florets on each spikelet using a syringe and hypodermic needle to fill the florets (Campbell Citation1957; Platford & Bernier Citation1976). The spikelet below the group of inoculated spikelets was removed as a marker for the inoculated spikelets (Menzies Citation2004). Three spikes per pot were inoculated from four separate pots, representing four replicates of three spikes each for each fungal isolate on each wheat line.
Each spike was assessed for honeydew production ~14 days after inoculation using a scale from 1 to 4 with 1 = none visible, 2 = honeydew confined within the glumes, 3 = honeydew exuding from the florets in small drops and 4 = large drops of honeydew running down the spike (Menzies Citation2004). At maturity, each spike was harvested and threshed by hand. Total weight in mg of sclerotia per spike was recorded.
Statistical analysis
Analysis of variance was performed on honeydew production and sclerotial weight data to determine the relative contribution of isolate by differential interaction to the total variance comprising of replicates, the simple effects and interaction. The model least square means were calculated and used to tabulate the response of the differential wheat lines to the different isolates.
Correspondence analysis (CA; Savary et al. Citation1994) was performed to determine the association between the factors (differential lines, isolate sampling location and the isolate host source) and the variables honeydew production and sclerotial weight because honeydew production values were categorical and ordinal in nature. The median honeydew production and mean total sclerotial weights were determined for each pot. Medians and means were converted into classes. The classes of the honeydew production were determined by the class ranges of 1, 1.5–2.5, 3–3.5 and 4 for the classes H1, H2, H3 and H4, respectively. Mean sclerotial weights were also converted to classes by assigning the data to classes Sc1, Sc2, Sc3 and Sc4 with the end points of 0–35 mg, >35–130 mg, >130–350 and >350. For both categorical variable H and Sc, contingency tables were constructed with isolate sampling location (AB, SK, MB and UK), isolate host source (Wht for hexaploid spring wheat, Dur for durum wheat, Tri for triticale, Bar for barley, BG for blackgrass, Oat for oat and Rye for rye), and the wheat differential lines. Tests of independence for each contingency table were performed. In addition, a test of independence was calculated for the categorical variables for honeydew production and sclerotial weight.
Correspondence analysis is a multivariate statistical technique for creating an ordination similar to principal component analysis (PCA). In contrast to PCA which is based on Euclidian distances, CA uses the chi-square distances between rows. As in PCA, eigenvalues and eigenvectors were determined, and coordinates determined by weighing the rows of the contingency tables by the first and second eigenvectors. The calculations of the analysis were performed using the package ‘ca’ in R (R Core Team Citation2016). To determine the significance of the first eigenvalue, a Monte Carlo simulation was performed on 1000 permutations of the dependent variable and the eigenanalysis performed on each resulting contingency table with the P-value of the test statistic compared to the given percentile of the simulations.
Results
The different isolates of C. purpurea caused a wide range of disease symptoms on the different wheat genotypes. Honeydew production ratings ranged from 1 to 4 (), and the weight of sclerotia produced on a spike ranged from 0 mg to more than 1000 mg (). A test of independence for a contingency of honeydew production versus sclerotial weight per spike indicated a significant positive association (χ2 = 0.864, P < 0.0001).
Table 2. The least squares means for the honeydew ratingsa obtained from the inoculation of 41 single spore strains of Claviceps purpurea (Fr.) Tul. onto three lines of durum wheat (T. turgidum L. var. durum) and five lines of hexaploid wheat (Triticum aestivum L.).
Table 3. The least squares means of the weight (mg) of sclerotia per spike obtained from the inoculation of 41 single spore strains of Claviceps purpurea (Fr.) Tul. onto three lines of durum wheat (T. turgidum L. var. durum) and five lines of hexaploid wheat (Triticum aestivum L.).
ANOVA indicated that the effects of the wheat differential lines, pathogen isolates and the wheat differential line by pathogen isolate interactions were significant (P < 0.0001) for both honeydew production and sclerotial weights. Differential lines, isolates and their interaction accounted for 32%, 39% and 29% of the total treatment sum of squares for honeydew production, respectively. For log transformed sclerotial weights, the sum of squares for differential lines accounted for 40% of the total, 33% for the isolates and 27% for the interaction.
The CA involving wheat differential line, isolate sampling location and isolate host source for honeydew production is presented in the plot in . The graph is derived from the eigenanalysis of these contingency tables. The first eigenvalue accounted for 73.2% of the variation inherent in the contingency tables and the second eigenvalue accounted for 23.2% of the variation. The H1 to H4 points on the honeydew biplot () are based on column scores derived from the eigenanalysis of the counts of the contingency tables of the three factors. The path from H1 to H4 indicates increasing honeydew production, with means of 1.0, 2.0, 3.0 and 4.0 for H1, H2, H3 and H4, respectively. Contingency table analysis and Pearson’s chi square analysis indicated significant differences (P < 0.0001) among the wheat differential lines, the isolate sampling locations, and the isolate host sources. 9260B-173A had significantly lower honeydew production than the other lines, followed by ‘Kenya Farmer’. This was followed by a group of lines consisting of HY630, ‘Kyle’, ‘Lee’, ‘Vista’ and ‘Cadillac’ which had lower honeydew production than ‘Melita’. Isolates from the UK had higher honeydew production than those from Alberta, which were higher than those from Saskatchewan and Manitoba, which did not differ. Isolates sourced from rye had greater honeydew production than the isolates sourced from other hosts, with durum wheat isolates having higher honeydew production than the remaining hosts isolates. The Blackgrass, triticale and oat isolates were combined for analysis because of low isolate numbers, and this combination of isolates had higher honeydew production than the wheat and barley sourced isolates. The wheat isolates had greater honeydew production than the barley isolates. The first eigenvalue (0.1541) was significant (P < 0.001) as determined by Monte Carlo at the 99.9 percentile of 0.0131.
Fig. 1 (Colour online) Correspondence analysis biplot of the contingency table involving wheat differential line, isolate sampling location and isolate host source for honeydew production (H1 to H4). The graph is derived from the eigenanalysis of these contingency tables. The first eigenvector accounted for 73.2% of the variation in the contingency tables, and the second eigenvector accounted for 23.2% of the variation. The path from H1 to H4 indicates increasing honeydew production with means of 1.0, 2.0, 3.0 and 4.0 for H1, H2, H3 and H4, respectively. Wheat differential lines: 9260B-173A (9260B), ‘Kyle’, ‘Melita’, HY630, ‘Kenya Farmer’, ‘Lee’, ‘Vista’, ‘Cadillac’. Isolate sampling location: United Kingdom (UK), Alberta (AB), Saskatchewan (SK), Manitoba (MB). Isolate host source: rye (Rye), blackgrass (BG), triticale (Tri), durum wheat (Dur), hexaploid wheat (Wht), oats (Oat), barley (Bar).
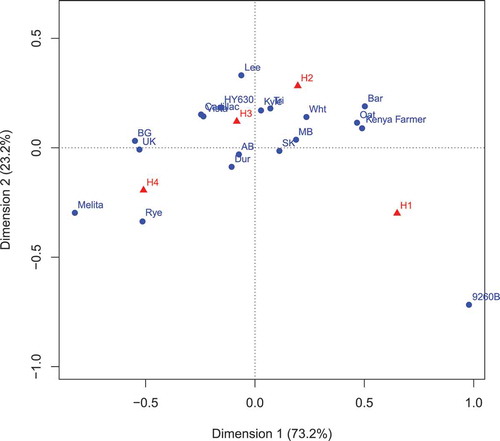
Correspondence analysis provides a graphical representation of the trends in a contingency table, unlike analysis of variance. The eigenanalysis resulted in a number of axes that account foremost for the inertia (variance) present in the contingency table. Only the first two axes were used. Scores for each of the rows and columns are determined for each axis. These scores are used in the biplot. For a given factor, the distance of a point from the origin gives a measure of the strength of this point. In addition, a way to interpret the graphs is to draw lines from the origin to a disease point (e.g. H1) and determine the angle from this line to that formed by two independent sources (e.g. sources (wheat and barley)). If the angle is acute, then the profiles for the two variables are similar and become more dissimilar as the angle increases. Alternatively, the relative frequencies of the honeydew categories in the source sample may be determined by drawing a line through the origin to the source sample (e.g. barley) and looking at the point on this line by projecting a perpendicular to this line to the disease category points. Frequencies of points on the line formed by the perpendicular projections from the point of a disease category on the same side from the origin as the corresponding source point occur more often than average profile with distance from the origin, and less often on the opposite side. For example, using the latter method using rye and barley, the frequency of honeydew level H4 occurred more often than average using isolates derived from rye and H1 less often than average, whereas H1 occurred more often than average using isolates from barley and less often than average for H4.
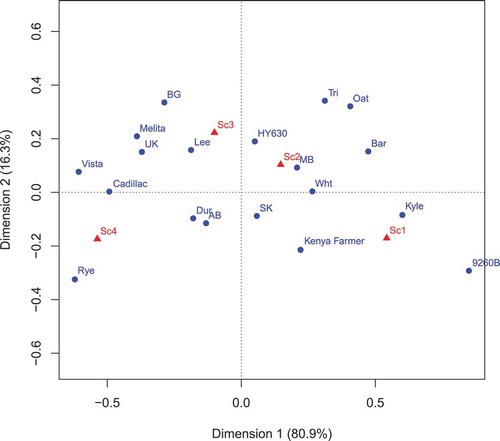
The CA involving wheat differential line, isolate sampling location and isolate host source for sclerotial weight is presented in the plot in . The graph is derived from the eigenanalysis of these contingency tables. The first eigenvalue accounted for 80.9% of the variation inherent in the contingency tables and the second eigenvalue accounted for 16.3% of the variation. The Sc1 to Sc4 points on the biplot () are based on column scores of the contingency tables of the three factors. The biplot is derived from the eigenanalysis of these contingency tables. The path from Sc1 to Sc4 indicates increasing sclerotial weight production, with means of 11.2 mg for Sc1, 80.1 for Sc2, 226.9 for Sc3 and 610.5 mg for Sc4. Contingency table analysis and Pearson’s chi square analysis indicated significant differences (P < 0.0001) among the different wheat lines, the isolate sampling locations, and the isolate host sources. The wheat lines were all different from each other in terms of sclerotial weight, with 9260B-173A having the lowest sclerotial weight and ‘Cadillac’ having the greatest weight based on the distribution in the contingency table. The isolate sampling locations also differed in sclerotial weight, with the UK having the highest sclerotial weights and Manitoba having the lowest. Isolates sourced from rye had greater sclerotial weight production than the isolates sourced from other hosts, with durum wheat isolates having higher sclerotial weight production than the remaining host isolates. The wheat isolates had greater sclerotial weight production than the barley isolates. The first eigenvalue (0.1504) of this analysis was also significant (P < 0.001) as determined by Monte Carlo at the 99.9 percentile of 0.0126.
Fig. 2 (Colour online) Correspondence analysis biplot of the contingency table involving wheat differential line, isolate sampling location and isolate host source for sclerotial weight per spike (Sc1 to Sc4). The graph is derived from the eigenanalysis of these contingency tables. The first eigenvector accounted for 80.9% of the variation in the contingency tables, and the second eigenvector accounted for 16.3% of the variation. The path from Sc1 to Sc4 indicates increasing sclerotial weight with means of 11.2, 80.1, 226.9 and 610.5 for Sc1, Sc2, Sc3 and Sc4, respectively. Wheat differential lines: 9260B-173A (9260B), ‘Kyle’, ‘Melita’, HY630, ‘Kenya Farmer’, ‘Lee’, ‘Vista’, ‘Cadillac’. Isolate sampling location: United Kingdom (UK), Alberta (AB), Saskatchewan (SK), Manitoba (MB). Isolate host source: rye (Rye), blackgrass (BG), triticale (Tri), durum wheat (Dur), hexaploid wheat (Wht), oats (Oat), barley (Bar).
The phenotypic data for the 41 individual isolates of C. purpurea on the eight wheat lines for honeydew production are presented in . The susceptible reaction for honeydew production was set at a rating of 2.1 or greater because this is just above the H2 point in the CA. The number of pathogen isolates that caused a susceptible or compatible reaction on the different wheat lines was as follows: eight isolates (20%) on 9260B-173A, 30 isolates (73%) on ‘Kyle’, 40 (98%) on ‘Melita’, 22 (54%) on HY630, 17 (41%) on ‘Kenya Farmer’, 28 (68%) on ‘Lee’, 30 (73%) on ‘Vista’, and 30 (73%) on ‘Cadillac’. There were 20 different virulence phenotypes identified as separated by resistant and susceptible reactions using the honeydew production data. The most common virulence phenotype possessed by 12 pathogen isolates (isolates 44-2, 89-1, 90, 93-2, 95, 101 148, 155, 169-6, 179-1, 179-2 and UK 03-20-1) had virulence to all the wheat lines except 9260B-173A (). The five isolates 7-1, 7-2, 125, 128 and 166-1 had virulence to ‘Kyle’, ‘Melita’, ‘Lee’, ‘Vista’ and ‘Cadillac’. The UK isolates UK 03-43-1, UK 04-02-1 and UK 04-97-1 and isolate 169-1 possessed virulence to all the wheat lines. There were three groups of two isolates each, isolates 22 and 38, isolates 40 and 100 and isolates 172 and 192-1, which had the same virulence phenotype, The other 14 isolates in this study had unique virulence phenotypes.
The phenotypic data for weight of sclerotia for the 41 individual isolates of C. purpurea on the eight wheat lines is presented in . A wheat line was considered susceptible to an individual isolate if 81 mg or more of sclerotia were produced per spike because this is just above the Sc2 point in the CA. The number of isolates causing a susceptible or compatible reaction on the different wheat lines were as follows: five isolates (12%) on 9260B-173A, 12 isolates (29%) on ‘Kyle’, 33 (80%) on ‘Melita’, 23 (56%) on HY630, 18 (44%) on ‘Kenya Farmer’, 30 (73%) on ‘Lee’, 37 (90%) on ‘Vista’ and 32 (78%) on ‘Cadillac’. There were 23 different virulence phenotypes identified using the sclerotial weight data. The most common virulence phenotype possessed by six isolates (isolates 90, 93-2, 101, 148, 179-1 and 179-2) had virulence to all the wheat lines except 9260B-173A (). There were two sets of five isolates which possessed virulence to all the wheat lines except 9260B-173A and ‘Kyle’ (isolates 44-2, 89-1, 95, 155 and 169-6), or virulence to ‘Melita’, ‘Lee’, ‘Vista’ and ‘Cadillac’ (isolates 7-2, 29-2, 33-2, 85 and 128). There were five groups of two isolates each, isolates 7-1 and 115, isolates 40 and 77, isolates 169-1 and UK 03-43-1, isolates 7-3 and 138, and isolates 125 and 166-1, which had the same virulence phenotype. Fifteen of the 23 virulence phenotypes were represented by only one isolate including isolate UK 04-02-1, which was the only isolate to have virulence to all the wheat differential lines.
Nine of the 41 isolates had the same virulence phenotype for both honeydew production and sclerotial weight ( and ). Isolates 90, 93-2, 101, 148, 179-1 and 179-2 were virulent to all differential wheat lines except 9260B-173A, isolate 150 was virulent to ‘Melita’ and ‘Cadillac’, isolate 192-4 was virulent to ‘Melita’, HY630, ‘Lee’ and ‘Vista’, and isolate UK04-02-1 was virulent to all wheat differential lines.
Discussion
Variability among the isolates of C. purpurea was evident for honeydew production and sclerotial weight per spike, which is in agreement with previous studies (Platford & Bernier Citation1976). Pathogenic variability was observed on each wheat line used in these experiments, indicating it was because of genetic variation among isolates. Honeydew production and sclerotial weight represent two different aspects of the disease cycle of C. purpurea. The honeydew is important in secondary spread of the pathogen (Gaudet et al. Citation2000) and a reduction in honeydew would likely lead to reduced spread. The weight of sclerotia per spike provides an indication of the success of the pathogen in reproducing on the host. The weight of sclerotia per spike reflects the success of the pathogen in diverting plant resources, and considers the role of larger, heavier sclerotia in pathogen reproduction. Cooke & Mitchell (Citation1966) and Rapilly (Citation1968) observed positive linear relationships between the size of sclerotia and the number of clavae produced by the sclerotium. The number of clavae produced would influence the number of ascospores produced and released from a sclerotium. Therefore, lighter sclerotia would result in fewer ascospores being produced to start infections in the next season.
Isolates from the UK had higher honeydew ratings and greater sclerotial weights per spike than isolates from Alberta, which in turn, were more severe than isolates from Saskatchewan and Manitoba. This suggests that the UK isolates of C. purpurea have greater potential to cause disease than the western Canadian isolates and the Alberta isolates had a greater potential than the Saskatchewan and Manitoba isolates. These results suggest the severity of disease caused by isolates of C. purpurea may vary with geographic origin of the isolate.
Claviceps purpurea isolates originating from different hosts varied in the severity of disease they caused on the eight wheat differential lines. Isolates from rye had significantly greater honeydew production and weight of sclerotia per spike than the other isolates, while those from barley had significantly lower honeydew production and weight of sclerotia per spike. These results suggest that the amount of disease caused by an isolate of C. purpurea may be influenced by the host of origin. The hosts of origin in this study are known to vary in their susceptibility to C. purpurea. Platford & Bernier (Citation1976) listed the susceptibility of the different crop species in the following order of decreasing susceptibility: rye, triticale, wheat, barley and oats. Possibly, host species which are more susceptible or prone to infection allow the more rapid spread of more virulent isolates, i.e. those with greater honeydew production, as compared with less virulent isolates of C. purpurea, once crop plants become infected. This more rapid spread of infection by the more virulent isolates would result in their sclerotia becoming predominant in infested grain samples from the field. The positive association between honeydew production and sclerotial weight per spike would lead to greater weights of sclerotia being produced by the more virulent isolates on these more susceptible host crops. The nature of our sampling technique, in which one sclerotium is sampled from a grain sample, probably results in the dominant or common genotypes, or in our case the more virulent genotypes, being collected more often than the less common or less virulent isolates. Popovic & Menzies (Citation2006), working with Ustilago tritici, suggested that if one genotype per field is sampled, a dominant genotype would be more commonly collected than other genotypes. Other hosts which are not as susceptible or prone to infection by C. purpurea as rye may not be so conducive to the rapid secondary spread of more virulent isolates, and the sclerotia collected in infested grain of these crops may be more reflective of the pathogen isolates that originally invaded the field from sporulating sclerotia or neighbouring grasses.
The development of a differential host series for a pathogen is dependent on identifying lines with different responses to the pathogen. The inoculation of the eight wheat lines with 41 isolates confirmed that the lines do differ in their reactions to C. purpurea as previously reported by Menzies (Citation2004) and Platford & Bernier (Citation1970, Citation1976). There are other wheat genotypes that have been reported to show resistance to C. purpurea, which could be considered for inclusion in a more comprehensive differential set. For instance, the winter wheat line ‘Robigus’ has recently been shown to have lower average sclerotium weight and sclerotial weight per ear than other winter wheat lines (Gordon et al. Citation2015). It is also important to note that the resistance in our differential wheat lines has not been characterized, and some of these lines may possess more than one gene for resistance, or some of the same genes for resistance. The wheat lines used in this study lack the sophistication and refinement of a near-isogenic set of lines, but nevertheless, provide useful information.
The significant and large differential wheat line by pathogen isolate interaction suggests a vertical resistance interaction (i.e. a gene-for-gene mechanism) is operating in this pathosystem (Kranz Citation2003) and honeydew production and/or sclerotial weight may be used to determine virulence phenotypes of C. purpurea. The division of pathogen isolate by host genotype interactions into avirulent (resistant) or virulent (susceptible) reactions was set at a honeydew production rating of 2.1 or higher and a sclerotial weight per spike of 81 mg or higher being virulent reactions. The honeydew production data separated the 41 isolates into 20 different virulence phenotypes and the sclerotial weight data separated the isolates into 23 virulence phenotypes. The most common virulence phenotype for both honeydew production and sclerotial weight per spike possessed virulence to all wheat differential lines except 9260B-173A. Four isolates possessed virulence to all the wheat differential lines for honeydew production and one isolate for sclerotial weight per spike. Some of the virulence phenotypes displayed a very good demarcation between virulence and avirulence, such as isolate 90 with a honeydew production rating of 1 on 9260B-173A and 3.7 on ‘Cadillac’ and sclerotial weight per spike of 9 mg on 9260B-173A and 1179 mg on ‘Cadillac’. Other isolates did not show such a stark difference between virulence and avirulence, with some honeydew production and sclerotial weight values being close to the demarcation points. For instance, isolates 102 and 172 had a number of honeydew production and sclerotial weight per spike values which were close to being either avirulent or virulent. Our knowledge of the genetics of the wheat–C. purpurea pathosystem is very limited and the interaction of pathogen isolates with differential host lines yielding reactions that are close to the avirulent/virulent demarcation point is not uncommon in other pathosystems, such as the oat-crown rust pathosystem (Menzies, unpublished data). In the wheat (T. aestivum)–leaf rust [Puccinia recondita Roberge ex Dezmaz. f. sp. tritici (Eriks. & Henn.)] pathosystem, Kolmer & Dyck (1994) observed that the expression of resistance and avirulence genes was highly dependent on the genotypes of the host lines and rust isolates involved in the interactions. These two rust pathosystems have the luxury of near-isogenic host lines to study these reactions. As previously mentioned, the genetics of the eight wheat differential lines used in this study are not well known and it is possible that the genetics of resistance to C. purpurea of these lines may be complex. Platford et al. (Citation1977) studied the genetics of resistance to C. purpurea in ‘Kenya Farmer’ and determined that a gene or genes for resistance which influence honeydew production and frequency and size of sclerotia was located on chromosome 6b, but genes on other chromosomes also influenced sclerotium size and honeydew production. Gordon et al. (Citation2015) studied the resistance to C. purpurea in the winter wheat line ‘Robigus’ and identified interacting QTL that influenced the size and weight of sclerotia, but the majority of the genetic variation affecting sclerotium development was not detectable. They considered this lack of genetic detection was the result of the presence of many small genetic differences affecting sclerotium development.
The presence of different virulence phenotypes or races of C. purpurea has not been previously reported. Our experiments were successful in identifying virulence phenotypes of C. purpurea likely because of the use of wheat differential lines with known differences in reactions to the pathogen.
In conclusion, our results show a wide range of genetic variability among isolates of C. purpurea inoculated to wheat genotypes that were known to differ in their response to the pathogen. Different virulence phenotypes were identified, and isolates varied in their virulence depending on host of origin and geography. This information is important in development of resistant germplasm to this pathogen. Knowledge of the virulence phenotypes is necessary to effectively breed for resistance to this pathogen, and wheat genotypes with resistance to this pathogen in one geographic area may not be resistant to virulence phenotypes of the pathogen from other geographic areas. Nevertheless, this work confirms that resistant genotypes of wheat do exist. The most effective resistance source in this study was 9260B-173A which confirms the finding of Menzies (Citation2004). The marked reduction in honeydew production and weight of sclerotia of the C. purpurea isolates on this line warrants further genetic investigation.
Acknowledgements
Funding from the Canadian Seed Growers’ Association, the Biotechnology and Biological Sciences Research Council, UK, and AAFC’s Growing Forward 2 for a research network on emerging mycotoxins, and critical review of a manuscript draft by Dr Robert Conner, are gratefully acknowledged. Technical support was provided by C. Saramaga, Z. Popovic, R. Dueck, J. Gruenke, A. Stern, S. Thomson and T. Dykstra.
Additional information
Funding
References
- Bayles R, Fletcher M, Gladders P, Hall R, Hollins W, Kenyon D, Thomas J. 2009. Towards a sustainable whole-farm approach to the control of ergot. Cambridge (UK): National Institute of Agricultural Botany. Project Report No. 456 to the Home Grown Cereals Authority, Stoneleigh Park, Warwickshire, U.K.; 170 p.
- Cagaš B, Macháč R. 2002. Different pathogenicity of ergot isolates [Claviceps purpurea (Fr.) Tul.] on Kentucky bluegrass (Poa pratensis L.). Plant Prot Sci. 38:18–22.
- Campbell WP. 1957. Studies on ergot infection in gramineous hosts. Can J Bot. 35:315–320.
- Canadian Grain Commission. 2012. The official grain grading guide. [ accessed 2013 May 8]. http://grainscanada.gc.ca/oggg-gocg/04/oggg-gocg-4f-eng.htm.
- Canadian Grain Commission. 2013 May 28. Harvest survey of Canadian grain quality. [ Accessed 2013 Sep 30]. http://www.grainscanada.gc.ca/quality-qualite/hsp-per/hs-er-eng.htm.
- Coley-Smith JR, Watkinson L. 1987. Susceptibility of durum wheat cultivars to ergot disease. Ann Appl Biol. 110:162–163.
- Cooke RC, Mitchell DT. 1966. Sclerotium size and germination in Claviceps purpurea. Trans Brit Mycol Soc. 49:95–100.
- Darlington LC, Mathre DE. 1976. Resistance of male sterile wheat to ergot as related to pollination and host genotype. Crop Sci. 16:728–730.
- Darlington LC, Mathre DE, Johnston RH. 1977. Variation in pathogenicity between isolates of Claviceps purpurea. Can J Plant Sci. 57:729–733.
- Gabbai, Lisbonne, Pourquier. 1951. Ergot poisoning at Pont St. Esprit. BMJ. 2(4732):650–651.
- Gaudet D, Menzies J, Burnett P. 2000. Smuts, bunts, and ergot. Encyclopedia of microbiology. 4. 2nd ed. San Diego (CA): Academic Press; p. 297–315.
- Gordon A, Basler R, Bansept-Basler P, Fanston V, Harinarayan L, Grant PK, Birchmore R, Bayles R, Boyd L, O’Sullivan DM. 2015. The identification of QTL controlling ergot sclerotia size in hexaploid wheat implicates a role for the Rht dwarfing alleles. Theor Appl Genet. 128:2447–2460.
- Kolmer JA, Dyck PL. 1994. Gene expression in the Triticum aestivum-Puccinia recondita fsp tritici gene-for-gene system. Phytopath 84:437–440.
- Kranz J. 2003. Comparative epidemiology of plant diseases. Berlin: Springer-Verlag; 206 p.
- Linder DH. 1948. Fungi, botany of the Canadian Eastern Artic. Part II. Thallophyta and bryophyta. Bull Natl Museum Can. 97:234–297.
- Menzies JG. 2004. The reactions of Canadian spring wheat genotypes to inoculation with Claviceps purpurea, the causal agent of ergot. Can J Plant Sci. 84:625–629.
- Menzies JG, Turkington TK. 2015. An overview of the ergot (Claviceps purpurea) issue in western Canada: challenges and solutions. Can J Plant Path. 37:40–51.
- Pageau D, Collin J, Wauthy J-M. 1994. Une note sur la résistance à l’ergot chez le blé tendre, le blé dur et le triticale. Phytoprotection. 75:45–49.
- Pažoutová S, Pešicová K, Chudíčková M, Šrůtka P, Kolařík M. 2015. Delimitation of cryptic species inside Claviceps purpurea. Fungal Biol. 119:7–26.
- Platford RG, Bernier CC. 1970. Resistance to Claviceps purpurea in spring and durum wheats. Nature. 226:770.
- Platford RG, Bernier CC. 1976. Reaction of cultivated cereals to Claviceps purpurea. Can J Plant Sci. 56:51–58.
- Platford RG, Bernier CC, Evans LE. 1977. Chromosome location of genes conditioning resistance to Claviceps purpurea in spring and durum wheat. Can J Genet Cytol. 19:679–682.
- Popovic Z, Menzies JG. 2006. Intensive and extensive sampling techniques used to measure genetic diversity of Ustilago tritici, using virulence and DNA polymorphism. Can J Plant Path. 28:197–207.
- Puranik SB, Mathre DE. 1971. Biology and control of ergot on male sterile wheat and barley. Phytopathology. 61:1075–1080.
- R Core Team. 2016. R: a language and environment for statistical computing. Vienna: R Foundation for Statistical Computing. [Accessed 2016 Apr 12.] http://www.R-project.org.
- Rapilly F. 1968. Études sur l’ergot du blé: Claviceps purpurea (Fr.) Tul. Annales des épiphyties. [Studies on ergot of wheat: Claviceps purpurea (Fr.) Tul.]19:305–329.
- Savary S, Madden LV, Zadoks JC, Klein-Gebbinck HW. 1994. Use of categorical information and correspondence analysis in plant disease epidemiology. Adv Bot Res. 21:213–240.
- Watkins JE, Littlefield LJ. 1976. Relationship of anthesis in Waldron wheat to infection by Claviceps purpurea. Trans Brit Mycol Soc. 66:362–363.