
Abstract
: Cercospora beticola is the most important pathogen of sugar beet in temperate climates and is the causal agent of Cercospora leaf spot (CLS). The relationships among weather variables, disease severity and the aerial concentration of C. beticola conidia were assessed in 2014 and 2015. Volumetric spore traps were deployed to quantify conidia concentration every 6 h in Pain Court (PC) and Ridgetown (RT), Ontario. Mean daily air temperature (AT) and relative humidity (RH) were rarely at optimal levels for CLS development. Conidia were first detected in early May in RT both years and PC in 2015, and in mid-June in PC 2014. CLS symptoms were not observed until 75–91 days after the first detection of conidia. Thus, the presence of conidia was not a limiting factor for disease development. Daily conidia concentration peaked (0.83 spores m−3) between 12 pm and 6 pm and was lowest (0.34 spores m−3) between 12 am and 6 am at all sites, providing evidence of a diurnal effect for airborne C. beticola conidia. A logistic curve explained the relationship between cumulative weekly conidia concentration and CLS severity (R2 ≥ 0.93, P < 0.0001), but CLS severity associated with levels of conidia accumulation was variable among sites. Mean AT 0 h before conidia capture was most influential on aerial conidia concentration compared with other weather variables (R2 = 0.11, P < 0.0001). Additional research is required to validate the relationship among mean daily AT, airborne C. beticola conidia and CLS epidemics.
Résumé
Sous les climats tempérés, Cercospora beticola est le plus important agent pathogène de la betterave à sucre et il est l’agent causal de la tache cercosporéenne (TC). En 2014 et 2015, les relations entre les variables météorologiques, la gravité de la maladie et la concentration aérienne de conidies ont été évaluées. Des pièges à spores volumétriques ont été installés pour quantifier la concentration de conidies toutes les six heures à Pain Court (PC) et Ridgetown (RT), en Ontario. La température quotidienne moyenne de l’air (TA) et l’humidité relative (HR) ont rarement atteint des niveaux optimaux promouvant le développement de la TC. Au cours des deux années, les conidies ont d’abord été détectées pour la première fois au début de mai à RT, puis à PC en 2015 et à la mi-juin à PC en 2014. Il a fallu de 75 à 91 jours avant que les symptômes de la TC soient observés, et ce, après la première détection des conidies. Ainsi, la présence des conidies n’était pas un facteur limitatif quant au développement de la maladie. La concentration quotidienne de conidies atteignait son plus haut niveau (0.83 spores m−3) de midi à 18 h et son plus bas (0.34 spores m−3), de minuit à 6 h, à tous les sites, attestant un effet diurne favorisant les conidies de C. beticola transportées dans l’atmosphère. Une courbe logistique a expliqué la relation entre la concentration hebdomadaire cumulée de conidies et la gravité de la TC (R2 ≥ 0.93, P < 0.0001), mais cette dernière, associée aux taux d’accumulation de conidies, variait d’un site à l’autre. La TA moyenne à minuit précédant la capture des conidies influençait grandement la concentration de conidies transportées dans l’atmosphère, comparativement aux autres variables météorologiques (R2 ≥ 0.11, P < 0.0001). De plus amples recherches sont requises pour valider la relation entre la TA moyenne quotidienne, la concentration de conidies de C. beticola transportées dans l’atmosphère et les épidémies de TC.
Introduction
Sugar beet (Beta vulgaris L.) is a major crop in temperate climates for white sucrose production (Draycott, Citation2006). Canada and the USA produced 88 900 and 3 953 000 T year−1 of white sucrose from sugar beet in 2003–2004, respectively (Licht, Citation2005). Ontario growers produce about 4050 ha of sugar beet annually, and the average farm gate value was almost $19 million per year during 2010–2014 (W. Martin, Michigan Sugar Company, personal communication). Cercospora leaf spot (CLS), caused by Cercospora beticola Sacc., is the most important disease of sugar beet worldwide (Beta vulgaris L.) (Weiland & Koch, Citation2004; Jacobsen & Franc, Citation2009; Khan et al., Citation2009). Epidemics during the 2015 season were responsible for beet yield loss of up to 11 T ha−1 and sugar losses of up to 19% in the neighbouring state of Michigan, USA (Stewart, Citation2016) and similar losses were estimated in Ontario (W. Martin, Michigan Sugar Company, personal communication). CLS has caused sucrose losses of 40% (Shane & Teng, Citation1992) and economic losses of up to $75 million in the Red River Valley region of the USA (Poindexter, Citation2014).
Cercospora beticola is a hemibiotrophic fungus (Bolton et al., Citation2012) and able to infect most Beta species (Weiland & Koch, Citation2004). The conidia, pseudostroma and stromata overwinter on infected plant residue (Vereijssen et al., Citation2004; Khan et al., Citation2008; Jacobsen & Franc, Citation2009). Conidia enter passively through natural openings and wounds on the leaf surface (Vereijssen et al., Citation2004; Weiland & Koch, Citation2004). The fungus grows intercellularly and CLS lesions become visible 5–21 days post infection (dpi) (Windels et al., Citation1998; Vereijssen et al., Citation2004). Stroma within lesions produce conidia as early as 7 dpi (Jacobsen & Franc, Citation2009). Cercospora leaf spot is a polycyclic disease and symptoms usually appear after row closure of sugar beet (Khan et al., Citation2008). Patterns of airborne C. beticola conidia concentration have not been studied in the sugar beet growing areas of the Great Lakes Region (GLR) which includes parts of Ontario, Canada and Michigan, USA. McKay & Pool (Citation1918) reported that crop rotation and field isolation of at least 91.4 m reduced CLS severity but the viability of C. beticola conidia after long distance dispersal is unknown. Airborne C. beticola conidia concentration may be important because wind was identified as a primary dispersal method for conidia by Khan et al. (Citation2008).
Optimal conditions for CLS symptom development in the North Central USA include daytime temperatures of 25–35°C, night time temperatures over 16°C and relative humidity (RH) of 90–95% (Forsyth et al., Citation1963; Shane & Teng, Citation1983; Jacobsen & Franc, Citation2009). CLS is currently managed in Ontario and Michigan by soil incorporation of diseased residue at the end of the growing season, crop rotation and in-season fungicide applications. Disease forecasting models are commonly used for proper timing of fungicide applications to manage sugar beet CLS in North America (Windels, Citation2010). Fungicide applications can be reduced by 30–50% when using BEETcast™ compared with a calendar schedule (Trueman & Burlakoti, Citation2014a, Citation2014b). BEETcast™ allows growers to determine an optimal fungicide application schedule based on historical disease pressure, sugar beet cultivar and weather conditions but does not consider annual inoculum pressure. Information on C. beticola conidia aerobiology in relation to weather conditions and CLS appearance in Michigan and Ontario may further improve the model by including current information on C. beticola conidia.
In the current study, the concentration of aerial C. beticola conidia, weather conditions, and CLS severity were simultaneously monitored during the 2014 and 2015 growing seasons in the sugar beet production region of Ontario. The specific objectives were: (i) to monitor the seasonal and diurnal patterns of C. beticola conidia and their relationship with CLS appearance and severity, and (ii) to assess the relationship between the concentrations of airborne conidia of C. beticola and weather variables.
Materials and methods
The concentration of airborne conidia of C. beticola and the severity of CLS was monitored throughout the growing season in four sugar beet fields in the sugar beet production area of Ontario. Field locations are described in . Weather information near these sites was collected and used to assess the relationships between weather conditions, CLS severity and airborne conidia concentrations.
Table 1. Ontario site information, locations and crop history.
Monitoring C. beticola conidia
A seven-day volumetric Burkhard spore trap (Burkhard Manufacturing Co. Ltd, Rickmansworth, Hertfordshire, UK) with a standard 2 × 14 mm orifice located 42 cm from the ground was placed at each field location from April to October. Spore traps were powered by Coleman 40 W solar panels model 51 840 (The Coleman Company Inc., Witchita, KS, USA) mounted on a south-facing white-washed plywood hutch and placed on the edge of the site, at least 10 m from the edge of the field. Hutches were constructed without side walls to allow for better air movement and to minimize disruption of air flow patterns. Spore trap drums were loaded with 600 Transparent Scotch® tape (19 mm × 32.9 m) (3M, Saint Paul, MN), with the sticky side out. Air was aspirated at 10 L min−1, and drums made 1 revolution per week (0.2 cm h−1). Drums were replaced weekly and the aspiration rate was checked using a flowmeter. Spore traps at the PC site ran 23 April–14 October 2014 and 31 April–21 September 2015. Due to spore trap malfunctions, conidia counts are not available for PC from 1–9 May 2014 and from 26 June–2 July 2015. Spore traps at the RT site ran 1 May–1 October 2014 and 2015.
Drums were transported to the laboratory for processing; the tape was cut into 6-h segments (1.2 cm long), stained with Remel lactophenol aniline blue (Thermo Fisher Scientific, Hudson, NH) and placed on glass slides. The segments ran from 12 am to 6 am, 6 am to 12 pm, 12 pm to 6 pm, and 6 pm to 12 am. The first and last segments of each week were adjusted to account for the period when the trap was changed (e.g. 6 am to 10 am and 10 am to 12 pm if the trap was changed at 10 am). The slides were examined under a light microscope at 100× magnification and C. beticola conidia were counted. These conidia were identified based on relative size (2.5–4 µm wide and 50–200 µm long) and morphology (multiseptate, solitary conidia that are straight or slightly curved) using descriptions given by Weiland & Koch (Citation2004) and Groenewald et al. (Citation2013). To avoid confusion with other species, slides of spores were made from C. beticola isolated from CLS-infected leaves in pure culture. These slides were used to compare with conidia captured in the volumetric tape.
Disease observation and DSVs
To observe first symptoms of CLS, four fungicide-free research plots located in the same commercial field as each spore trap, and the surrounding commercial field at each location, were scouted weekly, beginning in early June at both PC and RT sites. The fungicide-free research plots were part of a fungicide trial at each site, measured 1.5 m by 7 m, and received no foliar fungicide applications. At the PC sites, the fields were scouted in a zig-zag pattern over 45–90 min, making stops approximately every 2–5 min (9–45 stops). At the RT site, the experiment was scouted in a similar pattern for 15–30 min, making stops every 2–3 min (5–15 stops); the RT sites were only 0.5 ha, and took less time to scout than the PC commercial fields (50–150 ha). BEETcast™ DSVs were recorded at each site beginning 1 May and accumulated DSV values were compared with CLS first symptom appearance, disease severity and conidia concentrations.
After symptoms were found, the disease severity was recorded weekly in four fungicide-free research plots located in the same commercial field as each spore trap by selecting 10 random plants in the first row of each plot. Each week a different random set of plants were evaluated. Cercospora leaf spot severity was assessed using a modified Agronomica scale (Battillani et al., Citation1990 as translated by Vereijssen et al., 2003) of 0–9 adapted to reflect approximate per cent leaf area affected by disease ().
Table 2. Modified Agronomica scale for assessing Cercospora leaf spot severity.
Weather data
Air temperature (AT), RH, rainfall (RF) and leaf wetness (LW) were recorded in near real-time from planting to harvesting in all sites and years. A cylindrical LW sensor (Weather INnovations Consulting LP, Chatham, ON) was placed at the edge of each field at ~0.5 m height. Relative humidity and AT were measured by WIN operated weather stations located on the Ridgetown Campus (42°27ʹ04.2′′N, 81°52ʹ55.1′′W) and within 2 km of the PC sites (42°24ʹ30.7′′N, 82°21ʹ16.4′′W) using an Adcon TR1 Combisensor Temp/RH sensor (AdconTelelmetry, Klosternburg, Austria) and precipitation was measured using Adcon RG1 rainfall gauges. Twenty-year weather normals were calculated for May to September using data from the Chatham Environment Canada Weather Station (42°23ʹ24.024′′N, 82°12ʹ55.008′′W) (Environment Canada, Citation2015).
Data analysis
Conidia counts over the 6 h periods were converted to conidia concentrations (spores m−3) as per Khan et al. (Citation2009). Hourly weather data were used to calculate the mean for each 6 h period to correspond with tape segments. Six-hour weather averages were calculated at 0, 6, 12, 18 and 24 h prior to spore capture to account for the lag time between fungal response and weather conditions. The 6 h weather averages corresponded exactly with conidia counts from 6 h tape segments.
Statistical analyses were conducted using SAS v. 9.4 (SAS Institute Inc., Cary, NC). Conidia concentration data were checked for homogeneity of error by plotting residuals and normality was determined with the Shapiro–Wilk statistic. Lund’s test was used to identify outliers; none were found. When necessary, a logarithmic transformation was applied to the data; the back transformed data were presented. Data were pooled when there was no site × treatment interaction. The same data were run in a multiple stepwise regression in PROC REG following the method of Ngo (Citation2012). The significance level of P = 0.10 was used to determine which variables were retained in the reduced model as Ngo (Citation2012) indicates that variables at this level of significance may still be important. Co-linearity was assessed with variance inflation factors and Spearman correlations during model building and assessment. Using a fitted exponential equation, Khan et al. (Citation2009) examined the relationship of C. beticola conidia concentration and temperature when RH humidity was greater than 87%; however, this approach was not used in the present study because relative humidity rarely exceeded this threshold, the significance of this RH humidity threshold in the GLR is unknown, and it did not permit the analysis of other variable such as leaf wetness and rainfall. To determine if there was a temporal pattern to spore dispersal, each 6 h segment was assigned a number 1–4. Conidia counts and segment number for each site were run in an ANOVA (P ≤ 0.05) in PROC MIXED where location and time segment were fixed effects. Tukey’s test was used to separate means (P ≤ 0.05).
The relationship between conidia concentration and disease severity was initially determined using an approach like the one used by Khan et al. (Citation2009). Weekly cumulative conidia volume was calculated and plotted against weekly disease severity ratings in SigmaPlot v12.5 (Systat Software, Inc., San Jose, CA) to provide an initial indication of the best fitting curve. This suggested a logistic curve was a better fit than an exponential curve. To confirm this, the curve of best fit for each site was selected by comparing Akaike Information Criterion (AIC) values obtained in PROC NLIN for three- and four-parameter logistic models and one- and two-parameter exponential models (Spiess & Neumeyer, Citation2010). Start values in PROC NLIN were selected from parameter estimates in SigmaPlot (Archontoulis & Miguez, Citation2014). The model with the lowest AIC value was selected (Spiess & Neumeyer, Citation2010).
Results
Diurnal pattern of C. beticola conidia concentration
Analysis of variance of conidia concentration data in 6 h increments showed that airborne conidia concentration peaked during the time period 12 pm to 6 pm and was 0.33, 0.27 and 0.49 spores m−3 greater than during time segments 6 am to 12 pm, 6 pm to 12 am, and 12 am to 6 am (). Time segments 6 am to 12 pm and 6 pm to 12 am also had 0.16 to 0.22 spores m−3 greater concentration than the 12 am to 6 am time segment.
Table 3. Diurnal Cercospora beticola conidia concentration in sugar beet fields in Pain Court and Ridgetown, ON, 2014–2015.
Seasonal pattern of C. beticola conidia concentration and CLS progression
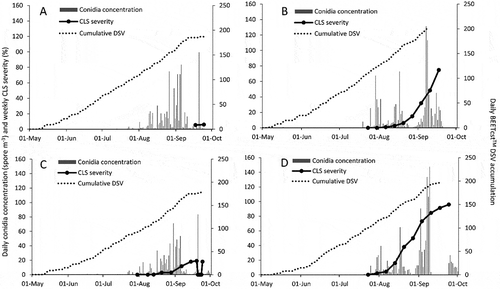
Sites were monitored for the presence of CLS symptoms beginning in early June each year. Conidia of C. beticola were first found on 2 May and 11 June in 2014 at RT and PC, respectively, and 9 May in 2015 at both sites. Cercospora leaf spot symptoms were found on 10 September in 2014, and 23 July in 2015 at PC site (Fig. 1b), which were 91 and 75 d after the first conidia detection. Disease symptoms were first observed on 16 July in 2014 and 23 July in 2015, which were 75 d after the first conidia at RT site (). Cercospora leaf spot severity was lowest at the 2014 sites (a, c) and highest at RT 2015 (). Daily conidia concentrations peaked in early September at PC and RT 2015 (b, d), and mid-September at PC and RT 2014 (a, c). Maximum daily conidia concentration was 84, 100, 131 and 148 spores m−3 at RT 2014, PC 2014, PC 2015 and RT 2015. BEETcast™ DSVs accumulated in a similar manner at each site. A total of 170, 193, 160 and 184 DSVs accumulated between 1 May and 1 September at PC 2014, PC 2015, RT 2014 and RT 2015 (a, c).
Fig. 1 Daily conidia concentration (spores m−3), daily cumulative disease severity values (DSVs), and weekly disease severity (%) in fungicide-free research plots at two locations in ON: (a) Pain Court, 2014, (b) Pain Court, 2015, (c) Ridgetown, 2014 and (d) Ridgetown, 2015.
Relationship of C. beticola conidia concentration with weather variables
Weather variables were monitored in near real time at each site from late April or early May until harvest. Mean daily ATs peaked between 25.5 and 26.5°C at all sites. However, there were only 4 and 6 d with a daily mean temperature over 25.0°C at the 2015 and 2014 sites, respectively (Figs 2a–d). Mean seasonal temperature was 17.0°C at RT and PC 2014 and 18.5–19.1°C at RT and PC 2015. Mean, minimum and maximum daily temperatures in 2014 and 2015 at both sites tended to be lower than the 20 year normals for Chatham, Ontario, particularly in July and August (). Maximum daily mean RH was lower at the PC sites (91.9 in 2015 and 93.1% in 2014) compared with the RT sites (98.8 in 2015 and 98.1% in 2014) (a–d). The peak daily mean RH occurred in early September at both 2014 sites (a, c); however, 31 May had the highest and second highest mean RH at PC and RT 2015 (b, d). At PC 2015, the largest RF events yielded 45.6, 31.4, 30.8 and 24.2 mm of rain, while all other days had less than 18.5 mm of precipitation (b). Similar RF patterns were observed at RT 2015, where only 31 May, 27 June, 25 July, 3 August and 19 September had over 27 mm of rain (d). Mean monthly RF was lower in 2015, with 76 and 82 mm month−1 at RT and PC compared with 90 and 97 mm month−1 at PC and RT 2014, respectively. Mean monthly RF in 2014 was similar to the 20 year mean monthly RF of 82 mm month−1, whereas 2015 mean monthly RF was up to 15% higher than the 20 year normal ().
Table 4. Weather patterns at field sites in Pain Court and Ridgetown, ON in 2014 and 2015 compared to the 20 year normal for Chatham, ON.
Fig. 2 Daily mean air temperature (AT), total rain fall (RF), and mean relative humidity (RH) at two locations in ON: (a) Pain Court, 2014, (b) Pain Court, 2015, (c) Ridgetown, 2014 and (d) Ridgetown, 2015.
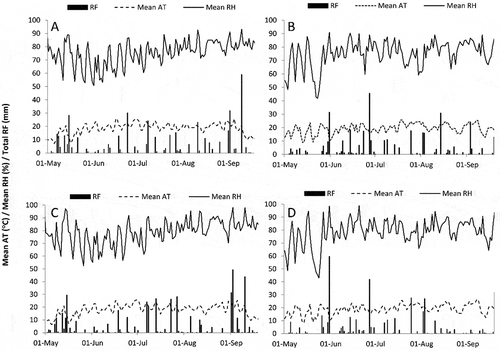
Fig. 3 The relationship between weekly cumulative conidia concentration (spores m−3) and CLS disease severity (%) from the time of first conidia detection at Pain Court and Ridgetown, ON, 2014 and 2015. The fitted three parameter logistic equations are Pain Court 2014 y = 17.20/(1 + e(x – 11.38/82.34)), R2 = 0.93, n = 23; Pain Court 2015 y = 90.51/(1 + e(x – 111.6/26.01)), R2 = 0.98, n = 19; Ridgetown 2014 y = 29.60/(1 + e(x – 70.36/13.85)), R2 = 0.98, n = 21; Ridgetown 2015 y = 90.51/(1 + e(x – 111.6/26.01)), R2 = 0.98, n = 19.
Multiple stepwise regression analysis was conducted using time segment (12 am to 6 am, 6 am to 12 pm, 12 pm to 6 pm, and 6 pm to 12 am) and mean 6 h AT, RH, total RF and LW data collected 0, 6, 12, 18 and 24 h before spore capture. Mean 6 h AT at 0 h, mean RH at 0, 6, 12 and 24 h, total RF at 0, 6, 12, 18 and 24 h, LW at 0 and 12 h, and time segment before spore capture were selected by the analysis (model R2 = 0.1639) (). Mean AT at 0 h before spore capture explained 10.9% (partial R2 = 0.1086) of the variability of 6 h conidia concentration. All other variables contributed less than 2.7% (partial R2 < 0.0266).
Table 5. Stepwise multiple regression of airborne Cercospora beticola conidia concentration (spores m−3) (calculated every 6 h), time segment, and weather variables at time of spore capture and 6, 12, 18 and 24 h before spore capture from sugar beet fields in Pain Court and Ridgetown, Ontario, 2014 and 2015.
Relationship of C. beticola conidia concentration with CLS severity
Sites were monitored weekly for the presence of CLS symptoms in four fungicide-free research plots and mean disease severity values plotted against the weekly cumulative conidia concentration. A three-parameter logistic equation was the best fit for all sites based on comparison of AIC values (data not shown) with all R2 values ≥ 0.93 (). Weekly cumulative spore concentration ranged from just over 100 spores m−3 at RT 2014 to just over 150 spores m−3 at RT 2015, while CLS severity at the sites ranged from under 20% at PC 2014 to over 80% at RT 2015.
Discussion
Variable RH thresholds favouring C. beticola conidia release are reported in the literature. Earlier research reported that RH over 60% is required for conidia release (Pool & McKay, Citation1916; Potter & Schneider, Citation1981), but more recently, it has been suggested that RH of 90–95% supports sporulation, germination and infection (Jacobsen & Franc, Citation2009). Conidia production is promoted by temperatures ranging from 15 to 23°C and inhibited by temperatures below 10°C and above 38°C, and RH below 60% (Jacobsen & Franc, Citation2009). The temporal pattern of C. beticola conidia concentration was studied in North Dakota and Minnesota using volumetric spore traps (Khan et al., Citation2009). Conidia concentration peaked late in the season and was correlated with average daily temperature when RH was above 87%. Daily mean temperatures below 10°C reduced conidia concentration (Khan et al., Citation2009). In this study, the season and diurnal patterns of C. beticola were monitored and the relationship of these patterns with weather variables 0, 6, 12, 18 and 24 h before spore capture, time of spore capture, and CLS appearance and severity were evaluated. Airborne conidia concentration of C. beticola was affected by the time of day, but the appearance of C. beticola conidia was not closely associated with the appearance of CLS symptoms. Weekly cumulative conidia concentration and disease severity followed a logistic curve at all sites, but similar cumulative conidia concentrations resulted in variable levels of disease severity at different sites. The weather variable with the greatest influence on conidia concentration was mean AT at the time of spore capture.
This is the first report of a diurnal effect on the concentration of airborne C. beticola conidia, which was highest from 12 pm to 6 pm. A diurnal effect was also found for pecan scab (Fusicladium effusum) in pecan in Georgia, USA (Gottwald & Bertrand, Citation1982) where hourly conidia concentration increased at sunrise and peaked at 12 pm (Gottwald & Bertrand, Citation1982). Conidia concentration in the current study appeared to peak during the warmest part of the day rather than during the early morning when there is higher relative humidity but cooler temperatures. The highest diurnal spore concentrations coincided with the most turbulent part of the day, and conversely the lowest concentrations coincided with the least turbulent time of day. Perhaps wind plays a more important role in the aerobiology of C. beticola than considered previously, warranting further investigation.
Cercospora beticola conidia were first detected on 2 May and 11 June in 2014 at RT and PC, respectively, and 9 May in 2015 at both sites. These dates are much earlier in the season compared with those observed by Khan et al. (Citation2009), where the first instance of C. beticola conidia occurred on 5 and 3 July in 2003 and 24 and 22 June in 2004 in Minnesota and North Dakota, respectively. One reason for this difference may be because Khan et al. (Citation2009) monitored sites that were artificially inoculated in early June and monitoring did not begin until after inoculation, whereas in this study monitoring began early in the season and sites were not inoculated so that early season conidia activity could be included in the analysis.
Michigan Sugar Company (MSC) growers in Michigan and Ontario have used the BEETcast™ forecasting model from Weather INnovations (WIN) (Pitblado & Nichols, Citation2005) since 2004 (Windels, Citation2010). BEETcast™ calculates a daily disease severity value (DSV) from 0–4, where a DSV of 0 indicates very unfavourable conditions for CLS development and a DSV of 4 indicates optimal conditions for CLS development. A fungicide application is recommended when the accumulated DSVs reach a predetermined threshold (Pitblado & Nichols, Citation2005; Windels, Citation2010). Current thresholds suggested by the Michigan Sugar Company range from 35 to 65 DSVs for the first fungicide application and 15 to 45 DSVs for subsequent applications depending on cultivar tolerance to CLS and the CLS risk zone (Michigan Sugar Company, Citation2017). The appearance of conidia preceded first CLS symptoms by 75 d at both RT sites and PC 2015, while symptoms were found after 91 d at RC 2014. Similarly, cumulative BEETcast™ DSVs reached a value of 65, the highest threshold to first fungicide application recommended by the Michigan Sugar Company, 3 to 72 d before the first CLS symptoms appeared (Michigan Sugar Company, Citation2017). The lag time between reaching the first BEETcast™ DSV threshold and the first symptom appearance is expected as BEETcast™ is designed to be a conservative tool to estimate disease risk and application of the first fungicide after the first appearance of symptoms is considered important to limit disease epidemics in the GLR (Michigan Sugar Company, Citation2017). The lag time between initial conidia appearance and symptom occurrence is probably because weather conditions in May and June were not appropriate for infection of sugar beet.
It is also possible that C. beticola conidia in the GLR are adapted to lower temperatures than previously reported. Daytime temperature of 25–35°C is reported to be favourable for CLS development (Forsyth et al., Citation1963; Shane & Teng, Citation1983); however, Potter & Schneider (Citation1981) reported that a temperature range of 15–23°C favours conidia production. Despite the relatively high conidia concentration observed at lower than previously reported ATs, infection at these temperatures is unlikely to occur as germination and infection require daytime temperatures of 25–35°C (Windels et al., Citation1998; Jacobsen & Franc, Citation2009). Pool & McKay (Citation1916) found that C. beticola was able to germinate and grow at temperatures as low as 9°C, although temperatures around 30°C were considered optimal. Having high conidia concentration at a wide range of temperatures may be a strategy used by C. beticola to ensure that conidia pressure is high when the correct conditions occur for germination and infection, thus increasing the probability of infection (Mollison, Citation1991; Ostfeld et al., 2005).
Daily mean conidia concentration peaked at 84 and 100 spores m−3 on 20 September 2014 at RT and PC, and 131 and 148 spores m−3 on 7 and 9 September 2015 at PC and RT. Khan et al. (Citation2009) found that daily mean conidia concentration peaked at approximately 29 and 18 spores m−3 on 24 and 25 August 2003 and 160 and 13 spores m−3 on 2 and 4 September 2004 in Minnesota and North Dakota. While maximum conidia concentrations were reached around the same date in both studies, concentrations were generally much higher in the Ontario study compared to the North Central USA study even when conditions were suboptimal for infection. Some of these differences could be attributed to the fact that the work of Khan et al. (Citation2009) was conducted in the North Central USA which typically has less severe CLS compared with the GLR. The highest severity ratings in trials completed in Minnesota were 6, 12 and 50% severity, in the 2014, 2013 and 2012 non-treated controls, respectively (Khan & Hakk, Citation2012, Citation2013, Citation2014), whereas the highest severity was 96% in Ontario experiments conducted concurrently with the present study (Tedford, Citation2016). Therefore, it is expected that the concentration of C. beticola conidia in the GLR would be higher than that found in the North Central USA.
Daily mean AT was identified as the most important variable for predicting airborne C. beticola conidia concentration. This result is similar to Khan et al. (Citation2009) who found an exponential relationship between daily conidia concentration and temperature when RH was above 87%. However, the R2 value resulting from the multiple regression analysis in this study was much lower than Khan et al. (Citation2009). This may be because conidia concentration from all 6 h time segments was included in the analysis as it was not possible to include only segments when RH exceeded 87% due to very few instances when this condition occurred. Daily relative humidity of at least 90% was recorded only two to 17 times at sites in this study. Air temperature was similar among locations and years but lower than 20-year normal for maximum, minimum and mean AT of 24.0, 14.0 and 19.0°C in Chatham, ON. Thus, it is possible that in years or locations with warmer ATs, mean or maximum RH and AT may be more predictive than mean AT alone. The inclusion of additional site years to this data set may clarify the relationship between AT and C. beticola conidia release in the GLR. Despite the cooler ATs and low RH, conidia counts were still high at all sites. This result coupled with low disease levels found during the early season, suggests that environmental conditions supported conidia production over infection, and that conidia are not likely to be a limiting factor in epidemics. Neither total RF nor LW, which were not evaluated by Khan et al. (Citation2009), were important factors affecting the concentration of aerial conidia of C. beticola although these variables are important for C. beticola infection (Shane & Teng, Citation1983).
Weekly cumulative spore concentration was positively related to disease severity at all four sites. The disease severity curves fit a three-parameter logistic curve better than a one- or two-parameter exponential curve or a four-parameter logistic curve, whereas Khan et al. (Citation2009) fit similar data to an exponential model because of a lack of asymptote in the data. Weekly cumulative spore concentration at different sites did not result in similar levels of disease among sites. For example, when the cumulative value of 100 spores m−3 was reached, disease severity at RT 2015 was over 80%, between 20 and 40% for RT 2014 and PC 2015, and less than 5% for PC 2014. A similar pattern was observed for C. beticola conidia and CLS severity in North Dakota and Minnesota (Khan et al., Citation2009), and supports the idea that conidia concentration is not a limiting factor for CLS epidemics.
Currently, the BEETcast™ model does not use conidia dispersal information to predict CLS risk. The results of this study do not indicate that conidia are a limiting factor for successful CLS infection, thus it is unlikely that adding such information to the BEETcast™ model would improve predictions. An alternative approach for future research may be to combine airborne inoculum data with weather data that favours conidial germination and infection, which is like the sporulation and infection periods used to determine risk in the BREMCAST disease forecasting tool (Kushalappa, Citation2001). Daily conidia concentration was found to peak between 12 pm and 6 pm, which indicates that one possible option to improve the BEETcast™ model is to weigh more heavily favourable environmental conditions for C. beticola infection occurring in the afternoon as chances of infection may be increased due to high conidia levels. Given that seasonal weather conditions in the study were abnormal compared with the long-term and the relatively low R2 value of the multiple regression model predicting conidia concentration, it would be beneficial to validate results using additional site years.
Additional information
Funding
References
- Archontoulis SV, Miguez FE. 2014. Nonlinear regression models and applications in agricultural research. Agron J. 107:786–798.
- Battillani P, Beltrami G, Meriggi P, Ponti I, Rossi A, Rossi V, Rosso F, Tugnoli V, Zocca A. 1990. [month and date unknown]. Nuovi indrizzi di difesa anticercosporica. Edizioni L’Informatore Agrario. 46:53–70.
- Bolton MD, Secor GA, Rivera V, Weiland JJ, Rudolph K, Birla K, Rengifo J, Campbell LG. 2012. Evaluation of the potential for sexual reproduction in field populations of Cercospora beticola from USA. Fungal Biol. 116:511–521.
- Draycott PA. 2006. Sugar beet. Oxford (UK): Blackwell Publishing.
- Environment Canada. 2015. Canadian climate normals 1981-2010 Station Data. [Internet] [revised 2017 Jun 1, accessed 2016 Apr 17]. http://climate.weather.gc.ca/climate_normals/results_1981_2010_e.html?stnID=4619&lang=e&StationName=chatham&SearchType=Contains&stnNameSubmit=go&dCode=
- Forsyth FR, Unwin CH, Jursic F. 1963. Cultural and pathogenic studies of an isolate of Cercospora beticola Sacc. Sugar Beet Res. 14:319–323.
- Gottwald TR, Bertrand PC. 1982. Patterns of diurnal and seasonal airborne spore concentrations of Fusicladium effusum and its impact on a pecan scab epidemic. Phytopathology. 72:330–335.
- Groenewald JZ, Nakashima C, Nishikawa J, Shin HD, Park JH, Jama AN, Groenewald M, Braun U, Crous PW. 2013. Species concepts in Cercospora: Spotting the weeds among the roses. Stud Mycol. 75:115–170.
- Jacobsen BJ, Franc GD. 2009. Foliar disease caused by fungi and Oomycetes. In: Harveson RM, Hanson LE, Hein GL, editors. Compendium of beet diseases and pests. 2nd ed. St. Paul (MN): APS Press; p. 7–10.
- Khan J, del Rio LE, Nelson R, Rivera-Varas V, Secor GA, Khan MFR. 2008. Survival, dispersal, and primary infection site for Cercospora beticola in sugar beet. Plant Dis. 92:741–745.
- Khan J, Qi A, Khan MFR. 2009. Fluctuations in number of Cercospora beticola conidia in relationship to environment and disease severity in sugar beet. Phytopathology. 99:796–801.
- Khan MFR, Hakk P. 2012. Efficacy of fungicides for controlling Cercopspora leaf spot on sugarbeet. Sugarbeet Research and Education Board. [Internet] [revised unknown, accessed 2014 Jun 16]. http://www.sbreb.org/research/plant/plant12/KhanEvaluatingFungicides.pdf
- Khan MFR, Hakk P. 2013. Efficacy of fungicides for controlling Cercospora leaf spot on sugarbeet. Sugarbeet Research and Education Board. [Internet] [revised unknown, accessed 2014 Jun 16]. http://www.sbreb.org/research/plant/plant13/KhanEfficacyOfFungicidesCLS.pdf
- Khan MFR, Hakk P. 2014. Efficacy of fungicides for controlling Cercospora leaf spot on sugarbeet. Sugarbeet Research and Education Board. [Internet] [revised unknown, accessed 2015 Jan 30]. http://www.sbreb.org/research/plant/plant14/FungicidesCercosporaKhan2014.pdf
- Kushalappa AC. 2001. BREMCAST: Development of a system to forecast risk levels of downy mildew on lettuce (Bremia lactucae). Int J Pest Manag. 47:1–5.
- Licht FO. 2005. F.O. Licht world sugar yearbook. Tunbridge Wells (UK): Agra Informa Ltd.
- McKay MB, Pool VW. 1918. Field studies of Cercospora beticola. Phytopathology. 8:119–140.
- Michigan Sugar Company. 2017. Growers’ guide for producing quality sugarbeets. Michigan Sugar Company Corporate Agricultural Office. [Internet] [revised unknown, accessed 2017 Sep 14]. https://www.michigansugar.com/growing-production/grower-guide/
- Ngo THD. 2012. The steps to follow in a multiple stepwise regression analysis. SAS Global Forum 2012, paper 333-2012. [Internet] [revised unknown, accessed 2015 Jun 7]. http://support.sas.com/resources/papers/proceedings12/333-2012.pdf
- Mollison D. 1991. Dependence of epidemic and population velocities on basic parameters. Math Biosci. 107:255–287.
- Ostfeld RS, Glass GE, Keesing F. 2005. Spatial epidemiology: an emerging (or re-emerging) discipline. Trend Ecol Evolut. 20:328–336.
- Pitblado R, Nichols I. 2005. The implementation of BEETCAST- a weather-timed fungicide spray program for the control of Cercospora leaf spot in Ontario and Michigan. J Sugar Beet Res. 42:53–54.
- Poindexter S. 2014. Grower’s Cercospora resistance management: The good, the bad, and the ugly. In: The Newsbeet: Winter 2013-2014, 28. Michigan Sugar Company. [Internet] [revised unknown, accessed 2014 Jun 16]. http://www.michigansugar.com/wp-content/uploads/2014/03/MSCNewsbeet_Winter2014_Web.pdf
- Pool VW, McKay MB. 1916. Climatic conditions as related to infection by Cercospora beticola. J Agric Res. 6:21–60.
- Potter HS, Schneider CL. 1981. Sugar beet disease of the North Central United States. Publisher location unknown: Michigan State Univ. North Central Regional Extension Publication No. 140.
- Shane WW, Teng PS. 1983. Cercospora beticola infection prediction model. Sugar Beet Res Extension Rep. 23:174–179. [Internet] [revised unknown, accessed 2016 Jul 13]. http://www.sbreb.org/research/plant/plant83/83p174.htm
- Shane WW, Teng PS. 1992. Impact of Cercospora leaf spot on root weight, sugar yield, and purity of Beta vulgaris. Plant Dis. 76:812–820.
- Spiess A-N, Neumeyer N. 2010. An evaluation of R2 as an inadequate measure for nonlinear models in pharmacological and biochemical research: a Monte Carlo approach. BMC Pharmacol. 10:6.
- Stewart J. 2016. When the pressure is high how can we control Cercospora leafspot? In: The Newsbeet: Winter 2015-2016, 30. [Internet] [revised unknown, accessed 2016 Jul 13]. http://www.michigansugar.com/wp-content/uploads/2016/03/winter-2015-16.pdf
- Tedford S 2016. Management of Cercospora leaf spot in sugar beet and aerobiology of Cercospora beticola Sacc [ dissertation]. Ridgetown (ON): University of Guelph.
- Trueman CL, Burlakoti R 2014a. Evaluation of fungicide programs and application water volume for management of Cercospora leaf spot in sugarbeet, Pain Court, Ontario. 2013 Trial Results, Michigan-Ontario Sugarbeet Research & Education Advisory Council, p. 56–57. [Internet] [revised unknown, accessed 2017 Oct 29]. https://www.michigansugar.com/wp-content/uploads/2014/01/rr_2013.pdf
- Trueman CL, Burlakoti R 2014b. Evaluation of fungicide programs and application water volume for management of Cercospora leaf spot in sugarbeet, Ridgetown, Ontario. 2013 Trial Results, Michigan-Ontario Sugarbeet Research & Education Advisory Council, p. 58. [Internet] [revised unknown, accessed 2017 Oct 29]. https://www.michigansugar.com/wp-content/uploads/2014/01/rr_2013.pdf
- Vereijssen J, Scheider JHM, Termorshuizen AJ, Jeger MJ. 2003. Comparison of two disease assessment keys to assess Cercospora beticola in sugar beet. Crop Prot. 22:201–209.
- Vereijssen J, Schneider JHM, Termorshuisen AAJ. 2004. Possible root infection of Cercospora beticola in sugar beet. Eur J Plant Pathol. 110:103–106.
- Weiland J, Koch G. 2004. Pathogen profile: Sugarbeet leaf spot disease (Cercospora beticola Sacc.). Mol Plant Pathol. 5:157–166.
- Windels CE. 2010. Cercospora leaf spot prediction models in North America. In: Lartey RT, Weiland JJ, Panella L, Crous PW, Windels CE, editor. Cercospora leaf spot of sugar beet and related species. St. Paul (MN): APS Press; p. 235–250.
- Windels CE, Lamey HA, Dave H, Widner J, Knudsen T. 1998. A Cercospora leaf spot model for sugar beet in practice by an industry. Plant Dis. 82:716–726.