
Abstract
Charcoal rot of soybean (Glycine max (L.) Merr.), caused by Macrophomina phaseolina (Tassi) Goid., is an economically important disease worldwide. In recent years, charcoal rot has become a concern for farmers in north-western Argentina. The present work aimed to (1) evaluate disease incidence of charcoal rot; (2) assess morphological and genetic characteristics of M. phaseolina isolates from soybean and other hosts collected in north-western Argentina; and (3) compare genetic diversity between soybean isolates of M. phaseolina from Argentina and the USA. Incidence of charcoal rot evaluated in 11 locations during five growing seasons (2008–2012) was 1%, 1%, 1%, 5–10% and 90%, respectively, indicating a gradual increase over the cropping seasons. Cluster analysis by AFLP of Argentinean isolates exhibited one main group, with isolate Mp56 separated at a genetic distance of 0.70. Four main groups were identified using SSR markers at the same genetic distance, with Mp56 and Mp53 separated from them. There was no clear association between AFLP, SSR profiles, morphological characteristics or host of origin within isolates from Argentina. However, using principal coordinate analysis of SSRs, 22 isolates of M. phaseolina from soybean from north-western Argentina were clearly distinguished from 11 isolates previously collected from two states in the USA. Our results confirmed the increasing importance of charcoal rot in north-western Argentina and identified characteristics of isolates that may be useful for breeding for disease resistance and developing integrated management programmes for charcoal rot in Argentina in the future.
Résumé
La pourriture noire du soya (Glycine max (L.) Merr.), causée par Macrophomina phaseolina (Tassi) Goid., est une maladie économiquement importante dans le monde entier. Depuis les dernières années, elle préoccupe les producteurs du nord-ouest de l’Argentine. Ces travaux visaient à: (1) estimer l’incidence de la maladie; (2) évaluer les caractéristiques morphologiques et génétiques des isolats de M. phaseolina collectés sur le soya et d’autres hôtes du Nord-Ouest argentin; et (3) comparer la diversité génétique entre les isolats de M. phaseolina collectés sur le soya en Argentine et aux États-Unis. L’incidence de la pourriture noire évaluée à 11 endroits durant 5 saisons de croissance (de 2008 à 2012) était de 1%, 1%, 1%, 5–10% et 90%, respectivement, ce qui indique une progression graduelle d’une saison à l’autre. L’analyse typologique des données AFLP des isolats argentins a fait ressortir un groupe principal incluant l’isolat Mp56 séparé par une distance génétique de 0.70. Quatre groupes principaux ont été identifiés à l’aide de marqueurs SSR à la même distance génétique, Mp56 et Mp53 en étant séparés. Il n’y avait pas de corrélation nette entre les données AFLP, les profiles SSR, les caractéristiques morphologiques ou l’hôte d’origine parmi les isolats argentins. Toutefois, en utilisant l’analyse des principales coordonnées des SSR, 22 isolats de M. phaseolina collectés sur le soya du nord-ouest de l’Argentine ont été nettement différenciés de 11 isolats préalablement collectés dans deux États américains. Nos résultats confirment l’importance croissante de la pourriture noire dans le nord-ouest de l’Argentine. Ils ont permis de définir les caractéristiques des isolats qui pourraient être utiles en vue d’une sélection visant la résistance et l’élaboration d’un programme de gestion intégrée pour, dans l’avenir, combattre la pourriture noire en Argentine.
Introduction
Charcoal rot is caused by Macrophomina phaseolina (Tassi) Goid. and affects nearly 500 species in more than 100 plant families (Mihail & Taylor, Citation1995). Symptoms range from seedling blight, root and stem rot, wilt, and pre- to post-emergent damping off, which result in decreased stem height, girth, root and head weight, or death of affected plants (Raut, Citation1983). The abundant production of black microsclerotia by the fungus causes the rotted tissues to become blackened, and for this reason the disease is known as charcoal rot (Sarr et al., Citation2014). The pathogen has a wide morphological, physiological, genetic and pathogenic variability that has allowed its adaptation to different environmental conditions and hence a wide geographic distribution (Diourte et al., Citation1995; Srivastava et al., Citation2001; Su et al., Citation2001; Mayek-Pérez et al., Citation2001a: Reyes-Franco et al., Citation2006). Among the most economically important hosts affected by M. phaseolina are soybean (Glycine max (L.) Merr.) (Mengistu et al., Citation2015), chickpea (Cicer arietinum L.) (Srivastava et al., Citation2001), common bean (Phaseolus vulgaris L.) (Mayek-Pérez et al., Citation2001a), cotton (Gossypium spp.) (Watkins, Citation1981), maize (Zea mays L.) (White, Citation1999) and sorghum (Sorghum bicolor (L.) Moench.) (Sharma et al., Citation2014). In addition, infection on Barbeton daisy (Gerbera jamesonii Bolus ex Hooker f.) (Panda et al., Citation2014), lentil (Lens culinaris Medik.) (Kaiser & Horner, Citation1980), peanut (Arachis hypogaea L.) (Mehan & McDonald, Citation1997), and sunflower (Helianthus annuus L.) (Khan, Citation2007) has also been reported.
Symptoms of charcoal rot on soybean include reddish-brown lesions in the hypocotyl region of seedlings that later become ash-grey and then change to black (Wyllie, Citation1989). Mature plants exhibit chlorotic lesions followed by death of leaves that remain attached to the stem leading to premature plant death (Ploper & Scandiani, Citation2009). The best diagnostic symptom to confirm charcoal rot infection in soybean is to peel the epidermis away from the stem, exposing the presence or absence of microsclerotia that are frequently produced in the xylem and pith of the stem (Wyllie, Citation1989; Mengistu et al., Citation2015). Drought and high temperatures favour disease development (Mihail, Citation1992).
Charcoal rot is an economically important disease on soybean in North and South America, Asia, Australia, Africa and Europe. In 2006, yield losses caused by M. phaseolina worldwide were estimated at 4.2% (Wrather et al., Citation2010), while across the 16 southern states in the USA, the estimate was 7.6% in 2016 (Allen et al., Citation2016). In field experimental plots, however, losses were calculated to be 30% on soybean (Mengistu et al., Citation2011). Due to soybean now being cultivated in environments less favourable for its growth, especially in terms of rainfall, charcoal rot has become an eminent economic problem in Argentina.
Variations in morphological and physiological characteristics of M. phaseolina have previously been reported (Pearson et al., Citation1986a, Citation1986b; Su et al., Citation2001) and differences in the pathogenicity or host preference among isolates were also detected (Diourte et al., Citation1995; Su et al., Citation2001; Reyes-Franco et al., Citation2006). More specifically, genetic variation has been detected using molecular markers (Mayék-Pérez et al., Citation2001b; Muñoz-Cabañas et al., Citation2005; Baird et al., Citation2009, Citation2010). Random amplified polymorphic DNA (RAPD) has been used to detect associations between M. phaseolina isolates and host-plant origin (Su et al., Citation2001; Purkayastha et al., Citation2006; Bashasab & Kuruvinashetti, Citation2007). Similarly, universal rice primers (URP) (Jana et al., Citation2005), random amplification of fragments using oligo repeats (Saleh et al., Citation2010) and SSR markers (Arias et al., Citation2011) have been used. No clear associations were detected between genetic profile and host or geographic origin using AFLP markers (Mayék-Pérez et al., Citation2001b; Muñoz-Cabañas et al., Citation2005) or SSR markers (Baird et al., Citation2009, Citation2010).
The objectives of this research were to: (1) evaluate disease incidence of charcoal rot in soybean production areas of north-western Argentina; (2) assess morphological and genetic characteristics of M. phaseolina isolates from soybean and other hosts collected in north-western Argentina; and (3) compare genetic diversity between soybean isolates from north-western Argentina and soybean isolates previously reported in two states in the USA.
Materials and methods
Field evaluation of charcoal rot in soybean
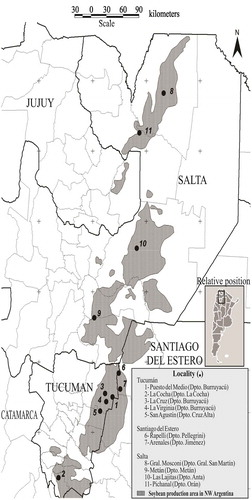
The soybean growing season in north-western Argentina starts with planting in December and harvesting ends in May of the following year. Disease incidence was evaluated in each of five growing seasons represented by the spring planting date and the harvest date in May of the successive year between 2008/2009 through 2012/2013. From this point forward, the beginning year of each season (i.e. 2008, 2009, 2010, 2011 and 2012) will be used to represent the entire season. Observations were made in the same 18 commercial soybean fields in 11 geographically distinct locations representing the total soybean cropping area of north-western Argentina. In Tucumán province, eight fields were evaluated – three in La Cocha, one in Puesto del Medio, one in San Agustín, two in La Cruz and one in La Virginia. In Salta province, five fields were evaluated in General Mosconi, one in Pichanal, one in Las Lajitas and one in Metán. In Santiago del Estero province, one field was evaluated in Arenales and one in Rapelli (, Supplementary Table 1). All soybean cultivars planted in the 18 fields were equally susceptible to charcoal rot. Disease incidence (expressed as a percentage of plants exhibiting charcoal rot symptoms and signs from the total plants sampled), was evaluated every 15 days beginning at emergence (VE) through physiological maturity (R7) (Fehr et al., Citation1971). A modified ‘W’ sampling pattern was used to select 10 random points for sampling at each season. These sampling points were used in each field (Delp et al., Citation1986). At each sampling point, 3.12 m2 (two 3 m-rows spaced 0.52 m apart) were evaluated to determine disease incidence. To confirm the presence of charcoal rot, the epidermis of each individual plant beginning at the base was peeled away from the stem to detect the signs of the fungus in the form of microsclerotia (Mengistu et al., Citation2015).
Table 1. Primer combinations used for AFLP amplification and SSR markers included in the Macrophomina phaseolina genetic analysis.
Fig. 1 Location of field trials monitored for charcoal rot in soybean during the 2008–2012 seasons. 1: Puesto del Medio (Burruyacú), 2: La Cocha (La Cocha), 3: La Cruz (Burruyacú), 4: La Virginia (Burruyacú) and 5: San Agustín (Cruz Alta) in the province of Tucumán. 6: Rapelli (Pellegrini) and 7: Arenales (Jiménez) in the province of Santiago del Estero. 8: General Mosconi (General San Martín), 9: Metán (Metán), 10: Las Lajitas (Anta) and 11: Pichanal (Orán) in the province of Salta.
Sampling, isolation and morphological characterization of M. phaseolina
Infected soybean, chickpea, common bean, Barbeton daisy, lentil, peanut and sunflower plants exhibiting the characteristic symptoms associated with charcoal rot were collected in Argentina during the 2008 through 2010 crop seasons from commercial fields in Tucumán (19 samples), Santiago del Estero (five samples), Salta (three samples), Santa Fe (one sample) and Buenos Aires (three samples) (Supplementary Table 2). Samples other than soybeans were taken from nearby fields where soybeans were sampled. Samples were rinsed with sterile deionized water. Then, 0.5 cm sections were excised from symptomatic plant tissues. Sections were surface-sterilized with 70% ethanol for 30 s, which was followed by immersion in 0.3% NaClO solution for 1 min, rinsed with sterile water, and air dried under sterile conditions in a laminar flow hood. Samples were placed on acidified potato dextrose agar plates (APDA, Difco, Sparks, MD) with 0.2% lactic acid and incubated at 28 ± 2ºC for 4 days. Using a stereomicroscope, a single microsclerotium was removed with a sterile needle and transferred to fresh APDA. To obtain a genetically pure isolate, a hyphal tip from a single microsclerotium was transferred to another APDA Petri plate. Cultures of each microsclerotial isolate were incubated for 24–48 h in the dark in a growth chamber at 28 ± 2°C, and stored at 4°C.
Table 2. Maximum per cent disease incidence of charcoal root rot values from 18 commercial soybean fields at 11 locations in north-west Argentina during five growing seasons (2008–2012). GPS coordinates are presented in Supplementary Table 1.
To determine variations in cultural characteristics, growth rate, presence or absence of microsclerotia, and presence or absence of aerial mycelium, 31 isolates (22 from soybean and nine from other hosts) were tested using a randomized complete block design with three replications. Each block contained five cultures of each isolate initiated from a 6 mm diameter agar plug and incubated in the dark in a growth chamber at 28 ± 2°C for 3 days. Petri dishes were rotated from the bottom to the top at random every 24 h in order to reduce the effect of placement. Growth rate was measured daily using a digital calliper (Marathon Brand, Ontario, Canada). After 3 days, the colour of the colony was recorded for all cultures. Microsclerotia size was measured using a stereomicroscope (×40) equipped with an ocular micrometer. For this part of the study, 10 cultures of each isolate were incubated in the dark for 7 days and five microsclerotia per culture (n = 50) were measured. Mean comparisons of growth rate and size of microsclerotia (length and width) were performed using the InfoStat software (Balzarini et al., Citation2008) which produced ANOVA and LSD tests at α = 0.05 for mean comparison.
DNA extraction
Each of the 31 isolates was grown in 100 mL of potato-glucose broth for 15 days at 28 ± 2°C, harvested by filtration through a metal filter (1180 µm), washed twice with sterile water and dried at room temperature in a laminar flow hood for 24 h. Dry mycelium was ground with a mortar and pestle with liquid nitrogen. Total DNA was extracted from 100 mg of mycelia treated with CTAB extraction buffer (50 mM Tris-HCl, pH 8.0, 700 mM NaCl, 10 mM EDTA, 10% hexadecyltrimethyl-ammonium bromide – CTAB) combined with 40 μL of 2-mercaptoethanol and incubated for 90 min at 65°C (Murray & Thompson, Citation1980). The DNA was rinsed twice with 400 μL of phenol-chloroform and precipitated with 300 μL of isopropanol containing 1 drop of 3 M ammonium acetate. The DNA pellet was washed with 70% ethanol and diluted to a final volume of 200 μL, and 1 μL of RNAse (10 mg mL−1) was added to each sample. After incubation for 1 h at 37°C, the DNA was purified by extracting with phenol-chloroform, ammonium acetate and isopropanol, and finally with ethanol precipitation, as described above. The DNA was air-dried at room temperature (~28°C), dissolved in sterile distilled water and stored at −20°C for further use. Two independent DNA extractions were performed for each isolate.
Genetic identification
In addition to morphological characterization, specific PCR amplification of the M. phaseolina ITS region was performed according to Babu et al. (Citation2007). Specific primers MpKFI (forward) 5ʹ-CCGCCAGAGGACTATCAAAC-3ʹ and MpKRI (reverse) 5ʹ-CGTCCGAAGCGAGGTGTATT-3ʹ were used. DNA amplification was carried out in a MyCycler BIORAD in a final volume of 20 μL containing 2 µL of 10× PCR buffer, 1.5 mM of MgCl2, 0.2 mM of each dNTP, 0.25 μM of each primer, 0.4 U of Taq DNA Polymerase (Invitrogen, CA) and 35 ng of template DNA. As a positive control of amplifications, a sample of M. phaseolina DNA previously extracted in our laboratory was used. DNA samples from soybean, Fusarium oxysporum and Phakopsora pachyrhizi were used as negative controls.
AFLP protocol and SSR molecular analysis
The AFLP amplifications were performed according to Vos et al. (Citation1995) with modifications as outlined below using 1.2 µg of M. phaseolina DNA. DNA amplifications were performed with 16 primer combinations, as listed in , using 5 μL reaction volume containing 1.25 µL of diluted (1:40) of AFLP pre-amplification DNA, 1.5 mM MgCl2, 1× PCR buffer, 1.5 µM of each primer, 0.8 mM of each dNTP including 0.24 µM of Cy5.5 deoxycytidine triphosphate (dCTP; GE Healthcare, Munich, Germany) as label, and 1.25 U of Taq Polymerase (Fermentas, Life Sciences, CA). Amplification was carried out in a My Cycler thermal cycler (BIO-RAD, CA). To evaluate the reproducibility of the amplified AFLP profile, two independent DNA extractions and AFLP amplifications were performed for each isolate and compared. DNA fragments were scored as one (present) or zero (absent) bands for each sample using Licor SAGATM Generation 2 software (Licor, Lincoln, NE).
A total of 31 M. phaseolina isolates were screened with 28 SSR markers () according to the protocol of Arias et al. (Citation2011). Forward primers were 5ʹ tailed with the sequence 5ʹ-CAGTTTTCCCAGTCACGAC-3ʹ, and this sequence labelled with 6-carboxy-fluorescein (FAM) (IDT-Technologies) was used as universal forward primer. Reverse primers were tailed with the sequence 5ʹ-GTTT-3ʹ. Amplifications were performed for 10 ng DNA using Titanium Taq DNA Polymerase (Clontech) in a final volume of 5 μL on an M&J thermal cycler (BIO-RAD, CA) at 95°C for 1 min, 60°C for 1 min (2 cycles), 95°C for 30 s, 60°C for 30 s, 68°C for 30 s (27 cycles), and a final extension at 68°C for 4 min. Fluorescently-labelled PCR fragments were analysed on an ABI 3730XL DNA analyser and data were extracted using GeneMapper v. 3.7 (both from Applied Biosystems).
For the AFLP markers, only bands that could be clearly scored were included in the analysis, and the data were converted to a binary matrix. For SSR markers, microsatellite amplicons detected as length polymorphisms were compiled into binary data for all loci based on the presence (= 1) or absence (= 0) of alleles. AFLP and SSR analyses were compared by estimating the percentage of polymorphism (band or locus), average number of alleles per primer set or per locus, effective number of alleles and Nei’s genetic diversity (Nei, Citation1973) using the Info-Gen software (Balzarini & Di Rienzo, Citation2013). Cluster analysis of AFLP and SSR markers for M. phaseolina isolates was performed using the Unweighted Pair-Group Method with Arithmetic Averages (UPGMA) with Info-Gen software (Balzarini & Di Rienzo, Citation2013). To evaluate the robustness of the groupings formed, the binary data set was subjected to 1000 bootstrapping replicates using the WINBOOT program (Yap & Nelson, Citation1996), and confidence values greater than 50% were indicated (Highton, Citation1993).
Comparison of isolates from Argentina and the USA
SSR fingerprinting of 22 M. phaseolina isolates from soybean (excluding isolates from other hosts) in north-western Argentina, 10 from Tennessee and one from Illinois in the USA were combined and analysed by principal coordinate analysis using the NTSYS package (Rohlf, Citation1993). The 22 isolates from Argentina and the 11 from the USA were compared with 28 SSR markers to determine whether the selected isolates have similar genotypes.
Results
Field evaluation of charcoal rot in soybean
Disease incidence data from 18 fields at 11 locations in north-western Argentina over a period of five growing seasons (2008–2012) are summarized in . During the first three seasons, charcoal rot incidence remained low and did not exceed 1%. However, significant increases (P = 0.001) in charcoal rot incidence occurred from the first three seasons (2008–2010) to the following two seasons (2011 and 2012). The highest incidence of charcoal rot (90%) was recorded at R7 growth stage in the province of Salta during the 2012 season ().
Isolation and morphological characterization
Significant variations were observed in morphological parameters, such as radial growth, sclerotial length and width, among 31 isolates of M. phaseolina (Mp) collected from provinces in north-western and central Argentina (). All isolates produced dark grey mycelium and did not form aerial mycelium. The growth rate at 28 ± 2°C ranged from 17.1 to 41 mm day−1. Isolates Mp13 and Mp21 exhibited the slowest growth rate (mm day−1), and isolates Mp55, Mp56, Mp68 and Mp69 had a significantly faster growth rate than all isolates ().
Table 3. Province, year of collection and host of isolates of Macrophomina phaseolina collected in Argentina. Mean value for morphological characterization included growth rate (mm day-1), length (L) and width (W) of microsclerotia. Means in each column followed by the same letter are not significantly different (LSD, α = 0.05). GPS coordinates are presented in supplementary table 2.
Microsclerotia sizes ranged from 68.8 × 52.0 µm to 113.7 × 96.0 µm. Isolates Mp14, Mp53, Mp64, Mp68 and Mp69 had significantly larger microsclerotia (P ≤ 0.05) than all other isolates except for isolate Mp7 (). Isolates Mp13 and Mp17 had significantly smaller (P ≤ 0.05) microsclerotia compared with all others except Mp55. Isolate Mp53 produced significantly wider microsclerotia than all other isolates, 96.3 µm (P ≤ 0.05), whereas Mp13 and Mp17 were significantly narrower (P ≤ 0.05) at 51.2 and 52.5 µm, respectively.
Genetic identification
PCR amplifications with specific primers of the ITS region were performed to confirm the identification of the M. phaseolina isolates. The expected band of 350 bp size (Babu et al., Citation2007) was obtained in all 31 isolates and the positive control; negative controls did not produce amplifications (data not shown).
AFLP and SSR molecular analysis
Preliminary AFLP amplifications produced highly reproducible banding patterns; thus, in further amplifications, only one sample per isolate was included. From 31 isolates of M. phaseolina, a total of 667 bands were amplified with 16 pairs of AFLP primers, 89.81% of them being polymorphic. Value of Nei’s genetic diversity was 0.20, average number of alleles per locus was 1.90 and effective number of alleles was 1.31.
The analysis performed by 28 SSR markers produced a total of 172 amplicons, 93.02% of them being polymorphic. Value of Nei’s genetic diversity was 0.27. The average number of alleles per locus and effective number of alleles was 2.00 and 1.42, respectively. shows a comparison of the results obtained with both approaches.
Table 4. Summary of statistics for AFLP and SSR markers from 31 isolates of Macrophomina phaseolina.
Cluster analysis by AFLP at a genetic distance of 0.70 (Arias et al., Citation2011) showed a main group of M. phaseolina isolates with Mp56 separated (); SSR markers identified four main groups at the same genetic distance, with Mp56 and Mp53 separated from them (). No clear associations were observed among geographic origin, year of collection and/or host origin with AFLP or SSR profiles. The reliability of the dendrograms tested by bootstrap analysis with 1000 resampling showed bootstrap values ranging from 33.6 to 100.0 and from 10.2 to 100.0 for AFLP and SSR, respectively.
Fig. 2 Dendrograms of 31 isolates of Macrophomina phaseolina collected in Argentina based on Jaccard’s similarity coefficient using AFLP (2A) and SSR markers (2B). Bootstrap values for 1000 replications are indicated at the corresponding node for each cluster.
Comparison of isolates from Argentina and the USA
Three-dimensional principal coordinate analysis () for 28 SSR () and 33 M. phaseolina isolates from soybean () (22 from north-west Argentina, 10 from Tennessee and one from Illinois) exhibited a clear separation by origin of the isolates from Argentina (A) and from the USA (B). Dimension 1 explained 44% of the genetic variation, followed by 23% and 19% explained by dimensions 2 and 3, respectively.
Table 5. Isolates of Macrophomina phaseolina from soybean used in the three-dimensional principal coordinate analysis (3D PCoA).
Fig. 3 Three-dimensional principal coordinate analysis (3D PCoA) of 33 isolates of Macrophomina phaseolina collected from soybean in Argentina (A) and two states in the USA (B) using 28 SSR markers.
Discussion
In Argentina, charcoal rot is considered an important disease on soybean in seasons when hot and dry weather conditions prevail (Ploper et al., Citation2001). Additionally, M. phaseolina has been reported on other hosts in Argentina, such as common bean, which had an incidence of 2.5% in harvested grains during the 2014 season in Salta province (Casalderrey et al., Citation2016). In chickpea, M. phaseolina was detected in harvested grains from Tucumán, Catamarca and Córdoba provinces during the 2012 season (Aguaysol et al., Citation2013). The incidence of M. phaseolina in maize fields increased from 10% in 2012 to 40% in 2015 in the province of Santa Fe (Laguna et al., Citation2016), Argentina. Charcoal rot of sorghum has also been previously reported in Presidencia Roque Saenz Peña, Chaco during the 1976, 1978 and 1979 seasons (Delhey, Citation2016). These crops are used in rotation with soybean in some production fields of north-western Argentina, a region located between latitude 22º and 29º south and longitude 63º and 68º west, which includes several subtropical provinces. As a result of the adoption of technologies by farmers and the increasingly high prices of soybean, production, planting area and average yields in north-western Argentina have grown in past decades at average annual rates of 17%, 15% and 1.7%, respectively (Devani et al., Citation2013). In the 2016 season, an average yield of 2.6 t ha−1 was produced in ~1.7 million ha. During the five growing seasons sampled in this study, there were variations in environmental parameters (temperature and rainfall) which were reflected in the levels of charcoal rot incidence. Our data showed lower disease incidence during the first three seasons than in 2011 and 2012 seasons, which were characterized by high air temperatures and drought (data not shown) that resulted in significant increase in charcoal rot incidence. These results are in accordance with previous research (Cardona et al., Citation1998; Ploper et al., Citation2001; Mengistu et al., Citation2011, Citation2013) that reported high levels of incidence and colony forming units (CFU) of M. phaseolina when high air and soil temperatures were accompanied by low soil water potentials.
Isolates of M. phaseolina recovered from different hosts exhibited different colony growth rates and microsclerotia length and width, which agrees with the findings by Pearson et al. (Citation1986a, Citation1986b) and Su et al. (Citation2001) who reported variations in morphological and physiological characteristics among M. phaseolina isolates. Such morphological variation has been reported to be related to differences in virulence of M. phaseolina isolates on mungbean cultivars (Iqbal & Mukhtar, Citation2014). Morphological variability in growth, colony colour, pycnidium production and chlorate sensitivity among isolates of M. phaseolina from different hosts has been previously reported (Dhingra & Sinclair, Citation1973; Su et al., Citation2001).
Genetic differences have also been observed among isolates of M. phaseolina (Mayék-Pérez et al., Citation2001b; Muñoz-Cabañas et al., Citation2005; Baird et al., Citation2009, Citation2010). Our AFLP analysis showed no clear association between genetic profile and host or geographic origin. Mayék-Pérez et al. (Citation2001b) and Muñoz-Cabañas et al. (Citation2005) observed similar results using AFLP markers. Arias et al. (Citation2011) discriminated among 24 isolates of M. phaseolina based on host of origin using 147 SSR markers at a genetic distance of 0.70. Using 28 of those SSR markers to fingerprint 31 isolates, we obtained a dendrogram with four clusters at a genetic distance of 0.70, showing a high value of genetic diversity. Isolates Mp56 and Mp53 were separated from the other clusters. However, as with the AFLP analysis, no clear association between SSR genetic profile and host, year of collection, geographic origin or morphological characteristics (colony growth rate and size of microsclerotia) was found. Comparable results were observed by Baird et al. (Citation2009, Citation2010) with 109 M. phaseolina isolates collected from different areas and different hosts in the USA using 12 SSR markers. The existence of such genetic and morphological variability in M. phaseolina may be important in disease management systems and in breeding programmes of soybean cultivars for resistance to charcoal rot. Further studies with greater numbers of markers may be necessary to determine whether relationships between the morphological characteristics and genetic profile of the M. phaseolina isolates occur in north-western Argentina.
Our data also indicated a trend for genotypes of M. phaseolina isolated from soybean in Argentina to differ from those isolated from soybean in the USA. These results point to future studies using more isolates from soybean to determine the extent of the genetic differences of M. phaseolina between the two countries and to establish conclusively whether the genotypes of either country differ genetically and in virulence. This study provides some of the foundational information necessary for soybean breeders in Argentina to develop cultivars with improved resistance to charcoal rot.
Disclaimer
The use of trade, firm or corporation names is for the information and convenience of the reader. Such use does not constitute an official endorsement of approval by the USDA-ARS, NAL or BIC of any product or service to the exclusion of others that may be suitable.
Acknowledgements
We thank Josefina Racedo for technical support in bootstrap analysis and Sección Sensores Remotos y SIG (EEAOC) for providing the map used in .
Additional information
Funding
References
- Aguaysol NC, Acosta ME, De Lisi V, González V, Fogliata GM, Ploper LD. 2013. Patógenos detectados en semillas de garbanzo (Cicer arietnum) en Tucumán y áreas de influencia. Av agroind-(Estac Exp Agro-Ind Obispo Colombres). 34:28–30.
- Allen TW, Damicone JP, Dufault NS, Faske TR, Hershman DE, Hollier CA, Isakeit T, Kemerait RC, Kleczewski NM, Koenning SR, et al. 2016. Southern United States soybean disease loss estimate for 2015. Proceedings of the Southern Soybean Disease Workers, forty-second Annual Meeting, Pensacola, FL. p. 11–15. [Internet]. [accessed 2018 May 21; cited 2018 May 21]. https://www.mssoy.org/uploads/files/allen-dis-loss-survey-2016.pdf
- Arias RS, Ray JD, Mengistu A, Scheffler BE. 2011. Discriminating microsatellites from Macrophomina phaseolina and their potential association to biological functions. Plant Pathol. 60:709–718.
- Babu KB, Srivastava AK, Saxena AK, Arora DK. 2007. Identification and detection of Macrophomina phaseolina by using species-specific oligonucleotide primers and probe. Mycologia. 99:733–739.
- Baird RE, Wadl PA, Allen T, McNeill D, Wang X, Moulton JK, Rinehart TA, Abbas HK, Shier T, Trigiano RN. 2010. Variability of United States isolates of Macrophomina phaseolina based on simple sequence repeats and cross genus transferability to related genera within Botryosphaeriaceae. Mycopathologia. 170:169–180.
- Baird RE, Wadl PA, Wang X, Johnson DH, Rinehart TA, Abbas HK, Shier T, Trigiano RN. 2009. Microsatellites from the charcoal rot fungus (Macrophomina phaseolina). Mol Ecol Resour. 9:946–948.
- Balzarini MG, Di Rienzo JA 2013. Info-Gen: software para análisis estadístico de datos genéticos. Facultad de Ciencias Agropecuarias, Universidad Nacional de Córdoba, Argentina. [Internet]. [accessed 2014 Oct 4; cited 2016 Oct 4]. https://www.info-gen.com.ar.
- Balzarini MG, Gonzalez L, Tablada M, Casanoves F, Di Rienzo JA, Robledo CW. 2008. InfoStat. Córdoba (Argentina): Manual del Usuario, Editorial Brujas.
- Bashasab F, Kuruvinashetti MS. 2007. Genetic variability of sorghum charcoal rot pathogen (Macrophomina phaseolina) assessed by random DNA markers. Plant Pathol J. 23:45–50.
- Cardona R, Rodríguez H, Nass H. 1998. Dinámica poblacional de microesclerocios de Macrophomina phaseolina en un suelo naturalmente infestado y bajo rotación de cultivo. Fitopatol Venez. 11:23–26.
- Casalderrey N, Maggio M, Bejarano N, González V, Ploper L, Zamorano M, Díaz C. 2016. Enfermedades de Phaseolus vulgaris L. (poroto, poroto común, frijol, frijol judía, alubia, chaucha). In: Nome SF, Docampo DM, Conci LR, Eds. Atlas fitopatológico Argentino. Instituto Nacional de Tecnología Agropecuaria. Córdoba, Argentina. [Internet]. [accessed 2017 Feb 6; cited 2016 Feb 6].http://fitopatoatlas.inta.gob.ar/Inicio.aspx#/ConsultaGeneral?Id=725(via Internet Explorer).
- Delhey R. 2016. Enfermedades de Sorghum spp. (sorgo). In: Nome SF, Docampo DM, Conci LR, Argentino AF, editors Atlas fitopatológico Argentino. Instituto Nacional de Tecnología Agropecuaria. Córdoba. Argentina. [Internet]. [accessed 2017 Feb 6; cited 2016 Feb 6]. http://fitopatoatlas.inta.gob.ar/Inicio.aspx#/ConsultaGeneral?Id=2161(via Internet Explorer).
- Delp BR, Stowell LJ, Marois JJ. 1986. Evaluation of field sampling techniques for estimation of disease incidence. Phytopathology. 76:1299–1305.
- Devani MR, Pérez D, Ledesma F, Ploper LD 2013. Evolution and current state of soybean production in northwestern Argentina. Proceedings of the World Soybean Research Conference IX (WSRC IX). Feb 17; Durban, South Africa. Abstract 403.
- Dhingra OD, Sinclair JB. 1973. Location of Macrophomina phaseolina on soybean plants related to cultural characteristics and virulence. Phytopathology. 63:934–936.
- Diourte M, Starr JL, Jeger MJ, Stack JP, Rosenow DT. 1995. Charcoal rot (Macrophomina phaseolina) resistance and the effects of water-stress on disease development in sorghum. Plant Pathol. 44:196–202.
- Fehr WR, Caviness CE, Burmood DT, Pennington JS. 1971. Stage of development descriptions for soybeans, glycine max (L.) Merrill. Crop Sci. 11:929–931.
- Highton R. 1993. The relationship between the number of loci and the statistical support for the topology of UPGMA trees obtained from genetic distance data. Mol Phylogenet Evol. 2:337–343.
- Iqbal U, Mukhtar T. 2014. Morphological and pathogenic variability among Macrophomina isolates associated with mung bean (Vigna radiate L.) Wilczek from Pakistan. Sci World J. 2014: 1–9. http://dx.doi.org/10.1155/2014/950175
- Jana TK, Singh NK, Koundal KR, Sharma TR. 2005. Genetic differentiation of charcoal rot pathogen, Macrophomina phaseolina, into specific groups using URP-PCR. Can J Microbiol. 51:159–164.
- Kaiser WJ, Horner GM. 1980. Root rot of irrigated lentils in Iran. Can J Bot. 58:2549–2556.
- Khan SN. 2007. Macrophomina phaseolina as causal agent for charcoal rot of sunflower. Mycopathologia. 5:111–118.
- Laguna I, Lenardon S, Nome S, Pérez B, Carmona M, Giménez Pecci M, Rodriguez P, Truol G, Nome C, Formento N, et al. 2016. Enfermedades de Zea mays L. (maíz). In: Nome SF, Docampo DM, Conci LR, editors. Atlas Fitopatológico Argentino. Instituto Nacional de Tecnología Agropecuaria. Córdoba. Argentina. [Internet]. [accessed 2017 Feb 6; cited 2016 Feb 6]. http://fitopatoatlas.inta.gob.ar/Inicio.aspx#/ConsultaGeneral?Id=1048(via Internet Explorer).
- Mayék-Pérez N, López-Castañeda C, González-Chavira M, Garcia-Espinosa R, Acosta-Gallegos J, de la Vega OM, Simpson J. 2001b. Variability of Mexican isolates of Macrophomina phaseolina based on pathogenesis and AFLP genotype. Physiol Mol Plant Pathol. 59:257–264.
- Mayek-Pérez N, López-Castañeda C, López-Salinas E, Cumpián-Gutiérrez J, Acosta-Gallegos JA. 2001a. Resistencia a Macrophomina phaseolina en frijol común bajo condiciones de campo en México. Agrociencia. 35:649–661.
- Mehan VK, McDonald D. 1997. Charcoal Rot. In: Kokalis-Burelle N, Porter DM, Rodriguez-Kábana R, Smith DH, Subrahmanyam P, editors. Compendium of peanut diseases. 2nd ed. St. Paul (MN): APS Press; p. 94.
- Mengistu A, Reddy KN, Bellaloui N, Walker ER, Kelly HM. 2013. Effect of glyphosate on Macrophomina phaseolina in vitro and its effect on disease severity of soybean in the field. Crop Prot. 54:23–28.
- Mengistu A, Smith JR, Ray JD, Bellaloui N. 2011. Seasonal progress of charcoal rot and its impact on soybean productivity. Plant Dis. 95:1159–1166.
- Mengistu A, Wrather A, Rupe JC. 2015. Charcoal Rot. In: Hartman GL, Rupe JC, Sikora EJ, Domier LL, Davies JA, Steffey LK, editors. Compendium of soybean diseases and pests. 5th ed. St. Paul (MN): APS Press; p. 67–69.
- Mihail JD. 1992. Macrophomina. In: Singleton LL, Mihail JD, Rush CM, editors. Methods for research on Soilborne Phytopathogenic fungi. St. Paul (MN): APS Press; p. 134–137.
- Mihail JD, Taylor SJ. 1995. Interpreting variability among isolates of Macrophomina phaseolina in pathogenicity, pycnidium production, and chlorate utilization. Can J Bot. 73:1596–1603.
- Muñoz-Cabañas RM, Hernández–Delgado S, Mayek_Pérez N. 2005. Análisis patogénico y genético de Macrophomina phaseolina (Tassi) Goid. en diferentes hospedantes. Rev Mex Fitopat. 23:11–18.
- Murray M, Thompson WF. 1980. Rapid isolation of high molecular weight plant DNA. Nucleic Acids Res. 8:4321–4326.
- Nei M. 1973. Analysis of gene diversity in subdivided populations. Proc Natl Acad Sci USA. 70:3321–3323.
- Panda KK, Nayak N, Biswal G. 2014. Studies on physiological characteristics of Macrophomina phaseolina causing seedling blight of gerbera. J Plant Prot Environ. 11:109–112.
- Pearson CAS, Leslie JF, Schwenk FW. 1986a. Variable chlorate resistance in Macrophomina phaseolina from corn, soybean, and soil. Phytopathology. 76:646–649.
- Pearson CAS, Leslie JF, Schwenk FW. 1986b. Differential catabolism of nitrogen by chlorate resistant and sensitive isolates of Macrophomina phaseolina. Phytopathology. 76:1145.
- Ploper L, González V, Vázquez De Ramallo N, Gálvez M, Devani M. 2001. Presencia de la podredumbre carbonosa del tallo de la soja en el centro y noroeste argentino. Av agroind-(Estac Exp Agro-Ind Obispo Colombres). 22:30–34.
- Ploper LD, Scandiani MM 2009. Visión general de las enfermedades radiculares de la soja en Argentina. Proceedings V Congresso Brasileiro de Soja e Mercosoja. May 19; Goiânia, Goias, Brasil; p. 1–3.
- Purkayastha S, Kaur B, Dilbaghi N, Chaudhury A. 2006. Characterization of Macrophomina phaseolina, the charcoal rot pathogen of cluster bean, using conventional techniques and PCR-based molecular markers. Plant Pathol. 55:106–116.
- Raut JG. 1983. Transmission of seed borne Macrophomina phaseolina. Seed Sci Technol. 11:807–817.
- Reyes-Franco MC, Hernández-Delgado S, Beas-Fernández R, Medina-Fernández M, Simpson J, Mayek-Pérez N. 2006. Pathogenic and genetic variability within Macrophomina phaseolina from Mexico and other countries. J Phytopathol. 154:447–453.
- Rohlf FJ. 1993. Numerical Taxonomy and Multivariate Analysis System. NTSYS-pc: version 1.80. New York: Applied Biostatistics Inc.
- Saleh AA, Ahmed HU, Todd TC, Travers SE, Zeller KA, Leslie JF, Garrett KA. 2010. Relatedness of Macrophomina phaseolina isolates from tallgrass prairie, maize, soybean and sorghum. Mol Ecol. 19:79–91.
- Sarr MP, Ndiaye MB, Groenewald JZ, Crous PW. 2014. Genetic diversity in Macrophomina phaseolina, the causal agent of charcoal rot. Phytopathol Mediterr. 53: 250–268.
- Sharma I, Kumari N, Sharma V. 2014. Defense gene expression in Sorghum bicolor against Macrophomina phaseolina in leaves and roots of susceptible and resistant cultivars.. J Plant Interact. 9: 315–323.
- Srivastava AK, Singh T, Jana TK, Arora DK. 2001. Microbial colonization of Macrophomina phaseolina and suppression of charcoal rot of chickpea. In: Sinha A, editor. Microbes and plants. New Delhi (India): Vedamse Books (P) Ltd; p. 269–319.
- Su G, Suh SO, Schneider RW, Russin JS. 2001. Host specialization in the charcoal rot fungus, Macrophomina phaseolina. Phytopathology. 91:120–126.
- Vos P, Hogers R, Bleeker M, Reijans M, Van De Lee T, Hornes M, Friters A, Pot J, Paleman J, Kuiper M. 1995. AFLP: a new technique for DNA fingerprinting. Nucleic Acids Res. 23:4407–4414.
- Watkins GM. 1981. Charcoal Rot. In: Watkins GM, editor. Compendium of cotton diseases. St. Paul (MN): APS Press; p. 49–50.
- White DG. 1999. Fungal stalk rots. In: White G, editor. Compendium of corn diseases. 3rd ed. St. Paul (MN): APS Press; p. 38.
- Wrather A, Shannon G, Balardin R, Carregal L, Escobar R, Gupta G, Ma Z, Morel W, Ploper D, Tenuta A. 2010. Effect of diseases on soybean yield in the top eight producing countries in 2006. Plant Health Progress. [Internet]. [accessed 2017 Feb 6; cited 2016 Feb 6]. https://www.plantmanagementnetwork.org/pub/php/research/2010/loss/.
- Wyllie TD. 1989. Charcoal Rot. In: Sinclair JB, Backman PA, editors. Compendium of soybean diseases. 3rd ed. St. Paul (MN): APS Press; p. 30–33.
- Yap I, Nelson RJ 1996. Winboot: a program for performing bootstrap analysis of binary data to determine the confidence limits of UPGMA-based dendrograms. IRRI Discussion Paper Series No. 14. International Rice Research Institute, Manila (Philippines).