
Abstract
Plant cell walls (CW) are composed mainly of cellulose–hemicellulose networks embedded in a pectin matrix. CW apposition, including papilla formation, is often associated with plant defence responses to infection by fungal pathogens. In this study, synchrotron-based Fourier transform infrared (sFTIR) spectroscopy and focal plane array (FPA) imaging were explored to characterize changes in CW chemical composition of barley leaf epidermis inoculated with the powdery mildew fungus of wheat that was unable to infect the barley cultivar ‘CDC Silky’ successfully. Spectroscopic results showed increased intensity of peaks representing asymmetric and symmetric stretching vibrations that correspond to fatty acid groups, phenolics/lignin, cellulose, hemicellulose, pectins and glucans. sFTIR spectral data separated the inoculated samples (with papillae formation) from non-inoculated controls, based on CW components including lignin/phenolics, polysaccharides and glucans. These results were further verified with FPA imaging. This is the first report on using sFTIR spectroscopy and FPA imaging to analyse in situ composition of plant cell wall components in relation to host defence responses. These findings, especially the changes in cellulose, hemicelluloses, pectins and glucans, lend support to a proposed structure of effective papillae, as well as to callose-cellulose networks associated with the defence response of barley against powdery mildew. Increases in phenolics likely help strengthen CW, in addition to direct effects on pathogens. The results also demonstrate that sFTIR and FPA analyses can be useful to study plant–pathogen interactions, especially in determining the role of cell wall apposition in response to fungal infection.
Résumé
Les parois des cellules végétales (PC) sont principalement composées de réseaux de cellulose et d’hémicellulose enchâssés dans une matrice de pectine. L’apposition des PC, y compris la formation de papilles, est souvent associée aux réactions de défense de la plante à une infection causée par des agents pathogènes fongiques. Dans cette étude, la spectroscopie à infrarouge à transformée de Fourier basée sur l’imagerie synchrotronique (IRTFs) et l’imagerie dans la matrice plane focale (MPF) ont été examinées dans le but de caractériser les modifications de la composition chimique se produisant dans les PC de l’épiderme de feuilles d’orge inoculées avec le champignon du blanc du blé qui n’a pu réussir à infecter le cultivar d’orge ‘CDC Silky’. Les résultats de la spectroscopie ont affiché une intensité accrue des pics représentant les vibrations asymétriques et symétriques d’élongation qui correspondent aux groupes d’acides gras suivants: les composés phénoliques et la lignine, la cellulose, l’hémicellulose, les pectines et les glucanes. En se basant sur les composantes des PC, y compris la lignine et les composés phénoliques, les polysaccharides et les glucanes, les données spectrales issues de l’IRTFs ont séparé en deux groupes les échantillons inoculés (avec papilles en formation) et les témoins non inoculés. Ces résultats ont été par la suite vérifiés par imagerie MPF. Il s’agit du premier rapport faisant état de l’utilisation de la spectroscopie IRTFs et de l’imagerie MPF pour analyser in situ la combinaison des composantes des parois des cellules végétales en fonction des réactions de défense de l’hôte. Ces résultats, particulièrement les modifications subies par la cellulose, les hémicelluloses, les pectines et les glucanes, tendent à soutenir une structure proposée de papilles véritables ainsi que de réseaux de callose et de cellulose associés à la réaction de défense de l’orge contre le blanc. Les augmentations de composés phénoliques contribuent à renforcer la PC, en plus d’agir directement sur les agents pathogènes. Les résultats montrent également que les analyses effectuées par spectroscopie IRTFs et imagerie MPF peuvent servir à étudier les interactions plantes-agents pathogènes, particulièrement pour ce qui est de déterminer le rôle de l’apposition de la paroi cellulaire dans la réaction à l’infection fongique.
Introduction
The plant cell wall (CW) is highly dynamic and capable of modifying its structural and chemical compositions to maintain its functionality in response to pathogen attack (Hématy et al., Citation2009). At infection sites, plants can accumulate callose, phenolic compounds and lignin to resist penetration (Underwood, Citation2012) and, in other cases, metabolites and proteins are produced which may inhibit the pathogen directly (Vorwerk et al., Citation2004). The plant CW modifications are considered to be important to host defence responses, although some of the components and pathways have not been fully elucidated (Collinge, Citation2009; Hématy et al., Citation2009).
Interactions between plants and fungal pathogens are complex and the outcome is determined often by the lifestyle of the pathogen (Underwood, Citation2012). Necrotrophs generally degrade plant CW polymers with hydrolytic enzymes (Laluk & Mengiste, Citation2010), while biotrophs and hemibiotrophs tend to deploy more sophisticated strategies during penetration (Szabo & Bushnell, Citation2001), frequently involving CW appositions (CWA or papillae) which may reduce or prevent the fungal pathogen from entering the host cell (Huckelhoven, Citation2007). These defence CWA, in which antimicrobial secondary metabolites may also accumulate, can be induced during both compatible and incompatible interactions (Clay et al., Citation2009), but early CWA tends to enhance the resistance to penetration more effectively, whereas a delayed response may be associated with increased penetration success (Collins et al., Citation2003). Plant CW is a complex structure mainly composed of a cellulose–hemicellulose network embedded in a pectin matrix (Lionetti et al., Citation2012). The structural components also include lignin or lignin-like phenolic compounds (McLusky et al., Citation1999; Huckelhoven, Citation2007; Chowdhury et al., Citation2014; Voigt, Citation2016). The precise function of these carbohydrate polymers involved in CWAs in response to fungal infection, however, is yet to be determined unequivocally; callose and lignin, together with other CW polymers may form a physical barrier to penetration (Bechinger et al., Citation1999).
Metabolic profiling and cell imaging are experimental approaches used frequently to study changes in plant CW during host–pathogen interactions (Xia et al., Citation2014). The former approach can characterize and quantify metabolites (Roessner & Bowne, Citation2009) involved in the plant response to genetic modifications and biotic/abiotic stresses (Clarke & Haselden, Citation2008). Cellular imaging is useful for studying phenotypes linked to plant–microbe interactions; light/fluorescence/confocal microscopy or electronic microscopy can be applied in many cases (Xia et al., Citation2014) but live cell imaging techniques may provide another dimension of observation into plant CW dynamics (Lee et al., Citation2011; Sappl & Heisler, Citation2013). These technologies have the potential of ever-expanding capability to show more details in plant–microbe interactions. In CWA, much attention also has been directed to the molecular composition through ultrastructural and/or biochemical analyses (Underwood, Citation2012).
Non-destructive techniques such as FTIR spectroscopy (Lahlali et al., Citation2016), capable of determining the biochemical spectrum of CW components in less than a minute, may also be a useful tool for studying CW changes during plant–microbial interactions. Our earlier work has shown that mid-infrared (mid-IR) spectromicroscopy can map plant CW biopolymers, including lignin, cellulose, hemi-cellulose and callose (Karunakaran et al., Citation2015) or assess changes in CW composition in response to pathogen invasion (Lahlali et al., Citation2015, Citation2016). Du & Zhou (Citation2015) used Fourier mid-IR photoacoustic spectroscopy for early detection of powdery mildew infection in Rubus corchorifolius L. before visible symptoms, and observed significant differences between healthy and infected leaves in the spectral range of 500–4000 cm−1. When combined with other techniques, FTIR may improve the analysis of CW chemical composition since the spectra of some CW-matrix polymers, lignin and pectin for example, display apparent marker bands which do not overlap with the cellulose signature.
The objective of this study was to explore sFTIR spectromicroscopy, in combination with FPA imaging, to characterize changes in CW composition of barley epidermis in response to infection by the powdery mildew fungus of wheat (incompatible interaction). The data may help better understand CWA in this plant–microbe interaction, and also validate the usefulness of these technologies in this type of application.
Materials and methods
Plants, pathogen isolate and leaf sample preparation
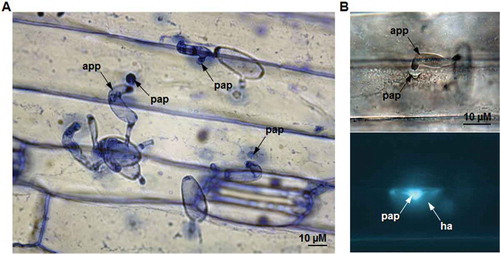
The barley (Hordeum vulgare L.) cultivar ‘CDC Silky’ and an isolate of wheat powdery mildew fungus Blumeria graminis f. sp. tritici (Bgt) were used for the study. Barley seedlings were inoculated at about the 3-leaf stage with conidia of Bgt, the fungus that causes powdery mildew on wheat (Triticum aestivum L.). The Bgt isolate was maintained and increased on the red spring wheat cultivar ‘Conway’ (susceptible) in a greenhouse with temperatures ranging from 18 to 21°C. The barley cultivar was developed at the University of Saskatchewan and registered also by the University in 1994. It is a six-row, hull-less spring cultivar and immune to this isolate of Bgt in repeated tests (data not shown), with papillae formed under fungal appressoria () at about 16–24 h after inoculation (hai). The wheat cultivar was also developed at the University and registered in 1986.
Fig. 1 (Colour online) Cell wall mediated penetration resistance associated with papilla formation in barley leaves inoculated with non-host wheat powdery mildew fungus, Blumeria graminis f. sp. tritici (Bgt). (A) Barley leaf epidermis 48 hours post inoculation with Bgt stained with aniline blue (pH 5.0) and viewed under light microscopy. (B) The callose fluorescence at the Bgt-attempted penetration site of fixed and aniline blue-stained (pH 9.5) barley leaf viewed with fluorescence microscopy (app – appressorium, pap – papilla and ha – halo).
Inoculation was performed on 7-day-old barley leaves as previously described (Liu et al., Citation2005) using fresh conidia harvested from heavily infected wheat plants grown in a greenhouse. The epidermal layer of the abaxial side of the primary leaf inoculated and non-inoculated with Bgt were peeled by making shallow perpendicular cuts using a fine blade at 48 hai and peeling gently with a pair of tweezers. The peeled epidermal layer was placed in CaF2 windows for sFTIR analysis. The same samples were also mapped with FPA (Focal Plane Array detector).
Fourier transform infrared (sFTIR) spectroscopy and focal plane array (FPA) imaging
The sFTIR spectroscopy was performed at the Canadian Light Source Inc. (Saskatoon, SK, Canada) using a Hyperion 300 microscope (Bruker Optics Inc., Milton, ON) equipped with a single element (Mercury Cadmium Telluride, MCT) detector and a 15× objective was used. Spectra data were recorded in the transmission mode at a spectral resolution of 4 cm−1 with an aperture size of 10 × 10 µm. A total of 256 scans were made for each spectrum and averaged. The background spectra were recorded from a sample-free area on the window. The sFTIR data were not further validated using conventional extraction and analysis protocols because the measurements had been performed multiple times (Du & Zhou, Citation2015; Lahlali et al., Citation2016, Citation2017) previously with internal controls and the imaging tool described below helps provide additional evidence for changes in cell-wall chemical composition.
The FPA imaging was performed on samples by using a Hyperion imaging system (Heraud et al., Citation2007) with a globar source. The microscope was equipped with a 64 × 64 pixel FPA detector and a 15× objective. The spatial resolution was 2.7 μm × 2.7 μm per pixel. One FPA grid measurement would result in 4096 spectra (on an 184 μm × 184 μm area), based on an average of 256 scans. The OPUS software was used for image analysis. The experiments involving sFTIR and FPA analyses were carried out twice for each treatment, with all materials prepared independently for each trial repetition. For sFTIR, a total of 20 recorded spectra were used for each repetition with 10 spectra per scan.
Data analysis
Principal component analysis (PCA) was carried out using the Unscrambler version 10.3 (CAMO Software, Aslo, Norway). Raw spectral data were imported into the software to identify possible differences between leaf samples with and without effective papillae. Before PCA, spectral data were subjected to multiplicative scattering correction and second derivatives to Goly–Savitzky algorithm using nine smoothing points. PCA was performed on all datasets with each FTIR wavelength considered as an equally weighted variable. The determination of CW components such as lipids acyl chain, phenolics and lignin, polysaccharides, carbohydrates and glucan polymers was completed by integrating the areas under specific bands (Karunakaran et al., Citation2015; Lahlali et al., Citation2015, Citation2016). The area was determined using the OPUS integration method C, in which the area of interest was determined after considering two baseline points on the left and the other two on the right side of the peak/band. Statistical analysis was performed on integrated areas and ratios of lignin to other bands using ANOVA (SAS Institute, Cary, NC). When the infection effect was significant, the LSD test was used to separate means at P ≤ 0.05.
Results
Assessment of epidermal infection based on microscopic and spectroscopic analyses
Inoculation of barley plants with Bgt showed failure of attempted penetration by Bgt into epidermal cells of barley leaves (). Both sFTIR spectroscopy and FPA imaging analyses were applied to assess possible changes in biochemical compositions between Bgt-inoculated and non-inoculated barley leaves.
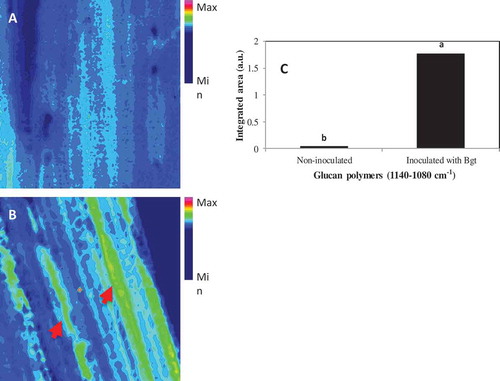
The sFTIR data showed clear differences in absorption peaks between epidermal layers with and without powdery mildew inoculation in the –OH, CH2, CH3 and fingerprint (1800–800 cm−1) regions, which would include phenolics and lignin, polysaccharides and carbohydrates (). The spectral peaks that differentiated the chemical composition of epidermal layers between inoculated (with papillae) and non-inoculated leaves can be assigned to nine groups of chemical compounds (). Meanwhile, the integrated area which indicates the approximate content of each component showed an increase in lipids acyl chain, phenolics and lignin, polysaccharides and carbohydrates 48 hpi, which coincided with the papilla formation (). Likewise, glucan polymers (1140–1080 cm−1) were also increased at this point in the epidermal layer relative to non-inoculated ones ().
Table 1. The differential FTIR spectra and their assignment over the cell-wall components of inoculated (with papillae) and non-inoculated leaves based on a multivariate analysis.
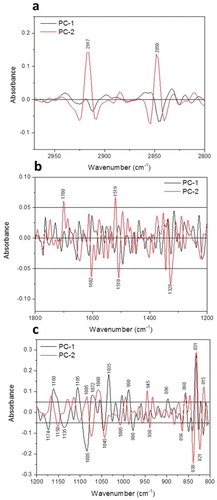
Fig. 2 (Colour online) The mid-infrared spectra of the epidermal layer from barley leaves inoculated (with papillae) and not inoculated with B. graminis f. sp. tritici, respectively.
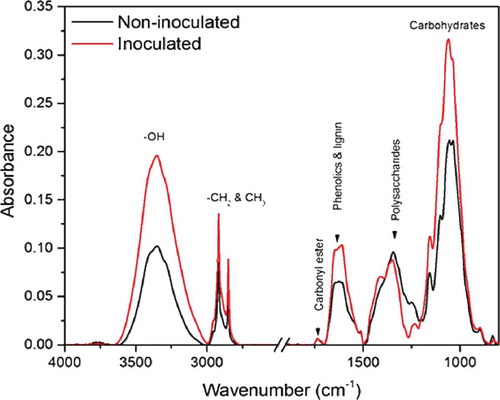
Fig. 3 (Colour online) Integrated absorption bands of lipids acyl chain (3000–2750 cm−1), phenolics/lignin (1720–1500 cm−1), polysaccharides (1500-1250 cm−1), and carbohydrates (1200–900 cm−1) in synchrotron-based FTIR (sFTIR) spectra of epidermal layer from a barley leaf inoculated with B. graminis f. sp. tritici and non-inoculated leaf samples. Letters indicate the statistical differences between the treatments (LSD, P ≤0.05).
Fig. 4 (Colour online) Increases in the content of glucan polymers (1140–1080 cm−1) in barley leaves inoculated with B. graminis f. sp. tritici (Bgt) compared to non-inoculated leaf samples. The content of epidermal layer was shown for non-inoculated (A) and inoculated (B) barley leaves, and the band for integrated area of b-1,3-glucan polymers is shown in C where different letters indicate significant changes (LSD, P ≤ 0.05). The arrows in B highlight a moderate degree of changes in composition (green color) from control (non-sprayed), whereas minimum change (blue) was shown for non-inoculated samples. The scale bar = 50 µM.
Principal component analysis (PCA)
PCA of the spectral data showed significant differences in the epidermal layer with and without papilla formulation ( and ), indicating different chemical compositions of inoculated (with papillae) and non-inoculated tissues. The most important variations were explained by PC1, PC2 and PC3 (52%, ); peaks contributing the most to this variation were those related to asymmetric and symmetric CH2 of lipids, carboxylic ester, aromatic skeletal vibration of lignin, cellulose and hemicellulose, and C-H deformation of glucans (β-glucans) ().
Fig. 5 (Colour online) Principal component analyses of the mid infrared spectra of the epidermal cells of barley leaves inoculated (with papilla) and not inoculated (water) with the powdery mildew fungus B. graminis f. sp. tritici.
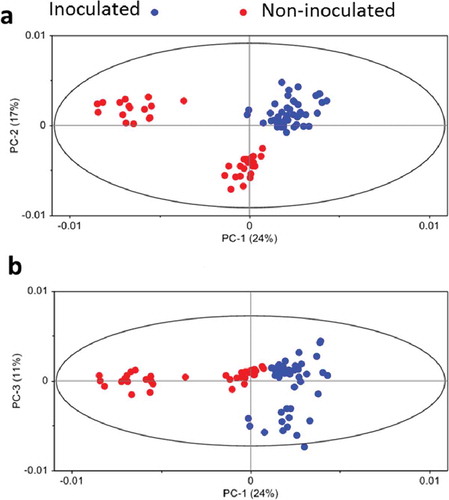
Fig. 6 (Colour online) Loadings plot (PC1 & PC2) of epidermal cells of barley leaves based on sFTIR spectra for both lipids (a) and fingerprint (b & c) regions. Each point in the plot represents the projection of a spectrum in the PC1–PC2 space.
Focal plane array (FPA) imaging analysis
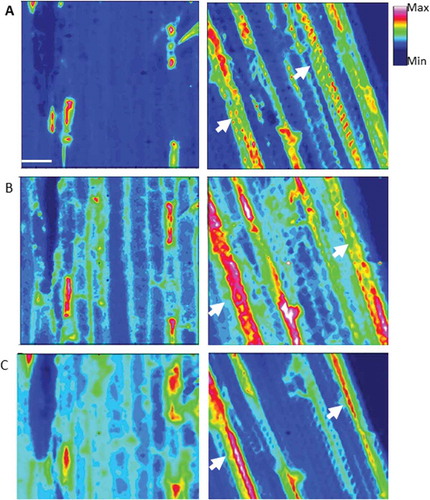
FPA imaging of a large area of epidermal layer () generally supported the results of sFTIR. When inoculated and non-inoculated samples were compared using the full range of spectrum (), it was apparent that the inoculation caused substantial biochemical changes in epidermal cells, with increases in aliphatic lipids () and fingerprint () regions as shown with sFTIR ( and ) coinciding with papilla formation. This fingerprint region (1800–900 cm−1) includes the peaks characteristic of phenolics, proteins, polysaccharides, pectins and carbohydrates. This result indicates potential contributions of these compounds to the CW modifications, including papillae formation in the non-host response of barley to the attempted penetration by Bgt.
Fig. 7 (Colour online) Focal plane array (FPA) images identifying chemical distribution in the full range of spectrum (A), aliphatic lipids (3000–2750 cm−1, B) and fingerprint (1800–900 cm−1, C) regions in epidermal cells of barley leaves (abaxial side) inoculated and non-inoculated (water) with B. graminis f. sp. tritici. The arrows highlight the changes in composition from control (non-inoculated).
Discussion
This study attempted to assess the feasibility of using synchrotron-based spectroscopy and imaging, including sFTIR and FPA, to characterize changes in the chemical composition of CW in response to fungal penetration. These non-destructive techniques are capable of determining changes in plant cell-wall components in less than a minute (Lahlali et al., Citation2016), and if proven effective, may be used as a valuable screening tool for identification and/or differentiation of host resistance. The interaction of the wheat powdery mildew fungus Bgt and barley cultivar used in this study would only represent one example for assessing the capability of sFTIR and FPA, although the information may also be indicative of the potential for studying other host–pathogen interactions. Many earlier studies have documented CWA of different plant species in response to the penetration by fungal pathogens (Greenshields et al., Citation2004; Malinovsky et al., Citation2014; Lahlali et al., Citation2016), and CW reinforcement is often associated with the host defence mechanisms (Ellinger et al., Citation2013; Bellincampi et al., Citation2014). In the current study, aliphatic lipids, phenolics, polysaccharides, carbohydrates (glucan stretching) were increased in leaf epidermis when papilla formed during the incompatible interaction of barley against Bgt. Lignin or lignin-like phenolics are generally embedded in the primary CW and can be covalently linked to glycerol-based aliphatic compounds located between primary CW and plasma membrane (Bernards, Citation2002; Nawrath, Citation2006). Together, they form the hydrophobic layer of CW that often acts as the first line of defence to protect the cell from fungal invasion in plant basal resistance (Chowdhury et al., Citation2014). At the same time, papillae are specialized CWA in response to penetration; callose, lignin, phenolic conjugates, arabinogalactan proteins and even reactive oxygen species have been indicated in papillae (Underwood, Citation2012; Chowdhury et al., Citation2014). Among these compounds, callose glucans and cellulose have received much of the attention likely due to their function as a strong mechanical barrier to fungal penetration (Chowdhury et al., Citation2014; Voigt Citation2014, Citation2016), especially against powdery mildew pathogens.
To properly interpret the spectral differences between inoculated and non-inoculated samples, it is necessary to understand characteristic sFTIR spectra associated with each of the CW components and this information has been revealed by some earlier studies (Kumar et al., Citation2016; Türker-Kaya & Huck, Citation2017). Our results showed substantial differences in peak spectral intensities between these samples, especially in the wave-numbers for aliphatic C-H vibration of lipids, phenolics or lignin, polysaccharides and carbohydrates. FPA imaging also showed increases in chemical components linked to the lipid and fingerprint regions in inoculated samples; the papillary formation in epidermal cells was accompanied by substantial increases in lipids (CH2). Early studies using electron microscopy found that concentrated osmiophilic substances appeared beneath the pathogen penetration pegs and have been correlated with penetration resistance on barley (Ebrahim-Nesbat et al., Citation1986; Hippe-Sanwald et al., Citation1992; Kunoh et al., Citation1996; Assaad et al., Citation2004). The osmium has been shown to have a high affinity to phospholipids, unsaturated fatty acids, tannins and phenolic polymers. It has been shown, via cell biology and genetics, that powdery mildew-triggered microdomain reminiscent of lipid rafts found in animal cells may be linked to papilla formation at the penetration sites of barley (Bhat et al., Citation2005). The lipid rafts in animal and plant cells are greatly enriched in glucosylceramide and a mixture of phytosterols. Our sFTIR spectra and FPA imaging data generally support the results described above; these results provide the direct evidence for the first time that aliphatic lipids accumulate with the attempted penetration by Bgt, suggesting that the formation of lipid domains is induced by the pathogen attack.
The peak at the wave-number 1700 cm−1 (), identified as carboxylic ester, may be associated with an increase in the degree of pectin methyl esterification (reviewed by Lionetti et al., Citation2012). In plant CW, pectin is synthesized in a highly methyl esterified form and de-esterified in muro by pectin methyl esterases. The degree and pattern of methyl esterification affect the CW structure and property, with consequences on both the physiological processes of plants and their resistance to pathogens. The higher degree of pectin methyl esterification, which generally contributes to maintaining the integrity of CW during fungal penetration, can be positively correlated with increased levels of disease resistance on several crops, including bean, potato and tomato (McMillan et al., Citation1993; Marty et al., Citation1997; Boudart et al., Citation1998; Wydra & Beri, Citation2006). The potential for FPA and sFTIR to reveal the increases in carboxylic ester or acid group (potentially methyl esterification of pectins) in plant tissues is exciting; it may be possible to further refine the protocol and achieve more precise analysis of methyl esterification of pectins at the point of attempted penetration in relation to host defence responses.
The papilla formation in epidermal cells was also accompanied by substantial increases in C-H deformation, correlating to the accumulation of glucans and phenolics/lignin. In earlier studies where barley plants were inoculated with B. graminis f. sp. hordei (Bgh), a pathogen on barley, ‘effective papillae’ would contain significant amounts of cellulose and arabinoxylan, in addition to callose (Chowdhury et al., Citation2014). Since barley is a non-host to Bgt, the fungus can rarely penetrate through the papilla successfully (). Therefore the differential CW components identified with sFTIR and FPA are possibly part of the effective papillae. During the infection of barley by Bgh, the structure of papilla appeared as layered against the penetration, with the inner core consisting of callose and hemicellulose and the outer layer containing cellulose and hemicellulose (Chowdhury et al., Citation2014). Our results clearly showed the increase in cellulose/hemicelluloses and glucan polymers (callose) coinciding with the papilla formation ( and ), supporting the proposed chemical elements involved in CWA in response to penetration. The differences could have been even greater if more inoculum could be applied to the abaxial side of the leaf in the current study; the density of papillae was noticeably higher on the adaxial side of barley leaf (data not shown) but the epidermis on the abaxial surface was easy to peel. Nonetheless, the current results showed the connection of increased cellulose/hemicelluloses and glucan polymers with the papilla formation and CW strengthening in the defence responses of barley against Bgt.
It was reported previously that early deposition of callose would cause complete resistance of Arabidopsis to powdery mildew infection (Ellinger et al., Citation2013). However, there are also reports on callose-rich papillae that do not prevent fungal penetration, notably on dicotyledonous plants (Voigt, Citation2016). The infrared and imaging tools used in the current study showed increases in the aliphatic CH2 group of lipids as well as several plant CW carbohydrates coinciding with papilla formation in the defence responses of barley to Bgt. These results show potential link of lipids and callose to the defence response. It is believed that the pathogen-induced callose synthase is not, or to a lesser degree, involved in regulating other plant defence pathways of Poaceae than in dicots (Voigt, Citation2016). Furthermore, a mutant of Arabidopsis overexpressing PMR4 and resistance to attempted penetration by a powdery mildew fungus showed not only increased callose deposition, but also extensive migration of callose fibrils into a pre-existing cellulosic CW (Eggert et al., Citation2014). This could mean that the resistance to fungal penetration by effective papillae is through a network of callose and cellulose (Voigt, Citation2014, Citation2016).
Our results also showed increases in phenolics (wave-number 1600–1500 cm−1) in inoculated samples relative to controls, coinciding with papilla formation. These increases can be the result of CW lignification in response to fungal penetration, and this mechanism has been well documented as an important host resistance response (Vance et al., Citation1980; Nicholson & Hammerschmidt, Citation1992). Lignin or lignin-like phenolics often accumulate during incompatible plant–pathogen interactions (Friend, Citation1984; Bhuiyan, Citation2009; Lahlali et al., Citation2017), and CW lignification can often be an early host defence response against biotrophic fungal pathogens (Vance et al., Citation1980; Bhuiyan, Citation2009). Clearly this CW modification can play a role in the resistance to fungal penetration, based on Ride & Pearce (Citation1979). The sFTIR and FPA results support the notion that lignification can strengthen CW against penetration. CW lignification may possibly work also with other defence mechanisms in barley leaves, including papillae (Huckelhoven, Citation2007) and antifungal metabolites (Vorwerk et al., Citation2004; Clay et al., Citation2009) in preventing the penetration by Bgt.
The current study identified the increases in aliphatic lipids, lignin-like phenolics, cellulose, hemicellulose and glucans with the formation of CWA in the epidermal layer of inoculated barley leaves relative to the non-inoculated control. Most of these polymers have been reported previously in association with papillae or other host defence mechanisms. Callose glucans and cellulose are considered the key polymers involved in CW modifications for plant defence responses (Chowdhury et al., Citation2014; Voigt, Citation2014, Citation2016). The apparent increases in cellulose/hemicelluloses and glucan (callose) with the formation of papilla in inoculated barley leaf epidermis appear to support the callose-cellulose network proposed for ‘effective papillae’ in barley against the powdery mildew. Our results provide additional support to previous findings using sFTIR and FPA. These synchrotron-based tools may be used to study the dynamics of CW chemical composition in plant-microbe interactions, especially when both resistant and susceptible crop varieties are involved.
Acknowledgements
Part of the research described in this paper was performed at the Canadian Light Source, which is funded by the Canada Foundation for Innovation, the Natural Sciences and Engineering Research Council of Canada, the National Research Council Canada, the Canadian Institutes of Health Research, the Government of Saskatchewan, Western Economic Diversification Canada, and the University of Saskatchewan. None of the funders had any role in study design, data analysis and manuscript preparation. We acknowledge Dr S. Rosendahl and Mr S. Read for their assistance on the mid-IR beamline at the Canadian Light Source and advice during data collection.
References
- Assaad FF, Qiu JL, Youngs H, Ehrhardt D, Zimmerli L, Kalde M, Wanner G, Peck SC, Edwards H, Ramonell K, et al. 2004. The PEN1 syntaxin defines a novel cellular compartment upon fungal attack and is required for the timely assembly of papillae. Mol Biol Cell. 15:5118–5129.
- Bechinger C, Giebel KF, Schnell M, Leiderer P, Deising HB, Bastmeyer M. 1999. Optical measurements of invasive forces exerted by appressoria of a plant pathogenic fungus. Science. 285:1896–1899.
- Bellincampi D, Cervone F, Lionetti V. 2014. Plant cell wall dynamics and wall-related susceptibility in plant-pathogen interactions. Front Plant Sci. 5:228.
- Bernards MA. 2002. Demystifying suberin. Can J Bot. 80:227–240.
- Bhat RA, Miklis M, Schmelzer E, Schulze-Lefert P, Panstruga R. 2005. Recruitment and interaction dynamics of plant penetration resistance components in a plasma membrane microdomain. Proc Natl Acad Sci USA. 102:3135–3140.
- Bhuiyan NH, Selvaraj G, Wei Y, King J. 2009. Role of lignification in plant defense. Plant Signal Behav. 4:158–159.
- Boudart G, Lafitte C, Barthe JP, Frasez D, Esquerré-Tugayé MT. 1998. Differential elicitation of defense responses by pectic fragments in bean seedlings. Planta. 206:86–94.
- Chowdhury J, Henderson M, Schweizer P, Burton RA, Fincher GB, Little A. 2014. Differential accumulation of callose, arabinoxylan and cellulose in nonpenetrated versus penetrated papillae on leaves of barley infected with Blumeria graminis f. sp. hordei. New Phytol. 204:650–660.
- Clarke CJ, Haselden JN. 2008. Metabolic profiling as a tool for understanding mechanisms of toxicity. Toxicol Pathol. 36:140–147.
- Clay NK, Adio AM, Denoux C, Jander G, Ausubel FM. 2009. Glucosinolate metabolites required for an Arabidopsis innate immune response. Science. 323:95–101.
- Collinge DB. 2009. Cell wall appositions: the first line of defense. J Exp Bot. 60:351–352.
- Collins NC, Thordal-Christensen H, Lipka V, Bau S, Kombrink E, Qiu JL, Huckelhoven R, Stein M, Freialdenhoven A, Somerville SC, et al. 2003. SNARE-protein-mediated disease resistance at the plant cell wall. Nature. 425:973–977.
- Du CW, Zhou JM. 2015. Fourier transform mid-infrared photoacoustic spectroscopy for presymptomatic detection of powdery mildew infection in Rubus corchorifolius L. Spectrosc Lett. 48:610–615.
- Ebrahim-Nesbat F, Heitefuss R, Rohringer R. 1986. Ultrastructural and Histochemical Studies on Mildew of Barley (Erysiphe graminis DC. f. sp. hordei Marchal) IV: Characterization of papillae in fifth leaves exhibiting adult plant resistance. J Phytopathol. 117:289–300.
- Eggert D, Naumann M, Reimer R, Voigt CA. 2014. Nanoscale glucan polymer network causes pathogen resistance. Sci Rep. 4:4159.
- Ellinger D, Naumann M, Falter C, Zwikowics C, Jamrow T, Manisseri C, Somerville SC, Voigt CA. 2013. Elevated early callose deposition results in complete penetration resistance to powdery mildew in Arabidopsis. Plant Physiol. 161:1433–1444.
- Friend J. 1984. The role of lignification in the resistance of plants to attack by pathogens. Appl Biochem Biotechnol. 9:325–326.
- Greenshields DL, Liu GS, Selvaraj G, Wei YD. 2004. New insights into ancient resistance: the molecular side of cell wall appositions. Phytoprotection. 85:49–52.
- Hématy K, Cherk C, Somerville S. 2009. Host-pathogen warfare at the plant cell wall. Curr Opin Plant Biol. 12:406–413.
- Heraud P, Caine S, Sanson G, Gleadow R, Wood BR, McNaughton D. 2007. Focal plane array infrared imaging: a new way to analyse leaf tissue. New Phytol. 173:216–225.
- Hippe-Sanwald S, Hermanns M, Somerville SC. 1992. Ultrastructural comparison of incompatible and compatible interactions in the barley powdery mildew disease. Protoplasma. 168:27–40.
- Huckelhoven R. 2007. Cell wall-associated mechanisms of disease resistance and susceptibility. Ann Rev Phytopathol. 45:101–127.
- Karunakaran C, Christensen CR, Gaillard C, Lahlali R, Blair LM, Perumal V, Miller SS, Hitchcock AP. 2015. Introduction of soft X-Ray spectromicroscopy as an advanced technique for plant biopolymers research. PLoS One. 10:e0122959.
- Kumar S, Lahlali R, Liu X, Karunakaran C. 2016. Infrared spectroscopy combined with imaging: A new developing analytical tool in health and plant science. Appl Spectrosc Rev. 51:466–483.
- Kunoh H, Matsuoka K, Kobayashi I. 1996. Ultrastructure of papillae induced in barley coleoptile cells by a pathogen, Erysiphe graminis, and a non-pathogen, E. pisi. Fitopatol Bras. 21:418–425.
- Lahlali R, Karunakaran C, Wang LP, Willick I, Schmidt M, Liu X, Borondics F, Forseille L, Fobert PR, Tanino K, et al. 2015. Synchrotron based phase contrast X-ray imaging combined with FTIR spectroscopy reveals structural and biomolecular differences in spikelets play a significant role in resistance to Fusarium in wheat. BMC Plant Biol. 15:24.
- Lahlali R, Kumar S, Wang LP, Forseille L, Sylvain N, Korbas M, Muir D, Swerhone G, Lawrence JR, Fobert PR, et al. 2016. Cell wall biomolecular composition plays a potential role in the host type II resistance to Fusarium head blight in wheat. Front Microbiol. 7:910.
- Lahlali R, Song T, Chu M, Yu F, Kumar S, Karunakaran C, Peng G. 2017. Evaluating changes in cell-wall components associated with clubroot resistance using fourier transform infrared spectroscopy and RT-PCR. Int J Mol Sci. 18:e2058.
- Laluk K, Mengiste T. 2010. Necrotroph attacks on plants: wanton destruction or covert extortion? Arabidopsis Book/Am Soc Plant Biologists. 8:e0136.
- Lee KJD, Marcus SE, Knox JP. 2011. Cell wall biology: perspectives from cell wall imaging. Mol Plant. 4:212–219.
- Lionetti V, Cervone F, Bellincampi D. 2012. Methyl esterification of pectin plays a role during plant-pathogen interactions and affects plant resistance to diseases. J Plant Physiol. 169:1623–1630.
- Liu G, Sheng X, Greenshields DL, Ogieglo A, Kaminskyj S, Selvaraj G, Wei Y. 2005. Profiling of wheat class III peroxidase genes derived from powdery mildew-attacked epidermis reveals distinct sequence-associated expression patterns. Mol Plant-Microbe Interact. 18:730–741.
- Malinovsky FG, Fangel JU, Willats WGT. 2014. The role of the cell wall in plant immunity. Front Plant Sci. 5:178.
- Marty P, Jouan B, Bertheau Y, Vian B, Goldberg R. 1997. Charge density in stem cell walls of Solanum tuberosum genotypes and susceptibility to blackleg. Phytochemistry. 44:1435–1441.
- McLusky SR, Bennett MH, Beale MH, Lewis MJ, Gaskin P, Mansfield JW. 1999. Cell wall alterations and localized accumulation of feruloyl-3ʹ-methoxytyramine in onion epidermis at sites of attempted penetration by Botrytis allii are associated with actin polarisation, peroxidase activity and suppression of flavonoid biosynthesis. Plant J. 17:523–534.
- McMillan GP, Hedley D, Fyffe L, Pérombelon MCM. 1993. Potato resistance to soft-rot Erwinias is related to cell wall pectin esterification. Physiol Mol Plant Pathol. 42:279–289.
- Nawrath C. 2006. Unraveling the complex network of cuticular structure and function. Curr Opin Plant Biol. 9:281–287.
- Nicholson RL, Hammerschmidt R. 1992. Phenolic compounds and their role in disease resistance. Ann Rev Phytopathol. 30:369–389.
- Ride JP, Pearce RB. 1979. Lignification and papilla formation at sites of attempted penetration of wheat leaves by non-pathogenic fungi. Physiol Plant Pathol. 15:79–92.
- Roessner U, Bowne J. 2009. What is metabolomics all about? Biotechniques. 46:363–365.
- Sappl PG, Heisler MG. 2013. Live-imaging of plant development: latest approaches. Curr Opin Plant Biol. 16:33–40.
- Szabo LJ, Bushnell WR. 2001. Hidden robbers: the role of fungal haustoria in parasitism of plants. Proc Natl Acad Sci USA. 98:7654–7655.
- Türker-Kaya S, Huck C. 2017. A review of mid-infrared and near-Infrared imaging: principles, concepts and applications in plant tissue analysis. Molecules. 22:168.
- Underwood W. 2012. The plant cell wall: a dynamic barrier against pathogen invasion. Front Plant Sci. 3:85.
- Vance CP, Kirk TK, Sherwood RT. 1980. Lignification as a mechanism of disease resistance. Ann Rev Phytopathol. 18:259–288.
- Voigt CA. 2014. Callose mediated resistance to pathogenic intruders in plant defense-related papillae. Front Plant Sci. 5:168.
- Voigt CA. 2016. Cellulose/callose-glucan networks: the key to powdery mildew resistance in plants? New Phytol. 212:303–305.
- Vorwerk S, Somerville S, Somerville C. 2004. The role of plant cell wall polysaccharide composition in disease resistance. Trends Plant Sci. 9:203–209.
- Wydra K, Beri H. 2006. Structural changes of homogalacturonan, rhamnogalacturonan I and arabinogalactan protein in xylem cell walls of tomato genotypes in reaction to Ralstonia solanacearum. Physiol Mol Plant Pathol. 68:41–50.
- Xia Y, Petti C, Williams MA, DeBolt S. 2014. Experimental approaches to study plant cell walls during plant-microbe interactions. Front Plant Sci. 5:540.