
Abstract
The objectives of this study were to investigate the Fusarium damage-deoxynivalenol (FUS DMG-DON) relationship in various wheat growing locations in western Canada in 2016 and to compare the relationships to the Prairie-wide FUS DMG-DON assessment of that harvest year. Fusarium head blight was prevalent in spring wheat and durum grown in western Canada in 2016. Harvest survey samples for Canada Western Red Spring (CWRS) wheat and Canada Western Amber Durum (CWAD) were inspected for Fusarium damaged kernels, and analyzed using an enzyme-linked immunosorbent assay for the Fusarium-produced mycotoxin DON. For CWAD and most CWRS, there was a significant relationship between FUS DMG (represented as the mass percentage of Fusarium damaged kernels) and DON, whose presence is regulated in food products to minimize consumers’ exposure. However, CWRS from south-central Alberta contained much lower DON than expected by the reported visual symptoms of FUS DMG of the samples. High throughput real-time PCR analysis showed that DON-producing Fusarium species were associated with less than 40% of the Fusarium damaged kernels in the CWRS. This was different from what was observed with CWAD grown in the same area in 2016. Multi-mycotoxin analysis by liquid chromatography with tandem mass spectrometry did not show an increased presence of mycotoxins produced by other Fusarium species, and therefore suggested that the observed damage in CWRS from south-central Alberta was not caused by Fusarium species.
Résumé
Le but de cette étude était d’examiner la relation qui existe entre les grains fusariés et le déoxynivalénol (FUS DMG-DON) dans différentes régions productrices de blé dans l’Ouest canadien en 2016, puis de comparer les relations à l’évaluation FUS DMG-DON de cette année de récolte à la grandeur des Prairies. En 2016, la brûlure de l’épi causée par le fusarium était répandue chez le blé de printemps et le blé dur cultivés dans l’Ouest canadien. Des échantillons de récolte de blé roux de printemps de l’Ouest canadien (CWRS) et de blé dur ambré de l’Ouest canadien (CWAD), réservés à l’étude, ont été inspectés en vue d’y déceler des dommages causés aux grains par le fusarium, puis analysés à l’aide d’un essai d’immunoabsorpion enzymatique afin de déceler la mycotoxine DON produite par le fusarium. Pour le CWAD et la majorité du CWRS, il y avait une relation significative entre FUS DMG (représenté en tant que pourcentage de la masse de grains fusariés) et le DON, dont l’occurrence dans les aliments est règlementée pour minimiser l’exposition des consommateurs. Toutefois, le CWRS du centre-sud de l’Alberta contenait beaucoup moins de DON quel l’on s’y attendait vu les symptômes visuels de FUS DMG rapportés quant aux échantillons. Une analyse par PCR en temps réel à haut débit a montré que les espèces de fusarium produisant du DON étaient associées à moins de 40% des grains de CWRS fusariés. Cela différait de ce qui avait été observé chez le CWAD cultivé dans la même région en 2016. Une analyse multitoxine effectuée par chromatographie en phase liquide, réalisée de concert avec une spectrométrie de masse en tandem, n’a pas montré d’accroissement de mycotoxines produites par d’autres espèces de fusarium et, en conséquence, a suggéré que le dommage observé chez le CWRS dans le centre-sud de l’Alberta n’était pas causé par un fusarium.
Introduction
In the 2016 growing season, Fusarium head blight (FHB) was widespread in western Canada. Approximately 70% of Canada Western Red Spring (CWRS) wheat and Canada Western Amber Durum (CWAD) harvest samples submitted by producers to the Canadian Grain Commission’s Harvest Sample Program in 2016 contained visible evidence of Fusarium damage (FUS DMG) as defined by the grading factor, versus 39% in 2015 (Tittlemier et al. Citation2019). Thin or shrunken chalk-like kernels with white or pinkish mould or fibrous growth indicate the presence of FUS DMG (Canadian Grain Commission Citation2017). Infection of cereals by Fusarium spp., and progression to FHB can result in yield loss, lowered quality of grain (Dexter et al. Citation1996), and the production of mycotoxins (Tomczak et al. Citation2002; Muthomi et al. Citation2008; Simsek et al. Citation2012; van der Fels-Klerx et al. Citation2012; Shala-Mayrhofer et al. Citation2015).
On the Canadian Prairies, the predominant Fusarium species in cereals is Fusarium graminearum (Clear and Patrick Citation2010; Tittlemier et al. Citation2013b; Canadian Grain Commission Citation2018), which produces the mycotoxin deoxynivalenol (DON). Due to its potential to cause emesis at acute exposure, as well as growth retardation and immunotoxicity at lower doses (Bondy and Pestka Citation2000; Pestka Citation2010), maximum limits of DON have been set for raw grain and some cereal-based food products (European Commission Citation2006; Codex Alimentarius Commission Citation2016). DON is monitored at various points of the grain handling chain to ensure grain is compliant with the maximum limits.
The predominance of F. graminearum in Canada results in a correlation between the incidence of visible FUS DMG and the concentration of DON measured in CWRS and CWAD. This relationship is a basis of using FUS DMG as a grading factor in Canada (Canadian Grain Commission Citation2017). Such relationships between FUS DMG and DON have been reported elsewhere as well (Paul et al. Citation2005).
Due to the high incidence of FUS DMG in wheat grown in 2016, the objectives of this study were to investigate the FUS DMG-DON relationship in more localized growing locations in western Canada and to compare the relationships to the Prairie-wide FUS DMG-DON assessment in 2016. Crop districts from across the Prairies were selected, and harvest samples from the two largest classes of wheat grown in western Canada – CWRS and CWAD – were obtained, inspected for FUS DMG, and analyzed for DON.
Material and methods
Samples
Samples of CWRS and CWAD were obtained from the Canadian Grain Commission’s (CGC) Harvest Sample Program. The CGC Harvest Sample Program samples were voluntarily taken by producers and submitted to the CGC at harvest. Sampling instructions provided to producers prior to harvest directed them to take many small samples of moving grain during storage bin filling or truck unloading in order to prepare a representative sample of the harvested grain.
Four crop districts from across the Prairies were selected as ‘sampling locations’ for each class in order to span a range of growing environments and Fusarium infection (). For CWRS, crop districts MB9, SK5A, SK7A, and AB2 were chosen. Since geographical trends have been noted for the incidence of Fusarium damage as well as the presence of various Fusarium species in CWRS, the four crop districts were chosen to span the area of the Prairies (Canadian Grain Commission Citation2018). In the eastern Prairies, MB9 was selected because of the historical (Clear and Abramson Citation1986) and continued presence of FHB in this area. In Saskatchewan, SK5A was selected because there was a high incidence of Fusarium damage in harvested grain in this crop district in 2016, and SK7A was selected because of a high occurrence of F. avenaceum as opposed to F. graminearum in previous years (Canadian Grain Commission Citation2018). In Alberta, AB2 was chosen because the grade distribution of CWRS was shifted towards better grades as compared to other crop districts, suggesting local differences.
Fig. 1 Crop districts of Western Canada from which Canada Western Red Spring (CWRS) and Canada Western Amber Durum (CWAD) samples were obtained.
For CWAD, crop districts SK2B, SK3BN, SK7A, and AB2 were chosen. The geographical range covered is less than for CWRS as CWAD is grown in the smaller grey soil zone of the Prairies. Both SK2B and SK3BN were selected because there was a frequent occurrence of FUS DMG in CWAD in 2016. SK7A and AB2 were used for CWAD for the same reasons they were selected for CWRS.
Grain grown in these districts and submitted to the CGC Harvest Sample Program were selected for use in the study. All available samples submitted from SK7A and AB2 (CWAD) and SK7A, MB9, and AB2 (CWRS) were analyzed. For SK3BN and SK2B (CWAD) and SK5A (CWRS), many samples were available so a sub-set was randomly selected from the available pool. All samples in the pool for each crop district were assigned numbers, and a random number generator was used to select specific samples for analysis (http://stattrek.com/statistics/random-number-generator.aspx); random selection was performed with no replication. The number of samples analyzed for each crop district are provided in and .
Table 1. Linear regression parameters for the Fusarium damage-DON relationships observed in CWAD.
Table 2. Linear regression parameters for the Fusarium damage-DON relationships observed in CWRS.
Fusarium damage assessment
FUS DMG was quantified in each sample by experienced CGC inspectors following the procedure outlined in the Official Grain Grading Guide (Canadian Grain Commission Citation2017). A Boerner divider (Seedburo Equipment Co., Des Plaines, IL, USA) was used to obtain a representative portion (100 g) of the submitted grain prior to inspection. All kernels showing any evidence of FUS DMG, including those with a chalk-like appearance, were separated from the bulk. A 10-power magnifying lens was used to examine the separated kernels and confirm the presence of white or pinkish mould or fibrous growth. Confirmed Fusarium damaged kernels (FDK) were weighed using a top loading balance and the FUS DMG of samples was calculated as the mass percentage of FDK in the representative portion inspected.
DNA extraction of Fusarium-damaged kernels
A separate portion of each sample obtained using a Boerner divider was used for fungal analysis. FDK were identified by CGC inspectors during FUS DMG assessment and placed in small re-sealable bags for each sample. In preparation for DNA extraction, a maximum of 12 FDK per sample were placed in individual wells of a 96-deep well plate (Eppendorf, 951033600) and sealed with cap mats (SPX-2201, ATS Scientific Inc., Burlington, ON, Canada). DNA extracts for individual kernels in 1.2 mL 8-tube strips on 8 × 12 racks (93000-042 VWR, Mississauga, ON, Canada or 19560, Qiagen, Toronto, ON, Canada) were prepared following the 96-well format method described in (Perry and Lee Citation2015) with the following modifications. Kernels were immersed in 75 µL of sterilized ddH2O overnight. A single 4 mm grinding ball (SPX 2150, ATS Scientific Inc., Burlington, ON, Canada) was added to each well using a grinding ball dispenser (SPX-2100, ATS Scientific Inc., Burlington, ON, Canada). Pulverization of kernels was carried out by placing the full 96-deep well plates inside a 2 × 24 adapter set (69982, Qiagen Inc., Toronto, ON, Canada) and agitated on a Retsch MM 400 mixer mill at 30 Hz. Agitation was carried for 12 min where the plates were flipped 180° after the first 6 min. DNA pellets were air-dried for 40 min after precipitation and then eluted in 10 mM Tris-HCl pH 7.5. Samples were stored short term at 4°C and centrifuged at 4,365 g rpm for 2 min before use.
High throughput real-time PCR setup
High throughput real-time PCR (HT-PCR) using the SmartChip Real-Time PCR system (Takara Bio USA Inc., Mountain View, CA; USA, formerly Wafergen Biosystems Inc.) was used to detect important DON producing Fusarium species, namely F. graminearum, F. pseudograminearum, and F. culmorum in samples from crop district AB2 in 2016. SmartChip MyDesign kits (Takara Bio USA Inc., Mountain View, CA, USA) containing 5184 × 100 nl well chips were used to carry out HT-PCR runs following the manufacturer’s protocol. Source plates for all quantitative PCR (qPCR) assays and DNA extracts used per HT-PCR run were prepared separately in NUNC 384-well plates (264574, Thermo Scientific) following the pattern for a 24 assay and 216 sample configuration (24A × 216S). Chips filled with 5184 100 nl qPCR reactions were thermocycled in the SmartCycler using the protocol for SYBR green fluorescence measurements including a melt curve analysis.
Extract source plates were prepared on NUNC 384 well plates using the Gilson PipetMax 268 pipetting robot with Trilution Micro 1.0 software (Gilson Inc., Middleton, WI, USA). A customized protocol was used to dispense 6.4 µL of 2X Lightcycler 480 SYBR Green I Master Mix (SYBR-MM, Roche, 04887352001) into 216 wells of a 384 well plate and then 6.4 µL 215 DNA extracts from 2 full racks of 8-strip tubes and a ‘quarter plate’ containing 24 extracts (3 × 8-strip tubes) following the sample pattern of the 24A × 216S template. PCR grade water (provided with SYBR-MM) was substituted for one DNA extract as a non-template control (NTC). The 384 well plate was sealed, vortexed for 5 s and centrifuged at 3220 g for 5 min before loading onto the MultiSample NanoDispenser (MSND).
Forward and reverse primers (5 μM each) were combined in 10 mM Tris-HCl for each of the qPCR assays on a multiwall plate to make a 24-assay panel for multiple HT-PCR runs. Previously published SYBR Green assays for F. graminearum, F. pseudograminearum, and F. culmorum targets were included in this panel (Nicholson et al. Citation1998; Nicolaisen et al. Citation2009). For one HT-PCR run, SYBR-MM was diluted to 1.11X in 900 µL with PCR grade H2O in a microcentrifuge tube. Following the assay pattern of the 24A × 216S template, 36 µL of the 1.11 X SYBR-MM mix was dispensed into 24 specific wells of a 48-well PCR plate (Axygen, PCR-48-C) and then 4 µL of each primer mix from the assay panel was transferred to corresponding well. As required in the assay source plate, 17.9 µL of each assay was transferred to a NUNC 384 well plate in duplicate. The assay source plate was sealed, vortexed for 5 s and centrifuged at 3220 x g for 5 min before loading onto the MSND.
In the SmartChip dispenser software settings, the ‘Gene expression’ mode was selected as it allowed visualization Ct values, melting temperatures (Tm), amplification curves, and melting curves. After DNA extract and qPCR assay loading of the 5184-well chip in the MSND, the chip was sealed with SmartChip Cycling film and centrifuged at 3220 g for 15 min before thermocycling in the Smartcycler. The MyDesign_SYBR_GX_Protocol_RevD protocol for thermocycling was selected including SYBR green fluorescence and melt curve analysis. Cycling conditions were 95°C for 173 s followed by 40 cycles of 95°C for 34 s and 60°C for 74 s and then a melt curve analysis from 60°C to 97°C at a ramp rate of 0.4°C/step.
HT-PCR data analysis
Data from completed runs were downloaded and processed using SmartChip qPCR software. A run data file with qPCR results for all FDK sample and assay combinations was exported as a tab-delimited text file and then imported into Microsoft Excel. Using the Kernel ID, HT-PCR results for individual FDK were linked to parent crop sample information. All run files with sample information were then compiled. For each Fusarium species tested, positive kernels were summed by sample. Percent positive values for each CWRS sample in crop district AB2 in 2016 were calculated by dividing the sum of PCR positive kernels for DON producing Fusarium species by total FDK tested.
DON analysis
Samples (ranging from 300 to 1000 g) were ground in a commercial coffee grinder (model KR 804, Ditting Maschinen AG, Switzerland) fine enough that ≥85% of the sample mass passed through a US 50 sieve (nominal sieve openings of 300 μm). Ground grain was sub-sampled using a rotary sample divider (PT100, Retsch, Hahn, Germany) to avoid bias from the physical heterogeneity of the ground grain and obtain a test portion of approximately 50 g. Test portions were analyzed for DON using an enzyme-linked immunosorbent assay (ELISA; Neogen Veratox for DON 5/5 test kit; Neogen, Lansing, MI, USA). Analyses were performed as described in Tittlemier et al. (Citation2015), where the test kit instructions were followed with the modification of extracting a 50 g test portion. A ratio of 10:1 (v/m) of water to sample was maintained for the extraction. The limit of quantitation for the ELISA method was 0.5 mg/kg. For quality control, each strip of wells on the test plates contained at least one DON in wheat reference material (Trilogy Analytical Laboratory, Washington, MO, USA) extract and a matrix-free DON blank.
SigmaPlot (version 13.0; Systat Software Inc.) was used for statistical analyses. A statistical significance threshold of p < 0.05 was used.
Multi-mycotoxin analysis
Analysis for mycotoxins in addition to DON was performed using the multi-mycotoxin ultra-high performance liquid chromatographic–mass spectrometric (UPLC–MS/MS) method and quality control as described in Tittlemier et al. (Citation2019). Briefly, ground sample was extracted with acetonitrile/water/acetic acid and shaken on a flatbed shaker. An aliquot of solvent mixture was centrifuged and a portion of supernatant was diluted with mobile phase. Stable isotope labelled 13C internal standards were added to the diluted sample extract prior to instrumental analysis using electrospray ionization with polarity switching. Mycotoxins were quantified using a calibration curve constructed from 7 matrix-matched external standards. Peak areas from quantitation transitions were normalized to the peak area of 13C-labelled internal standard during data analysis in order to mitigate matrix effects on quantitation prior to interpolation of analyte concentration from the calibration curve.
The multi-mycotoxin method covered DON and a number of additional Fusarium mycotoxins, or their transformation products, including DON-3-glucoside, 3- and 15-acetylDON, culmorin, nivalenol, HT-2 and T-2 toxins, zearalenone, beauvericin, and enniatins A, A1, B, and B1.
Data analysis
Linear regression analysis was performed on raw DON concentrations and FUS DMG mass-based percentages using SigmaPlot 13.0. Slopes from the linear regressions were investigated for differences using the Test for Equality of Slopes function in SigmaPlot 13.0. The differences amongst slopes in the linear regressions of DON and FUS DMG were examined further using an ANOVA that modelled FUS DMG as a predictor of DON, testing for differences between crop districts and in interaction effects between crop district and FUS DMG. These analyses were performed using SAS 9.4. All statistical analyses used a level of significance at p = 0.05.
Results and discussion
Linear relationships were observed between FUS DMG and DON in CWAD for the four crop districts studied (). All linear regressions were statistically significant; the parameters of the CWAD regressions are provided in . The severity and occurrence of FUS DMG was higher in CWAD than in past years, and the linear relationships between FUS DMG and DON in the crop districts studied were visually similar to those observed in recent years for Prairie-wide assessments (Tittlemier et al. Citation2019); however, there were significant differences amongst slopes (p = 0.0011). Slopes (and intercepts) for the crop district linear relationships in 2016 ranged from 0.6032 to 0.8017 (−0.1770 to 1.747) as compared to 0.676 to 0.762 (−0.184 to −0.488) for the Prairie-wide FUS DMG-DON relationships in 2011 and 2014 (Tittlemier et al. Citation2019), indicating some variability amongst years.
Fig. 2 (Colour online) Fusarium damage (FUS DMG) – DON relationships for CWAD from selected crop districts and the Prairies. See for the linear regression parameters.
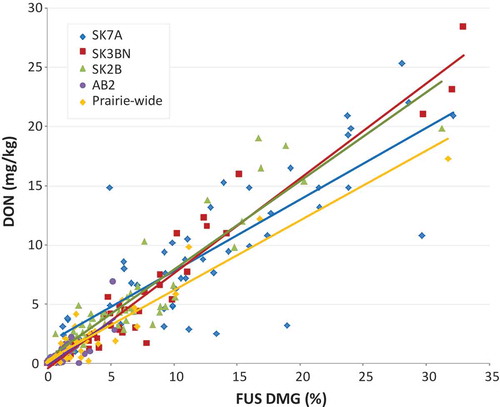
The severity of FHB that occurred in CWAD in 2016 was emphasized by very high values of FUS DMG reported. Values of FUS DMG at the upper end of the reported range exceeded 30% (). The grading tolerances for FUS DMG in CWAD range from 0.5% for No. 1 and No. 2 CWAD to 4% for No. 5 CWAD. Beyond this, sample is considered ‘Wheat, Sample CW Account Fusarium Damage’ or ‘Wheat, Commercial Salvage’ if FUS DMG is over 10% (Canadian Grain Commission Citation2017). In the 2016 Harvest Sample Program, 79% of CWAD submitted contained FUS DMG, as compared to 34% and 3.7% in 2015 and 2017, respectively (Canadian Grain Commission Citation2018).
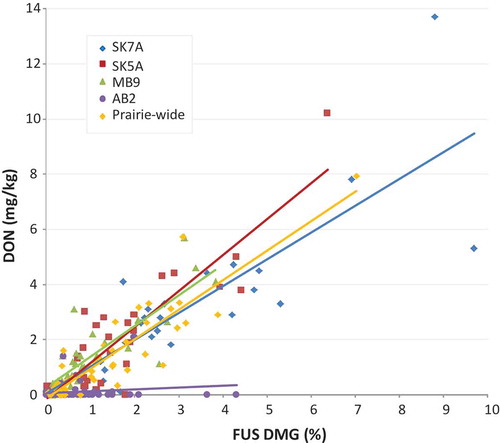
For CWRS, the relationship between FUS DMG and DON was consistent between the SK7A, SK5A, and MB9 crop districts and the Prairie-wide assessment (). The parameters of the CWRS regressions are provided in . All linear regressions aside from that for samples from AB2 were statistically significant. There were also significant differences amongst slopes (p = 0.0036) for the SK7A, SK5A, MB9, and the Prairie-wide linear relationships. Samples from the AB2 crop district in southern Alberta did not show a relationship between FUS DMG and DON. The frequency of occurrence of DON and the concentrations measured in CWRS samples from AB2 were much lower than expected based on the degree of FUS DMG observed.
Fig. 3 (Colour online) Fusarium damage (FUS DMG) – DON relationships for CWRS from selected crop districts and the Prairies. See for the linear regression parameters.
A lack of relationship between FUS DMG and DON has been reported in the past (Lacey et al. Citation1999; Cowger and Arrellano Citation2010). However, these instances were due to lower than expected FUS DMG for the DON concentrations measured as opposed to unremarkable FUS DMG and lower than expected DON concentrations. The past reports of asymptomatic wheat with higher than expected DON concentrations were associated with infection by F. culmorum in the late milk-early dough stages (Lacey et al. Citation1999) or infection by F. graminearum 10–20 days after anthesis, particularly with periods of rain soon after anthesis (Cowger and Arrellano Citation2010).
The disconnect between CWRS samples with reported FUS DMG and the lack of occurrence of DON was unique for crop district AB2. Only 4 of the 67 CWRS samples from AB2 analyzed by ELISA contained measurable concentrations of DON. However, FUS DMG was reported in 53 of the 67 samples. For the other three crop districts, all CWRS samples had reported FUS DMG and most had measurable DON. The percentage of samples analyzed that contained measurable DON was 100% for MB9, 85% for SK7A, and 68% for SK5A. Samples from AB2 also had significantly lower FUS DMG observed in CWRS than from the other crop districts (p < 0.001; Kruskal–Wallis one way analysis of variance on ranks). The median FUS DMG in CWRS samples from AB2 was 0.34% as compared to 2.45% (SK7A), 1.24% (SK5A), and 0.67% (MB9).
The lack of relationship between FUS DMG and DON was limited to CWRS from AB2; there was a relationship between FUS DMG and DON for CWAD in this crop district. For CWAD from AB2, the FUS DMG reported ranged from 0% to 5.34%, with a median of 0.83% (). There was a similar shape to the distribution of DON concentrations. The FUS DMG in CWRS samples ranged from 0% to 4.31%, with a median of 0.34%. As can be seen in , the distribution of FUS DMG observed in CWRS samples from AB2 is slightly shifted to the left as compared to CWAD, with a small increase centred around 4%. However, the distribution of DON is significantly shifted to the left for CWRS, reflecting the very low occurrence of DON in the CWRS samples.
Fig. 4 Distribution of Fusarium damage (FUS DMG) and DON in Canada Western Red Spring (CWRS) and Canada Western Amber Durum (CWAD) samples from crop district AB2.
The lack of relationship between FUS DMG and DON in CWRS from AB2 in 2016 could be due to various factors. The observed FUS DMG could have been caused by F. graminearum or other DON-producers without the infection progressing to the point of DON production. The likelihood of this is questionable as DON production has been shown to play an important role in the spread of FHB (Bai et al. Citation2002). As well, a study examining the DON content of individual wheat FDK showed that only approximately 1% of FDK contained no measurable DON (Sinha and Savard Citation1997).
Fungal analysis was also used to investigate the specific presence of DON-producing Fusarium on FDK in CWRS from AB2 and to explore if F. graminearum or other DON-producers were present but did not produce DON in 2016. The percentage of FDK found to contain F. graminearum, F. pseudograminearum, and/or F. culmorum was multiplied by the reported FUS DMG to obtain an adjusted FUS DMG value that represented damage only from species known to produce DON. The adjustment was performed on the sub-set of CWRS (n = 19) analyzed for both DON and Fusarium species. The DON concentration in the subset of samples was linearly related to the corresponding adjusted FUS DMG (, R = 0.922, p < 0.001), as was observed for CWRS in other crop districts studied. The existence of this adjusted FUS DMG-DON relationship rules out the possibility that all of the FUS DMG observed was caused by DON-producers such as F. graminearum without the production of DON. It appears that for the entire sample set of CWRS from AB2, the FUS DMG-DON relationship is obscured by FUS DMG from sources aside from DON-producing Fusarium.
Fig. 5 Adjusted Fusarium damage (FUS DMG) – DON relationships for CWRS from AB2 crop district. The adjustment was made by multiplying the reported FUS DMG by the percentage of Fusarium damaged kernels found to contain F. graminearum, F. pseudograminearum, and/or F. culmorum in each sample analyzed for both DON and Fusarium species.
Another possible cause of the lack of FUS DMG-DON relationship is that F. graminearum and other DON-producers did not cause the FUS DMG reported in the CWRS samples from AB2 in 2016, as it did for the CWAD. Fungal surveys conducted on the 2016 harvest showed that F. graminearum was associated with less than 40% of the FDK in CWRS from AB2 (Canadian Grain Commission Citation2018), suggesting other fungal species were responsible for the FUS DMG observed in the 2016 AB2 CWRS. However, F. pseudograminearum was not detected in any of the FDK in CWRS from AB2, and the non-DON producing F. avenaceum was associated with only 45% of the CWRS FDK in AB2. For comparison, all FDK analyzed from the AB2 CWAD showed the presence of F. graminearum and approximately 80% of the FDK also showed the presence of F. avenaceum. The lower occurrence of F. graminearum in the AB2 CWRS may suggest that other Fusarium species that do not produce DON could have caused the FUS DMG observed. This was the case in CWAD grown in 2010, where FUS DMG was associated with the presence of F. avenaceum as opposed to F. graminearum (Tittlemier et al. Citation2013b).
To investigate further if other Fusarium species did contribute to the FUS DMG observed in the CWRS from AB2, a subset of 10 CWRS samples each from AB2 and the next westernmost crop district (SK7A) were analyzed by a multi-mycotoxin UHPLC-MS/MS method. Results from these analyses are summarized in . Mycotoxins associated with F. sporotrichioides (HT2 and T2 toxins) and F. poae (nivalenol) (Frisvad et al. Citation2007) were not detected in any of the CWRS samples. Beauvericin and the enniatins produced by F. avenaceum (Jestoi et al. Citation2004) were much less frequently detected in samples from AB2 as compared to SK7A. When they were measured, they were also at lower concentrations in AB2 samples as well.
Table 3. Median (range) concentrations (n = 10; mg/kg) of Fusarium-produced mycotoxins in CWRS samples from western crop districts.
The absence of HT2, T2, and nivalenol, coupled with the low concentrations of beauvericin and enniatins in the CWRS samples tested, suggests that the visible symptoms of damage on CWRS from AB2 were not produced by Fusarium species. However, the low concentrations of beauvericin and enniatins could also indicate that even though F. avenaceum was present, conditions were not conducive to the formation of these mycotoxins. Past research on CWAD suggests that the concentration of beauvericin and enniatins is not linearly correlated with the presence of F. avenaceum, but that there may be a threshold beyond which production of these mycotoxins flourishes (Tittlemier et al. Citation2013b). Overall, the visible symptoms of damage on CWRS from AB2 do not appear to have been produced by Fusarium species, suggesting another fungal species, such as Septoria nodorum (Canadian Grain Commission Citation2019), contributed to the physical symptoms reported.
The anomalous results observed for the FUS DMG-DON relationship for CWRS from AB2 in 2016 may not persist in future years. Even though the particular underlying factors that influenced the situation for CWRS in AB2 in 2016 were not identified, there are known factors that contribute to Fusarium infection and DON production in wheat. These factors include the temperature and precipitation of the growing season, as well as time of flowering (Kriss et al. Citation2012), agronomic practices such as fungicide application (Scarpino et al. Citation2015) and the susceptibility to infection of wheat variety selected for growing (Alberta Agriculture and Forestry Citation2019), as well as the population of Fusarium species and chemotypes, and other microorganisms that may interact with Fusarium species, that infect the growing wheat (Ward et al. Citation2008). These factors can all vary from year to year.
Overall, the 2016 growing season was a severe year for FHB in western Canada; CWRS and CWAD from 2016 showed an increased occurrence and severity of FUS DMG. For CWAD and most CWRS, there was a significant relationship between FUS DMG and DON, a mycotoxin produced by F. graminearum and often observed in Canadian cereal grain (Tittlemier et al. Citation2013a). However, CWRS from the AB2 crop district in south-central Alberta contained much lower DON than expected by the reported FUS DMG for the samples. This was different than what was observed with the CWAD grown in the same crop district that year. The lack of presence of other Fusarium mycotoxins aside from DON suggests that the observed damage may not have been caused by Fusarium species.
The absence or masking of a relationship between DON and FUS DMG in AB2 in 2016 has implications on managing DON in wheat and durum. Currently, a combination of analytical testing and grading using visual assessment is used to ensure that wheat and durum meet customer specifications to limit consumers’ exposure to DON. The presence of damage resembling FUS DMG without associated DON can result in grain being classified as lower quality on a food or feed safety basis if proper analytical testing is not performed to confirm the absence of DON.
Acknowledgements
Jason Chan and Wes Harnden assisted with preparation of samples for analysis. Anh Phan assisted with statistical analyses.
References
- Alberta Agriculture and Forestry. 2019. Varieties of Cereal and Oilseed Crops for Alberta. Agdex 100/32. [accessed 2019 Jan 29]. http://www1.agric.gov.ab.ca/$department/deptdocs.nsf/all/agdex4069.
- Bai GH, Desjardins AE, Plattner RD. 2002. Deoxynivalenol-nonproducing Fusarium graminearum causes initial infection, but does not cause disease spread in wheat spikes. Mycopathologia. 153(2):91–98.
- Bondy GS, Pestka JJ. 2000. Immunomodulation by fungal toxins. J Toxicol Environ Health B Crit Rev. 3(2):109–143.
- Canadian Grain Commission. 2017. Official Grain Grading Guide. Winnipeg (MB, Canada). [accessed 2018 Feb 22]. https://www.grainscanada.gc.ca/oggg-gocg/ggg-gcg-eng.htm.
- Canadian Grain Commission. 2018. Fusarium head blight in Canadian wheat, maps and charts 2011 to 2016. Winnipeg (MB, Canada). [accessed 2018 Feb 22]. https://www.grainscanada.gc.ca/str-rst/fusarium/fhbmc-feccg-en.htm.
- Canadian Grain Commission. 2019. Identifying wheat and barley seed affected by fusarium headblight. Winnipeg (MB, Canada). [accessed 2019 Apr 23]. https://www.grainscanada.gc.ca/en/grain-quality/grain-grading/grading-factors/identifying-fusarium.html.
- Clear RM, Abramson D. 1986. Occurrrence of fusarium head blight and deoxynivalenol (vomitoxin) in two samples of Manitoba wheat in 1984. Can Plant Dis Surv. 66(1):9–11.
- Clear RM, Patrick S. 2010. Fusarium graminearum and other fungi isolated from fusarium-damaged kernels of Canadian wheat, 1999 to 2008. Can Plant Dis Surv. 90:88–90.
- Codex Alimentarius Commission. 2016. CODEX STAN 193-1995. Codex general standard for contaminants and toxins in food and feed. [accessed 2018 Jan 26]. http://www.fao.org/fileadmin/user_upload/livestockgov/documents/1_CXS_193e.pdf.
- Cowger C, Arrellano C. 2010. Plump kernels with high deoxynivalenol linked to late Gibberella zeae infection and marginal disease conditions in winter wheat. Phytopathology. 100:719–728.
- Dexter JE, Clear RM, Preston KR. 1996. Fusarium head blight: effect on the milling and baking of some Canadian wheats. Cereal Chem. 73(6):6.
- European Commission. 2006. Commission regulation (EC) No. 1881/2006 setting maimum levels for certain contaminants in foodstuffs. [accessed 2018 Feb 22]. https://eur-lex.europa.eu/legal-content/EN/TXT/PDF/?uri=CELEX:32006R1881&from=EN.
- Frisvad JC, Thrane U, Samson RA. 2007. Mycotoxin Producers. In: Dijksterhuis J, Samson RA, editors. Food mycology: A multifaceted approach to fungi and food. Boca Raton (FL): CRC Press Inc.; p. 135–159.
- Jestoi M, Rokka M, Yli-Mattila T, Parikka P, Rizzo A, Peltonen K. 2004. Presence and concentrations of the Fusarium-related mycotoxins beauvericin, enniatins and moniliformin in Finnish grain samples. Food Addit Contam. 21(8):794–802.
- Kriss A, Paul P, Xu X, Nicholson P, Doohan F, Hornok L, Rietini A, Edwards S, Madden L. 2012. Quantification of the relationship between the environment and Fusarium head blight, Fusarium pathogen density, and mycotoxins in winter wheat in Europe. Eur J Plant Pathol. 133(4):975–993.
- Lacey J, Bateman GL, Mirocha CJ. 1999. Effects of infection time and moisture on development of ear blight and deoxynivalenol production by Fusarium spp. in wheat. Ann Appl Biol. 134(3):277–283.
- Muthomi JW, Ndung’u JK, Gathumbi JK, Mutitu EW, Wagacha JM. 2008. The occurrence of Fusarium species and mycotoxins in Kenyan wheat. Crop Prot. 27(8):1215–1219.
- Nicholson P, Simpson DR, Weston G, Rezanoor HN, Lees AK, Parry DW, Joyce D. 1998. Detection and quantification of Fusarium culmorum and Fusarium graminearum in cereals using PCR assays. Physiol Mol Plant Pathol. 53(1):17–37.
- Nicolaisen M, Supronienė S, Nielsen LK, Lazzaro I, Spliid NH, Justesen AF. 2009. Real-time PCR for quantification of eleven individual Fusarium species in cereals. J Microbiol Meth. 76(3):234–240.
- Paul PA, Lipps PE, Madden LV. 2005. Relationship between visual estimates of Fusarium head blight intensity and deoxynivalenol accumulation in harvested wheat grain: A meta-analysis. Phytopathology. 95(10):1225–1236.
- Perry DJ, Lee S-J. 2015. Identification of Canadian wheat varieties using OpenArray genotyping technology. J Cereal Sci. 65:267–276.
- Pestka JJ. 2010. Toxicological mechanisms and potential health effects of deoxynivalenol and nivalenol. World Mycotoxin J. 3(4):323–347.
- Scarpino V, Reyneri A, Sulyok M, Krska R, Blandino M. 2015. Effect of fungicide application to control Fusarium head blight and 20 Fusarium and Alternaria mycotoxins in winter wheat (Triticum aestivum L.). World Mycotoxin J. 8(4):499–510.
- Shala-Mayrhofer V, Marjakaj R, Varga E, Berthiller F, Musolli A, Lemmens M. 2015. Occurrence of Fusarium head blight and mycotoxins as well as morphological identification of Fusarium species in winter wheat in Kosovo. Cereal Res Commun. 43(3):438–448.
- Simsek S, Burgess K, Whitney KL, Gu Y, Qian SY. 2012. Analysis of deoxynivalenol and deoxynivalenol-3-glucoside in wheat. Food Control. 26(2):287–292.
- Sinha RC, Savard ME. 1997. Concentration of deoxynivalenol in single kernels and various tissues of wheat heads. Can J Plant Pathol. 19:8–12.
- Tittlemier SA, Blagden R, Chan J, Gaba D, McKendry T, Pleskach K, Roscoe M. 2019. Fusarium and Alternaria mycotoxins in Canadian wheat and durum harvest samples from 2010– 2016. Can J Plant Pathol. https://doi.org/10.1080/07060661.2019.1592784.
- Tittlemier SA, Gaba D, Chan JM. 2013a. Monitoring of Fusarium trichothecenes in Canadian cereal grain shipments from 2010 to 2012. J Agric Food Chem. 61:7412–7418.
- Tittlemier SA, Roscoe M, Trelka R, Gaba D, Chan JM, Patrick SK, Sulyok M, Krska R, McKendry T, Gräfenhan T. 2013b. Fusarium damage in small cereal grains from western Canada. 2. Occurrence of Fusarium toxins and their source organisms in durum wheat harvested in 2010. J Agric Food Chem. 61:5438–5448.
- Tittlemier SA, Sobering D, Bowler K, Zirdum T, Gaba D, Chan JM, Roscoe M, Blagden R, Campbell L. 2015. By-products of grain cleaning: an opportunity for rapid sampling and screening of wheat for mycotoxins. World Mycotoxin J. 8(1):45–53.
- Tomczak M, Wiśniewska H, Stcępień Ł, Kostecki M, Chełkowski J, Goliński P. 2002. Deoxynivalenol, nivalenol and moniliformin in wheat samples with head blight (scab) symptoms in Poland (1998–2000). Eur J Plant Pathol. 108(7):625–630.
- van der Fels-Klerx HJ, de Rijk TC, Booij CJH, Goedhart PW, Boers EAM, Zhao C, Waalwijk C, Mol HGJ, van der Lee TAJ. 2012. Occurrence of Fusarium Head blight species and Fusarium mycotoxins in winter wheat in the Netherlands in 2009. Food Addit Contam A. 29(11):1716–1726.
- Ward TJ, Clear RM, Rooney AP, O’Donnell K, Gaba D, Patrick S, Starkey DE, Gilbert J, Geiser DM, Nowicki TW. 2008. An adaptive evolutionary shift in Fusarium head blight pathogen populations is driving the rapid spread of more toxigenic Fusarium graminearum in North America. Fungal Genet Biol. 45(4):473–484.