
Abstract
Fusarium head blight is a globally devastating disease of wheat, for which sources and mechanisms of resistance are urgently needed. The goal of this research was to elucidate the chemical nature of changes incurred in the rachis of a susceptible wheat (‘Chinese Spring’, CS), and a related addition line (CS-7EL) with resistance conferred by a fragment of the 7E chromosome from a wild wheat relative (Thinopyrum elongatum) in response to infection by Fusarium graminearum. Gravimetric analysis, followed by more targeted extractions and hydrolyses was used to study responses in the rachis of both genotypes at 7 days after fungal and mock inoculations. The most significant changes in the gravimetric analyses were an increase in the proportion of lignin in CS-7EL, and an increase in the proportion of hot water soluble compounds in CS. HPLC analysis of sugar profiles indicated higher degradation of arabinoxylan and cellulose in CS compared with CS-7EL. Differences were also observed in the profiles of the free, conjugated, and bound phenolic fractions for both varieties, with the conjugated fraction showing the greatest variation. The dominant phenolic acid in all samples was p-coumaric. A biplot analysis incorporating phenolic and sugar data was employed to provide an overview of responses to mock- and Fusarium-inoculation in CS and CS-7EL. Overall, our results suggest cell wall degradation in CS, and fortification in CS-7EL via increased lignification, in response to Fusarium infection.
Résumé
La brûlure de l’épi causée par le fusarium est une maladie qui cause de graves dommages partout dans le monde et contre laquelle il faut rapidement trouver des sources et des mécanismes de résistance. Le but de cette recherche était d’élucider la nature chimique des changements se produisant dans le rachis d’un cultivar de blé vulnérable (‘Chinese Spring’ [CS]) et d’une lignée d’addition parente (CS-7EL) qui possède une résistance conférée par un fragment du chromosome 7E provenant d’un parent de blé sauvage (Thinopyrum elongatum) comme solution à l’infection causée par Fusarium graminearum. L’analyse gravimétrique, suivie d’extractions plus ciblées et d’hydrolyses, a été utilisée pour étudier les réactions dans le rachis des deux génotypes, sept jours après des inoculations fongiques et factices. Les changements les plus significatifs lors des analyses gravimétriques correspondaient à un accroissement de la proportion de lignine chez CS-7EL et à une augmentation de la proportion de composés solubles dans l’eau chaude chez CS. L’analyse par CLHP des profils du sucre a indiqué une plus forte dégradation de l’arabinoxylane et de la cellulose chez CS comparativement à CS-7EL. Des différences ont également été observées dans les profils des fractions phénoliques libres, conjuguées et liées chez les deux variétés, la fraction conjuguée affichant la plus grande variation. Dans tous les échantillons, l’acide phénolique qui prédominait était l’acide p-coumarique. Une analyse biplot, incorporant les données sur les phénols et les sucres, a été utilisée pour obtenir une vue d’ensemble des réactions chez CS et CS-7EL aux inoculations avec Fusarium et aux inoculations factices. En général, nos résultats indiquent, en réaction à l’infection par Fusarium, la dégradation de la paroi cellulaire chez CS et son renforcement chez CS-7EL par l’accroissement de la lignification.
Introduction
Fusarium head blight (FHB) is a devastating disease of small grain cereals across North America and globally. Infection is detrimental to the producer on two fronts: major losses in yield, and much of the harvested grain is of poor quality owing to the presence of mycotoxins. In North America, the predominant cause of FHB is the fungal species Fusarium graminearum (Schwabe) (teleomorph = Gibberella zeae (Schw.) Petch). Although a suite of management practices (e.g. crop rotation, timing and application of foliar fungicides, choice of planting dates) are currently used to manage the infection and spread of FHB, in epidemic years they are of limited use. The use of tolerant or resistant varieties in a well-designed management schedule is widely acknowledged as a more robust, long-term solution to the FHB problem (Beres et al. Citation2018). Most of the resistant material used in current breeding programmes originates from a relatively small pool of germplasm (Rudd et al. Citation2001). This resource pool can be increased by the introduction of germplasm from naturally resistant wild relatives. One such relative of wheat is Thinopyrum elongatum (synonyms include Agropyron elongatum, Agropyron rigidum, Lophopyrum elongatum and Triticum elongatum (U.S. Department of Agriculture Citation2018)).
Thinopyrum elongatum has been used to generate a series of substitution and addition lines using the cultivar ‘Chinese Spring’ (CS) (Dvorak and Knott Citation1974; Dvorak Citation1980), a wheat variety that is moderately susceptible to FHB. One of these addition lines, CS-7EL, carries a fragment of the long arm of chromosome 7E of Th. elongatum, which has been shown to carry resistance/tolerance to FHB (Shen et al. Citation2004; Shen and Ohm Citation2006; Wang et al. Citation2010; Miller et al. Citation2011). The chromosome fragment has not yet been fully characterized, and the precise size is unknown (Dr T. Ouellet, personal communication). The nature of the conferred resistance is currently under investigation.
As early as the 1950s, Schroeder (Citation1955) indicated that an important component of resistance to the spread of FHB was expressed in the rachis. More recent studies (Miller et al. Citation2004, Citation2011; Hofstad et al. Citation2016) have confirmed the contribution of the rachis in more than one resistant variety. We have demonstrated the presence of vascular occlusions that block the progress of the fungus through the node at the base of the floret and into the rachis in response to infection in both ‘Sumai 3' and in CS-7EL (Miller et al. Citation2004, Citation2011). However, histochemical analyses were unable to determine the chemical nature of these occlusions. The objective of the present paper is to study changes in rachis composition in response to infection in the susceptible variety ‘Chinese Spring’ (CS), and its resistant derivative line CS-7EL to elucidate the nature of the resistance expressed in CS-7EL.
Materials and methods
Chemicals
Sulphuric acid, 72% w/w, was purchased from RICCA (RICCA Chemical Company, Arlington, TX). Standard solutions of sodium hydroxide and hydrochloric acid were purchased from Fisher Scientific (Nepean, ON). All organic solvents including acetone, ethyl acetate, methanol, ethanol and glycerol were analytical grade, and solvents for HPLC analysis were all HPLC grade purchased from Sigma-Aldrich (St. Louis, MO). Standard phenolic acids were all analytical grades and purchased either from Sigma or ACS. Required chemicals for CMC medium preparation and the Folin–Ciocalteu assay were purchased from Sigma. All other chemicals used were analytical grade.
Plant material
‘Chinese Spring’ (CS), a wheat variety that is moderately susceptible to FHB, and CS-7EL, an addition line derived from CS, were used in this study. Seeds of each genotype were surface sterilized in 0.75% hypochlorite solution (Clorox bleach, Brampton, ON) for 5 min, then rinsed three times with sterile distilled water. Wheat seeds were sown in trays (one seed/pot) and maintained in a growth cabinet with a 16 h photoperiod, day/night temperature 20°C/16°C until day 20, at which point plants were vernalized at 4°C for 3 weeks, then transferred into 12.5 cm peat pots (2 plants/pot) and arranged randomly in the growth cabinet and maintained until anthesis. The total number of pots was 50, and the total number of plants per treatment was 25.
Inoculum preparation
A culture of Fusarium graminearum (isolate # DAOM233423) was received on Spezieller Nährstoffarmer agar (SNA) from the Canadian Collection of Fungal Cultures (DAOMC, AAFC, Ottawa RDC, ON). Fresh macroconidia were produced using plugs from the SNA plates by growing them in liquid carboxymethylcellulose (CMC) medium (Cappellini and Peterson Citation1965) in the dark with shaking (170 rpm) at 28°C for 3 days. Spores were harvested by centrifugation (4000 rpm, 10 min), washed three times with distilled water, counted using a hemocytometer, and stored for no more than a week in the fridge until use.
Inoculation and sampling
When there were three or more heads per pot at 50% anthesis, they were selected for inoculation either with F. graminearum or water so that there were equal numbers of heads per treatment. Pots were randomly assigned for mock or Fusarium treatment. The two basal florets of all spikelets on one side of the wheat heads were point inoculated with 10 μL of F. graminearum spore suspension (10 000 spores mL−1). Mock control heads were inoculated with sterile deionized water. After inoculation, plants were moved into a misting cabinet for 48 h with intermittent misting (1 min every 60 min) during the light period. The photoperiod was 16 h and the temperature was maintained at 25°C day and night.
Wheat heads were harvested at 7 days post inoculation (dpi), the florets were removed, and the collected rachises were weighed and frozen immediately in liquid N2. The rachises were then freeze dried, and four biological replicates were made by pooling 10–12 rachises from the same inoculation/harvesting date. Samples were then ground using a ball mill, and stored in the freezer (−20°C) until extraction and analysis.
Gravimetric fractionation
A sequential gravimetric analysis method (Harper and Lynch Citation1981) was adopted to generate three fractions: a hot water extract, lignin and holocellulose (cellulose and hemicellulose). Ten mL of deionized water was added to 100 mg of ground, freeze-dried rachis and boiled at 100°C for 1 h, followed by 10 min centrifugation at 5000 rpm, and the supernatant was transferred to a separate tube. This was repeated one more time, and the combined supernatants were freeze dried (hot water extract). The pellet was treated twice with acetic acid and sodium chlorite to extract the lignin fraction. The dried residue after lignin extraction was considered as the holocellulose fraction.
Analysis of carbohydrates
For analysis of component monosaccharides, the holocellulose fraction was hydrolysed using 72% sulphuric acid for 1 h at 25°C, then diluted to 1 M sulphuric acid, and the hydrolysis continued for another 3 h at 100°C (Bainy et al. Citation2008). The hydrolysates were neutralized using sodium bicarbonate, freeze dried, and the sugars were extracted from the residue into 100% methanol. The methanol layer was then evaporated under N2 and samples kept in the freezer until analysis.
The sugar composition of the hot water extracts and holocellulose acid hydrolysates were analysed using HPLC (UFLC Shimadzu, Kyoto, Japan) equipped with a binary pump (Shimadzu LC-20AB), an autosampler (Shimadzu SIL-20A HT), and an evaporative light scattering detector (Shimadzu ELSD-LT-II; drift tube T: 35°C, N2 flow rate: 35 bar, gain: 256). A carbohydrate amino column (Carbohydrate Analysis; 3.9 mm × 300 mm, pore size 10 µm; Waters, Milford, MA) was used with correspondent guard column (column T: 30°C). An isocratic elution of 82% acetonitrile in water and a flow rate of 1 mL min−1 were applied to separate mono- and disaccharides (injection volume: 10 µL). A mixture of eight sugar standards (rhamnose, xylose, arabinose, fructose, mannose, glucose, galactose and sucrose) was prepared in five serial dilutions, and the standard curves were plotted to calculate the sugar concentration. To assess pectin content, the uronic acid contents of the hot water extracts and holocellulose acid hydrolysates were measured using a Megazyme kit (K-URONIC, Co. Wicklow, Ireland).
Analysis of phenolics
A micro-extraction fractionation/liquid-liquid partition method (Kim et al. Citation2006) was adopted to obtain soluble free-, soluble conjugated- and bound-phenolics from dried and ground wheat rachis samples. Fifty mg of rachis was extracted with 80% methanol (three times, ratio 1:10 g mL−1, 10 min sonication followed by 10 min stirring at room temperature (RT)). The supernatant, after 80% methanol extraction, was used to obtain the soluble free phenolics through ethyl acetate partitioning, and the remaining aqueous layer was dried (after neutralization) and further treated with 2 N NaOH (4 h, RT) to release soluble conjugated phenolics which were collected by ethyl acetate partitioning. The pellet after drying was treated with 4 N NaOH (4 h, RT) followed by ethyl acetate partitioning (five times) to release bound phenolics. All fractions were dried under N2 and kept in the freezer for further analysis.
The phenolic composition of the three fractions was analysed using an Agilent HPLC system (1100 Series, with quaternary pump and autosampler) equipped with a variable wavelength detector (VWD, G1314A, Agilent Series 1100) and diode array detector (DAD, G1315D, Agilent 1260 Infinity Series). An Atlantis T3 column, 2.1 mm × 100 mm, pore size 3 µm (Waters, Milford, MA) was used with correspondent guard column (column T: 30°C). A gradient using two solvents (acetonitrile and 0.1% formic acid in water) was used for elution. The gradient elution started with 8% acetonitrile, increased to 10% by min 10, then increased to 45% by min 30, followed by a sharp increase to 100% by min 31 to wash out all remaining compounds from the column, then returned to 8% by min 32, followed by 8 min to condition the column for the next run (total run time: 40 min, injection volume: 5 µL). A mixture of 13 phenolic standards (see supplementary Fig. 1) was prepared with six serial dilutions, and the standard curves were plotted to calculate the phenolic concentration. Peak identification was performed by comparing the retention times and spectra of the unknowns with the phenolic standards.
The total phenolic content of the different fractions was assayed colorimetrically using the Folin–Ciocalteu reagent based on a method adapted from Hayouni et al. (Citation2007). Five hundred µL of a 1/5 dilution of Folin–Ciocalteu reagent (Sigma-Aldrich, St. Louis, MO) and 100 µL of dH2O were added to 100 µL of sample and mixed thoroughly. After 1 min, 1.5 mL of 10% Na2CO3 was added. The samples were mixed again, incubated for 90 min, and then the absorbance was read at 760 nm. A standard curve was constructed using gallic acid, and all quantities are reported as gallic acid equivalents.
Statistical analysis
A randomized block design was used in which pots were randomly arranged in a single growth chamber, with positions randomly changed daily throughout the experimental period. After harvesting, florets were removed from the inoculated heads, and four biological replicates were made by pooling 10–12 freeze-dried rachises from the same inoculation/harvesting date. One-way ANOVA was performed using ‘R’ statistical software (version R-3.5.0) to examine the significance of the means for all measurements. Duncan’s multiple range test was further employed to compare the means that showed significant differences (P < 0.05).
To visualize an overview of the associations among wheat rachis treatments and their chemical compositions (phenolics in different fractions and free and polysaccharide sugars) a genotype by treatment (GT) biplot was used (Yan Citation2001). The biplot parameters were: trait-standardized GT data (indicated by ‘Scaling = 1’ and ‘centring = 2’ on biplot, the biplot origin shows the mean value for each trait); and trait-focused singular value partitioning (indicated by ‘SVP = 2’).
Results and discussion
Although significant changes in gene expression/response to Fusarium infection have been reported as early as 2 days after inoculation (Wang et al. Citation2010), our data indicate that the chemical changes in the rachis in response to the changes in gene expression take more time to manifest. Based on the data of Wang et al. (Citation2010) we performed analyses at 4 days after inoculation, but the observed changes were small (Hadinezhad et al. Citation2016). When the infection period was extended to 7 days, more striking differences were noted, both visually and in rachis chemistry.
Physical attributes
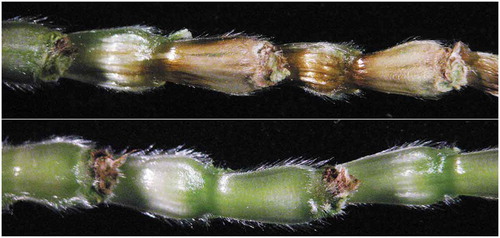
Wheat heads, either mock inoculated with deionized H2O or inoculated with F. graminearum at anthesis, were monitored visually until harvest at 7 dpi. For both genotypes (CS and CS-7EL), the level of visible FHB infection was similar up to 4 dpi, with browning of a few florets, while most remained green (data not shown). However, by 5 dpi most of the florets of F. graminearum-inoculated CS had turned brown, while the small number of brown florets observed in CS-7EL at 4 dpi was unchanged. This is consistent with the observations of Wang et al. (Citation2010), and confirms the FHB resistance conferred by the chromosome fragment from Th. elongatum carried by CS-7EL. Furthermore, although the mock control heads were larger and heavier in CS than CS-7EL, inoculated heads of CS were notably lighter at 7 dpi due to impaired development. The mean wet weight of mock-inoculated wheat heads at 7 dpi was significantly higher for CS (2.02 ± 0.21 g) than for CS-7EL treatments (1.47 ± 0.09 g), while the wet weight of Fusarium-inoculated heads of CS (1.27 ± 0.33 g) was significantly diminished compared with CS-H2O heads (P < 0.001). In contrast, the wet weight of Fusarium-inoculated heads of CS-7EL (1.33 ± 0.12 g) was statistically similar to the mock inoculated heads (P < 0.001). Siranidou et al. (Citation2002) observed that lighter heads in a range of wheat varieties with differing susceptibilities correlated with the severity of FHB in the spikes. Removal of the florets showed that the rachises of F. graminearum-inoculated CS (CS-Fg) were brown and discoloured indicating spread of the fungus as well as loss of photosynthetic activity, while those of CS-7EL-Fg were predominantly green and healthy (). Some brown tissue was observed at the nodes where the florets had been removed in CS-7EL-Fg. Our previous studies indicated that brown deposits in the node of the resistant wheats ‘Sumai 3' (Miller et al. Citation2004) and CS-7EL (Miller et al. Citation2011) are a component of FHB resistance in wheat, preventing spread of the fungus into the rachis from the infected floret.
Fig. 1 (Colour online) Rachises of Fusarium-inoculated ‘Chinese Spring’ (upper) and ‘Chinese Spring’ addition line CS-7EL (lower) with florets removed, 7 dpi.
Gravimetric analysis
Freeze-dried rachises were sequentially extracted to yield three fractions: a hot water extract, a lignin extract, and a residue of holocellulose (cellulose and hemicellulose). Analysis of variance (ANOVA) showed that for all three fractions, with the exception of the hot water extracts in both mock and Fusarium-inoculated CS-7EL, the differences between treatments were significant (). The hot water extract, which represents free and soluble compounds in the rachis, was similar for the mock controls of both varieties, and was unchanged at 7 dpi for CS-7EL-Fg (). However, in CS, the proportion of hot water extract was significantly higher (P < 0.0001) after infection. This was likely caused by degradation of some of the insoluble components of the walls by the fungus in the susceptible variety (CS), releasing them into the soluble fraction. A number of studies have reported the importance of cell wall-degrading enzymes during FHB infection of wheat (Cooper et al. Citation1988; Wanjiru et al. Citation2002; Hatsch et al. Citation2006; Kikot et al. Citation2009). Such enzymes can serve the dual purposes of facilitating fungal penetration and releasing a source of nutrition for the fungus.
Table 1. One-way ANOVA results for the three fractions generated by gravimetric analysis of rachises of mock- and Fusarium-inoculated ‘Chinese Spring’ and ‘Chinese Spring’ addition line CS-7EL.
Table 2. Gravimetric fractionation of wheat rachis samples at 7 dpi. Values represent the mean of four replications ± SE. CS-H2O, mock-inoculated ‘Chinese Spring’ (CS); CS-Fg, Fusarium-inoculated CS; CS-7EL-H2O, mock-inoculated ‘Chinese Spring’ addition line CS-7EL; CS-7EL-Fg, Fusarium-inoculated CS-7EL.
Lignin is a polymerized network of cinnamyl alcohols in plant cell walls that forms an interpenetrating network with the hemicelluloses surrounding the cellulose microfibrils (Vance et al. Citation1980; Vermerris and Nicholson Citation2008). Several studies suggest that in addition to strengthening the plant cell wall, polymeric lignin plays a role in defence against pests and pathogens by hardening the cell wall and creating a physical barrier (Southerton and Deverall Citation1990; Dushnicky et al. Citation1998; Vermerris and Nicholson Citation2008). Our findings are consistent with this hypothesis. The CS-7EL-Fg rachises showed a significant (P < 0.001) increase in lignin content compared with the mock-inoculated control, while the lignin content for CS, which was initially higher than that of CS-7E, was essentially unchanged after infection. Lignin is a preformed defence compound, and the pathogen must come into contact with it during the attempted infection (Vermerris and Nicholson Citation2008). The chemical complexity of lignin makes it refractory for enzymatic hydrolysis, and most pests and pathogens do not possess the necessary enzymes for lignin depolymerization or degradation (Vance et al. Citation1980). Our results are consistent with the data of Kang and Buchenauer (Citation2000b), and Siranidou et al. (Citation2002) who also reported an increase in lignification after infection in resistant wheat varieties. Using immunohistochemistry, they demonstrated a significant increase in the density of lignin labelling in the cell walls of resistant wheat varieties compared with a susceptible variety after infection with F. culmorum. In addition to cell wall fortification, the increased lignin observed in the rachis of CS-7EL-Fg may also be an indicator of the composition of the vascular occlusions previously observed in microscopic studies of this genotype (Miller et al. Citation2004, Citation2011). Lionetti et al. (Citation2015) examined the cell wall lignin content and composition of wheat spikes from a durum wheat highly susceptible to FHB and a highly resistant wheat derived from the Chinese variety ‘Sumai 3'. They reported that the composition rather than the content of lignin was different for those varieties; the monolignol composition suggested that a higher ratio of syringyl/guaiacyl monolignols was associated with higher resistance to FHB.
The residue remaining after hot water and lignin extraction is holocellulose, which includes both cellulose and hemicellulose. In all samples, the holocellulose comprised the largest fraction (57–65%, ). This is consistent with the data of Harper and Lynch (Citation1981) for the combined cellulose and hemicellulose fractions of wheat straw, which can be considered the closest tissue to wheat rachis in terms of compositional profile. Similar values were also reported by Summerell and Burgess (Citation1989), and Lawther et al. (Citation1995); 68.5% holocellulose for wheat straw, and 70% combined cellulose and hemicellulose, respectively. The amount of holocellulose in the mock-inoculated rachises of CS-H2O was significantly lower than in CS-7EL-H2O, although the amount dropped by a similar proportion (6–7%) in both varieties after infection with F. graminearum (). The lowest holocellulose content (57%) was observed in CS-Fg, consistent with a degradation of structural polysaccharides by the fungus. The drop in holocellulose content was accompanied by a proportional increase in hot water extractables in CS-Fg, and of lignin in CS-7EL. These results suggest cell wall degradation in CS, and that CS-7EL had somewhat stronger walls initially, with further wall fortification in response to fungal infection.
Carbohydrate analysis
Prior to anthesis, the major reserve carbohydrates of most cereals are a mixture of monosaccharides, sucrose and fructans (Pollock and Cairns Citation1991), which are readily extracted in hot water. Removal of lignin from the remaining insoluble cell wall material leaves holocellulose, a mixture of cellulose and hemicelluloses that make up the polysaccharide matrix of the cell wall. In the cell walls of the grasses, the main hemicelluloses are xylan and glucuronoarabinoxylan (Hatfield et al. Citation2017). To determine the content of soluble sugars and polysaccharides in the cell walls of the rachis, the sugar profiles of the hot water extracts and the acid hydrolysed holocellulose fractions of all four treatments were analysed using HPLC (, Supplementary Table 1). Pectins are cell wall polysaccharides characterized by their high content of galacturonic acid (Albersheim et al. Citation2010). Although the pectin content in the cell walls of grasses is typically very low (Lawther et al. Citation1995; Ishii Citation1997), reports have suggested that polygalacturonase is a factor in the infection process of FHB (Kang and Buchenauer Citation2000a; Wanjiru et al. Citation2002). For this reason, the content of uronic acids in the hot water extracts and holocellulose fractions was also determined using a commercially available kit ().
Table 3. Uronic acids and total phenolic content in the rachis of mock- and F. graminearum-inoculated heads of CS and CS-7EL. Phenolic content is reported as gallic acid equivalents (GAeq). CS-H2O, mock-inoculated CS; CS-Fg, Fusarium-inoculated CS; CS-7EL-H2O, mock-inoculated CS-7EL; CS-7EL-Fg, Fusarium-inoculated CS-7EL.
Fig. 2 (a) Free sugar profile of hot water fraction of wheat rachis, (b) Sugar composition of holocellulose fraction of wheat rachis samples. Values are means of four biological replications, error bars are SE, and * represents the significant differences for that series (* P < 0.05, ** P < 0.001, *** P < 0.0001). CS-H2O, mock-inoculated ‘Chinese Spring’ (CS); CS-Fg, Fusarium-inoculated CS; CS-7EL-H2O, mock-inoculated ‘Chinese Spring’ addition line CS-7EL; CS-7EL-Fg, Fusarium-inoculated CS-7EL.
The total sugar content in the hot water extracts of both genotypes increased in fungal-inoculated rachises compared with the mock-inoculated rachises, but the trend was not significant (, Supplementary Table 1). The hot water fraction in all four treatments contained sucrose, glucose and fructose as well as an unknown sugar, and sucrose was the dominant free sugar. Sucrose decreased significantly in CS-Fg compared with the mock control, but not in CS-7EL-Fg at 4 dpi in a previous study (Hadinezhad et al. Citation2016). However, at 7 dpi, the sucrose content in Fusarium-inoculated CS rachises was not significantly different from the mock-inoculated ones. In contrast, the sucrose content increased at 7 dpi in Fusarium-inoculated rachises of CS-7EL (, Supplementary Table 1). Guenther et al. (Citation2009) reported that the concentration of sucrose decreased over 17 days in F. graminearum infected stems in their study, with no transient fluctuations noted. Sucrose is the major transport sugar generated by photosynthesis in plants, and the stem (which includes the rachis) is considered a storage tissue for sucrose and fructan in the grasses (Takahashi et al. Citation2001). This can be seen in the high sucrose contents observed in the rachis of mock-inoculated plants. Loss of photosynthetic activity in infected tissues of CS-Fg is reflected in the browning and loss of chlorophyll observed in the rachis (), and the decrease in sucrose content observed at 4 dpi (Hadinezhad et al. Citation2016). Fungal consumption may also have contributed to the decrease in the susceptible variety, as sucrose has been shown to be a preferred substrate of F. graminearum (Guenther et al. Citation2009). The subsequent increase in sucrose concentration at 7 dpi suggests that the plant is attempting to compensate for the loss of sucrose by increasing transport to the infected tissue, as has been observed in U. maydis infection in maize (Horst et al. Citation2008).
Fructan is stored in the wheat stem in addition to sucrose; both provide nutrients during grain filling (Pollock and Cairns Citation1991; Takahashi et al. Citation2001). Although fructan is not a preferred substrate for mycelial growth and mycotoxin production by F. graminearum (Jiao et al. Citation2008), our data indicate fructan degradation after infection in the rachis of both genotypes. The soluble fructose in both genotypes increased significantly after FHB infection ((, Supplementary Table 1), and the increase was greater (68%) in CS than in CS-7EL (45%). This is consistent with the data of Guenther et al. (Citation2009), who noted that the fructose content of infected stem tissues was almost two-fold higher than that of controls. The corresponding decrease in fructose content after infection in the holocellulose fraction (i.e. insoluble fructan) was also higher for CS (11%) compared with CS-7EL (6%; , Supplementary Table 1).
Although soluble glucose increased after infection in both genotypes at 7 dpi (, Supplementary Table 1), the holocellulose data suggest different sources of this response in CS vs CS-7EL (, Supplementary Table 1). The small decrease in insoluble glucose (cellulose) in CS-7EL-Fg suggests that the increase in soluble glucose does not arise from cell wall degradation, but is from the normal post-anthesis sugar transport to the wheat head to support the developing kernels. In contrast, the larger decrease in glucose in the CS-Fg holocellulose fraction suggests that the increase in soluble glucose after infection is a result of cell wall degradation. This is consistent with the gravimetric results (), which show a significant increase in the hot water soluble fraction at the expense of holocellulose in CS-Fg.
Guenther et al. (Citation2009) examined the uptake of simple sugars by F. graminearum in liquid culture and reported that sucrose uptake increased significantly by 8–24 h after addition, while fructose and glucose uptake showed significant increases in uptake only after 72 and 96 h, respectively, suggesting that sucrose is the preferred carbon source. Jiao et al. (Citation2008) also studied the effect of different carbon sources on F. graminearum in liquid culture, and reported that glucose and fructose supported fungal growth but not trichothecene production, while sucrose supported both.
The unknown sugar peak, which was observed between the glucose and sucrose peaks in the HPLC chromatograms, did not match any of the available sugar standards. The glucose standard curve equation was used to calculate the content of unknown sugar. It was significantly lower in infected rachises of both genotypes, but the decrease was proportionally greater in CS-Fg than in CS-7EL-Fg. High resolution mass spectrometry analysis confirmed that the molecular mass of the compound is 234.1580 and the matching formula is C10H22O4N2. Based on the MS/MS fragmentation and comparison with sugar standards, the molecular structure for the unknown sugar was predicted to be a derivative of glucosamine. Further investigation is necessary to elucidate the exact structure and possible role of this sugar in plant response to Fusarium infection.
The uronic acid content of hot water fractions and acid hydrolysates of the holocellulose fractions are presented in . In both genotypes, the amount of soluble uronic acids present increased after infection, reaching borderline significance, suggesting some degradation of pectin. Pectin is a polysaccharide composed primarily of galacturonic acid and is very low in cell walls of the grasses (Lawther et al. Citation1995; Ishii Citation1997). In the rachis, pectin is found primarily in the middle lamella of the xylem vessels and sieve tubes of the vascular tissue (Kang and Buchenauer Citation2000a). Previous studies have suggested that pectin degrading enzymes are among the first to be secreted during FHB infection (Kang and Buchenauer Citation2000a; Wanjiru et al. Citation2002), potentially facilitating access to the wall by other cell wall hydrolases. More recently, Harris et al. (Citation2016) reported an increase in expression of an endopolygalacturonase gene in F. graminearum as early as one day after inoculation on wheat heads. However, the uronic acid content of the holocellulose fraction, which was approximately three-fold greater than that of the soluble fraction, was unchanged between treatments. The increase in soluble uronic acids may be related to the release of glucuronic acid from glucuronoarabinoxylans, as arabinoxylans are also degraded during fungal infection, particularly in the susceptible CS (, Supplementary Table 1, and Wanjiru et al. (Citation2002)).
Analysis of phenolics
Phenolics are a group of secondary metabolites found throughout the plant kingdom, characterized by the presence of an aromatic ring with one or more hydroxyl or acidic hydroxyl groups attached. The functionality of phenolics is diverse, as they are key components of plant structure and responses to biotic and abiotic stresses (Bhattacharya et al. Citation2010).
The phenolic constituents of the rachis were separated into three fractions. Soluble phenolics were extracted using 80% methanol, then further fractionated into free and conjugated phenolics. The remaining solid material was then subjected to alkaline hydrolysis to release bound phenolics (Kim et al. Citation2006). The phenolic acid profiles of all three fractions were analysed by HPLC (–, Supplementary Table 2). The percentage of total phenolics in the bound fraction for all samples ranged from 83–93%. The conjugated fraction contained 5–12%, and the free fraction contained 2–5% of total phenolics. A similar distribution of phenolics in bound, conjugated and free fractions (84%, 13% and 3%, respectively) was previously reported for wheat flour (Sosulski et al. Citation1982).
Fig. 3 HPLC composition of bound phenolics fraction. Values are mean of four replications, error bars are SE, and * represents significant differences for that series (*, P < 0.05; **, P < 0.01). CFA, caffeic acid; VAN, vanillin; PCA, p-coumaric acid; TFA, t-ferulic acid. CS-H2O, mock-inoculated ‘Chinese Spring’ (CS); CS-Fg, Fusarium-inoculated CS; CS-7EL-H2O, mock-inoculated ‘Chinese Spring’ addition line CS-7EL; CS-7EL-Fg, Fusarium-inoculated CS-7EL.
Fig. 4 HPLC composition of free phenolics fraction. Values are mean of four replications, error bars are SE, and * represents significant differences for that series (**, P < 0.01; ***, P < 0.001). CFA, caffeic acid; VAN, vanillin; PCA, p-coumaric acid; TFA, t-ferulic acid; TCA, t-cinnamic acid. CS-H2O, mock-inoculated ‘Chinese Spring’ (CS); CS-Fg, Fusarium-inoculated CS; CS-7EL-H2O, mock-inoculated ‘Chinese Spring’ addition line CS-7EL; CS-7EL-Fg, Fusarium-inoculated CS-7EL.
Fig. 5 HPLC composition of conjugated phenolics fraction. Values are mean of four replications, error bars are SE, and * represents significant differences for that series (*, P < 0.05; **, P < 0.01; ***, P < 0.001). PHB, p-hydroxybenzoic acid; VNA, vanillic acid; SYG, syringic acid; VAN, vanillin; PCA, p-coumaric acid; TFA, t-ferulic acid; TCA, t-cinnamic acid. CS-H2O, mock-inoculated ‘Chinese Spring’ (CS); CS-Fg, Fusarium-inoculated CS; CS-7EL-H2O, mock-inoculated ‘Chinese Spring’ addition line CS-7EL; CS-7EL-Fg, Fusarium-inoculated CS-7EL.
Four main phenolics were detected in the bound fraction of all samples with p-coumaric acid (PCA) present in the highest quantities, followed by trans-ferulic acid (TFA) and caffeic acid (CFA), and vanillin (VAN) (). The ratio of PCA to TFA ranged from 1.42–1.89 in the rachis samples, indicating that p-coumaric acid is the predominant phenolic acid in wheat maternal tissues (such as rachis, straw and glumes). Our findings are consistent with the ratio of 1.26 reported by Zhang et al. (Citation2007) for wheat straw, and the ratio of 1.25 reported by Siranidou et al. (Citation2002) for wheat glumes. In contrast, numerous reports indicate that TFA is the predominant phenolic acid in wheat grain tissues (McKeehen et al. Citation1999; Adom et al. Citation2003; Kim et al. Citation2006; Li et al. Citation2008; Verma et al. Citation2009; Liu et al. Citation2010). The amounts of bound PCA and TFA in the rachis decreased at 7 dpi for both wheat varieties, reflecting increases seen in the soluble fraction, although the magnitude of the differences does not account for the amounts detected ( and , Supplementary Table 2). In addition to the four main phenolic acids detected, four small peaks which eluted after TFA were observed (data not shown). Based on UV spectra (compared with the literature (Waldron et al. Citation1996)) and mass confirmation using LC-MS, those peaks were assigned as cis-ferulic acid, 8,5ʹ-diferulic acid, 8–0-4ʹ-diferulic acid and 8,5ʹ-diferulic acid (benzofuran form). Their peak areas decreased slightly after Fusarium infection for both genotypes. This is consistent with the data of Bily et al. (Citation2003), who reported significant negative correlations between diferulic acid content of maize grain pericarp and aleurone layers and Fusarium graminearum disease severity.
Similar to what was detected in the bound fraction, PCA and TFA were predominant in the free fraction (, Supplementary Table 2). Vanillin, which was present in very small amounts, disappeared at 7 dpi in CS-Fg, but not in CS-7EL-Fg. We found that PCA was present in greater quantities than TFA in the free fraction of all line by treatment combinations, and both significantly increased in the FHB infected treatment. The increases in free PCA and TFA were consistent with the decreases in these phenolic acids observed in the bound fraction, although the relative amounts of increase/decrease were not proportional. A small number of unidentified compounds that eluted with the phenolic acids were observed to decrease after infection in both genotypes. Examination of the UV spectra suggested that these compounds were derivatives of PCA and TFA. Additionally, several peaks for flavonoids were observed in the free phenolic fractions. These were identified by spectral comparison with standards and retention times, and the results are presented as a total in and Supplementary Table 2. Total flavonoid concentration disappeared from the free fraction of Fusarium-inoculated CS, while the flavonoid content in the free fraction of CS-7EL-Fg was not significantly different from the mock-inoculated heads. Flavonoids consist of a broad category of compounds. Among the multiple functions reported for flavonoids in plants, they are considered to be constitutive antifungal compounds (Ibrahim Citation2007). The loss of these compounds in CS after infection may be a factor in the susceptibility of this variety to FHB.
Conjugated (esterified) phenolics have often been omitted in investigations of the phenolic profiles of cereal tissues/grains. However, our results suggest that the extra effort required to fractionate and analyse this fraction is worthwhile. Among all three fractions, the conjugated phenolics showed the greatest changes in a small group of phenolic acids following inoculation. As in the free and bound fractions, PCA was predominant in the conjugated fraction of mock-inoculated heads of both varieties, followed by TFA (, Supplementary Table 2). With the exception of vanillic and syringic acids, all of the phenolic acids detected in the conjugated fraction were increased in the CS-Fg treatment compared with the CS-H2O treatment, although not all increases were significant. Large increases were seen in p-hydroxybenzoic and TFA in the FHB treatment for CS. These acids also showed increases in CS-7EL-Fg, but were proportionally much smaller. The trend after Fusarium inoculation was different between CS and CS-7EL for PCA, which increased slightly in CS-Fg, and decreased slightly in CS-7EL-Fg, although the differences did not reach significance.
Both PCA and TFA have been reported to inhibit the growth of Fusarium spp. in vivo (McKeehen et al. Citation1999; Boutigny et al. Citation2010), and it has been suggested that this may be related to their lipophilicity (Ponts et al. Citation2011). In addition, TFA synthesis from anthesis to 20 dpi was associated with resistance to F. graminearum in developing kernels of wheat varieties (McKeehen et al. Citation1999). The increase of free and conjugated phenolic acids in the soluble fraction may indicate a defensive effort on the part of the plant, in releasing inhibitory compounds at the site of the infection and/or liberation of these compounds from the cell wall by fungal enzymes.
In addition to HPLC analysis, the total phenolic content (TPC) of the soluble, conjugated and bound fractions was determined colorimetrically and reported as milligrams gallic acid equivalents per gram of rachis (mg GAeq g−1, ). The overall trend observed for TPC was similar to the trend found by HPLC for both genotypes, with phenolic content increasing after infection in the free and conjugated fractions and decreasing in the bound fraction. As noted in the HPLC analyses, in all four treatments, the largest fraction was the bound phenolics (5.6–7.3 mg GAeq g−1). The TPC in the free and conjugated fractions were much smaller (1.1–1.9, and 0.3–0.5 mg GAeq g−1, respectively), and the relative amounts were reversed in comparison to the HPLC data. It bears noting here that the colorimetric assay reacts with a broader variety of compounds than just phenolic acids (Everette et al. Citation2010), and the initial extraction of soluble phenolics with 80% methanol is by no means specific for just phenolic acids, but will extract a variety of Folin-reactive compounds from the rachis that are not detected in the HPLC protocol used.
The TPC values in both the free and conjugated fractions in the mock-inoculated rachises were similar for both wheat genotypes, and increased following infection with F. graminearum (). In the free phenolic fractions, the increase in CS-Fg was proportionally greater (49%) than that observed in CS-7EL-Fg (39%). In contrast, no significant differences in free phenolic content between inoculated and control spikes were observed by Siranidou et al. (Citation2002). This may be related to the use of a different FHB causative agent (F. culmorum), and/or to the specific (and unrelated genetically, unlike CS and CS-7EL) wheat lines used in their experiments. In the conjugated phenolic fraction, the increase was significant for CS-Fg (69%), but not for CS-7EL-Fg (37%), suggesting possible greater turnover of cell wall oligomers in CS-Fg. Like the soluble fractions, the amount of bound phenolics in the mock-inoculated rachis was similar for both varieties. However, after F. graminearum inoculation, the content of bound phenolics decreased 7% for CS-Fg, and 22% for CS-7EL-Fg, although the decreases did not reach significance for these samples.
Biplot analysis
A biplot constructed from all treatments and measured parameters is presented in . Biplots are designed for dimension reduction, with the principal components representing hypothetical variables that allow visualization of the maximum variation in the data (Yan Citation2014). Principal components 1 and 2 combined accounted for 91.1% of variation among treatments/traits. The biplot is useful to provide an overview of associations among treatments and chemical compositions in the data. In biplot analysis, the cosine of the angle between the vectors of two traits represents the approximate Pearson correlation between them. Thus, an acute angle suggests a positive correlation, and an obtuse angle indicates a negative correlation between traits, while a right angle (90°) indicates they are not related.
Fig. 6 (Colour online) Genotype by treatment biplot based on singular value decomposition of trait-standardized data (‘Scaling = 1, Centring = 2’) and trait-focused singular value partition (‘SVP = 2’). The relative dimensional scale along the right side allows identification of components that are printed too closely to be distinguished on the biplot. F-VAN, free vanillin; F-PCA, free p-coumaric acid; F-TFA, free t-ferulic acid; F-flavonoids, free flavonoids; C-PHB, conjugated p-hydroxybenzoic acid; C-VNA, conjugated vanillic acid; C-SYG, conjugated syringic acid; C-VAN, conjugated vanillin; C-PCA, conjugated p-coumaric acid; C-TFA, conjugated t-ferulic acid; C-total, total conjugated phenolics; B-VAN, bound vanillin; B-PCA, bound p-coumaric acid; B-TFA, bound t-ferulic acid; B-total, total bound phenolics; F-Fruc, free fructose; F-Gluc, free glucose; F-Suc, free sucrose; F-Unknown, unknown free sugar; F-Total, total free sugars; P-Xyl, insoluble (arabinoxylan) xylose; P-Ara, insoluble (arabinoxylan) arabinose; P-Fruc, insoluble (fructan) fructose; P-Gluc, insoluble glucose (cellulose). CSH, mock-inoculated ‘Chinese Spring’ (CS); CSF, Fusarium-inoculated CS; CS7EH, mock-inoculated ‘Chinese Spring’ addition line CS-7EL; CS-7EF, Fusarium-inoculated CS-7EL.
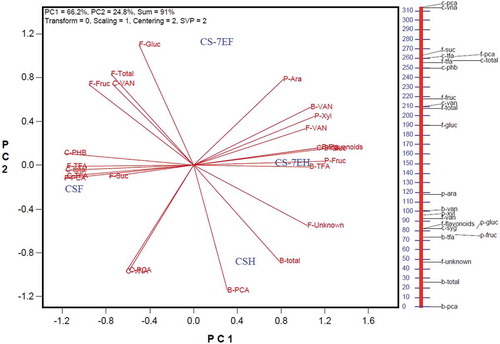
Free PCA, free and conjugated TFA, conjugated p-hydroxybenzoic acid, total conjugated phenolics, and free sucrose were all positively correlated, and the CS-Fg treatment had the highest content of those traits. In contrast, the CS-Fg treatment had the lowest contents of free flavonoids, conjugated syringic acid, bound TFA, and bound (polysaccharide) fructose and glucose, which were also positively correlated. The low amount of TFA in bound, and high content in the free and conjugated fractions of CS-Fg compared with other treatments, is suggestive of cell wall degradation. Specifically, cleavage of arabinoxylans and release of associated TFA which was recovered in the free and conjugated fractions.
The CS-7EL-Fg treatment had the highest amount of soluble glucose as well as bound (polysaccharide) arabinose. As suggested earlier, the increase in soluble glucose likely represents sugar transport to the developing wheat head in support of kernel growth. The higher amount of arabinose in the holocellulose fraction supports a theory of cell wall fortification via increase in the lignin- (branched) arabinoxylan matrix in CS-7EL-Fg in response to Fusarium infection.
In summary, there are clear compositional changes in the rachis of wheat after inoculation with F. graminearum, and the response differs in the susceptible CS genotype compared with the resistant CS-7EL genotype. The responses detected using different extraction chemistries for total phenolics and lignin suggest that a specific component of phenylpropanoid metabolism (lignin) contributes to the resistance mechanism of CS-7EL. In gravimetric fractionation, after removal of hot water soluble compounds, the acid chlorite extraction is designed to remove primarily the lignin matrix leaving behind a holocellulose residue, consisting of cellulose and hemicelluloses (which are primarily arabinoxylans in the grasses). The increase in proportion of this fraction in CS-7EL after infection suggests that fortification specifically of the lignin matrix is a component of the resistance expressed in this genotype. Total phenolic content was determined by extraction of soluble phenolics (free and conjugated), followed by an alkaline hydrolysis of the holocellulose residue designed to capture all of the bound phenolic components: those esterified to the cell wall polysaccharides and to lignin as well. Smaller differences were observed between treatments for these compounds, suggesting a lesser contribution to resistance from this component of phenylpropanoid metabolism. In addition, our results indicate cell wall degradation in CS, as evidenced by the increase in the proportion of hot water solubles after infection at the expense of holocellulose.
Supplemental Material
Download MS Word (60.9 KB)Acknowledgements
The financial support of Agriculture and Agri-Food Canada’s Genomics Research & Development Initiative is gratefully acknowledged. The authors also wish to thank K. Upton for managing our plant growth and misting conditions; W. Bekele for statistical analysis using 'R'; W. Yan for biplot analysis; I. Thapa and B.A. Blackwell for Mass Spectrometry of the unknown sugar; and D. Overy and A. Sproule for LC-MS identification of unknown phenolics.
Supplementary material
Supplemental data for this article can be accessed online here.
Additional information
Funding
Related Research Data
References
- Adom KK, Sorrells ME, Liu RH. 2003. Phytochemical profiles and antioxidant activity of wheat varieties. J Agric Food Chem. 51:7825–7834.
- Albersheim P, Darvill A, Roberts K, Sederoff R, Staehelin A. 2010. Plant cell walls. New York: Garland Science, Taloy & Francis Group, LLC.
- Bainy EM, Tosh SM, Corredig M, Poysa V, Woodrow L. 2008. Varietal differences of carbohydrates in defatted soybean flour and soy protein isolate by-products. Carbohydr Polym. 72:664–672.
- Beres BL, Brûlé-Babel AL, Ye Z, Graf RJ, Turkington TK, Harding MW, Kutcher HR, Hooker DC. 2018. Exploring genotype × environment × management synergies to manage fusarium head blight in wheat. Can J Plant Pathol. 40:179–188.
- Bhattacharya A, Sood P, Citovsky V. 2010. The roles of plant phenolics in defence and communication during Agrobacterium and Rhizobium infection. Mol Plant Pathol. 11:705–719.
- Bily AC, Reid LM, Taylor JH, Johnston D, Malouin C, Burt AJ, Bakan B, Regnault-Roger C, Pauls KP, Arnason JT, et al. 2003. Dehydrodimers of ferulic acid in maize grain pericarp and aleurone: resistance factors to Fusarium graminearum. Phytopathology. 93:712–719.
- Boutigny AL, Atanasova-Pénichon V, Benet M, Barreau C, Richard-Forget F. 2010. Natural phenolic acids from wheat bran inhibit Fusarium culmorum trichothecene biosynthesis in vitro by repressing Tri gene expression. Eur J Plant Pathol. 127:275–286.
- Cappellini RA, Peterson JL. 1965. Macroconidium formation in submerged cultures by a non-sporulating strain of Gibberella zeae. Mycologia. 57:962–966.
- Cooper RM, Longman D, Campbell A, Henry M, Lees PE. 1988. Enzymic adaptation of cereal pathogens to the monocotyledonous primary wall. Physiol Mol Plant Pathol. 32:33–47.
- Dushnicky L, Ballance GM, Sumner MJ, MacGregor AW. 1998. The role of lignification as a resistance mechanism in wheat to a toxin-producing isolate of Pyrenophora tritici-repentis. Can J Plant Pathol. 20:35–47.
- Dvorak J. 1980. Homoeology between Agropyron elongatum chromosomes and Triticum aestivum chromosomes. Can J Genet and Cytol. 22:237–259.
- Dvorak J, Knott DR. 1974. Disomic and ditelosomic additions of diploid Agropyron elongatum chromosomes to Triticum aestivum. Can J Genet and Cytol. 16:399–417.
- Everette JD, Bryant QM, Green AM, Abbey YA, Wangila GW, Walker RB. 2010. A thorough study of reactivity of various compound classes towards the Folin-Ciocalteu reagent. J Agric Food Chem. 58:8139–8144.
- Guenther JC, Hallen-Adams HE, Bücking H, Shachar-Hill Y, Trail F. 2009. Triacylglyceride metabolism by Fusarium graminearum during colonization and sexual development on wheat. Mol Plant Microbe Interact. 22:1492–1503.
- Hadinezhad M, Watson EM, Tosh SM, Brummer Y, Miller SS. 2016. Carbohydrate fractionation and profiles in the rachis of wheat varieties susceptible and resistant to Fusarium graminearum. Proceedings of the 8th Canadian Workshop on Fusarium Head Blight; Ottawa, Canada. p. 47.
- Harper SHT, Lynch JM. 1981. The chemical components and decomposition of wheat straw leaves, internodes and nodes. J Sci Food Agric. 32:1057–1062.
- Harris LJ, Balcerzak M, Johnston A, Schneiderman D, Ouellet T. 2016. Host-preferential Fusarium graminearum gene expression during infection of wheat, barley, and maize. Fungal Biol. 120:111–123.
- Hatfield RD, Rancour DM, Marita JM. 2017. Grass cell walls: a story of cross-linking. Front Plant Sci. 18(7):2056.
- Hatsch D, Phalip V, Petkovski E, Jeltsch JM. 2006. Fusarium graminearum on plant cell wall: no fewer than 30 xylanase genes transcribed. Biochem Biophys Res Commun. 345:959–966.
- Hayouni EA, Abedrabba M, Bouix M, Hamdi M. 2007. The effects of solvents and extraction method on the phenolic contents and biological activities in vitro of Tunisian Quercus coccifera L. and Juniperus phoenicea L. fruit extracts. Food Chem. 105:1126–1134.
- Hofstad AN, Nussbaumer T, Akhunov E, Shin S, Kugler KG, Kistler HC, Mayer KFX, Muehlbauer GJ. 2016. Examining the transcriptional response in wheat Fhb1 near-isogenic lines to Fusarium graminearum infection and deoxynivalenol treatment. Plant Genome. 9:15.
- Horst RJ, Engelsdorf T, Sonnewald U, Voll LM. 2008. Infection of maize leaves with Ustilago maydis prevents establishment of C4 photosynthesis. J Plant Physiol. 165:19–28.
- Ibrahim RK. 2007. Flavonoids. In: Roberts K, editor. Handbook of plant science. Chichester (England): Wiley; p. 1044–1049.
- Ishii T. 1997. Structure and functions of feruloylated polysaccharides. Plant Sci. 127:111–127.
- Jiao F, Kawakami A, Nakajima T. 2008. Effects of different carbon sources on trichothecene production and Tri gene expression by Fusarium graminearum in liquid culture. FEMS Microbiol Lett. 285:212–219.
- Kang Z, Buchenauer H. 2000a. Ultrastructural and cytochemical studies on cellulose, xylan and pectin degradation in wheat spikes infected by Fusarium culmorum. J Phytopathol. 148:263–275.
- Kang Z, Buchenauer H. 2000b. Ultrastructural and immunocytochemical investigation of pathogen development and host responses in resistant and susceptible wheat spikes infected by Fusarium culmorum. Physiol Mol Plant Pathol. 57:255–268.
- Kikot GE, Hours RA, Alconada TM. 2009. Contribution of cell wall degrading enzymes to pathogenesis of Fusarium graminearum: a review. J Basic Microbiol. 49:231–241.
- Kim K-H, Tsao R, Yang R, Cui SW. 2006. Phenolic acid profiles and antioxidant activities of wheat bran extracts and the effect of hydrolysis conditions. Food Chem. 95:466–473.
- Lawther JM, Sun R, Banks WB. 1995. Extraction, fractionation, and characterization of structural polysaccharides from wheat straw. J Agric Food Chem. 43:667–675.
- Li L, Shewry PR, Ward JL. 2008. Phenolic acids in wheat varieties in the HEALTHGRAIN diversity screen. J Agric Food Chem. 56:9732–9739.
- Lionetti V, Giancaspro A, Fabri E, Giove SL, Reem N, Zabotina OA, Blanco A, Gadaleta A, Bellincampi D. 2015. Cell wall traits as potential resources to improve resistance of durum wheat against Fusarium graminearum. BMC Plant Biol. 15:1–15.
- Liu Q, Qiu Y, Beta T. 2010. Comparison of antioxidant activities of different colored wheat grains and analysis of phenolic compounds. J Agric Food Chem. 58:9235–9241.
- McKeehen JD, Busch RH, Fulcher RG. 1999. Evaluation of wheat (Triticum aestivum L.) phenolic acids during grain development and their contribution to Fusarium resistance. J Agric Food Chem. 47:1476–1482.
- Miller SS, Chabot DMP, Ouellet T, Harris LJ, Fedak G. 2004. Use of a Fusarium graminearum strain transformed with green fluorescent protein to study infection in wheat (Triticum aestivum). Can J Plant Pathol. 26:453–463.
- Miller SS, Watson EM, Lazebnik J, Gulden S, Balcerzak M, Fedak G, Ouellet T. 2011. Characterization of an alien source of resistance to fusarium head blight transferred to Chinese Spring wheat. Botany. 89:301–311.
- Pollock CJ, Cairns AJ. 1991. Fructan metabolism in grasses and cereals. Annu Rev Plant Physiol Plant Mol Biol. 42:77–101.
- Ponts N, Pinson-Gadais L, Boutigny A-L, Barreau C, Richard-Forget F. 2011. Cinnamic-derived acids significantly affect Fusarium graminearum growth and in vitro synthesis of Type B trichothecenes. Phytopathology. 101:929–934.
- Rudd JC, Horsley RD, McKendry AL, Elias EM. 2001. Host plant resistance genes for fusarium head blight: sources, mechanisms, and utility in conventional breeding systems. Crop Sci. 41:620–627.
- Schroeder HW. 1955. Factors affecting resistance of wheat to scab caused by Gibberella zeae (Schw.) Petch [dissertation]. University of Minnesota.
- Shen X, Kong L, Ohm H. 2004. Fusarium head blight resistance in hexaploid wheat (Triticum aestivum)-Lophopyrum genetic lines and tagging of the alien chromatin by PCR markers. Theor Appl Genet. 108:808–813.
- Shen X, Ohm H. 2006. Fusarium head blight resistance derived from Lophopyrum elongatum chromosome 7E and its augmentation with Fhb1 in wheat. Plant Breed. 125:424–429.
- Siranidou E, Kang Z, Buchenauer H. 2002. Studies on symptom development, phenolic compounds and morphological defence responses in wheat cultivars differing in resistance to Fusarium head blight. J Phytopathol. 150(4):200–208.
- Sosulski F, Krygier K, Hogge L. 1982. Free, esterified, and insoluble-bound phenolic acids. 3. Composition of phenolic acids in cereal and potato flours. J Agric Food Chem. 30:337–340.
- Southerton SG, Deverall BJ. 1990. Histochemical and chemical evidence for lignin accumulation during the expression of resistance to leaf rust fungi in wheat. Physiol Mol Plant Pathol. 36:483–494.
- Summerell BA, Burgess LW. 1989. Decomposition and chemical composition of cereal straw. Soil Biol Biochem. 21:551–559.
- Takahashi T, Chevalier P, Rupp R. 2001. Storage and remobilization of soluble carbohydrates after heading in different plant parts of a winter wheat cultivar. Plant Prod Sci. 4:160–165.
- U. S. Department of Agriculture. 2018. Germplasm resources information network (GRIN-Taxonomy) USDA, Agricultural Research Service, National Plant Germplasm System.
- Vance CP, Kirk TK, Sherwood RT. 1980. Lignification as a mechanism of disease resistance. Annu Rev Phytopathol. 18:259–288.
- Verma B, Hucl P, Chibbar RN. 2009. Phenolic acid composition and antioxidant capacity of acid and alkali hydrolysed wheat bran fractions. Food Chem. 116:947–954.
- Vermerris W, Nicholson RL. 2008. Phenolic compound biochemistry. Dordrecht; London: Springer.
- Waldron KW, Parr AJ, Ng A, Ralph J. 1996. Cell wall esterified phenolic dimers: identification and quantification by reverse phase high performance liquid chromatography and diode array detection. Phytochem Anal. 7:305–312.
- Wang JR, Wang L, Gulden S, Rocheleau H, Balcerzak M, Hattori J, Cao W, Han F, Zheng YL, Fedak G, et al. 2010. RNA profiling of fusarium head blight-resistant wheat addition lines containing the Thinopyrum elongatum chromosome 7E. Can J Plant Pathol. 32:188–214.
- Wanjiru WM, Zhensheng K, Buchenauer H. 2002. Importance of cell wall degrading enzymes produced by Fusarium graminearum during infection of wheat heads. Eur J Plant Pathol. 108:803–810.
- Yan W. 2001. GGEbiplot—A windows application for graphical analysis of multienvironment trial data and other types of two-way data. Agron J. 93:1111–1118.
- Yan W. 2014. Frequently asked questions about biplot analysis. In: Crop variety trials: data management and analysis. West Sussex (UK): Wiley; p. 91–106.
- Zhang H, Meng QX, Zhou ZM, Sun CM, Ren LP. 2007. The profile of alkali-soluble phenolic acids in maize stover, and rice and wheat straws. J Animal Feed Sci. 16:59–63.