
Abstract
Wheat is affected by many fungal diseases that can cause severe yield and quality losses. Disease prediction models generally employ weather data to estimate potential for infection to determine timing for fungicide applications, but these models fail to account for the presence and quantity of pathogen inoculum. This study adapted highly specific qPCR primers to identify and quantify, in real-time, inoculum present in air for the six most important wheat pathogens in Canada. Fungal spores were collected using either Burkard spore collectors and quantified using qPCR or microscope slides covered with adhesive tape and identified and quantified using microscopy. Samples were collected from seven different sites in southern Alberta throughout the 2015–2017 growing seasons. The results demonstrated that qPCR can reliably identify and quantify spores from Puccinia striiformis f. sp. tritici, P. triticina, P. graminis f. sp. tritici, Blumeria graminis f. sp. tritici, Pyrenophora tritici-repentis, and Fusarium graminearum. The limits of detection of DNA for primer pairs in singleplex tests ranged from 0.0001 ng for P. graminis to 0.001 ng for P. tritici-repentis, which corresponded to approximately 3 spores for P. tritici-repentis and F. graminearum and 1 spore for the other pathogens. Conversely, microscopy permitted identification of rusts to the genus but not to the species level and was ineffective in quantification of the remainder of the wheat pathogens. This study will contribute to the development of a fast and reliable forecasting system that will enable identification and quantification of airborne pathogens in real-time before initial disease symptoms appear.
Résumé
Le blé est affecté par plusieurs maladies fongiques pouvant causer des pertes sévères au rendement et à la qualité des grains. Les modèles de prédiction des maladies utilisent généralement des informations météorologiques pour évaluer un potentiel d’infestation afin de déterminer l’utilité d’épandage de fongicides. Toutefois, ces modèles ne tiennent pas compte de la présence et de la quantité d’inoculum des pathogènes. Dans cette étude, nous avons adapté ou développé des amorces hautement spécifiques de qPCR afin d’identifier et de quantifier très rapidement la présence dans l’air d’inoculum de six des plus importants pathogènes du blé au Canada. Les spores de champignons ont été collectées soit par un collecteur de spores de type Burkard et quantifiées par qPCR ou soit en utilisant des lame microscopiques recouvertes de ruban adhésif et identifiées et quantifiées par microscopie optique. Les échantillons collectés proviennent de sept différents sites du sud de l’Alberta durant les saisons de 2015 à 2017. Les résultats obtenus démontrent que la qPCR permet d’identifier et de quantifier de façon très fiable les spores de Puccinia striiformis f. sp. tritici, P. triticina, P. graminis f. sp. tritici, Blumeria graminis f. sp. tritici, Pyrenophora tritici-repentis, et Fusarium graminearum. La limite de détection de l’ADN des champignons en utilisant une paire d’amorces par réaction de PCR se situe entre 0.0001 ng pour P. graminis et 0.001 ng pour P. tritici-repentis ce qui correspond approximativement à 1 spore pour P. striiformis, P. graminis, P. triticina et B. graminis et 3 spores pour P. tritici-repentis et F. graminearum. Vice-versa, la méthode basée sur l’utilisation de la microscopie optique n’a permis que l’identification au niveau du genre pour les trois rouilles du blé, mais pas au niveau de l’espèce et était ineffective pour quantifier les autres espèces de champignons pathogènes. Les résultats de cette études vont permettre le développement d’un système de prédiction fiable presqu’en temps réel pour identifier et quantifier les pathogènes de blé transmis par voie aérienne et cela avant même que des symptômes de maladie soient apparents.
Introduction
The disease triangle concept states that a susceptible host, a virulent pathogen and appropriate environmental conditions are required for disease development (Agrios Citation2005; Scholthof Citation2007). Employing genetic resistance is the most economically and environmentally efficient method to control plant diseases; however, in many crops, genetic resistance is lacking, and producers must rely on fungicides and cultural methods to control diseases (Agrios Citation2005; Bailey et al. Citation2009). The reliance of modern agriculture on fungicides for disease control may not be sustainable due to the negative environmental impact of fungicides and the on-going evolution of pathogen resistance to fungicides (Wilson and Tisdell Citation2001). Thus, management strategies involving an overall reduction in fungicide applications coupled with their judicious use must be considered if their efficacy is to be maintained (Hobbelen et al. Citation2014). It may be possible to eliminate routine application of costly fungicides if pathogens are not present or at very low numbers and environmental conditions are non-conducive for disease development. Accurately assessing the presence and quantity of virulent crop pathogens, in real-time, and integrating this information with weather data into crop-forecasting models that reliably predict risk of yield loss so that control methods such as fungicides can be applied if needed, is technologically feasible (Sankaran et al. Citation2010; Donatelli et al. Citation2017). Ultimately, the goal within the context of sustainable agriculture, should be timely application of fungicides to crops only when there is a known threat by pathogens to crop yield or quality.
Identifying and quantifying virulent pathogens in real-time in the air and within the crop canopy remains challenging particularly for rusts and other pathogens that can travel long distances in air currents and are deposited on crops in ‘spore showers’ (Agrios Citation2005; Chen Citation2005). Because of the latency period between infection and expression of symptoms and signs of the pathogen (Agrios Citation2005; Chen Citation2005), monitoring for airborne pathogen propagules prior to the development of damaging symptoms during the crop season is requisite to responding effectively to the threat to crops posed by individual pathogens. Current disease monitoring methods mostly rely on the presence of visual symptoms or pathogen signs on crops (Agrios Citation2005; Bailey et al. Citation2009). Methods to monitor pathogen propagule numbers in the field include passive and active sampling. Passive sampling frequently uses sticky adhesive materials such as gelatine or sticky tape mounted on microscope slides or Petri dishes that are placed in or near field areas to capture airborne propagules (Alcázar and Comtois Citation1999; Isard et al. Citation2011). Active sampling employs instruments that extract propagules from predetermined volumes of air over a specified time (Sterling et al. Citation1999; Núñez et al. Citation2017). Once trapped, propagules must be identified and quantified. Microscopic identification methods are time consuming and may be inaccurate depending on the propagule numbers and condition and distinctiveness of the pathogen propagules. Conversely, molecular techniques are rapid, sensitive, highly accurate, becoming more cost-effective and the current focus of strategies to forecast diseases and protect crops (Khan et al. Citation2005; Friesen et al. Citation2006; Tsui et al. Citation2011; Randhawa et al. Citation2013; Cao et al. Citation2016). These techniques frequently employ methods such as real-time PCR (qPCR) assays, DNA sequencing, and multiplex PCR assays (Cao et al. Citation2016; Núñez et al. Citation2017). Effective molecular approaches to monitoring wheat fungal pathogens require methods for extraction of nucleic acids through adequate cell disruption and efficient DNA extraction (Gao et al. Citation2004; Tsui et al. Citation2011) and design of highly specific primers and/or probes and their optimization (Reischer et al. Citation2004; Nicolaisen et al. Citation2009; Cao et al. Citation2016). Pathogen-specific primers for PCR-based assays often target pathogen ITS (Internal Transcribed Spacers) rDNA regions whose variability permits differentiation among sub-genera but generally not among closely related species. Therefore, the design of more specific assays targeting unique genes, such as pathogen virulence and/or toxin genes, has been suggested (Nicolaisen et al. Citation2009).
A variety of pathogens infect wheat (Triticum aestivum L. and T. turgidum L. ssp. durum (Desf.) Husn.) crops worldwide. In western Canada, where approximately 10 million ha are seeded annually to wheat, the most important diseases are stripe rust (Puccinia striiformis Westend. f. sp. tritici Erikss., (Pst)), leaf rust (Puccinia triticina Erikss., (Pt)), stem rust (Puccinia graminis Pers. f. sp. tritici Erikss. & Henning (Pgt)), powdery mildew (Blumeria graminis (DC.) Speer f. sp. tritici Em. Marchal (Bgt)), tan spot (Pyrenophora tritici-repentis (Died.) Drechs. (Ptr)), and Fusarium head blight (FHB) caused predominantly by Fusarium graminearum (Schwein) Petch. (Fg) (Bailey et al. Citation2009). Under optimum conditions, these pathogens are capable of causing severe losses up to 50–100% in wheat (Sykes and Bernier Citation1991; Waalwijk et al. Citation2004; Chen Citation2005; Bailey et al. Citation2009; McMullen and Adhikari Citation2009; FAO Citation2010; Fernandez et al. Citation2010, Citation2016; Huerta-Espino et al. Citation2011; Marone et al. Citation2013; Tittlemier et al. Citation2013; Abdullah et al. Citation2017).
The impact of stripe rust is greatest in the western Prairies, where higher elevation and cooler environmental conditions prevail (Chen Citation2005; Gaudet et al. Citation2015, Citation2016; Xi et al. Citation2015), whereas the threat of leaf rust and stem rust is greatest in the eastern Prairies where warmer and more humid conditions prevail during the growing season (Eversmeyer and Kramer Citation2000; McCallum et al. Citation2007; Aboukhaddour Citation2017). Rusts are wind dispersed primarily by asexual urediniospores that are capable of moving long distances within and even between continents (Wegulo and Byamukama Citation2012; Chen et al. Citation2014). On the North American continent, leaf rust and stem rust are primarily dispersed throughout the Great Plains via the ‘Puccinia Pathway’ (Eversmeyer and Kramer Citation2000; McCallum et al. Citation2007). Stripe rust tended to be restricted to the Rocky Mountain regions and infected wheat in the Pacific Northwest USA and southern Alberta (Chen Citation2005; Gaudet et al. Citation2015, Citation2016) until a high-temperature race emerged in 2000; this new race permitted the spread of stripe rust into the Great Plains (Chen Citation2005). The urediniospore morphologies between the three rusts are similar and are characterized by the presence of germ pores, echinulation, outside hyaline walls, with shapes varying from round to obovoid, and sizes varying from 26 µm to 30 µm × 18 µm to 32 µm (Hiratsuka and Sato Citation1982; Savile Citation1984; Liu and Hambleton Citation2010; Baka and Rabei Citation2013). Spore colour varies among the rust fungi, from yellow to orange for stripe rust, reddish to brown for leaf rust and brown to black for stem rust (Agrios Citation2005; Baka and Rabei Citation2013).
The remainder of the important wheat pathogens are stubble-borne, where they overwinter and produce conidia during the spring and summer. Infection and lesions produced on wheat leaves result in a decrease in photosynthetic capacity followed by yield and quality losses (Agrios Citation2005; Faris et al. Citation2013; Moffat et al. Citation2014). The powdery mildew pathogen is spread on wind currents predominantly via oblong-shaped hyaline conidia (25–40 µm × 8–10 µm in size) that are produced throughout the growing season (Conner et al. Citation2003; Agrios Citation2005; Parks et al. Citation2011; Wicker et al. Citation2013; Bayer Citation2018).
Tan spot (also called yellow spot) is one of the most destructive leaf spot diseases in Canada (Strelkov and Lamari Citation2003; Fernandez et al. Citation2010, Citation2016; Aboukhaddour et al. Citation2013). Ptr produces a combination of three necrotrophic effectors (Ptr ToxA, Ptr ToxB, and Ptr ToxC) which can induce necrosis or chlorosis on susceptible wheat genotypes (Lamari and Strelkov Citation2010). Ptr ToxA is the predominant necrotrophic effector in the Americas, and it was found in 98% of the tested isolates in Alberta (Aboukhaddour et al. Citation2013). The tan spot pathogen overwinters as pseudothecia on wheat stubble, and in early spring the sexual ascospores mature inside the pseudothecia from where they are released to initiate the primary infection. Several cycles of secondary infection may follow initiated by multi-celled asexual spores (conidia) that develop on conidiophores during the growing season (De Wolf et al. Citation1998). Conidia are multinucleate and cylindrical in shape with four to seven septa and vary in size from 117 µm to 217 µm × 15 µm to 18 µm. Ascospores are also multinucleate with three septa, oval to globose shape, brown in colour, and size varies from 48 µm to 58 µm × 18 µm to 24 µm (Benslimane et al. Citation2017). Whether the ascospores alone or both spore types are considered to be the primary inoculum of new infections is still unclear (Morrall and Howard Citation1975; Ciuffetti and Tuori Citation1999).
FHB can be caused by several different facultative saprotrophic Fusarium species, but in western Canada it is predominantly caused by Fg (Gräfenhan et al. Citation2013). In addition to yield losses, Fusarium diseases can cause quality losses due to contamination of grains with toxins (Waalwijk et al. Citation2004; Gautam and Dill-Macky Citation2012; Harris et al. Citation2015). Increased FHB severity and toxin accumulation is correlated with high temperatures and humidity during or just after the anthesis growth stage (Fernando et al. Citation2000; Kikot et al. Citation2011; Gautam and Dill-Macky Citation2012). Fg overwinters and produces ascospores (sexual stage) and conidia (asexual stage) on infected plant debris during the warm and humid weather of spring. Both types of spores may serve as the primary inoculum, and are spread by rain, insects, and wind (Goswami and Kistler Citation2004). Macroconidia produced by Fg are translucent canoe or banana-shaped with five or more septa and a distinctly foot-shaped basal cell and vary in size from 25 µm to 50 µm × 3 µm to 4 µm. Ascospores range from translucent to light brown in colour, are slightly curved with rounded ends, and vary in size from 19 µm to 24 µm × 3 µm to 4 µm (Schmale and Bergstrom Citation2003; Leslie and Summerell Citation2006; Keller et al. Citation2014). It is difficult to distinguish Fg conidia from several Fusarium spp. that commonly occur in cereal fields because of their morphological similarities (Leslie and Summerell Citation2006).
The objectives of this study were to: (a) design or adapt highly pathogen-specific PCR primers available in public databases for a qPCR assay and to assess the efficiency of this assay for detection and quantification of Pst, Pt, Pgt, Bgt, Ptr, and Fg; (b) compare active spore sampling using a Burkard air sampler coupled with qPCR identification and quantification of spores with passive spore trapping (e.g. sticky microscope slide) that employed microscopy for identifying and quantifying spores of Pst, Pt, Pgt, Bgt, Ptr, and Fg; and (c) determine the incidence of airborne Pst, Pt, Pgt, Bgt, Ptr, and Fg fungal spores from air samples taken in wheat fields in southern Alberta during the 2015–2017 crop seasons. These results will contribute to development of forecasting models for wheat diseases that provide the critical information to producers about potential disease outbreaks in western Canada.
Materials and methods
DNA extraction
Methods were optimized by using pure spore preparations from the wheat pathogens Pst and Bgt, obtained from wheat plants grown in growth chambers, Pt and Pgt (courtesy of Dr. H. Randhawa, Lethbridge, Alberta), Ptr (courtesy of Dr. S. Strelkov, Edmonton, Alberta), and Fg (courtesy of Dr. N. Foroud, Lethbridge, Alberta), with the following DNA extraction protocols: alkaline polyethylene glycol (PEG)-based (Chomczynski and Rymaszewski Citation2006); OmniPrep kit (Biosciences); DNeasy PowerSoil kit (QIAGEN); and NaOH solution (modified from Werner et al. Citation2002). For the modified NaOH method samples in 100 µL of 50 mM NaOH were heated at 95°C for 15 min and cooled on ice and neutralized with 10 µL 1 M Tris-HCl, pH 8.0). Pst (LSW3-2012 and SWS9-90), Pt, Pgt and Bgt (uncharacterized isolates) fungal spores were collected from wheat plants reared and inoculated under controlled conditions whereas Ptr (various isolates from races 1 and 2) and Fg (strain GZ3639) were grown on V8-PDA and PDA, respectively. Also, in order to test the ability of the different protocols to isolate DNA in dirty air samples, various simulations using soil, insects, and the six fungal spores were conducted. Following DNA extraction, samples were kept at −20°C until analyzed.
Optimization of pathogen-specific primers
Sets of pathogen-specific primers were designed based on sequences available on public databases and were evaluated using standard PCR with the QIAGEN HotStarTaq Master Mix kit and protocol (2.5 μL DNA template added). Cycle conditions were: 1 cycle at 94°C for 15 min, 35 cycles at 94°C for 1 min, 55 to 65°C for 1 min and 72°C for 1 min followed by a final extension period at 72°C for 10 min after the last cycle. After six PCR primer pairs were selected (one pair for each pathogen) (), they were adapted and/or optimized with DNA samples from the six pathogens. Primer pairs were further evaluated using different qPCR assay approaches for quantitative determination of the pathogens. A minimum of two replicates for each primer set including three technical reps for each sample was conducted.
Table 1. Sequence data and annotation for primer sets selected for standard PCR and qPCR assays for the six wheat pathogens
Singleplex, duplex, and multiplex qPCR analyses and digital droplet PCR (ddPCR) were evaluated for their ability to detect and quantify the six wheat pathogens. PerfeCTa® SYBR® Green SuperMix, Low Rox (QuantaBio) for singleplex and duplex qPCR; and Prime Time® Gene Expression Master Mix probe-based (Integrated DNA Technologies) (TaqMan) for multiplex qPCR were used. QX200™ ddPCR™ EvaGreen Supermix (Bio-Rad Laboratories, Inc.) was used for ddPCR. One probe was designed for each primer set (data not shown).
Samples collected by the spore sampling instruments in the field were analyzed for fungal identification and qPCR quantification using an Applied Biosystems™ QuantStudio™ 6 Flex Real-Time PCR System using the PerfeCTa® SYBR® Green kit and protocol using 2.5 μL of extracted DNA. Cycle conditions were: 1 cycle at 95°C for 3 min, 40 cycles at 94°C for 15 s, 55°C for 30 s, and 72°C for 30 s, with melting curve formation at the end of the run. Analyses of the results that included standard curves, Ct values, melting curves, and other parameters, were conducted using QuantStudio™ Software V1.3. Standard curves to determine the quantity of DNA amplified, using qPCR, employed known spore numbers for each pathogen. These results were used to evaluate the method consistency and to calculate how many spores are needed to obtain 1 ng of DNA for each pathogen. The qPCR results of the air samples (in ng of DNA) were then converted into spore numbers.
Spore trapping in southern Alberta
Of the different commercial spore trapping instruments available, the Burkard 7-days sampler has been shown to be a reliable instrument for sampling airborne spores for DNA-based analyses (Cao et al. Citation2016; Núñez et al. Citation2017). Therefore, the active spore sampling employed in this study used the Burkard Automatic Cyclone Air Sampler (Burkard Manufacturing Co. Ltd., Rickmansworth, Hertfordshire, UK), and air was sampled at a rate of 16.5 L min−1. The Burkard Cyclone One-vial, which samples constantly into one tube until the tube is manually changed, and Burkard Cyclone Multi-vials which permitted programmed sampling into 8 individual tubes, were employed. The samples were collected in 1.5 mL microfuge tubes (Burkard Manufacturing Co. Ltd.). The instruments were placed in or near wheat fields at several locations in southern Alberta (). Instruments were set up on top of a pallet platform and powered by a battery and solar panel. The collection orifice of the spore collector sitting on a pallet was 90 to 100 cm above ground level. The collection orifice was always facing the prevailing wind direction due to the instrument’s wind vane. During the 2015, 2016, and 2017 growing seasons, samples were generally collected at weekly intervals but, in a few instances, samples were collected for more than seven days due to weather or other operational restrictions. Samples were dried using a Savant SpeedVac® SC110 Concentrator and stored at −80°C prior to DNA extraction.
Table 2. Sampling sites in southern Alberta where the Burkard Cyclone instruments and microscope slides were installed during the wheat growing seasons 2015, 2016, and 2017
Passive spore trapping employed double-sided adhesive tape (3M Scotch® Removable Poster Tape, 3/4” (19 mm) wide, clear) applied to a 19 mm × 50 mm area of a microscope slide (25 mm × 75 mm). Slides were attached to the cap of the Burkard Cyclone instrument, just below the collection orifice, and always facing the prevailing wind. The slides were stored in a microscope slide box at room temperature for up to a few days until analyzed using a light microscope.
Microscopic analyses
Slides with adhesive tape were observed, directly without any staining, using a Leica Microsystems DM6000 B brightfield microscope equipped with a DFC310 FX camera. Photos of spores were taken; fungi were identified based on spore shape, size, and colour and quantified using a grid slide underneath (with a defined area of 40 quadrants of 5 mm × 5 mm in size, covering a total area of 20 mm × 50 mm) to facilitate the orientation on the slide while counting the spores.
Temperature and precipitation
Records for temperature, precipitation and growing degree days (above 5°C) for different locations were obtained from the Alberta Agriculture and Forestry web site (https://agriculture.alberta.ca/acis/alberta-weather-data-viewer.jsp).
Statistical analyses
Statistical analyses were performed using SPSS Statistics (IBM Analytics, release 23.0.0.0). Descriptive statistics analyses were conducted on the data. Simple Linear Regression (SLR) was used to analyse the results of air samples. Pearson correlation test was used to evaluate the relationship between spores counted under the microscope and spore quantities detected by qPCR assays. A data clean-up removing zeros (no spores detected) and logarithm base 10 transformations (log10) of spore numbers were used to correct for skewed data (McDonald Citation2014).
Results
Environmental conditions
Total accumulated rainfall (TAR) and growing degree days (GDD) from May 1 to September 1 for the Weather Station location were 100 mm and 1450 GDD in 2015; 212 mm and 1400 GDD in 2016; 133 mm and 1600 GDD in 2017 whereas the long-term averages of TAR and GDD for the site were 208 mm and 1300 GDD. These results showed that the 2015 and 2017 growing seasons were warmer and dryer than the long-term averages whereas 2016 was warmer but similar to the long-term averages for precipitation. Similar trends were observed for Magrath and Enchant in 2016 and 2017 (data not shown).
Sampling and identification of fungal pathogens
Results of passive sampling employing microscopic identification and quantification of fungal spores demonstrated that rusts and other pathogens were more abundant in 2015 than in 2016 and 2017 at the Weather Station site (). Rust urediniospores of Pst, Pgt and Pt are nearly morphologically identical (Agrios Citation2005; Bailey et al. Citation2009) and it was not possible to accurately distinguish them microscopically. Rust distribution was similar between the Field Pathology Building and Weather Station sites in 2015 (). Similarly, Fg macroconidia were generally indistinguishable on slides from those of other Fusarium spp. so all canoe-shaped macroconidia were grouped together. Collectively, the rusts were the most abundant in all years followed by Bgt and Ptr. Similar trends were observed for the other site/years, whereas Fusarium spp. were infrequently observed in all of the site/years.
Fig. 1 Weekly numbers of fungal spores collected using passive spore collection and identified and enumerated using a compound microscope. Samples were collected at the Weather Station, Lethbridge, AB, during the wheat growing seasons 2015 (a), 2016 (b), 2017 (c), and at the Field Pathology Building, Lethbridge, in 2015 (d). The collection dates mark the beginning of the sampling week
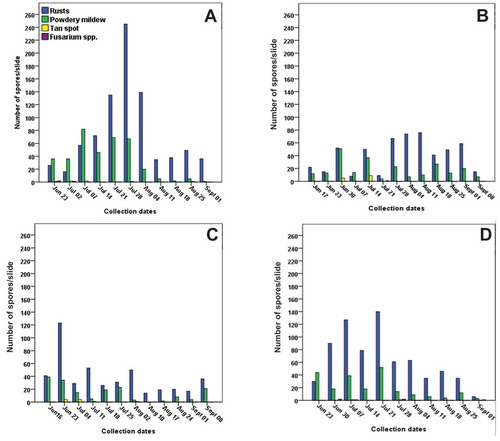
Fig. 2 Relationship between log number of spores used to generate standard curves and Ct values in qPCR assays for identification and quantification of: (a) Puccinia striiformis f. sp. tritici (Pst), (b) Puccinia triticina (Pt), (c) Puccinia graminis f. sp. tritici (Pgt), (d) Blumeria graminis f. sp. tritici (Bgt), (e) Pyrenophora tritici-repentis (Ptr), and (f) Fusarium graminearum (Fg). Overlapping data points are represented with symbols with a darker outline (in some cases, more than two data points were overlapping)
Of the DNA extraction protocols evaluated, the most effective was the DNeasy PowerSoil kit (QIAGEN) because it yielded higher DNA quality and consistent results among technical replicates. Minor adaptations made to the original QIAGEN protocol consisted of the following: air sample tubes were washed (4×) with the beads buffer and C1 solution, and spores were ground at room temperature using a PRECELLYS® 24 (Bertin Instruments) using program 5000 rpm with 2 × 30 s grinding and a 10 s pause between the two periods. Following the extraction process, DNA was eluted in 60 μL of C6 solution to increase DNA concentration.
The most consistent six of 29 primer pairs tested (), one for each of wheat pathogens, were selected for optimization. All primers were first tested by standard PCR using a temperature gradient (55 to 65°C) to identify the annealing temperature range of detection. They were all tested using DNA from spores of the six target pathogens. The optimum annealing temperatures for Pst, Pgt, Pt, Bgt, Ptr, and Fg represented by the brightest bands were 55 to 60°C, 53 to 55°C, 53 to 59°C, 55 to 57°C, 53 to 57°C, and 53 to 57°C for primer pairs, respectively. Several tests were conducted using standard PCR before advancing to different qPCR assay approaches and ddPCR (data not shown). One of the tests was to confirm specificity of the chosen primers; it consisted in running PCR assays for each primer set with DNA of all six target pathogens and, for a few primer sets, other pathogens’ DNA were also used. For example, each rust primer set was tested for all three rusts plus the other three target pathogens, and the Fg primer set was tested for Fg, seven other Fusarium spp., and the other five target pathogens (data not shown). In all cases, among the six pathogens only the target species’ DNA was amplified. Among all qPCR and ddPCR methods tested, qPCR with a single pair of primers (singleplex) presented the brightest bands and most consistent results. An annealing temperature of 55°C produced strong and consistent amplifications and was selected for a multiplex of all six pathogen primer pairs. All multiplex and most duplex primer combinations yielded inferior results when compared to simplex results as these amplifications yielded additional fragments detected by melting curve analysis (qPCR) or additional DNA fragments in electrophoresis gels of amplified products (PCR) or amplification failure of pure DNA samples. Each primer pair was singly tested by qPCR assays using 10-fold serial dilutions of DNA of known concentration. Standard curves testing the efficiency of the qPCR assays with known amount of DNA from spores of each pathogen subjected to regression analysis demonstrate a very high association between Ct values and the log10 values for spore number for all six species () (P < 0.001). The response was linear over four orders of magnitude for each fungal species evaluated. The limits of detection of DNA for the primer pairs ranged from 0.0001 ng for Pgt, 0.0002 ng for Pst, Pt, Bgt and Fg to 0.001 ng for Ptr which corresponded to approximately one spore for Pst, Pgt, Pt and Bgt and 3 spores for Ptr and Fg. Analyses of active air samples collected at the seven sites during the project showed that the majority of the samples results presented a significant linear relationship (P < 0.05) between log10 of spore numbers and Ct value for the six pathogens in 61 of the 66 pathogen/site/years (Table S1). Where non-significant values were encountered, pathogen spore numbers were very low (often zero) and of the same value thus preventing generation of equations (Table S1).
The major advantage of molecular detection using qPCR over microscope detection and identification was that spores could be accurately identified and quantified at the species level (). Overall, results using microscopy and qPCR were correlated for the rusts during 2015 (R = 0.68, P < 0.03) and 2017 (R = 0.61, P < 0.05) but not in 2016. For Bgt, Ptr, and F. spp., no association was identified as detection levels for these pathogens were so much higher using qPCR.
Fig. 3 Weekly number of fungal spores collected using active spore collection and identified and enumerated using qPCR at the Weather Station, Lethbridge, AB, in 2015 (a-b), in 2016 (c-d), and in 2017 (e-f), respectively. The collection dates mark the beginning of the sampling week. Note the difference in scale for spore abundances among the different panels
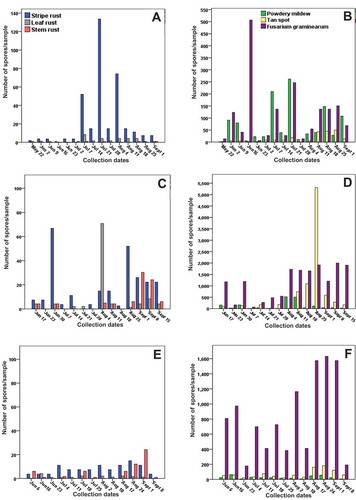
qPCR permitted detection of the six pathogens in all of the seven collection sites during the study in southern Alberta (). Fg spores generally predominated among the six pathogens followed by Ptr and Bgt at most sites (, ). Among the rusts, Pst, spores were generally most abundant followed by Pt and finally Pgt (, ). Conversely, the highest average occurrence detected using Burkard/qPCR among all six pathogens was observed for Fg, averaging 866 spores/sample including sites with greater than 33 000 total spores observed for the 3 years of study (, ). The highest total spore numbers throughout the growing season detected using qPCR were also observed for Fg which frequently attained levels of 1000–2000 spores in individual samplings compared with slide counts that ranged from 0 to 6 (; , 3a-f). For Bgt, spore counts ranged from 200 to 625 at the majority of sites using qPCR. The highest total numbers of spores observed for all species in the 3 years of the study using qPCR was for Ptr which attained approximately 5000 in a late August sample in 2016 at the Weather Station site (). In general, the highest total spore numbers were observed in 2016 followed by 2017 and 2015. This ranking corresponds to the rankings for TAR for the 3 years.
Table 3. Comparison of the total spore numbers for the 3 years of the study over the growing season detected by active sampling or passive sampling at various locations in southern Alberta from 2015–2017
While spore counts through the growing season differed among years and locations (P < 0.001), some patterns of spore release were observed. Pst spore numbers tended to increase in early June, attain maximum levels in early- to mid-July and decrease towards the end of the growing season (). Ptr spore numbers fluctuated markedly according to year and location. Very low spore numbers of Pgt were generally observed in mid-July but increased gradually until early September (). For Bgt, Fg and Ptr, qPCR quantification determined that spores were generally widespread throughout the sampling periods but increased to maximum numbers later in the growing season.
Discussion
This study focused on detection and quantification of six important airborne fungal wheat pathogens using an active sampling method combined with molecular identification and quantification and contrasted with a passive sampling method combined with microscopic identification. Studies on identification and quantification of airborne wheat pathogens are a priority worldwide because of the importance of the crop as a food and feed source. Additionally, there is a demand for accurate real-time methods for forecasting models employed to sustainably mitigate damaging effects of disease to wheat production through the judicious use of pesticides for disease control (Fernando et al. Citation2000; West et al. Citation2008; Isard et al. Citation2011; Guarín et al. Citation2015; Cao et al. Citation2016).
For the qPCR-based analyses, the six best out of the 29 pathogen-specific PCR primer pairs evaluated were selected for their ability to reliably amplify target sequences from wheat pathogen genomes during the optimization period. The limits of detection of DNA for primer pairs in singleplex tests ranged from 100 fg for Pgt to 1 pg for Ptr which corresponded to approximately 1 spore for Pst, Pgt, Pt and Bgt, and 3 spores for Ptr and Fg. These values are consistent with sensitivities which vary between 200 fg and 1–100 pg or between 1–10 spores or conidia that have been developed for other pathogens in qPCR-based tests (Gao et al. Citation2004; Lievens et al. Citation2006; van Doorn et al. Citation2007; Carisse et al. Citation2009, Citation2014; Mirmajlessi et al. Citation2015; Canfora et al. Citation2016; Gu et al. Citation2019). The utilization of probes based on rDNA sequences has been associated with improved assay sensitivity (Gao et al. Citation2004; Lievens et al. Citation2006; van Doorn et al. Citation2007; Carisse et al. Citation2014; Gu et al. Citation2019) whereas in other studies, no improvement was observed (Carisse et al. Citation2009; Canfora et al. Citation2016). Studies have demonstrated the need for a linear range between 3 and 6 orders of magnitudes in order to produce meaningful results (Gao et al. Citation2004; Lievens et al. Citation2006; van Doorn et al. Citation2007; Carisse et al. Citation2009, Citation2014; Mirmajlessi et al. Citation2015; Canfora et al. Citation2016; Gu et al. Citation2019). The linear range in this study for detection of all six fungal pathogens was superior to four orders of magnitude. For the rusts, detection limits were within the range of one spore; therefore, housekeeping genes (β-tubulin and elongation factor 1-α) were abundant enough to permit the detection of these fungi. Because, rust spores are dikaryotic, this represented the ability to detect the sequences of both nuclei present in the spore as these housekeeping genes are present in both nuclei in stripe rust (Zheng et al. Citation2013). Similarly, macroconidia of Fg and Ptr are both multi-cellular, 6–8 per macroconidia, and multi-nucleate (Roper et al. Citation2011; Shahi et al. Citation2014). Consequently, the true sensitivity of the primers employed in our qPCR assays is proportionally increased. Key to the success of any detection/quantification assay is an efficient and effective extraction of the DNA from spores with the absence of PCR amplification inhibitors (Gao et al. Citation2004; van Doorn et al. Citation2007; Carisse et al. Citation2009, Citation2014; Mirmajlessi et al. Citation2015; Canfora et al. Citation2016).
PCR primers for Tox A1/2 in Ptr have the potential to amplify sequences among Parastagonospora (syn. Stagonospora; Phaeosphaeria, Septoria) nodorum (Berk.) Quaedvlieg, Verkley & Crous (Pn) strains that cause leaf blotch of wheat and also produce the Ptr ToxA protein (Phan et al. Citation2016). Tox A has also been identified in Bipolaris sorokiniana (Sacc.) Shoemaker (Bs) causal agent of spot blotch in wheat (Friesen and Holmes Citation2018; McDonald et al. Citation2018). Whereas Ptr is the predominant leaf spot pathogen in Alberta (Aboukhaddour et al. Citation2013), the Ptr primers may also be useful to detect P. nodorum which is also a member to the leaf spot complex. The prevalence of these main species can vary depending on the soil type, agricultural practice, region and other factors (Fernandez et al. Citation2016). For example, P. nodorum is the most prevalent pathogen in the black soil zones in Saskatchewan (Fernandez et al. Citation2016) further supporting a previous report of it being the main leaf spotting pathogen in eastern Canadian Prairies (Bailey et al. Citation2009). Thus, based on all these evidences and for the purpose of this study, all the spores detected by the Tox A primer set are being treated as Ptr due to the absence of Pn and Bs in southern Alberta. Regardless, spore numbers of these species should be included in future forecasting models.
Identification and quantification of all six pathogen spores in air samples collected at all seven locations in southern Alberta were possible using qPCR analyses. Correlations between log10 number of spores and Ct values detected for most of the air samples collected by the cyclone instruments demonstrated the consistency of this analytical method. Active sampling using the Burkard system and qPCR was markedly more sensitive than passive sampling coupled to microscopic identification and quantification of the six wheat pathogens thereby confirming results from previous studies (Alcázar and Comtois Citation1999; Alcázar et al. Citation2003; West and Kimber Citation2015; Cao et al. Citation2016). When active sampling/qPCR and passive sampling/microscopy were compared, the number of Puccinia spp. spores enumerated using the latter was generally higher but individual species could not be determined because of the morphological similarities among urediniospores belonging to the three species. Pst was the predominant rust species at all seven locations in southern Alberta whereas the least abundant pathogen was Pgt. Pst is endemic to the western Prairies and occurs in most years (Gaudet et al. Citation2015, Citation2016; Brar et al. Citation2017). The lower incidence of both Pgt and Pt is likely due to their natural occurrence along the Puccinia pathway in the central Great Plains of North America, resulting in late entry of these two species in southern Alberta in most years (Wegulo and Byamukama Citation2012). Correlative analyses between the two methods suggested that microscopic analyses, albeit less sensitive, could be used to quantify the wheat rusts collectively but not individually in our study although stem and leaf rust urediniospores have been distinguished by pathologists on the Prairies since the initial studies on rusts’ impact on wheat production (Green Citation1965). In Alberta and western Saskatchewan, leaf and stem rust usually cause only minor infections and yield losses whereas stripe rust will overwinter or arrive early in the spring and causes serious yield and quality losses (Gaudet et al. Citation2015, Citation2016; Brar and Kutcher Citation2016; Aboukhaddour and Amundsen Citation2018). Therefore, obtaining accurate stripe rust spore numbers in spore showers is critical to implementing control strategies in western Canadian Prairies. Elsewhere on the Canadian Prairies, identification of rust species is also critical to assessing whether seeded varieties are resistant to prevailing rusts because resistance to leaf and stem rust is common in current wheat varieties. However, stripe rust resistance is lacking in several wheat varieties (McCallum and DePauw Citation2008; Randhawa et al. Citation2012; Martens et al. Citation2014).
For Fg, Ptr and Bgt, spore numbers collected passively on sticky slides and identified and quantified using microscopy were insufficient to be of epidemiological value. Conversely, the highest average occurrence detected using Burkard/qPCR among all six pathogens was observed for Fg including samples with greater than 10 000 spores. These results are similar to those reported by Fernando et al. (Citation2000) in eastern Canada. Bgt or Ptr were also abundant depending on the location, averaging 2217 and 1968 spores/season/location, respectively. These three pathogens overwinter in stubble and are widespread in western Canada (Aboukhaddour et al. Citation2013; Gräfenhan et al. Citation2013; Abdullah et al. Citation2017). Ranges of 50 to 500 000 spores/sample were observed for Bgt spores in wheat fields in Hebei Province (Cao et al. Citation2016); however, no reports of spore numbers for the rusts and tan spot were found in the literature. The greatest factor attributing to the discrepancy between the spore numbers quantified by the two methods was likely due to a tendency for slides to be washed by rainfall and/or irrigation, and general weathering of the slides fully exposed to the sun and wind during the one-week sampling periods. This is a major limitation for the adhesive tape method (Alcázar et al. Citation2003). Adding to the discrepancy for Fg, macroconidia are less common than ascospores at 1 m height where wheat heads occur resulting in their underrepresentation on microscope slides (Fernando et al. Citation2000). Additionally, ascospores can be difficult to characterize morphologically (Fernando et al. Citation2000). Conidia of Pyrenophora teres, the causal agent of net blotch of barley, is also restricted to a zone of 1 m above the ground (Martin et al. Citation1984) which might be similar for Ptr.
As these two sampling methods and their associated identification and quantification methods were so different, it was not possible to directly compare them. Both methods have their advantages; microscopic sampling and analyses require a relatively low level of technology, material cost, and setup compared to the Burkard/qPCR method, but microscopic counts are time-consuming, involve more costly labour, required a much higher expertise to distinguish them and provide limited to no information at the species level. Conversely, the Burkard Cyclone instrument as well as qPCR instruments and related technologies are currently expensive but future widespread adoption of these technologies will undoubtedly reduce costs. Field setup procedures with the Burkard Cyclone is more complicated than microscope slide placement and there is a risk of instrument failure due to power supply failure or mechanical issues. The collector orifice on the Burkard Cyclone instrument was set up at 90 to 100 cm from the ground surface which is appropriate for sampling pathogens that may attack the flag and penultimate leaves and the head; these three wheat organs contribute the greatest to yield and quality in wheat and therefore require the greatest protection against pathogens if losses are to be avoided (Patterson et al. Citation1990; Dimmock and Gooding Citation2002). In this study, microscopic analysis served as a complementary technique providing contrasting yet supporting evidence for identification and quantification of rust airborne fungal spores using Burkard sampling/qPCR. In situations where active samplers are in limited number or not available, an alternative is performing qPCR on adhesive tape samples as was demonstrated when wheat powdery mildew spores were effectively released from adhesive tape prior DNA extraction (Cao et al. Citation2016).
The upper sensitivity limit of urediniospore detection, which is similar to other biological systems (Gao et al. Citation2004; Lievens et al. Citation2006; van Doorn et al. Citation2007; Carisse et al. Citation2009, Citation2014; Mirmajlessi et al. Citation2015; Canfora et al. Citation2016; Gu et al. Citation2019), is much higher than what is needed for detection of pathogens. For example, a minimum threshold level of up to104 to 106 urediniospores is needed for development of stripe rust under controlled environment and field conditions (Araujo Citation2018). Whereas our results generally demonstrated a reduced sensitivity of qPCR when primers were used in a multiplex vs singleplex manner, the high sensitivity demonstrated in our results suggest that a multiplex containing primer pairs for several or all of the six wheat pathogens could be devised. Although the prospect for development of a multiplex of primers for all the important wheat pathogens remains to be determined, it is the goal in the field assessment of wheat pathogens for future forecasting models. Additionally, future breakthroughs in understanding the nature of pathogenicity and virulence genes will permit the identification of individual pathogen races and hence, increase the overall precision of disease forecasting systems.
Variance in spore numbers for the different pathogens in air samples was observed among the different locations during the three crop seasons from 2015 to 2017. In general, based on qPCR results, there were higher spore numbers from 2016 compared to 2015 and 2017. These changes closely followed the long-term average rainfall/moisture and lower GDD in 2016 compared to 2015 and 2017 that were warmer and drier. The prevailing wind directions in southern Alberta are from west, west southwest and southwest (Vickers et al. Citation2001; AAF Citation2020) which would likely create spore showers for stripe rust originating from the Pacific Northwestern USA (Chen Citation2005) and influence the secondary spread of rust spores. This demonstrates the need for establishing a representative array of sampling sites throughout southern Alberta in order to document the location and timing of stripe rust spore showers and its subsequent spread during the growing season.
In summary, this study demonstrated that it was possible to reliably identify and quantify spores from six fungal wheat pathogens in air samples from southern Alberta areas by selecting pathogen-specific primers and an optimized qPCR protocol. A qPCR-based technique coupled with Burkard Cyclone instruments for air sampling provided a means of generating efficient and reliable pathogen identification and monitoring in real-time. The selected pathogen-specific primers were highly sensitive and served to identify and quantify, in real-time, the incidence of airborne spores of wheat pathogens sampled at specific locations in southern Alberta. These methods will be important in developing reliable forecasting models based on pathogen presence and abundance that will be indispensable for estimating the risk of crop disease and for establishing the best practices for the use of fungicides that will help maintain fungicide efficacy, reduce production costs, and protect the environment.
Supplemental Material
Download MS Word (35.6 KB)Acknowledgements
We would like to thank Dr. Michael Harding, Crop Diversification Centre South, Alberta Agriculture and Forestry, Brooks, AB and the owners of the Stanford Farm, Magrath, Stamp Seeds Farm, Enchant, and Welsh Farm, Milk River for hosting and collecting samples from the spore collectors.
Supplementary material
Supplemental data for this article can be accessed online here: https://doi.org/10.1080/07060661.2020.1817795
Additional information
Funding
References
- AAF (Alberta Agriculture and Forestry). 2020. Prevailing wind direction (June, July and August): 1971 to 2000; [ accessed 2020 Apr 22]. https://agriculture.alberta.ca/acis/wind-rose.jsp.
- Abdullah S, Sehgal SK, Jin Y, Turnipseed B, Ali S. 2017. Insights into tan spot and stem rust resistance and susceptibility by studying the pre-green revolution global collection of wheat. Plant Pathol J. 33:125–132. doi:10.5423/PPJ.OA.07.2016.0157.
- Aboukhaddour R. 2017. Stripe rust in Canada, Alberta wheat commission; [accessed 2019 Sep 5]. http://www.alberta wheat.com/media/blog-the-wheat-sheaf/stripe-rust-in-canada.
- Aboukhaddour R, Amundsen E. 2018. Stripe rust in Southern Alberta, 2016-2017. Can Plant Dis Surv. 98:144–145.
- Aboukhaddour R, Turkington TK, Strelkov SE. 2013. Race structure of Pyrenophora tritici-repentis (tan spot of wheat) in Alberta, Canada. Can J Plant Pathol. 35:256–268. doi:10.1080/07060661.2013.782470.
- Agrios GN. 2005. Plant pathology. 5th ed. San Diego (CA): Elsevier-Academic Press.
- Alcázar P, Comtois P. 1999. A new adhesive for airborne pollen sampling. Aerobiology. 15:105–108. doi:10.1023/A:1007505517863.
- Alcázar P, Galán C, Carinanos P, Dominguez-Vilches E. 2003. A new adhesive for airborne pollen sampling in Spain. Aerobiology. 19:57–61. doi:10.1023/A:1022692228699.
- Araujo GT. 2018. Determination of the incidence of fungal spores for important wheat pathogens in western Canada [M.Sc. thesis]. Alberta (Canada): University of Lethbridge.
- Bailey KL, Gossen BD, Gugel RK, Morrall RA. 2009. Diseases of field crops in Canada. 3rd ed. Saskatoon (Canada): The Canadian Phytopathological Society.
- Baka ZAM, Rabei S. 2013. Morphology of uredinia and urediniospores of seven Puccinia species attacking Poaceae in Egypt. Egypt J Bot. 3:407–421.
- Bayer. 2018. Blumeria graminis f. sp. tritici; [accessed 2019 Sept 5]. https://www.cropscience.bayer.com/en/crop-compendium/pests-diseases-weeds/diseases/blumeria-graminis-f-sp-tritici.
- Benslimane H, Aouali S, Khalfi A, Ali S, Bouznad Z. 2017. In vitro morphological characteristics of Pyrenophora tritici-repentis isolates from several Algerian agro-ecological zones. Plant Pathol J. 33:109–117. doi:10.5423/PPJ.OA.09.2015.0189.
- Brar GS, Graf R, Knox R, Campbell H, Kutcher HR. 2017. Reaction of differential wheat and triticale genotypes to natural stripe rust [Puccinia striiformis f. sp. tritici] infection in Saskatchewan, Canada. Can J Plant Pathol. 39:138–148. doi:10.1080/07060661.2017.1341433.
- Brar GS, Kutcher HR. 2016. Race characterization of Puccinia striiformis f. sp. tritici, the cause of wheat stripe rust, in Saskatchewan and Southern Alberta, Canada and virulence comparison with races from United States. Plant Dis. 100:1744–1753. doi:10.1094/PDIS-12-15-1410-RE.
- Canfora L, Malusà E, Tkaczuk C, Tartanus M, Łabanowska BH, Pinzari F. 2016. Development of a method for detection and quantification of B. brongniartii and B. bassiana in soil. Scient Rep. 6:22933. doi:10.1038/srep22933.
- Cao X, Yao D, Zhou Y, West JS, Xu X, Luo Y, Ding K, Fan J, Duan X. 2016. Detection and quantification of airborne inoculum of Blumeria graminis f. sp. tritici using quantitative PCR. Eur J Plant Pathol. 146:225–229. doi:10.1007/s10658-016-0908-8.
- Carisse O, Tremblay DM, Lefebvre A. 2014. Comparison of Botrytis cinerea airborne inoculum progress curves from raspberry, strawberry and grape plantings. Plant Pathol. 63:983–993. doi:10.1111/ppa.12192.
- Carisse O, Tremblay DM, Lévesque CA, Gindro K, Ward P, Houde A. 2009. Development of a TaqMan real-time PCR assay for quantification of airborne conidia of Botrytis squamosa and management of Botrytis leaf blight of onion. Phytopathology. 99:1273–1280. doi:10.1094/PHYTO-99-11-1273.
- Chen W, Wellings C, Chen X, Kang Z, Liu T. 2014. Wheat stripe (yellow) rust caused by Puccinia striiformis f. sp. tritici. Mol Plant Pathol. 15:433–446. doi:10.1111/mpp.12116.
- Chen XM. 2005. Epidemiology and control of stripe rust [Puccinia striiformis f. sp. tritici] on wheat. Can J Plant Pathol. 27:314–337. doi:10.1080/07060660509507230.
- Chomczynski P, Rymaszewski M. 2006. Alkaline polyethylene glycol-based method for direct PCR from bacteria, eukaryotic tissue samples, and whole blood. BioTechniques. 40:454–458. doi:10.2144/000112149.
- Ciuffetti LM, Tuori RP. 1999. Advances in the characterization of the Pyrenophora tritici-repentis-wheat interaction. Phytopathology. 89:444–449. doi:10.1094/PHYTO.1999.89.6.444.
- Conner RL, Kuzyk AD, Su H. 2003. Impact of powdery mildew on the yield of soft white spring wheat cultivars. Can J Plant Sci. 83:725–728. doi:10.4141/P03-043.
- De Wolf ED, Effertz RJ, Ali S, Francl LJ. 1998. Vistas of tan spot research. Can J Plant Pathol. 20:349–444. doi:10.1080/07060669809500404.
- Dimmock J, Gooding M. 2002. The effects of fungicides on rate and duration of grain filling in winter wheat in relation to maintenance of flag leaf green area. J Agric Sci. 138:1–16. doi:10.1017/S0021859601001666.
- Donatelli M, Magarey RD, Bregaglio S, Willocquet L, Whish JP, Savary S. 2017. Modelling the impacts of pests and diseases on agricultural systems. Agric Systems. 155:213–224. doi:10.1016/j.agsy.2017.01.019.
- Eversmeyer MG, Kramer CL. 2000. Epidemiology of wheat leaf and stem rust in the Central Great Plains of the USA. Ann Rev Phytopathol. 38:491–513. doi:10.1146/annurev.phyto.38.1.491.
- FAO (Food and Agriculture Organization of the United Nations). 2010. Wheat stem rust – Ug99 (race TTSKS); [accessed 2019 Sept 5]. http://www.fao.org/agriculture/crops/rust/stem/rust-report/stem-ug99racettksk/en/.
- Faris JD, Liu Z, Xu SS. 2013. Genetics of tan spot resistance in wheat. Theor Appl Genet. 126:2197–2217. doi:10.1007/s00122-013-2157-y.
- Fernandez MR, Clarke FR, Knox RE, Clarke JM, Singh AK. 2010. Quantification of effects of leaf spotting diseases on grain yield and market quality of durum wheat using near-isogenic lines TCJP. Can J Plant Pathol. 32:177–187. doi:10.1080/07060661003740025.
- Fernandez MR, Stevenson CF, Hodge K, Dokken-Bouchard PPG, Waelchli F, Brown A, Peluola C. 2016. Assessing effects of climatic change, region and agronomic practices on leaf spotting of bread and durum wheat in western Canada Prairies, from 2001 to 2012. Agron J. 108:1180–1195. doi:10.2134/agronj2015.0451.
- Fernando WGD, Miller JD, Seaman WL, Seifert K, Paulitz TC. 2000. Daily and seasonal dynamics of airborne spores of Fusarium graminearum and other Fusarium species sampled over wheat plots. Can J Bot. 78:497–505.
- Friesen TL, Holmes DJ. 2018. ToxA is present in the U.S. Bipolaris sorokiniana population and is a significant virulence factor on wheat harboring Tsn1. Plant Dis. 102:2446–2452. doi:10.1094/PDIS-03-18-0521-RE.
- Friesen TL, Stukenbrock EH, Liu Z, Meinhardt S, Ling H, Faris JD, Rasmussen JB, Solomon PS, McDonald BA, Oliver RP. 2006. Emergence of a new disease as a result of interspecific virulence gene transfer. Nat Genet. 38:953–956. doi:10.1038/ng1839.
- Gao X, Jackson TA, Lambert KN, Li S, Hartman GL, Niblack TL. 2004. Detection and quantification of Fusarium solani f. sp. glycines in soybean roots with real-time quantitative polymerase chain reaction. Plant Dis. 88:1372–1380. doi:10.1094/PDIS.2004.88.12.1372.
- Gaudet DA, Amundsen E, Frick MJ, Laroche A, Randhawa H. 2016. 2015 stripe rust survey in Southern Alberta. Can Plant Dis Surv. 96:149–150.
- Gaudet DA, Frick MJ, Kundrick K, Amundsen E. 2015. 2014 stripe rust survey in Southern Alberta. Can Plant Dis Surv. 95:108–109.
- Gautam P, Dill-Macky R. 2012. Impact of moisture, host genetics and Fusarium graminearum isolates on Fusarium head blight development and trichothecene accumulation in spring wheat. Mycot Res. 28:45–58. doi:10.1007/s12550-011-0115-6.
- Goswami RS, Kistler HC. 2004. Heading for disaster: Fusarium graminearum on cereal crops. Mol Plant Pathol. 5:515–525. doi:10.1111/j.1364-3703.2004.00252.x.
- Gräfenhan T, Patrick SK, Roscoe M, Trelka R, Gaba D, Chan JM, McKendry T, Clear RM, Tittlemier SA. 2013. Fusarium damage in cereal grains from Western Canada. 1. Phylogenetic analysis of moniliformin-producing Fusarium species and their natural occurrence in mycotoxin-contaminated wheat, oats, and rye. J Agric Food Chem. 61:5425–5437. doi:10.1021/jf400651p.
- Green GJ. 1965. Air-borne rust inoculum over western Canada in 1964. Can J Plant Dis Surv. 45:13–14.
- Gu Y, Chu B, Wang C, Li L, Zhou Y, Luo Y, Ma Z. 2019. Spore concentrations of Blumeria graminis f. sp. tritici in relation to weather factors and disease development in Gansu, China. Can J Plant Pathol. 42:52–61. doi:10.1080/07060661.2019.1630011.
- Guarín FA, Abril MAQ, Alvarez A, Fonnegra R. 2015. Atmospheric pollen and spore content in the urban area of the city of Medellin, Colombia. Hoehnea. 42:9–19. doi:10.1590/2236-8906-52/2013.
- Harris LJ, Balcerzak M, Johnston A, Scheiderman D, Ouellet T. 2015. Host-preferential Fusarium graminearum gene expression during infection of wheat, barley, and maize. Fungal Biol. 120:111–123. doi:10.1016/j.funbio.2015.10.010.
- Hiratsuka Y, Sato S. 1982. The Rust Fungi. In: Scott K, Chakravorty AK, editors. Morphology and taxonomy of rust fungi. New York (NY): Academic Press; p. 1–36.
- Hobbelen PHF, Paveley ND, van den Bosch F. 2014. The emergence of resistance to fungicides. PLoS One. 9:e91910. doi:10.1371/journal.pone.0091910.
- Huerta-Espino J, Singh RP, German S, McCallum BD, Park RF, Chen WQ, Bhardwaj SC, Goyeau H. 2011. Global status of wheat leaf rust caused by Puccinia triticina. Euphytica. 179:143–160. doi:10.1007/s10681-011-0361-x.
- Isard SA, Barnes CW, Hambleton S, Ariatti A, Russo JM, Tenuta A, Gay DA, Szabo LJ. 2011. Predicting soybean rust incursions into the North American continental interior using crop monitoring, spore trapping, and aerobiological modeling. Plant Dis. 95:1346–1357. doi:10.1094/PDIS-01-11-0034.
- Keller MD, Bergstrom GC, Shields EJ. 2014. The aerobiology of Fusarium graminearum. Aerobiologia. 30:123–136. doi:10.1007/s10453-013-9321-3.
- Khan RR, Bariana HS, Dholakia BB, Naik SV, Lagu MD, Rathjen AJ, Bhavani S, Gupta VS. 2005. Molecular mapping of stem and leaf rust resistance in wheat. Theor Appl Genet. 111:846–850. doi:10.1007/s00122-005-0005-4.
- Kikot GE, Moschini R, Consolo VF, Rojo R, Salerno G, Hours RA, Gasoni L, Arambarri AM, Alcanada TM. 2011. Occurrence of different species of fusarium from wheat in relation to disease levels predicted by a weather-based model in Argentina Pampas region. Mycopathology. 171:139–149. doi:10.1007/s11046-010-9335-0.
- Lamari L, Strelkov SE. 2010. The wheat/Pyrenophora tritici-repentis interaction: progress towards an understanding of tan spot disease. Can J Plant Pathol. 32:4–10. doi:10.1080/07060661003594117.
- Leslie JF, Summerell BA. 2006. The Fusarium laboratory manual. Ames (IA): Blackwell Publishing.
- Lievens B, Brouwer M, Vanachter ACRC, Cammue BPA, Thomma BPHJ. 2006. Real-time PCR for detection and quantification of fungal and oomycete tomato pathogens in plant and soil samples. Plant Sci. 171:155–165. doi:10.1016/j.plantsci.2006.03.009.
- Liu M, Hambleton S. 2010. Taxonomic study of stripe rust, Puccinia striiformis sensu lato, based on molecular and morphological evidence. Fungal Biol. 114:881–899. doi:10.1016/j.funbio.2010.08.005.
- Liu M, McCabe E, Chapados JT, Carey J, Wilson SK, Tropiano R, Redhead SA, Lévesque CA, Hambleton S. 2015. Detection and identification of selected cereal rust pathogens by TaqMan® real-time PCR. Can J Plant Pathol. 37:92–105. doi:10.1080/07060661.2014.999123.
- Liu M, Szabo LJ, Hambleton S, Anikster Y, Kolmer JA. 2013. Molecular phylogenetic relationships of the brown leaf rust fungi on wheat, rye, and other grasses. Plant Dis. 97:1408–1417. doi:10.1094/PDIS-02-13-0152-RE.
- Marone D, Russo MA, Laidò G, De Vita P, Papa R, Blanco A, Gadaleta A, Rudiales D, Mastrangelo AM. 2013. Genetic basis of qualitative and quantitative resistance to powdery mildew in wheat: from consensus regions to candidate genes. BMC Genom. 14:562. doi:10.1186/1471-2164-14-562.
- Martens G, Lamari L, Grieger A, Gulden RH, McCallum B. 2014. Comparative yield, disease resistance and response to fungicide for forty-five historic Canadian wheat cultivars. Can J Plant Sci. 94:371–381. doi:10.4141/cjps2013-193.
- Martin RA, Clough KS, Johnston HW. 1984. Vertical and horizontal distribution of conidia of Pyrenophora teres in barley fields. Can J Plant Pathol. 6:280–282. doi:10.1080/07060668409501529.
- McCallum BD, DePauw RM. 2008. A review of wheat cultivars grown in the Canadian prairies. Can J Plant Sci. 88:649–677. doi:10.4141/CJPS07159.
- McCallum BD, Fetch T, Chong J. 2007. Cereal rust control in Canada. Aust J Agric Res. 58:639–647. doi:10.1071/AR06145.
- McDonald JH. 2014. Data transformations. In: Handbook of biological statistics. 3rd ed. Baltimore (USA): Sparky House Publishing. p160-164.
- McDonald MC, Ahren D, Simpfendorfer S, Milgate A, Solomon PS. 2018. The discovery of the virulence gene ToxA in the wheat and barley pathogen Bipolaris sorokiniana. Mol Plant Pathol. 19:432–439. doi:10.1111/mpp.12535.
- McMullen M, Adhikari T. 2009. Fungal leaf spot diseases of wheat: tan spot, Stagonospora nodorum blotch and Septoria tritici blotch; [accessed 2019 Sept 4]. https://www.ag.ndsu.edu/publications/crops/funga l-leaf-spot-diseases-of-wheat-tan-spot-septoria-stagonospora-nodorum-blotch-and-septoria-tritici-blotch/pp1249.pdf.
- Mirmajlessi SM, Destefanis M, Gottsberger RA, Mänd M, Loit E. 2015. PCR-based specific techniques used for detecting the most important pathogens on strawberry: a systematic review. Syst Rev. 4:9. doi:10.1186/2046-4053-4-9.
- Moffat CS, See PT, Oliver RP. 2014. Generation of ToxA knockout strain of the wheat tan spot pathogen Pyrenophora tritici-repentis. Mol Plant Pathol. 15:918–926. doi:10.1111/mpp.12154.
- Morrall RAA, Howard RJ. 1975. The epidemiology of leaf spot disease in a native prairie. II. Airborne spore populations of Pyrenophora tritici-repentis. Can J Bot. 53:2345–2353. doi:10.1139/b75-260.
- Nicolaisen M, Suproniene S, Nielsen LK, Lazzaro I, Spliid NH, Justesen AF. 2009. Real-time PCR for quantification of eleven individual Fusarium species in cereals. J Microbiol Meth. 76:234–240. doi:10.1016/j.mimet.2008.10.016.
- Núñez A, Amo de Paz G, Ferencova Z, Rastrojo A, Guantes R, García AM, Alcamí A, Gutiérrez-Bustillo M, Moreno DA. 2017. Validation of the Hirst-type spore trap for simultaneous monitoring of prokaryotic and eukaryotic biodiversities in urban air samples by next-generation sequencing. Appl Environ Microbiol. 83:1–14.
- Parks WR, Booth W, Cowger C. 2011. Characterization of polymorphic microsatellite loci of Blumeria graminis f. sp. tritici, the cause of powdery mildew of wheat. Mol Ecol Resour. 11:586–589.
- Patterson FL, Shaner GE, Ohm HW, Foster JE. 1990. A historical perspective for the establishment of research goals for wheat improvement. Prod Agric. 3:30–38. doi:10.2134/jpa1990.0030.
- Phan HTT, Rybak K, Furuki E, Breen S, Solomon PS, Oliver RP, Tan KC. 2016. Differential effector gene expression underpins epistasis in plant fungal disease. Plant J. 87:343–354. doi:10.1111/tpj.13203.
- Randhawa H, Puchalski BJ, Frick M, Goyal A, Despins T, Graf RJ, Laroche A, Gaudet DA. 2012. Stripe rust resistance among western Canadian spring wheat and triticale varieties. Can J Plant Sci. 92:713–722. doi:10.4141/cjps2011-252.
- Randhawa HS, Asif M, Pozniak C, Clarke JM, Graf RJ, Fox SL, Humphreys DG, Knox RE, DePauw RM, Singh AK, et al. 2013. Application of molecular markers to wheat breeding in Canada. Plant Breed. 132:458–471.
- Reischer GH, Lemmens M, Farnleitner A, Adler A, Mach RL. 2004. Quantification of Fusarium graminearum in infected wheat by species specific real-time PCR applying a TaqMan Probe. J Microbiol Meth. 59:141–146. doi:10.1016/j.mimet.2004.06.003.
- Roper M, Ellison C, Taylor JW, Glass NL. 2011. Nuclear and genome dynamics in multinucleate ascomycete fungi. Curr Biol. 21:R786–R793. doi:10.1016/j.cub.2011.06.042.
- Sankaran S, Mishra A, Ehsani R, Davis C. 2010. A review of advanced techniques for detecting plant diseases. Comput Electron Agric. 72:1–13. doi:10.1016/j.compag.2010.02.007.
- Savile DBO. 1984. Taxonomy of cereal rust fungi. In: Bushnell WR, Roelfs AP, editors. The cereal rust: origins, specificity, structure, and physiology. United Kingdom (London): Academic Press Inc; p. 89–110.
- Schmale DG, III, Bergstrom GC. 2003. Fusarium head blight in wheat; [accessed 2019 Sept 9]. https://www.apsnet.org/edcenter/disandpath/fungalasco/pdlessons/Pages/Fusarium.aspx.
- Scholthof KBG. 2007. The disease triangle: pathogens, the environment and society. Nature. 5:152–156.
- Shahi S, Beerens B, Manders EMM, Martijn M. 2014. Dynamics of the establishment of multinucleate compartments in Fusarium oxysporum. Eukaryot Cell. 14:78–85. doi:10.1128/EC.00200-14.
- Sterling M, Rogers C, Levetin E. 1999. An evolution of two methods used for microscopic analysis of airborne fungal spores concentrations from the Burkard spore trap. Aerobiologia. 15:9–18. doi:10.1023/A:1007561201541.
- Strelkov SE, Lamari L. 2003. Host-parasite interactions in tan spot [Pyrenophora tritici-repentis] of wheat. Can J Plant Pathol. 25:339–349. doi:10.1080/07060660309507089.
- Sykes EE, Bernier CC. 1991. Qualitative inheritance of tan spot resistance in hexaploid, tetraploid, and diploid wheat. Can J Plant Pathol. 13:38–44. doi:10.1080/07060669109500963.
- Tittlemier SA, Roscoe M, Trelka R, Gaba D, Chan JM, Patrick SK, Sulyok M, Krska R, McKendry T, Gräfenhan T. 2013. Fusarium damage in small cereal grains from Western Canada. 2. Occurrence of Fusarium toxins and their source organisms in durum wheat harvested in 2010. J Agric Food Chem. 61:5438–5448. doi:10.1021/jf400652e.
- Tsui CKM, Woodhall J, Chen W, Lévesque CA, Lau A, Schoen CD, Baschien C, Najafzadeh MJ, Sybren de Hoog G. 2011. Molecular techniques for pathogen identification and fungus detections in the environment. IMA Fung. 2:177–189. doi:10.5598/imafungus.2011.02.02.09.
- van Doorn R, Szemes M, Bonants P, Kowalchuk GA, Salles JF, Ortenberg E, Schoen CD. 2007. Quantitative multiplex detection of plant pathogens using a novel ligation probe-based system coupled with universal, high-throughput real-time PCR on OpenArrays™. BMC Gen. 8:276. doi:10.1186/1471-2164-8-276.
- Vickers G, Buzza S, Schmidt D, Mullock J. 2001. The weather of the Canadian Prairies: graphic area forecast 32. Ottawa: NAV Canada and Meteorological Service of Canada; p. 180.
- Waalwijk C, van der Heide R, de Vries I, van der Lee T, Schoen C, Corainville GC, Hauser-Hahn I, Kastelein P, Kohl J, Lonnet P, et al. 2004. Quantitative detection of Fusarium species in wheat using TaqMan. Eur J Plant Pathol. 110:481–494. doi:10.1023/B:EJPP.0000032387.52385.13.
- Wegulo SN, Byamukama E. 2012. Rust diseases of wheat; [accessed 2019 Sept 5]. http://extensionpublications.unl.edu/assets/pdf/g2180.pdf.
- Werner O, Ros RM, Guerra J. 2002. Direct amplification and NaOH extraction: two rapid and simple methods for preparing bryophyte DNA for polymerase chain reaction (PCR). J Bryol. 24:127–131. doi:10.1179/037366802125000980.
- West JS, Atkins SD, Emberlin J, Fitt BDL. 2008. PCR to predict risk of airborne disease. Trends Microbiol. 16:380–387. doi:10.1016/j.tim.2008.05.004.
- West JS, Kimber BRE. 2015. Innovations in air sampling to detect plant pathogens. Ann Appl Biol. 166:4–17. doi:10.1111/aab.12191.
- Wicker T, Oberhaensli S, Parlange F, Buchmann JP, Shatalina M, Roffler S, Ben-David R, Doleže J, Šimková H, Schulze-Lefert P, et al. 2013. The wheat powdery mildew genome shows the unique evolution of an obligate biotroph. Nat Genet. 45:1092–1096.
- Wilson C, Tisdell C. 2001. Why farmers continue to use pesticides despite environmental, health and sustainability costs. Ecol Econ. 39(3):449–462. doi:10.1016/S0921-8009(01)00238-5.
- Xi K, Kumar K, Holtz MD, Turkington TK, Chapman B. 2015. Understanding the development and management of stripe rust in central Alberta. Can J Plant Pathol. 37:21–39. doi:10.1080/07060661.2014.981215.
- Zheng W, Huang L, Huang J, Wang X, Chen X, Zhao J, Guo J, Zhuang H, Qiu C, Liu J, et al. 2013. High genome heterozygosity and endemic genetic recombination in the wheat stripe rust fungus. Nat Commun. 4:2673.