
Abstract
Cherry trees (Cerasus pseudocerasus (Lindl.) Loudon) in Bai Lu Yuan, Shaanxi Province, China, are susceptible to a serious disease that causes substantial economic losses. The pathogens causing this disease, designated black spot disease, are currently unknown. To identify the relationship between microbial community structure and the status of plant health, we obtained samples from the rhizosphere and tissues of both healthy cherry trees and those with symptoms of black spot disease. We used Illumina sequencing of 16S rRNA gene and internal transcribed spacer (ITS) amplicons to examine the bacterial and fungal communities in these samples. An alpha diversity analysis showed that there were no significant differences between diseased and healthy soils, while fungal diversity in diseased tissue was significantly higher than in healthy tissue (P < 0.01), suggesting that an imbalance in fungal flora may be related to black spot disease. Taxonomic classification and linear discriminant analysis effect size (LEfSe) indicated an increase in the relative abundance of some bacterial genera (Pseudomonas, Burkholderia, Sphingobium, Erwinia, Sphingomonas and Bradyrhizobium) and fungal genera (Phoma, Penicillium, Fusarium, Cystobasidium, Aureobasidium and Nakazawaea) in the diseased tissues (p < 0.05). Among these, the increased relative abundance of the bacteria Pseudomonas and Erwinia and fungi Penicillium, Phoma and Fusarium may be associated with blackspot of cherry tree. The bacterial genera Burkholderia, Sphingobium, Sphingomomas and Bradyrhizobium are probably antagonists of the pathogen(s) of black spot. These findings are an initial step in the identification of potential candidates for the biological control of the disease.
Résumé
Les cerisiers (Cerasus pseudocerasus [Lindl.] Loudon) de Bai Lu Yuan, dans la province du Shaanxi en Chine, sont sujets à une grave maladie qui entraîne de lourdes pertes économiques. Les agents pathogènes causant cette maladie, désignée en tant que tavelure, sont à ce jour inconnus. Afin d’établir la relation entre la structure de la communauté microbienne et l’état de santé des arbres, nous avons obtenu des échantillons de rhizosphères et de tissus provenant d’arbres sains et d’arbres affichant des symptômes de tavelure. Nous avons utilisé le séquençage Illumina du gène 16S de l’ARNr et des amplicons de l’espaceur transcrit interne (ITS) pour examiner les communautés bactériennes et fongiques dans ces échantillons. Une analyse de la diversité alpha a montré qu’il n’y avait pas de différences significatives entre les sols sains et les sols infectés, tandis que la diversité fongique dans les tissus infectés était significativement plus élevée que dans les tissus sains (P < 0.01), ce qui suggère qu’un déséquilibre dans la flore fongique puisse être associé à la tavelure. La classification taxinomique et l’ampleur de l’effet de l’analyse discriminante linéaire (LEfSe) ont indiqué une augmentation de l’abondance relative de certains genres bactériens (Pseudomonas, Burkholderia, Sphingobium, Erwinia, Sphingomonas et Bradyrhizobium) et fongiques (Phoma, Penicillium, Fusarium, Cystobasidium, Aureobasidium et Nakazawaea) dans les tissus infectés (p < 0,05). Parmi ceux-ci, l’abondance relative accrue des bactéries Pseudomonas et Erwinia et des champignons Penicillium, Phoma et Fusarium peut être associée à la tavelure du cerisier. Les genres bactériens Burkholderia, Sphingobium, Sphingomomas et Bradyrhizobium sont probablement des antagonistes de l’agent ou des agents pathogènes causant la tavelure. Ces résultats constituent une première étape dans l’identification de candidats potentiels de lutte biologique contre la maladie.
Introduction
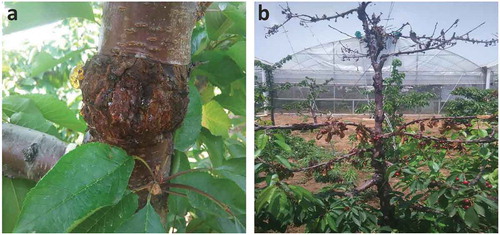
Cherries, characterized by their attractive appearance and delicious taste, are among the most popular fruits in China. Chinese cherry (Cerasus pseudocerasus [Lindl.] Loudon) is one of the most economically important domestic fruit trees in Shaanxi Province, China. However, in recent years, thousands of cherry trees in Bai Lu Yuan suffered from a serious disease, with symptoms that include protruding xylem, black nodular spots and gummosis of the trunk and branches. Local farmers call the condition ‘black pimple’ or ‘black spot’ disease (), and recognize it by a combination of symptoms that include crown gall, gummosis (Xu et al. Citation2015) and shoot blight (Cox et al. Citation2011). In fact, this black spot disease spreads quickly and the chances of infection are high, resulting in devastating impacts to cherry orchards. Current treatments are often ineffective, so it is important to determine the cause of the disease and develop efficient strategies for biological control.
Fig. 1 (Colour online) (a) Symptoms of black spot of cherry include protruding xylem, black nodular spots and gummosis of the trunk and branches; (b) A cherry tree killed by black spot
In agroecosystems, soil microorganisms play crucial roles in the formation of soil structure, decomposition of organic matter, cycling of primary elements and the stimulation of plant health and growth (Stroobants et al. Citation2014; Chen et al. Citation2016). In particular, plant species and the soil type are considered to shape the structure and function of microbial communities in the rhizosphere. For example, plants can recruit protective microorganisms after being attacked by pathogens or insects, and can suppress pathogens in the rhizosphere (Berg and Smalla Citation2009; Berendsen et al. Citation2012). It has been reported that microbial diversity in the rhizosphere is negatively correlated with the occurrence of soil-borne disease and positively correlated with the resistance of plants to pathogens. However, the full potential of disease suppressive microbial communities to control plant diseases has not yet been realized.
Although some biological agents have been used to prevent or treat black spot in other plants, the relationship between the microbial community and black spot is still not clear. One promising example was the use of Bacillus subtilis J18 to prevent and treat postharvest black spot of winter jujube (Ziziphus jujube Mill.), where a bacterial suspension with a concentration of 1 × 10⁸ CFU mL−1 was 80.67% effective against the disease (Song et al. Citation2016). The relationship between the microbial community and black spot is still not clear. A better understanding of the microbial ecology and diversity associated with healthy and diseased cherry trees would likely aid in the development of efficient biological control strategies. However, this requires a comprehensive investigation of the relevant microbial communities. It is a challenging task to fully characterize soil microbial communities using culture-dependent methods, because only a small fraction of soil microorganisms can be cultured (Smalla et al. Citation2007). Illumina sequencing technology overcomes this limitation and enables comprehensive sampling and the deep analysis of microbial communities. This facilitates the comparison of healthy and diseased soils and tissues. With Illumina sequencing, almost all of the community can be detected, not only culturable strains. However, there are some technical limitations with this technology due to the use of primers and PCR.
Thus, the objectives of this study were to use Illumina sequencing technology to (i) profile the main bacterial and fungal rhizosphere taxa associated with the soils and tissues of diseased and healthy cherry trees, (ii) investigate the differences between bacterial and fungal communities in healthy and diseased soils of cherry trees, and (iii) investigate the differences and relations between microbial communities of healthy and diseased tissues. The results should provide a more in-depth understanding of the pathogenic microorganisms associated with black spot disease of cherry trees, as well as suggesting possible options for biological control.
Materials and methods
Experimental design and soil sampling
Cherry plantations, located in Bai Lu Yuan, Shaanxi Province, China (34°14ʹ N, 109°08ʹ E), were chosen as sampling sites. The healthy orchard (approximately 1 ha) was located in Long Wan Village, where the incidence of black spot disease was almost zero. The diseased orchard (approximately 5.6 ha) was located in the cherry standard demonstration orchard of Xi Tang Village, where the incidence of black spot disease was greater than 90%. The two cherry orchards were approximately 10 km apart. The soil type in both orchards was loess, with a pH of 6.8–7.5. The soils and tissues were collected from the ‘Red Light’ variety (Cerasus pseudocerasus) that were approximately 6 years old (full productive age) in July 2014. The rhizosphere soil samples of healthy and diseased cherry trees (denoted as J1-J4, J6 and B1-B5, respectively), and the diseased and healthy inner bark epidermal tissues (denoted as JZ1-JZ5 and BZ5, BZ7, BZ8 and BZ10, respectively) were collected using a five-point sampling method. A soil sampler (5 cm diameter) took about 50 g of soil within 2 cm of capillary root. Each sampling point was sampled three times and mixed into one sample, and then the sample was ground and passed through a 2-mm sieve. The samples were collected in a sterile container and stored at 4°C and DNA extraction was performed within 48 hours.
DNA extraction, PCR amplification and MiSeq Illumina sequencing
The total genomic DNA of soil and tissue samples was extracted using a PowerSoil DNA extraction kit (MO BIO Laboratories, Carlsbad, CA, USA) according to the manufacturer’s instructions. The bacterial genomic DNA was amplified with 520 F and 802 R primers (Gyarmati et al. Citation2015) for the V4 hypervariable region of the 16S rRNA gene. The PCR amplification mixture consisted of 0.25 μL of Q5 high-fidelity DNA polymerase, 0.5 μL of dNTP, 5 μL of 5x reaction buffer, 5 μL of 5x high GC buffer, 1 μL of each primer and 1 μL of template DNA. Sterilized water was added to bring the final volume to 25 μL. The PCR amplification parameters were as follows: 98°C for 30 s, followed by 25 cycles of 98°C for 15 s, 50°C for 30 s, and 72°C for 30 s, and a final single extension at 72°C for 5 min. Amplicon libraries for the fungi were prepared using an identical approach, using primers ITSF and ITS2 (Tiina et al. Citation2012), which amplify the internal transcribed spacer (ITS) region. The samples were sequenced (PE250) on an Illumina MiSeq platform, provided by Shanghai Personal Biotechnology Co, Ltd. (Shanghai, China) according to the manufacturer’s instructions. Bacterial DNA amplification was not successful for sample J6, so a total of 18 bacterial datasets and 19 fungal datasets were obtained. All the sequence data were submitted to NCBI with accession numbers SRP227329 and SRP227328 for the bacteria and fungi, respectively.
Read filtering and data analysis
The sliding window method was used for filtering reads based on quality with reads with an average base sequencing accuracy less than 99% being filtered out. Paired-end reads were assigned to samples based on their unique barcode and merged using FLASH (v1.2.7) (Magoc and Salzberg Citation2011). USEARCH (v 5.2.236) was then used to check and remove chimeric sequences via QIIME software (v 1.8.0) (Caporaso et al. Citation2010). The UPARSE pipeline was used to select operational taxonomic units (OTUs) at 97% similarity. A representative sequence was selected for each OTU and used for taxonomic assignment by the Greengenes database for the molecular identification of bacteria (DeSantis et al. Citation2006) and the UNITE database of fungi (Koljalg et al. Citation2013) using QIIME software with default parameters.
Alpha diversity analysis at the OTU level was estimated using the Chao1, Shannon and Simpson indices, which were calculated using QIIME. Among them, Chao1 estimates the species richness, Simpson is a diversity index and Shannon contains richness and diversity information. Venn diagrams were generated using custom R scripts. Principal Component Analysis (PCA) was performed to analyse the community structure at the genus level using R software. By combining linear discriminant analysis (LDA) with non-parametric Kruskal-Wallis and Wilcoxon rank sum tests, LEfSe (linear discriminant analysis effect size) (Segata et al. Citation2011), which can automatically perform statistical analysis on each classification level and visualize the results, was performed by submitting the relative abundance matrix at the genus level through the Galaxy online analysis platform. Differences were considered significant with an LDA score > 2 and P < 0.05.
Results
Amplicon sequencing and community diversity overview
A total of 674 800 valid bacterial reads and 893 951 valid fungal reads were obtained from all the samples. The mean lengths of the bacterial and fungal sequences were 265.5 bp and 267.6 bp, respectively. The minimum read lengths of both were 130 bp and 127 bp, respectively, while the maximum read lengths were 455 bp and 448 bp, respectively. Operational taxonomic units (OTUs) are groups of organisms that share at least 97% rRNA gene sequence identity. The total number of OTUs of both bacteria and fungi was very high in the soils. The number of different phylogenetic bacterial OTUs in all samples ranged from 470 to 3395. The number of the fungal OTUs ranged from 95 to 589. The results of alpha diversity analysis showed that there was no significant difference in the abundance and diversity of bacteria and fungi in samples J and B. The index values of Simpson, Chao1 and Shannon of the bacteria in BZ were slightly higher than those of JZ. While for fungi the Simpson and Shannon indices for BZ were approximately three times higher than those of JZ (P < 0.01) ().
Changes in bacterial community structure at the phylum and genus level
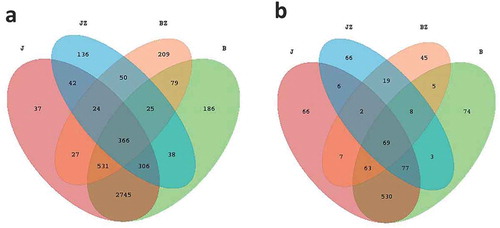
A Venn diagram () was generated to evaluate the distribution of OTUs among the different samples. This analysis indicated that 3948 OTUs (82.23% of all OTUs) were shared between B and J, and 466 OTUs (9.71% of all OTUs) were shared between JZ and BZ. The distribution of OTUs in demonstrates that the bacterial communities of JZ and BZ are substantially different. It is noteworthy that 79 bacterial OTUs were shared between BZ and B, and 209 and 186 OTUs were found exclusively in BZ and B, respectively.
Fig. 2 (Colour online) (a) Bacterial and (b) fungal Venn diagrams at the operation taxonomic units (OTUs) level. Venn diagrams showing the number of shared and unique OTUs (≥97’ similarity) among diseased soil, healthy soil, black spot diseased cherry tissues and healthy cherry tissue. B, diseased soil; J, healthy soil; BZ, diseased tissue; JZ, healthy tissue
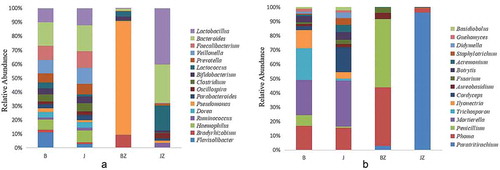
Proteobacteria was the most abundant phylum in all the samples, comprising 19.5–70.3% of the total valid reads in samples, with an average relative abundance of 32.1%. Firmicutes was the second most abundant phylum in all the samples with an average relative abundance of 21.7%. The other dominant phyla were Bacteroidetes (average of 15.3%), Cyanobacteria (8.2%), Actinobacteria (6.9%), Acidobacteria (4.1%), Planctomycetes (2.9%), Chloroflexi (1.6%) and Gemmatimonadetes (1.1%), based on average relative abundance (). In addition, the relative abundance of Proteobacteria in BZ was 70.3%, but it was only 23% in JZ. Similarly, the relative abundance of Actinobacteria in BZ was 10.1%, substantially higher than that in JZ (0.5%). However, Firmicutes and Cyanobacteria were significantly more abundant in JZ (30.6’ and 4’, respectively) than in BZ (31.7’ and 0.8’, respectively). At the genus level, the relative abundances of Pseudomonas and Bradyrhizobium were higher in BZ (averaging 26.5’ and 3.1’, respectively) than in those in JZ (0.2’ and 0’, respectively). Lactococcus, Lactobacillus and Bacteroides were less abundant in BZ than in JZ ().
Fig. 3 (Colour online) Relative abundance of the dominant groups of bacteria (a) and fungi (b) at the phylum level in soil and tissue samples from healthy and black spot diseased cherry trees. The longer the column, the higher the relative abundance of the taxon in the corresponding sample; B: diseased soil, J: healthy soil, BZ: diseased tissue, JZ: healthy tissue
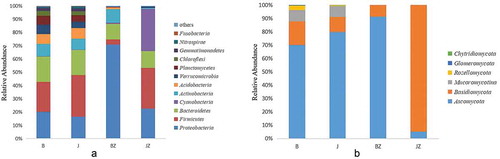
Fig. 4 (Colour online) Taxonomic classification of the dominant bacteria and fungi at the genus level in soil and tissue samples from healthy and black spot diseased cherry trees. Relative abundance of different bacterial (a) and fungal (b) genera within the different communities. The longer the column, the higher the relative abundance of the taxon in the corresponding sample. B: diseased soil, J: healthy soil, BZ: diseased tissue, JZ: healthy tissue
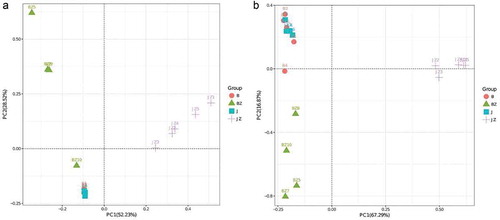
We also performed principal component analysis (PCA) on the relative abundance of bacterial genera to compare the community clustering in different samples (). The data are presented as a 2D plot to better illustrate their relationship. Principal components (PCs) 1 and 2 explained 52.23% and 28.52% of the variance, respectively. The results showed that J and B clustered together. JZ had a significantly higher PC1 value, but BZ had a significantly higher PC2 value.
Fig. 5 (Colour online) Bacterial (a) and fungal (b) principal component analysis (PCA) at the genus level in soil and tissue samples from healthy and black spot diseased cherry trees. Different colours represent different samples. The closer the distance between samples, the higher the similarity in microbial community structures between the two samples. The values for PCA 1 and 2 are percentages of variation. B: diseased soil, J: healthy soil, BZ: diseased tissue, JZ: healthy tissue
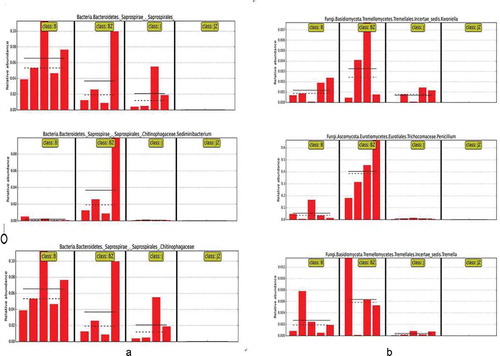
The LEfSe algorithm indicted that the average relative abundance of the bacterial order Saprospirales, family Chitinophagaceae and genus Sedimiuibacterium in B and BZ were higher than those in J and were not detected in JZ (). The algorithm was also applied to identify the bacterial taxa from all the OTUs that showed significantly different abundances between the JZ and BZ samples (). Compared with JZ, Geobacillus, Methylobacterium, Burkholderia, Sphingobium, Erwinia and Caulobacter in BZ increased by 21-fold, 20.7-fold, 10.8-fold, 120-fold, 960-fold and 7.7-fold, respectively. (P < 0.05). Streptomyces was only found in BZ. While the abundance of Bacillus, Acinetobacter, Oscillospira, Akkermansia and Desulfovibrio in JZ was much higher than those in BZ, increasing by 22.7-fold, 8-fold, 16.6-fold, 14.8-fold, and 25-fold, respectively.
Table 1. Alpha diversity of microbial communities in soil and tissue samples from healthy and black spot diseased cherry trees
Table 2. Significantly enriched bacterial genera detected by LEfSe analysis in healthy and black spot diseased cherry trees
Fig. 6 (Colour online) The relative abundance distribution of taxa with significant differences between groups in different sample groups (soil and tissue from healthy and black spot diseased cherry trees) at the operational taxonomic units (OTUs) level. The solid and dashed lines represent the average and median relative abundance, respectively. B: diseased soil, J: healthy soil, BZ: diseased tissue, JZ: healthy tissue
Changes in fungal community structure at phyla and genus level
In total, 1040 different fungal OTUs were identified in this study. A total of 739 OTUs (71.06% of all the OTUs) were shared between B and J, and 98 OTUs (9.42% of all the OTUs) were shared between JZ and BZ. Five fungal OTUs were shared between BZ and B, and 45 and 74 OTUs were found exclusively in BZ and B, respectively.
The dominant fungal phyla in all the samples were Ascomycota and Basidiomycota. Compared with the other samples, BZ had a significantly higher percentage of Ascomycota (averaging 91.3%). Basidiomycota was more abundant in JZ (averaging 94.3%). Mucoromycotina and Rozellomycota were not detected in tissues (). At the genus level, Penicillium and Phoma, with an average relative abundance of 34.7% and 30% in BZ, respectively, were significantly more abundant than in JZ. Paratritirachium were more abundant in JZ (88.3% abundance) than in BZ (2.9%). Trichosporon and Ilyonectria were more abundant in B than in J, while Cordyceps showed the opposite trend. The abundances of Phoma and Mortierella, differed less in J from B (). PCA analysis () indicated that the relative abundance of principal components (PC1 and 2) of the fungal genera explained 67.29% and 16.87% of the variance, respectively. The fungal communities of J and B were relatively similar, while the microbial community of JZ and BZ differed significantly.
The LEfSe algorithm indicated that average relative abundance of the fungal genera Kwoniella, Penicillium and Tremella in B and BZ were higher than those in J, while they were not detected in JZ (). This algorithm also indicated that there were significant differences in the relative taxonomic abundances between JZ and BZ (). Compared with JZ, Cystobasidium, Aureobasidium and Fusarium in BZ increased by 29-fold, 9-fold and 322-fold, respectively. Nakazawaea was only found in BZ. While Inocybe was much more abundant in JZ than in BZ. Ustilago and Sporobolomyces were only found in JZ.
Table 3. Significantly enriched fungal genera detected by LEfSe analysis in healthy and black spot diseased cherry trees
Discussion
The abundance of pathogens and beneficial microorganisms in the rhizosphere and plant tissues are relevant to plant health. We compared and contrasted microbial composition and diversity in rhizosphere soil of healthy trees (J), rhizosphere soil of diseased trees (B), diseased tissue (BZ) and healthy tissue (JZ) of Chinese cherry trees. By using Illumina MiSeq high-throughput sequencing, different microbial communities were identified in the rhizosphere soils and tissue of diseased and healthy cherry trees. In this study, the bacterial microbial diversity was slightly higher in B than in J, while the fungal microbial diversity was slightly lower in B than in J, and they clustered together. Therefore, the differences are not significant. This finding differed from that of a previous study conducted on roots of Panax notoginseng affected by rot, which showed that the microbial diversity was higher in soils around healthy roots than in soils near diseased roots (Wu et al. Citation2015). The microbial diversity was lower in JZ than in BZ. Multivariate analyses in this study enables us to gain a better understanding of the microbial communities associated with black spot.
After studying the diversity indices, we checked the changes in abundance at the phylum and genus levels. It was apparent that Proteobacteria was the predominant colonizer of the rhizosphere, consistent with the finding of other study (Deangelis et al. Citation2009). In our study, Proteobacteria comprised 19.5% of the total sequences in B, 16.2% in J, 70.3% in BZ and 22.6% in JZ, on average, indicating that bacteria from this phylum were much more abundant in BZ than in JZ (P < 0.001). Firmicutes, Actinobacteria, Bacteroidetes and Acidobacteria are also common phyla in the rhizosphere of various plants (Wu et al. Citation2015; Shang et al. Citation2016). Actinobacteria is a producer of antibiotics and is thought to play a fundamental role in the maintenance of soil ecosystems through the production of these metabolites (Wiedenbeck and Cohan Citation2011). Moreover, there was no significant difference among all the samples of Bacteroidetes. This could be because the numbers of Bacteroidetes are typically bulk-soil inhabitants that represent stable components of the microbial ecosystem, and tend to be less affected by nutrient changes (Kielak et al. Citation2008; Yergeau et al. Citation2008). Ascomycota was the most abundant fungal phylum, comprising an average of 69.4% of the total sequences in B, 78.1% in J, 91.3% in BZ and 5.2% in JZ. The abundance of Ascomycota in our rhizosphere samples was much higher than that reported in a previous study (O’Brien et al. Citation2005). Basidiomycota and Mucoromycotina were also found in B and J, while Mucoromycotina was not detected in BZ and JZ. Is it not clear whether the high abundance of the bacteria Saprospirales, Chitinophagaceae and Sedimiuibacterium and fungi Kwoniella, Penicillium and Tremella in B and BZ were responsible for the prevalence of the disease or whether the disease of cherry trees causes the increase in abundance of these bacteria. The causal relationship and interaction between them merit further study.
The abundance of major microorganisms in JZ and BZ was significantly different at the genus level. Taxonomic classification and LEfSe showed that 11 bacterial genera, including Geobacillus, Methylobacterium, Pseudomonas, Burkholderia, Sphingobium, Erwinia, Caulobacter, Sphingomonas, Streptomyces, Bradyrhizobium and Sediminibacterium were more abundant in BZ than in JZ. Among these, Pseudomonas and Erwinia have been widely reported to be closely related to the occurrence of plant disease. For example, Pseudomonas syringae was demonstrated to be the causal agent of cherry gummosis (Xu et al. Citation2015), and Latorre (Citation1979) reported that Pseudomonas morsprunorum can cause branch and stem cankers in sour cherry trees in Michigan. Erwinia species are known to infect a wide range of hosts within the family Rosaceae (apple, pear, quince, loquat, and many ornamentals) (López et al. Citation2011; Pester et al. Citation2012). Therefore, these two bacterial genera are likely to be potential factors responsible for black spot of cherry tree. It is worth noting that some beneficial bacteria with high abundance were present in the BZ, including Burkholderia, Sphingobium Sphingomonas and Bradyrhizobium. It is reported that Burkholderia could inhibit invasion from pathogenic bacteria (Lu et al. Citation2015). Sphingobium could promote crop resistance to various pathogenic bacteria (Adhikari et al. Citation2001). Sphingomonas and Bradyrhizobium are potential plant growth promoters and biocontrol agents (Innerebner et al. Citation2011; Rangel et al. Citation2017). Mehmood et al. (Citation2020) reported that sclerotia produced by the notorious soil-borne pathogen Sclerotinia sclerotiorum can improve soil health by inhibiting other pathogens and enhancing beneficial microorganisms. Therefore, we hypothesized that some microorganisms in BZ may produce substances conducive to the growth of beneficial bacteria, so that these beneficial bacteria become the dominant microorganisms and participate in the inhibition of the pathogen of black spot disease. Further studies are needed to determine if these beneficial bacterial genera are associated with the pathogen(s) of black spot of cherry trees.
The fungal genera Cystobasidium, Phoma, Aureobasidium, Penicillium, Fusarium, Nakazawaea and Tremella were more abundant in BZ than in JZ. Among these, Phoma glomerata is a known pathogen, causing bark lesions on kiwifruit branches (Margarita and Porta Citation1991). Gavrilović and Arsenijević (Citation2006) reported that Phoma sp. caused water-soaked dark green spots to appear on cherry fruits, and a leaf spot disease caused by Phoma herbarum was observed in a cherry plantation (Kumla et al. Citation2016). Penicillium crustosum can cause fruit rot of sweet cherries (López et al. Citation2016). Penicillium purpurogenum can produce toxins, which can inhibit plant growth and lead to death of Atractylodes (Zhu and Yang Citation2010). Fusarium oxysporum f. sp. cubense (Foc), a soil-borne fungus, infects banana roots, colonizes and occludes the xylem vessels, and causes a reddish-brown discoloration of the rhizome and pseudostem (Li et al. Citation2011). F. verticillioides, F. graminearum, F. culmorum and F. proliferatum and more recent but less significant species, including F. subglutinans, F. sporotrichioides and F. temperatum, could cause rots on maize (Summerell and Leslie Citation2011). Those fungal genera (particularly Penicillium, which was also in high abundance in B with 2.4%, and 0% in J) may be associated with black spot disease. In addition, the difference in diversity of fungi between JZ and BZ was greater than that of the bacteria (P < 0.01). Feng et al. (Citation2018) also reported that the community composition of fungi is more sensitive to root rot disease. Consequently, we hypothesized that the imbalance of fungal flora may be related to the incidence of black spot disease in cherry trees. Among these, the fungal genera Cystobasidium, Aureobasidium, Nakazawaea, Inocybe and Ustilago may play a more significant role than other fungi genera.
In conclusion, the high abundance of bacterial genera Pseudomonas and Erwinia and the fungal genera Penicillium, Phoma and Fusarium in BZ are closely associated with the blackspot of cherry tree. Second, the bacterial genera Burkholderia, Sphingobium and Bradyrhizobium are probably antagonists of the pathogen(s) causing black spot. In addition, we also found that the imbalance of fungal flora may be a potential cause of cherry tree disease. While further research is needed to confirm our results, this study represents the first step in the identification of candidates for biological control of black spot of cherry trees.
Additional information
Funding
References
- Adhikari TB, Joseph CM, Yang GP, Phillips DA, Nelson LM. 2001. Evaluation of bacteria isolated from rice for plant growth promotion and biological control of seedling disease of rice. Can J Microbiol. 47:916–924. doi:10.1139/w01-097.
- Berendsen RL, Corné MJP, Bakker PAHM. 2012. The rhizosphere microbiome and plant health. Trends Plant Sci. 17(8):478–486. doi:10.1016/j.tplants.2012.04.001.
- Berg G, Smalla K. 2009. Plant species and soil type cooperatively shape the structure and function of microbial communities in the rhizosphere. FEMS Microbiol Ecol. 68:1–13. doi:10.1111/j.1574-6941.2009.00654.x.
- Caporaso JG, Kuczynski J, Stombaugh J, Bittinger K, Bushman FD, Costello EK, Fierer N, Pena AG, Goodrich JK, Gordon JI, et al. 2010. QIIME allows analysis of high-throughput community sequencing data. Nat Methods. 7:335–336. doi:10.1038/nmeth.f.303.
- Chen Y, Yu D, Wang Y, Zhen W, Xie S, Yong L. 2016. Distribution of bacterial communities across plateau freshwater lake and upslope soils. J Environ Sci-China. 43:61–69. doi:10.1016/j.jes.2015.08.012.
- Cox KD, Villani SM, Raes JJ, Freier J, Faubert H, Cooley D, Clements J. 2011. First reports of brown fruit rot on sweet cherry (Prunus avium) and plum (P. domestica) and shoot blight on apricot (P. armeniaca), kwanzan cherry (P. serrulata), and sweet cherry (P. avium) caused by Monilinia laxa in New York, Rhode Island, and Massachusetts. Plant Dis. 95:1584. doi:10.1094/PDIS-07-11-0606.
- Deangelis KM, Brodie EL, Desantis TZ, Andersen GL, Lindow SE, Firestone MK. 2009. Selective progressive response of soil microbial community to wild oat roots. Isme J. 3:168–178. doi:10.1038/ismej.2008.103.
- DeSantis TZ, Hugenholtz P, Larsen N, Rojas M, Brodie EL, Keller K, Huber T, Dalevi D, Hu P, Andersen GL. 2006. Greengenes, a chime-ra-checked 16S rRNA gene database and workbench compatible with ARB. Appl Environ Microb. 72:5069–5072. doi:10.1128/AEM.03006-05.
- Feng YX, Hu YY, Wu JS, Chen JH, Yrjälä K, Yu WW. 2018. Change in microbial communities, soil enzyme and metabolic activity in a Torreya grandis plantation in response to root rot disease. Forest Ecol Manag. 432:932–941. doi:10.1016/j.foreco.2018.10.028.
- Gavrilović V, Arsenijević M. 2006. Tissue necrosis of sour cherry fruits, an unusual disease occurrence caused by a Phoma sp. in Serbia. Plant Dis. 90:680. doi:10.1094/PD-90-0680B.
- Gyarmati P, Kjellander C, Aust C, Kalin M, Öhrmalm L, Giske CG. 2015. Bacterial landscape of bloodstream infections in neutropenic patients via high throughput sequencing. Plos One. 10:e0135756. doi:10.1371/journal.pone.0135756.
- Innerebner G, Knief C, Vorholt JA. 2011. Protection of Arabidopsis thaliana against leaf-pathogenic Pseudomonas syringae by Sphingomonas strains in a controlled model system. Appl Environ Microb. 77:3202–3210. doi:10.1128/AEM.00133-11.
- Kielak A, Pijl AS, Van Veen JA, Kowalchuk GA. 2008. Differences in vegetation composition and plant species identity lead to only minor changes in soil-borne microbial communities in a former arable field. FEMS Microbiol Ecol. 63:372–382. doi:10.1111/j.1574-6941.2007.00428.x.
- Koljalg U, Nilsson HR, Abarenkov K, Tedersoo L, Taylor AFS, Bahram M, Bates ST, Bruns TD, Bengtsson-Palme J, Callaghan TM, et al. 2013. Towards a unified paradigm for sequence-based identification of fungi. Molecol. 22:5271–5277.
- Kumla J, Suwannarach N, Lumyong S. 2016. First report of Phoma leaf spot disease on cherry palm caused by Phoma herbarum in Thailand. Can J Plant Pathol. 38:103–106. doi:10.1080/07060661.2016.1149105.
- Latorre BA. 1979. Pseudomonas morsprunorum, the cause of bacterial canker of sour cherry in Michigan, and its epiphytic association with Pseudomonas syringae. Phytopathology. 69:335–339. doi:10.1094/Phyto-69-335.
- Li CY, Chen S, Zuo CW, Sun QM, Ye Q, Yi GJ, Huang BZ. 2011. The use of GFP-transformed isolates to study infection of banana with Fusarium oxysporum f. sp. cubense race 4. Eur J Plant Pathol. 131::327–340. doi:10.1007/s10658-011-9811-5.
- López MM, Roselló M, Llop P, Ferrer S, Christen R, Gardan L. 2011. Erwinia piriflorinigrans sp. nov., a novel pathogen that causes necrosis of pear blossoms. Int J Syst Evol Micr. 61:561–567. doi:10.1099/ijs.0.020479-0.
- López SN, Sangorrín MP, Pildain MB. 2016. Fruit rot of sweet cherries and raspberries caused by Penicillium crustosum and Mucor piriformis in South Patagonia, Argentina. Can J Plant Pathol. 38:511–516. doi:10.1080/07060661.2016.1243582.
- Lu XJ, Guan HL, Zhang ZY, Ma YC, Tang SK. 2015. Microbial distribution and 16SrRNA diversity in the rhizosphere soil of Panax notoginseng. Acta Microbiol Imm H Sin. 55:205–213.
- Magoc T, Salzberg SL. 2011. FLASH: fast length adjustment of short reads to improve genome assemblies. Bioinformatics. 27:2957–2963. doi:10.1093/bioinformatics/btr507.
- Margarita L, Porta PA. 1991. Phoma glomerata, a causal agent of bark lesions on branches of kiwifruit. Petria. 1:27–30.
- Mehmood MA, Zhao HZ, Chen J, Xie JT, Jiang DH, Fu YP. 2020. Sclerotia of a phytopathogenic fungus restrict microbial diversity and improve soil health by suppressing other pathogens and enriching beneficial microorganisms. J Environ Manage. 259. doi:10.1016/j.jenvman.2019.109857.
- O’Brien HE, Parrent JL, Jackson JA, Moncalvo JM, Vilgalys R. 2005. Fungal community analysis by large-scale sequencing of environmental samples. Appl Enviro Microb. 71:5544–5550. doi:10.1128/AEM.71.9.5544-5550.2005.
- Pester D, Milčevičová R, Schaffer J, Wilhelm E, Blümel S. 2012. Erwinia amylovora expresses fast and simultaneously hrpdsp virulence genes during flower infection on apple trees. Plos One. 7:e32583. doi:10.1371/journal.pone.0032583.
- Rangel WDM, de Oliveira Longatti SM, Ferreira PAA, Bonaldi DS, Guimaraes AA, Thijs S, Weyens N, Vangronsveld J, Moreira FM. 2017. Leguminosae native nodulating bacteria from a gold mine As-contaminated soil: multi-resistance to trace elements, and possible role in plant growth and mineral nutrition. Int J Phytoremediat. 19:925–936.
- Segata N, Izard J, Waldron L, Gevers D, Miropolsky L, Garrett WS, Huttenhower C. 2011. Metagenomic biomarker discovery and explanation. Genome Biol. 12:R60. doi:10.1186/gb-2011-12-6-r60.
- Shang QH, Yang G, Wang Y, Wu XK, Zhao X, Hao HT, Li Y, Xie Z, Zhang Y, Wang R. 2016. Illumina-based analysis of the rhizosphere microbial communities associated with healthy and wilted Lanzhou lily (Lilium davidii var. unicolor) plants grown in the field. World J Microb Biot. 32:1–15. doi:10.1007/s11274-016-2051-2.
- Smalla K, Oros-Sichler M, Milling A, Heuer H, Baumgarte S, Becker R, Neuber G, Kropf S, Ulrich A, Tebbe CC. 2007. Bacterial diversity of soils assessed by DGGE, T-RFLP and SSCP fingerprints of PCR-amplified 16S rRNA gene fragments: do the different methods provide similar results? J Microbiol Meth. 69:470–479. doi:10.1016/j.mimet.2007.02.014.
- Song C, Huang YL, Xie CX, Jie ZH, Song SS. 2016. Isolation and identification of the pathogen causing black spot disease in Dongzao fruits and study on the biocontrol. J Microbiol. 36:5. (In Chinese with english abstract).
- Stroobants A, Degrune F, Olivier C, Muys C, Roisin C, Colinet G, Bodson B, Portetelle D, Vandenbol M. 2014. Diversity of bacterial communities in a profile of a winter wheat field: known and unknown members. Microb Ecol. 68:822–833. doi:10.1007/s00248-014-0458-6.
- Summerell BA, Leslie JF. 2011. Fifty years of Fusarium: how could nine species have ever been enough? Fungal Divers. 50:135–144. doi:10.1007/s13225-011-0132-y.
- Tiina R, Mikko P, Taina P, Mäkipää R. 2012. Fungal community dynamics in relation to substrate quality of decaying Norway spruce (Picea abies [L.] Karst.) logs in boreal forests. FEMS Microbiol Ecol. 81:494–505.
- Wiedenbeck J, Cohan FM. 2011. Origins of bacterial diversity through horizontal genetic transfer and adaptation to new ecological niches. Fems Microbiol Rev. 35:957–976. doi:10.1111/j.1574-6976.2011.00292.x.
- Wu ZX, Hao ZP, Zeng Y, Guo LP, Huang LQ, Chen BD. 2015. Molecular characterization of microbial communities in the rhizosphere soils and roots of diseased and healthy Panax notoginseng. Anton Leeuw Int J G. 108:1059–1074. doi:10.1007/s10482-015-0560-x.
- Xu L, Wang JW, Chen X. 2015. Identification and pathogenicity detection of the cherry gummosis pathogen. Acta Phytopathologica Sinica. 45:350–355.
- Yergeau E, Schoondermark-Stolk SA, Brodie EL, Déjean S, DeSantis TZ, Gonçalves O, Piceno YM, Andersen GL, Kowalchuk GA. 2008. Environmental microarray analyses of Antarctic soil microbial communities. Isme J. 3:340–351. doi:10.1038/ismej.2008.111.
- Zhu HF, Yang B. 2010. Preliminary comparison of herbicidal activity of mycotoxins produced by lecanosticta acicola and four species in genus Mycosphaerella. J Southw Forest Univ. 30:33–36.