
Abstract
Sweet cherries (Prunus avium) are an economically important crop in British Columbia, Canada. Cherries are harvested and distributed locally and overseas, where seemingly healthy fruit can succumb to postharvest diseases if disease conditions are met. Disease mitigation includes pre-harvest controls such as disease prediction models, disease monitoring, and fungicide applications. Development of disease-prediction models requires an understanding of how host and environmental conditions can affect the quantity of pathogens; therefore, quick, sensitive and accurate methods for pathogen quantification are required. This study has identified Alternaria spp. and Botrytis cinerea as major contributors to sweet cherry rot in Kelowna, British Columbia, in 2016 and developed a novel duplex droplet digital PCR assay for the rapid, concurrent quantification of the two pathogens. The assay involves the amplification of two abundant target regions, the internal transcribed spacer, and the intergenic spacer, in Alternaria spp. and B. cinerea, respectively. The detection limit was 0.1 pg of DNA for each target. The assay was validated during the 2016 and 2017 growing seasons at the bud break (2017 only), full bloom, petal fall, onset of straw colour and harvest stages of sweet cherry. In general, pathogen quantities were lowest at petal fall and highest during late season. The method can be used in future studies to evaluate pathogen quantities during the growing season and to facilitate the development of disease-prediction models and mitigation practices for growers.
Résumé
Les cerises douces (Prunus avium) sont une culture de grande importance économique en Colombie-Britannique, au Canada. Les cerises sont récoltées et vendues localement ainsi qu’à l’étranger où des fruits apparemment sains développent des maladies d’après récolte si les conditions sont réunies. Les mesures d’atténuation de la maladie incluent des moyens de lutte appliqués avant la récolte tels que les modèles de prévision des maladies, le suivi des maladies et l’application de fongicides. Le développement de modèles de prévision des maladies requiert de comprendre comment l’hôte et les conditions environnementales peuvent influencer le nombre d’agents pathogènes. Par conséquent, des méthodes rapides, sensibles et précises pour quantifier les agents pathogènes sont nécessaires. Cette étude a identifié, en 2016, Alternaria spp. et Botrytis cinerea comme principaux responsables de la pourriture grise chez les cerises douces à Kelowna, en Colombie-Britannique, et a contribué à développer un nouveau test par PCR numérique en gouttelettes utilisé en duplex pour quantifier rapidement et simultanément les deux agents pathogènes. Le test implique l’amplification de deux régions cibles abondantes, soit l’espaceur transcrit interne et l’espaceur intergénique d’Alternaria spp. et de B. cinerea, respectivement. La limite de détection était de 0,1 pg d’ADN pour chaque cible. Le test a été validé durant les saisons 2016 et 2017 au débourrement (2017 seulement), à la pleine floraison, à la post-floraison, à l’apparition du jaune paillé et aux différents stades de la récolte des cerises. En général, le nombre d’agents pathogènes était le plus petit durant la post-floraison et le plus grand, tard dans la saison. La technique peut être utilisée au cours d’études ultérieures pour évaluer le nombre d’agents pathogènes durant la saison de croissance et pour faciliter le développement des modèles de prévision des maladies ainsi que pour simplifier l’application des mesures d’atténuation pour les producteurs.
Introduction
Prunus avium L. (sweet cherry) is an economically important crop in British Columbia (BC), Canada, and its fruit is distributed locally and overseas. As of 2017, BC produced 23,484 tonnes of sweet cherry on 1942 hectares (BC Ministry of Agriculture Citation2017). Sweet cherry orchards currently account for roughly 22% of the land used for tree fruits (BC Ministry of Agriculture Citation2014) and cherry exports from BC totalled 107.5 USD million in 2018, with the top export markets being the United States and China (BC Ministry of Agriculture Citation2018). After harvesting, the fruit is placed in cold storage (on-land facilities or on ships) for up to 6 weeks, allowing ample time for postharvest rot caused by fungal pathogens to develop. Some fungi can penetrate into the host tissue and remain dormant until after harvest when host physiological changes allow for renewed growth (Barkai-Golan Citation2001). These latent infections can cause serious economic loss from seemingly healthy fruit (Barkai-Golan Citation2001). The major postharvest fungal pathogens of sweet cherry are species of Monilinia, Botrytis, Alternaria, Rhizopus, Mucor and Penicillium (Barkai-Golan Citation2001; Wani et al. Citation2014; Tarbath et al. Citation2014; BC Tree Fruit Production Guide Citation2017). Monilina fructicola (G.Winter) Honey is considered as the major postharvest pathogen of sweet cherry in many regions; however, it is usually adequately controlled by preharvest applications of registered fungicides in BC. In contrast, there are currently no registered fungicides for use against Alternaria spp. on sweet cherry in Canada, and only one (Fontelis, active ingredient penthiopyrad) for use against Botrytis cinerea Pers. Fungicides that are used to control other pathogens in the field may unintentionally provide some control of these diseases (Elmhirst Citation2006; BC Tree Fruit Production Guide Citation2017). Repeated and frequent use of chemical controls comes with the risk of development of fungicide resistance. Resistance to a variety of fungicides in isolates of B. cinerea and Alternaria spp. from both annual and orchard crops has been reported (Ma et al. Citation2003; Iacomi-Vasilescu et al. Citation2004; Fairchild et al. Citation2013; Avenot and Michailides Citation2015; Yin et al. Citation2018; Delong et al. Citation2020). Recently, Larrabee (Citation2019) showed that isolates of Alternaria spp. and B. cinerea from Okanagan cherry orchards were resistant to two commonly used fungicides, Elevate® (active ingredient: fenhexamid) and Pristine® (active ingredients: boscalid and pyraclostrobin) registered for use against Monilinia spp. in stone fruit. These pathogens have become problematic in the Okanagan Valley.
Public concerns about the impact of fungicides on environmental and human health are rising and therefore, measures should be taken to use fungicides more efficiently by developing precision-based application technology (Janisiewicz and Korsten Citation2002). This may include the development and use of disease prediction models that recommend application of fungicides only at high disease pressure, thereby reducing fungicide application frequency. Additionally, disease prediction models can indicate times when other cultural practices can be implemented for those diseases that do not have, or have few, registered fungicides (e.g., Alternaria spp. on sweet cherry). Prediction models have been developed for Alternaria spp. and B. cinerea in other crops. A model for targeted fungicide applications to control alternaria leaf blight of carrot has been validated in California (Gillespie Citation1979) and a B. cinerea prediction model, when used in a web-based disease forecasting system for strawberry growers, effectively controlled disease, and maintained yield while substantially reducing fungicide application frequency (Cordova and Schnabel Citation2017).
Understanding the presence and quantity of the pathogen is required to successfully predict disease risk during the growing season (Michailides et al. Citation2010). Methods for quantifying fungal pathogens have relied on microscopic spore counts, the induction of symptoms in a latent infection and molecular techniques (Holz et al. Citation2003; Gell et al. Citation2009; Michailides et al. Citation2010; Pavón et al. Citation2012; Sanzani et al. Citation2012; Leiminger et al. Citation2014). Microscopic spore counts are time-consuming and may require extensive knowledge of fungal spore morphology to distinguish species. Induction of latent infection can only provide an estimate of the potential for rot development during storage of fruit and may be affected by external factors, such as other fungi concealing the presence of the pathogen, fruit maturity, recent fungicide application and storage conditions (Sanzani et al. Citation2012). Molecular techniques, such as quantitative PCR (qPCR) and droplet digital PCR (ddPCR), can be used throughout the growing season regardless of fruit maturity, making them a suitable option for quantifying pathogens for use in disease-prediction models. Molecular methods are often faster and less laborious, have higher throughput, and can remove the difficulty of morphologically differentiating species.
Droplet digital PCR (ddPCR) is a technology used for the absolute quantification of target sequences. The PCR reaction is partitioned into over 20,000 water-in-oil droplets, such that some droplets will contain template DNA (positive droplets) and some will not (negative droplets) (Hindson et al. Citation2011; Whale et al. Citation2016). A singlet ddPCR reaction shows two distinct populations in the one-dimensional (1D) plot: positive droplets that have high fluorescence and negative droplets that have low fluorescence (Whale et al. Citation2016). Droplets with intermediate fluorescence between the positive and negative droplets are defined as ‘rain’ (Weerakoon et al. Citation2016; Whale et al. Citation2016). The partitioning of PCR reactions into droplets dilutes PCR inhibitors and non-target DNA, thereby increasing tolerance to PCR inhibitors and increasing the ratio of target to primer per droplet, which allows for increased sensitivity to low target molecules (Selvaraj et al. Citation2019). In contrast to quantitative PCR (qPCR), partitioning the polymerase chain reaction during ddPCR allows quantification to be statistically assessed independent of a calibration curve and amplification efficiency (Whale et al. Citation2016; Selvaraj et al. Citation2019).
To save on cost and time, ddPCR can be multiplexed with a single colour DNA-binding dye, EvaGreen, which fluoresces when associated with double-stranded DNA, resulting in the simultaneous amplification of two or more targets within the same reaction (McDermott et al. Citation2013; Whale et al. Citation2016). The assay must be designed such that different target amplicons fluoresce at different amplitudes when multiplexing with EvaGreen. The level of EvaGreen fluorescence is dependent on the mass of DNA present, thus, assays must be designed so that the final mass of DNA between the targets is different (McDermott et al. Citation2013). This can be achieved by differences in amplicon length, optimal annealing temperature, or primer set concentration, because each impacts the amount of amplicon generated within each droplet and therefore the fluorescence amplitude of positive droplets (McDermott et al. Citation2013). A two-dimensional (2D) plot can be generated where if the DNA concentration is high enough, the plot should show four distinct clusters (a cluster is a group of droplets fluorescing at the same amplitude): negative droplets, positive droplets with the lower fluorescing amplicon, positive droplets with the higher fluorescing amplicon, and double positive droplets with both amplicons (Whale et al. Citation2016).
The sensitivity of ddPCR makes it an ideal technique to quantify fungal pathogens, which may be present at lower concentrations. Understanding of when and in what quantities fungal pathogens are present in an orchard will provide beneficial information for the application of control practices, such as targeted fungicide applications and/or the application of other cultural practices. The objectives of this study were to (1) determine the dominant pathogens in the Okanagan Valley, BC, (2) develop a duplex ddPCR assay that quantifies two of these pathogens simultaneously, and (3) validate the assay by quantifying the pathogens on sweet cherry at different growth stages (bud break, full bloom, petal fall, onset of straw colour, harvest) in a local orchard. This method can be used in future experiments to help understand pathogen presence during the sweet cherry growing season in relation to environmental and biological factors.
Materials and methods
Field sites
Five commercial cherry orchards located in the Okanagan Valley, BC, were sampled in 2016 (). Sampling sites were selected to span the Central and Northern Okanagan regions. Different cherry varieties were sampled to expand the sampling range. Additional postharvest cherries from other orchards in the Okanagan Valley were donated by BC Tree Fruit Co-operative (BCTFC, Winfield, BC) for use in fungal pathogen isolation and subsequent assay development.
Table 1. Summary of cherry varieties sampled from each orchard
Pre-harvest isolation of fungal pathogens
The overnight-freezing incubation technique (ONFIT) outlined by Sanzani et al. (Citation2012) was used with modifications to isolate fungal pathogens that expressed latent infection in cherry fruit from the research orchards () approximately 3 weeks before harvest. Twenty cherries were randomly collected from five trees at each sampling site, were surface sterilized for 2 min in 2% sodium hypochlorite solution, rinsed in sterile distilled water for 1 min and allowed to dry at room temperature on paper towel for 1 h. The cherries from each site were divided into five replicates containing four cherries each and placed in Ziplock bags. The cherries were placed in a − 20 °C freezer for 2 h before incubation at 22 °C for 7 d. Starting from the second day of incubation, samples of visible fungal growth were collected every 2 days. Lesions from infected cherries were excised and placed on acidified potato dextrose agar (PDA) (15 g of potato dextrose broth, 15 g of agar, 1 L of ddH20 and the pH was adjusted to 3.5 using lactic acid). Fungi were re-isolated twice via hyphal-tip transfer on alkaline water agar containing the antibiotic streptomycin (15 g of agar, 0.8 mL of 1.0 N NaOH, 1 mL of 100 mg mL−1 streptomycin sulphate, 1 L of ddH20) to obtain pure cultures. Fungi were maintained on ½-strength PDA (12 g of potato dextrose broth, 15 g of agar, 1 L of ddH2O). Additional postharvest cherries that had been in storage were supplied by BCTFC. Lesions on symptomatic fruit were excised and purified as described. The purified cultures were visually examined, grouped by morphological characteristics (mycelial growth pattern, structure and colour, conidia shape and colour) into genus, and stored at 4 °C (Tarbath et al. Citation2014). Eight isolates representative of Alternaria (BaSe04, BhS03, BSt01, CSe05, DS01, DSt03, DSt04, PBStu) and six isolates representative of Botrytis (BSt03, P201, P403, P501, P601, P701) were selected for identification based on DNA sequencing.
Fungal identification
Fungal DNA was extracted from the representative isolates by transferring a loopful of newly grown mycelium directly into disrupter tubes supplied with the EZNA Universal Pathogen Kit following the manufacturer’s guidelines (Omega-Biotek, CA). Fungal isolates were identified based on rDNA internal transcribed spacer (ITS) sequence analysis (White et al. Citation1990). For sequencing, 3 μL of pure genomic DNA extract (~ 2 ng uL−1) were used as a template in a 25-μL PCR reaction containing 0.26 μL of 5 U μL−1 GoTaq DNA polymerase (Promega, Madison, WI), 5 μL of 5X GoTaq Green Master Mix (Promega), 2.5 μL of 25 mM MgCl2, 0.5 μL of each 10 mM dNTP and 0.5 μL of each 10 μM ITS1 and ITS4 primers (White et al. Citation1990). The following cycling conditions were used: an initial denaturation at 94 °C for 3 min followed by 34 cycles of denaturation at 94 °C for 40 s, annealing at 54 °C for 34 s, extension at 68 °C for 40 s, and a final extension at 68 °C for 10 min. Electrophoresis on a 1% agarose gel was done to visually confirm the size of PCR amplified products.
Sanger sequencing of PCR products was conducted by Fragment Analysis and DNA Sequencing Services (UBC, Kelowna, BC). Forward and reverse sequences were obtained and edited using Sequencher (Ann Arbour, MI). The sequences were trimmed at each end to remove poor-quality data, assembled into contigs of approximately 450 bp, and the resulting chromatograms were edited. The edited sequences were referenced against published DNA sequences in Genbank using the nucleotide Basic Local Alignment Search Tool (BLASTn). Isolates were identified to a species level if they had >99% sequence similarity, isolates that had a high sequence similarity (>97.5%) to many accessions from different species within the same genus were identified at genus level.
DdPCR assay development
DNA extraction
Single isolates of Alternaria spp. (DSt04) and Botrytis cinerea (BSt03) were used for assay development; whereas, at least three different isolates of each pathogen were used for detection limit tests. DNA extractions for ddPCR analyses were performed using the EZNA Universal Pathogen Kit (Omega-Biotek). DNA was extracted from fungal mycelia by transferring a loopful of mycelium directly into disrupter tubes supplied with the kit following the manufacturer’s guidelines. Fungal conidia were obtained by flooding plates containing fungal cultures with 25 mL of sterile water and gently scraping the surface of the culture with a plate spreader. The suspension was vacuum-filtered to separate spores. The concentration of spores per mL was determined using a haemocytometer and the spore solution was diluted with sterile water to the desired concentration. DNA extractions from spore suspensions were performed following the manufacturer’s guidelines, except the samples were bead milled in the disrupter tubes with a Retsch Mixer Mill Type MM 301 (Retsch, Germany) twice for 90 s at 30 hz with a 1 min cooling period in between to enhance DNA extraction. A Nanodrop ND 1000 spectrophotometer (Thermo Fisher Scientific, USA) was used to assess DNA quality and quantity.
Primer selection and verification
The genus level primers Dir1ITSAlt and Inv1ITSAlt were selected to quantify Alternaria spp. () (Pavón et al. Citation2011). The primers hybridize to the internal transcribed spacer regions (ITS1 and ITS2) of Alternaria spp. and produce an amplicon of about 370 bp, depending on the species. The primers Bc3 and Bc3R were selected to quantify Botrytis cinerea () (Suarez et al. Citation2005). The primers bind to the intergenic spacer (IGS) of the nuclear ribosomal DNA and produce an amplicon of 95 bp.
Table 2. Sequence of primers and their target selected for the detection and quantification of Alternaria spp. and Botrytis cinerea.
Conventional PCR (cPCR) was used to test for primer set cross-reactivity and to ensure the correct amplicon size was generated. Fungal mycelial DNA was extracted from cultures of Alternaria sp. (DSt04) and B. cinerea (BSt03) as described. No DNA template controls (NTC) were used in all assays. Conventional PCR samples were prepared by adding 6 μL of PCR buffer, 3.0 μL of 10 mM dNTPs, 0.6 μL of each 20 μM forward and reverse primer, 0.2 μL of DNA polymerase, 1.0 μL of template DNA (~ 3 ng uL−1) and nuclease-free H2O to a final volume of 30 μL. The following cycling conditions were used: an initial denaturation at 94 °C for 1 min, followed by 35 cycles of denaturation at 94 °C for 30 s, annealing at 55 °C for 30 s, an extension at 68 °C for 45 s, and a final extension at 68 °C for 5 min. PCR amplification of products was visually confirmed using electrophoresis on a 1% agarose gel.
Optimization of singlet ddPCR assays with EvaGreen
DdPCR assays were optimized for each pair, and then optimized as a duplex using the same mycelial DNA extracted for cPCR. A singlet ddPCR reactions were prepared in 8-well strips by adding: 11 μL of EvaGreen, 1 μL each of forward and reverse primer (2.2 μM), 1 μL of template DNA (~ 3 ng uL−1) and 8 μL of H2O for a reaction volume of 22 μL for each sample. Nuclease-free water was used as a no template control (NTC). The final concentrations of the primers was 100 nM. Twenty microlitres of each PCR reaction were transferred to the sample wells of the DG8TM cartridge and 70 μL of droplet generator oil were transferred into the oil wells. The cartridge was covered using a DG8TM gasket and placed into the QX100 Digital Droplet Generator (Bio-Rad, Hercules, CA). Once the droplets were generated, they were transferred to a PCR plate, which was then heat-sealed with foil using a PX1 PCR Plate Sealer (Bio-Rad). DdPCR was optimized under the following conditions: initial enzyme activation period of 5 min at 95 °C, 40 cycles of denaturation for 30 s at 95 °C and annealing/extension for 1.20 min at thermal gradient ranging from 49.7 °C to 60 °C to determine optimal annealing temperature for each primer pair, dye stabilization for 5 min at 4 °C, 5 min at 90 °C, ramp rate 2.5 °C/s. Reaction data were collected on a QX200 Digital Droplet Reader (Bio-Rad) and were analyzed using QuantaSoft software (Bio-Rad). Prior to duplex optimization, the primers were tested for cross-reactivity using singlet ddPCR by combining target DNA with the non-target primer sets.
Optimization of a duplex ddPCR assay with EvaGreen
The duplex ddPCR reaction was prepared as described above; however, both primer sets were added to the master mix and the reaction volume was kept at 22 μL. Optimization was focused on the annealing/extension temperatures and final primer concentrations. A temperature gradient ranging from 49 °C to 60 °C was used during the annealing/extension step and primer concentrations were optimized by testing the primers (Bc3/Bc3R:Dir/Inv1ITSAlt) in 1:1, 1:3, and 1:5 ratios by adding primer sets to a final concentration of 100:100 nM, 50:150 nM, and 30:150 nM.
The finalized duplex reaction was as follows: PCR samples were prepared in 8-well strips by adding: 1 μL of Dir1ITSAlt (3.3 μM), 1 μL of Inv1ITSAlt (3.3 μM), 1 μL of Bc3 (1.1 μM), 1 μL of Bc3R (1.1 μM), 1 μL of template DNA, 11 μL of EvaGreen and 6 μL of water (22 μL sample). The final concentration of the Dir/Inv1ITSAlt and Bc3/Bc3R primers were 100 nM and 50 nM, respectively. PCR was performed under the following conditions with a ramp rate of 2.5 °C s−1: 5 min at 95 °C; 30 s at 95 °C and 1.2 min at 59 °C x 40; 5 min at 4 °C; 5 min at 90 °C.
Detection limits
The optimized duplex ddPCR detection limit was determined using serial dilutions of mycelial DNA and spore solutions. Ten-fold serial dilutions of Alternaria spp. and B. cinerea mycelial genomic DNA ranging from 0.1 to 0.00001 ng μL−1 were prepared and one microlitre of each DNA concentration was used as template in the ddPCR reaction mix. To determine the spore detection limit, spore concentrations for each pathogen were quantified using a haemocytometer and adjusted to the desired concentration using sterile water. Ten-fold serial dilutions of spore suspensions ranging from 0 to 100 000 spores per 100 μL were prepared and 100 μL of each suspension were used to isolate DNA as described above. One μL of extracted DNA was used as template. The experiments were repeated three times, each with different isolate(s).
To determine the inoculated-spore detection limit, which reflects the number of spores that can be detected from the surface of cherries, cherries were surface-sterilized as previously described. The sterilized, unwounded cherries were divided into treatment groups of 10 cherries each. Spore suspensions of a mixture of isolates of each pathogen containing 10 000, 5000, 2500, 1250, 625, and 312.5 spores per 50 μL were prepared, and the 50-uL spore suspension was pipetted evenly over the surface of the 10 cherries in a sterile hood. The control treatments received 50 μL of sterile water. Inoculation drops were allowed to air dry before submerging each group of 10 cherries in 0.1% Tween-80 solution and shaking for 30 min at 150 rpm. The solution was then decanted into 250-mL centrifuge tubes and centrifuged at 3220 × g for 20 min. The supernatant was pipetted off and the pellet transferred to a sterile 1.5-mL centrifuge tube and centrifuged for 3 min at 12 000 × g. The supernatant was decanted and the pellet re-suspended in 200 μL of deionized water. The entirety of the 200-μL solution was pipetted into the EZNA disrupter tubes and DNA extraction was performed as described above. Duplex ddPCR was completed using the finalized reaction. The experiment was repeated three times.
Validating method in the orchard
The application of the duplex ddPCR assay was validated on cherry tissues sampled from Orchard 2 () at different growth stages (bud break (2017 only), full bloom, petal fall, onset of straw colour, and harvest) in 2016 and 2017. Samples from 2016 were separated into the last four growth stages, if they were at or near that stage. At each sampling event, five cherry trees (n = 5) from the site were randomly selected, and 10 buds, blossoms, or fruit were randomly collected from each tree. Samples were stored in Ziplock bags and immediately placed on ice until storage at −80 °C. Spores and/or mycelium on the surface of the ten buds/blossoms/fruit were collected by agitation in 0.1% Tween-80 solution as described above for the inoculated-spore detection limit, and the DNA was extracted and duplex ddPCR performed as described. The quantification data were expressed as target copies per 10 buds/blossoms/fruit.
Statistical analysis
Statistically significant differences in pathogen quantities between sweet cherry growth stages were determined by one-way analysis of variance (ANOVA) and means were separated by Tukey’s Honestly Significant Difference (HSD) test using R statistical software (R Core Team Citation2017). Data were log transformed and assessed for normality using QQ-plots of the residuals and the Shapiro-Wilk test. Homogeneity of variance was assessed using Levene’s test.
Results
Fungal pathogen identification
The modified ONFIT method was used to identify the major postharvest pathogens of sweet cherry in the Okanagan Valley. Because of the sampling design of the ONFIT assay (repetitively sampling the same cherries over a 7-day period to ensure selection of slow-growing fungi) it was not possible to state in total how often each pathogen was isolated, due to the likelihood of re-isolating the same pathogen over the duration of the experiment. Instead, the number of replicates in which each morphologically identified pathogen was isolated at least once in 2016 is summarized in . Alternaria spp. were isolated from all orchards, B. cinerea was isolated from Orchard 2, Cladosporium was isolated from Orchard 3, and Fusarium was isolated from Orchard 2. Fusarium and Cladosporium are not considered to be major postharvest pathogens of sweet cherry in British Columbia, whereas Botrytis and Alternaria are; thus they were selected for study (BC Tree Fruit Production Guide Citation2017). As B. cinerea was isolated from only one orchard, postharvest cherries provided by BCTFC were used to select additional B. cinerea isolates to use for assay development. The identification of the Alternaria spp. and B. cinerea isolates was confirmed by DNA sequencing.
Table 3. Assessment of latent fungal infections in cherries from five Okanagan orchards using the overnight freezing incubation technique (ONFIT)
Primer verification and singlet ddPCR
Conventional PCR verified the amplification of the ITS and IGS regions according to . Each primer set amplified the correct length of DNA from the mycelial DNA and no cross reactivity was detected between the primer sets using cPCR ().
Fig. 1 PCR amplicons of conventional PCR of Alternaria and Botrytis cinerea mycelial DNA used to determine primer specificity. Lanes: 1: DNA ladder, 2: B. cinerea with Bc3/Bc3R primers (specific), 3: B. cinerea NTC, 4: Alternaria with Bc3/Bc3R primers (non-specific), 5: Alternaria with Dir/Inv1ITSAlt primers (specific), 6: Alternaria NTC, 7: B. cinerea with Dir/Inv1ITSAlt primers (non-specific). NTC = no template control
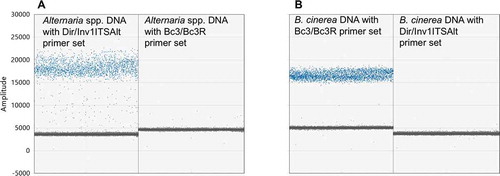
Positive and negative droplets were identified using singlet ddPCR and the optimal temperature range for the Dir/Inv1ITSAlt primer set was 56 °C to 60 °C, which resulted in the best separation between positive and negative droplets and reduced rain compared to lower temperatures (). The Bc3/Bc3R primer set showed strong droplet separation at all temperatures (). The primers were tested for cross-reactivity using an annealing temperature of 56 °C based on the thermal gradient results, and the test confirmed that there was no cross-reactivity between primer sets ().
Fig. 2 (Colour online) Optimization of primer annealing temperature for singlet ddPCR using a temperature gradient from 60–49 °C from left to right for (a) Dir/Inv1ITSAlt (Alternaria spp.) primers and (b) Bc3/Bc3R (B. cinerea) primers. Numbers indicate temperature in degrees Celsius. NTC = no template control
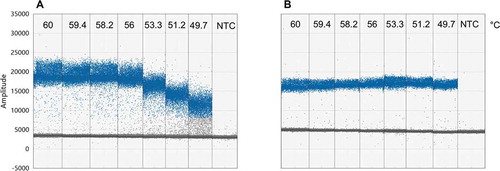
Fig. 3 (Colour online) DdPCR of Alternaria and Botrytis cinerea mycelial DNA to assess primer specificity. (a) Alternaria. First column: Alternaria mycelial DNA with Dir/Inv1ITSAlt (Alternaria spp.) primers. Second column: mycelial DNA with Bc3/Bc3R (B. cinerea) primers. (b) Botrytis cinerea. First column: mycelial DNA with Bc3/Bc3R primers. Second column: mycelial DNA with Dir/Inv1ITSAlt primers. There is no cross reactivity of primer sets
Duplex ddPCR assay with EvaGreen
The Dir/Inv1ITSAlt primer concentration (producing a large amplicon) was increased to 150 nM, and the Bc3/Bc3R primer concentration (producing a small amplicon) was decreased to either 50 or 30 nM to separate both targets. A temperature gradient (56 - 62 °C) was used to determine which annealing temperature would result in the best separation of the clusters in the duplex reaction. ().
Fig. 4 (Colour online) Duplex ddPCR assay using a final concentration of 150 nM Dir/Inv1ITSAlt (Alternaria) primers and 30 or 50 nM Bc3/Bc3R (Botrytis cinerea) primers. (a) 1D droplet plot representing duplex assays with 30 nM Bc3/Bc3R primers and an annealing temperature gradient ranging from 62–56 °C from left to right. Target clusters are well separated; however, the B. cinerea cluster is close to the negative cluster and merges with the negative cluster at higher temperatures. (b) 1D droplet plot representing duplex assays with 50 nM Bc3/Bc3R primers and an annealing temperature gradient from 62–56 °C from left to right. Target clusters remain well separated and the B. cinerea cluster shifted away from the negative cluster at temperatures under 60 °C. Numbers indicate temperature in degrees Celsius. Based on these results, a Bc3/Bc3R primer concentration of 50 nM and an annealing temperature of 59 °C were chosen for the optimized assay
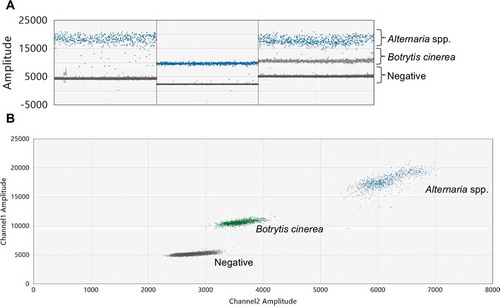
The Bc3/Bc3R primer concentration of 30 nM shifted the B. cinerea cluster close to the negative droplets; however, the separation between the two target clusters remained distinct (). The Bc3/Bc3R primer concentration of 50 nM kept the separation between the target clusters and shifted the B. cinerea cluster away from the negative droplets; therefore, 50 nM was chosen as the Bc3/Bc3R primer concentration for the optimized assay (). The B. cinerea cluster merged with the negative droplets at high temperatures and rain increased between the Alternaria spp. and B. cinerea clusters at lower temperatures; therefore, 59 °C was selected as the annealing/extension temperature for the optimized assay. The optimized ddPCR results are shown in . There was a clear separation between the target clusters in the 1D plots (). The 2D plot showed the separation of the clusters on the x- and y-axes ().
Fig. 5 (Colour online) Optimized duplex ddPCR reaction mix containing 150 nM of Dir/Inv1ITSAlt primers and 50 nM of Bc3/Bc3R primers and an annealing temperature of 59 °C. (a) 1D plot representing singlet Alternaria amplification (first column), singlet Botrytis cinerea amplification (second column) and duplex amplification (third column). (b) 2D plot representation of duplex amplification
Detection limits and validation in the orchard
The optimized duplex assay detected as little as 0.1 pg of each fungal template DNA (). The assay also detected as little as 100 spores from an aqueous spore suspension, or 312.5 spores washed from the surface of inoculated cherry fruit (). The frequency indicates the number of independent experiments (out of 3) that detected the fungus.
Table 4. DNA and spore detection limits for the optimized duplex assay
Table 5. Alternaria spp. and B. cinerea quantities at four growth stages in 2016 and five growth stages in 2017 from an orchard (Orchard 2) in the Okanagan Valley
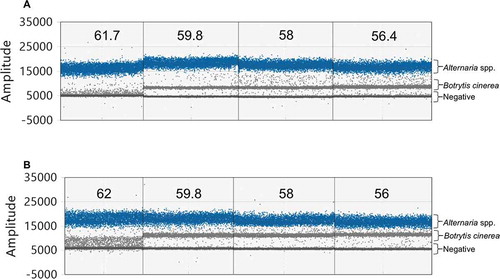
Each growth stage tested: bud break, full bloom, petal fall, onset of straw colour and harvest, resulted in successful duplex ddPCR DNA quantification of both pathogens (). Although the environmental samples had more rain between clusters compared to laboratory samples (), the separation of the clusters remained distinct.
Fig. 6 (Colour online) 2D plots of the optimized duplex ddPCR assay quantifying the abundance of Alternaria spp. and Botrytis cinerea from the surface of 10 sweet cherry buds from one tree at bud break (a), 10 blossoms at full bloom (b), 10 immature fruit at petal fall (c), 10 immature fruit at onset of straw colour (d) and 10 mature fruit at harvest (e) from Orchard 2 in 2017
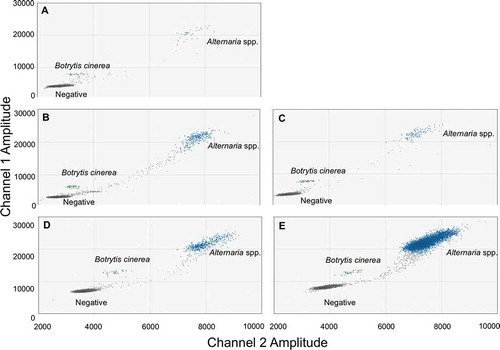
In general, harvest had the highest abundance and petal fall had the lowest abundance of both pathogens relative to the other stages (). In 2016, Alternaria spp. abundance was higher at harvest compared to the other growth stages and petal fall had the lowest abundance compared to the other stages. In 2017, Alternaria spp. abundance was lower at petal fall compared to onset of straw and harvest, but not bud break or full bloom. Alternaria spp. abundances were not different at bud break, full bloom, onset of straw colour or harvest. In 2016, B. cinerea abundance was higher at harvest compared to blossom and petal fall, but not at onset of straw. B. cinerea abundance was not significantly different at any growth stage in 2017.
Discussion
The modified ONFIT method was used to determine which fungal pathogens were of greater importance in the postharvest disease of sweet cherry in the Okanagan Valley via the detection of latent fungal infection. Results of this assay showed very little latent fungal infection overall. The ascomycetes, Alternaria spp. and B. cinerea, which are known to cause postharvest disease in BC (BC Tree Fruit Production Guide Citation2017), were isolated most frequently using this assay and selected for use in the development of the duplex ddPCR assay. The identification of the representative isolates from the morphological group of each genus was confirmed through rDNA ITS sequencing, but Alternaria spp. are difficult to identify at the species level as the molecular variation between them is minimal, especially in the less-informative ITS region (Woudenberg et al. Citation2015). However, since the duplex ddPCR assay used genus level Alternaria primers, it was not essential for species level identification. The IGS targeting Bc3/Bc3R gene primer set used in this study has been used in recent studies for the detection and quantification of B. cinerea (Mirmajlessi et al. Citation2015; Carmichael et al. Citation2018; Si Ammour et al. Citation2019; Malarczyk et al. Citation2019; Fedele et al. Citation2020; Hilje-Rodríguez et al. Citation2020), but others may consider the use of alternative primer sets. In addition, sequencing of the ITS region alone may not be sufficient to separate closely related species of Botrytis, thus a phylogenetic analysis of the Botrytis isolates using other genes, such as G3PDH, HSP60 and RPB2, may be helpful in the future to further differentiate species.
To our knowledge, there is little research on Alternaria spp. and sweet cherry, and on which species infect sweet cherries; however, it was out of scope for this study to undertake the extensive research required to identify which Alternaria spp. are responsible for sweet cherry rot in the Okanagan Valley. Of the few studies available, A. alternata (Dugan and Roberts Citation1994; Ahmad and Liu Citation2020), A. arbusti (Dugan and Roberts Citation1994) and A. cerasidanica sp. nov (Roberts et al. Citation2010) have been isolated from sweet cherry. Further, we have shown that the Alternaria spp. isolates in this study were able to infect detached, non-wounded, sweet cherry fruit (Larrabee Citation2019). Even if an individual Alternaria species does not cause rot, its presence could contribute to the contamination of fresh sweet cherries and cherry-based products due to the production of mycotoxins by certain Alternaria species (Lee et al. Citation2015; Qiao et al. Citation2018). Thus, it is important to consider many Alternaria spp. in the disease management of food crops as these toxins result in adverse health effects when consumed. For these reasons, a genus-specific primer set was selected for Alternaria. If only a single species is of interest, our method can be modified to include a species-specific primer set such as that for A. alternata which targets beta-tubulin gene sequences (Kordalewska et al. Citation2015).
While Alternaria spp. and B. cinerea are generally considered minor pathogens of sweet cherry, there are multiple reports of both being dominant pathogens. The BC Tree Fruit Production Guide (Citation2017) lists each as a major pathogen of sweet cherry in BC. Dugan and Roberts (Citation1994) detected the colonization of sweet cherry by Alternaria spp. from petal fall until harvest over the duration of a 2-year study, and Haddadderafshi et al. (Citation2016) showed that over 50% of the isolates collected from different tissues of sweet cherry trees were from the genus Alternaria. Alternaria spp. were some of the most prevalent fungal pathogens on sweet cherries in a study in Turkey (Akbulut et al. Citation2008). Unpublished data from Dugan and Roberts (Citation1994) indicated that Alternaria spp. were the predominant cause of decay of cherries from commercial packing houses. In early 2020 the first report of A. alternata causing postharvest disease of sweet cherry in China was published (Ahmad and Liu Citation2020). Botrytis cinerea has also been reported as a dominant pathogen of sweet cherry (Adaskaveg et al. Citation2000; Akbudak et al. Citation2009; Tarbath et al. Citation2014). In 2017, B. cinerea was reported as the causative agent of rotted sweet cherries in South Korea for the first time (Aktaruzzaman et al. Citation2017). With the increasing frequency of reports of these two pathogens causing postharvest rots of sweet cherry, improved methods to manage the diseases have become critical.
We developed a novel duplex ddPCR assay using EvaGreen to quantify Alternaria and B. cinerea. Primers were selected that had been developed previously, tested for sensitivity and cross-reactivity, and used in studies to quantify the pathogens on other crops. The genus-specific Alternaria primers, Dir/Inv1ITSAlt, that target the ITS region have been used to quantify Alternaria spp. on different fruits and vegetables (Pavón et al. Citation2012; Hahuly et al. Citation2018). They were previously tested for cross-reactivity with Rhizopus stolonifer, Fusarium oxysporum, Penicillium expansum, and Aspergillus ochraceus (Pavón et al. Citation2011, Citation2012), but not B. cinerea. However, our study tested these primers and they showed no cross-reactivity with B. cinerea. This is important in duplex ddPCR to ensure that the DNA quantified by the primer set accurately reflects the quantity of the target DNA present and is not inflated by cross-reactivity with non-target DNA in the duplex reaction. The Bc3/Bc3R primer set used to quantify B. cinerea by targeting the IGS has been used to successfully quantify B. cinerea on table grapes (Diguta et al. Citation2010; Carmichael et al. Citation2018; Si Ammour et al. Citation2019) and was previously tested for cross reactivity with A. alternata, Alternaria sp., Botrytis elliptica, Botrytis fabae, Botrytis tulipae, Cladosporium sp., Erysiphe necator, F. oxysporum, Monilinia laxa, P. expansum, R. stonolifer, and Sclerotinia sclerotiorum (Suarez et al. Citation2005; Si Ammour et al. Citation2019). Our cross reactivity test for the Bc3/Bc3R primer set with Alternaria spp. confirmed these results.
Abundant target regions (ITS and IGS) were chosen to increase the sensitivity of the assay by increasing the chance of detecting low amounts of DNA (Weerakoon et al. Citation2016). Using different concentrations of the primer sets in the duplex reaction allowed for separation of the targets by making the final mass of DNA between target amplicons different (McDermott et al. Citation2013). Although the Dir/Inv1ITSAlt primer set produced a longer amplicon than the Bc3/Bc3R primer set, and therefore had greater DNA mass, which should result in droplets with higher fluorescence, the long amplicon instead increased the number of droplets with intermediate fluorescence, due to incomplete amplification of the long target region (Miotke et al. Citation2014). Thus, using different concentrations of the primer sets enhanced separation. There was no fourth cluster containing double-positive droplets, as outlined by Whale et al. (Citation2016). The lack of the double-positive cluster has been reported in other studies (Bucher and Köppel Citation2016; Weerakoon et al. Citation2016), and its absence may be due to the low concentration of target DNA, which would lead to a lower chance of two or more DNA templates being contained within one droplet (Weerakoon et al. Citation2016).
The detection limit of each fungal target was 0.1 pg. In a previous study by Pavón et al. (Citation2012), the qPCR detection limit for the same Dir/Inv1ITSAlt primer set was 3 pg of DNA. By contrast, the detection limit of the same Bc3/Bc3R primer set using qPCR was found to be much lower at 10 fg of DNA (Sanzani et al. Citation2012). However, the ddPCR method is better suited for pathogen quantification on pre-harvest sweet cherry tissues because it is less susceptible to PCR-inhibiting substances, such as those naturally occurring on plant tissues, as well as those in fungicides (Almeida Da Silva et al. Citation2016). This is because ddPCR acquires data at the reaction end point (Taylor et al. Citation2017). Using end-point data, droplets are classified as being positive or negative, regardless of reaction efficiency; if the DNA was amplified, positive fluorescence will occur and the quantity of DNA can be calculated from the number of positive and negative droplets using Poisson statistics (Hindson et al. Citation2011; Kim et al. Citation2014).
Advantages of ddPCR include its precision and reproducibility, allowing for collaboration, comparison, and study reproduction between laboratories (Kim et al. Citation2014; Selvaraj et al. Citation2018). Although not an issue in this study, a disadvantage to using ddPCR can occur during droplet classification, where not all droplets in a reaction can be classified as positive or negative, and thus determining the margin between clusters can be a challenge. In addition, negative samples occasionally contain a few positive droplets in the positive fluorescence region; therefore positive results are defined as the presence of more positive droplets than the maximum number of positive droplets in the negative control (Weerakoon et al. Citation2016). These factors can make it difficult to state absolute DNA quantity with certainty.
The utility of the duplex ddPCR assay was tested in a field experiment which showed that both pathogens could be successfully quantified throughout sweet cherry growth stages. Pathogens were present as early as bud break and abundance was generally higher at harvest and lower at petal fall. Both Alternaria spp. and B. cinerea quantities were lowest at petal fall, which may be due to the loss of inoculum with the falling petals. Others have reported higher quantities of pathogen and/or disease incidence before or at harvest. Tarbath et al. (Citation2014) observed that B. cinerea quantity remained consistent throughout the growing season until 10 days before harvest, when quantity reached a maximum. Serrano et al. (Citation2005) observed that total soluble solids and titratable actual acidity increased over the growth stages and firmness decreased during sweet cherry development, which may have created suitable conditions for B. cinerea growth. Although higher quantities of pathogen at harvest are to be expected due to fruit maturity and quality, Tarbath et al. (Citation2014) reported that correlation of fruit quality parameters at harvest to rot incidences was poor in the scientific literature. Northover and Biggs (Citation1990) showed that larger, mature sweet cherry fruit, with developed waxy cuticles, enhanced the adhesion of inoculum drops. In contrast, when cherry fruit were small, the curved surface decreased inoculum drop stability (Northover and Biggs Citation1990). Thus, the difference in size of buds, blossoms and developing fruit may have an impact on the amount of inoculum able to occupy the tissue, based on space availability rather than growth stage. The presence of heavy foliage on the tree during the ripening stages may also contribute to pathogen accumulation and postharvest disease by affecting air movement and increasing humidity in the canopy, thereby providing pathogens with a favourable environment (Pangga et al. Citation2011).
The presence of pathogen at bud break is notable, as one of the infection pathways of B. cinerea is via the floral parts (petals, styles, stigmas or stamen) at full bloom (McClellan and Hewitt Citation1973; Elmer and Michailides Citation2007; Carmichael et al. Citation2018). The established hyphae may then remain in a latent phase during the preharvest phenological stages of sweet cherry until environmental conditions become optimal for pathogen growth (Romanazzi et al. Citation2016). This occurs typically during mid-spring when temperatures are high enough to allow fungi to become active, but are too low to allow optimum host development (Agrios Citation2005). Therefore, the pattern of pathogen abundance observed may be related to pathogen latency, where there is limited colonization in early stages due to latency and high host defences, followed by increased colonization during fruit ripening when optimal conditions are met (Elmer and Michailides Citation2007).
To our knowledge, only nine studies have been published that describe the use of ddPCR to quantify fungi. Only three of these are related to agricultural pathogens and they use probe-based duplex ddPCR (Palumbo et al. Citation2016, Citation2019; Hua et al. Citation2018). We are not aware of any agricultural studies that quantify fungi using duplex ddPCR with EvaGreen, making this study the first of its kind. DdPCR worked well for quantifying Alternaria spp. and B. cinerea on sweet cherry from environmental samples. The optimized duplex reaction using DNA-binding dye chemistry with EvaGreen to separate targets offered a sensitive, and cost-effective alternative to using probes. Duplexing allows for the detection of two pathogens simultaneously; therefore, halving detection-, quantification- and time-costs. By using EvaGreen, the assay can be further adapted to multiplex with more primer sets, allowing for the detection of multiple pathogens. The assay demonstrated excellent separation between target clusters both in laboratory samples and in environmental samples. The ability to separate clusters in environmental samples using EvaGreen suggests that this method can be used as a template for developing future assays targeting different pathogens. This will ultimately aid in the development of pathogen- and region-specific disease prediction models.
Acknowledgements
The authors thank local growers for permission to sample their orchards and Miranda Hart (UBC Okanagan Campus) for providing ddPCR equipment.
Additional information
Funding
References
- Adaskaveg JE, Förster H, Thompson DF. 2000. Identification and etiology of visible quiescent infections of Monilinia fructicola and Botrytis cinerea in sweet cherry fruit. Plant Dis. 84:328–333. doi:https://doi.org/10.1094/PDIS.2000.84.3.328.
- Agrios GN. 2005. Plant pathology. 5th ed. San Diego (CA): Elsevier Academic Press.
- Ahmad T, Liu Y. 2020. First record of Alternaria alternata causing postharvest fruit rot of sweet cherry (Prunus avium) in China. Plant Dis. 104:1–6. doi:https://doi.org/10.1094/PDIS-11-19-2322-PDN.
- Akbudak B, Tezcan H, Eris A. 2009. Evaluation of messenger plant activator as a preharvest and postharvest treatment of sweet cherry fruit under a controlled atmosphere. Int J Food Sci Nutr. 60:374–386. doi:https://doi.org/10.1080/09637480701712420.
- Akbulut M, Özcan M, Sökmen MA. 2008. Effects of postharvest treatments on physiological disorders and fungal rots of ’0900 Ziraat sweet cherry. Acta Hortic. 795:815–818. doi:https://doi.org/10.17660/ActaHortic.2008.795.131.
- Aktaruzzaman M, Afroz T, Kim B-S, Lee Y-G. 2017. Occurrence of postharvest gray mold rot of sweet cherry due to Botrytis cinerea in Korea. J Plant Dis Prot. 124:93–96. doi:https://doi.org/10.1007/s41348-016-0049-5.
- Almeida Da Silva G, Letícia Bernardi T, Dayane P, Schaker C, Agustini BC, Maria De Mello L, Valente P. 2016. Impact of fungicide residues on polymerase chain reaction and on yeast metabolism. Brazilian Arch Biol Technol. 59:1–7.
- Avenot HF, Michailides TJ. 2015. Detection of isolates of Alternaria alternata with multiple-resistance to fludioxonil, cyprodinil, boscalid and pyraclostrobin in California pistachio orchards. Crop Prot. 78:214–221. doi:https://doi.org/10.1016/j.cropro.2015.09.012.
- Barkai-Golan R. 2001. Postharvest diseases of fruits and vegetables: development and control. Amsterdam: Elsevier.
- BC Ministry of Agriculture. 2014. British Columbia agrifood industry year in review 2014. [accessed 2016 Dec 22]. http://www2.gov.bc.ca/assets/gov/farming-natural-resources-and-industry/agriculture-and-seafood/statistics/industry-and-sector-profiles/year-in-review/bcagrifood_yearinreview_2014.pdf.
- BC Ministry of Agriculture. 2017. Fast stats 2017: British Columbia’s agrifood and seafood sector. [accessed 2020 Apr 23]. https://www2.gov.bc.ca/assets/gov/farming-natural-resources-and-industry/agriculture-and-seafood/statistics/industry-and-sector-profiles/fast-stats/faststatsbc_2017.pdf.
- BC Ministry of Agriculture. 2018. 2018 British Columbia agrifood and seafood international export highlights. [accessed 2020 Apr 23]. https://www2.gov.bc.ca/assets/gov/farming-natural-resources-and-industry/agriculture-and-seafood/statistics/market-analysis-and-trade-statistics/2018_bc_agrifood_and_seafood_export_highlights.pdf.
- BC Tree Fruit Production Guide. 2017. Post-harvest rots. [accessed 2016 Dec 20]. http://www.bctfpg.ca/pest_guide/info/122/Post_Harvest_Rots.
- Bucher TB, Köppel R. 2016. Duplex digital droplet PCR for the determination of non-Basmati rice in Basmati rice (Oryza sativa) on the base of a deletion in the fragrant gene. Eur Food Res Technol. 242:927–934. doi:https://doi.org/10.1007/s00217-015-2599-3.
- Carmichael PC, Siyoum N, Jongman M, Korsten L. 2018. Prevalence of Botrytis cinerea at different phenological stages of table grapes grown in the northern region of South Africa. Sci Hortic (Amsterdam). 239:57–63. doi:https://doi.org/10.1016/j.scienta.2018.05.018.
- Cordova LG, Schnabel G. 2017. Meta-analysis of a web-based disease forecast system for control of Anthracnose and Botrytis fruit rots of strawberry in Southeastern United States. Plant Dis. 101:1910–1917. doi:https://doi.org/10.1094/PDIS-04-17-0477-RE.
- Delong JA, Saito S, Xiao C-L, Naegele RP. 2020. Population genetics and fungicide resistance of Botrytis cinerea on Vitis and Prunus spp. in California. Phytopathol. 110:694–702. doi:https://doi.org/10.1094/PHYTO-09-19-0362-R.
- Diguta CF, Rousseaux S, Weidmann S, Bretin N, Vincent B, Guilloux-Benatier M, Alexandre H. 2010. Development of a qPCR assay for specific quantification of Botrytis cinerea on grapes. FEMS Microbiol Lett. 313:81–87. doi:https://doi.org/10.1111/j.1574-6968.2010.02127.x.
- Dugan FM, Roberts RG. 1994. Etiology of preharvest colonization of Bing cherry fruit by fungi. Phytopathol. 84:1031–1036. doi:https://doi.org/10.1094/Phyto-84-1031.
- Elmer P, Michailides TJ. 2007. Epidemiology of Botrytis cinerea in orchard and vine crops. In: Elad Y, Williamson B, Tudzynski P, Delen N, editors. Botrytis: biology, pathology and control. Dordrecht (Netherlands): Springer; p. 243–272.
- Elmhirst J. 2006. Crop profile for sweet cherries in Canada. Ottawa, ON: Agriculture and Agri-Food Canada. http://www5.agr.gc.ca/resources/prod/doc/prog/prrp/pdf/cherry_e.pdf)
- Fairchild KL, Miles TD, Wharton PS. 2013. Assessing fungicide resistance in populations of Alternaria in Idaho potato fields. Crop Prot. 49:31–39. doi:https://doi.org/10.1016/j.cropro.2013.03.003.
- Fedele G, González-Domínguez E, Ammour MS, Languasco L, Rossi V. 2020. Reduction of Botrytis cinerea colonization of and sporulation on bunch trash. Plant Dis. 104:808–816. doi:https://doi.org/10.1094/PDIS-08-19-1593-RE.
- Gell I, De Cal A, Torres R, Usall J, Melgarejo P. 2009. Conidial density of Monilinia spp. on peach fruit surfaces in relation to the incidences of latent infections and brown rot. Eur J Plant Pathol. 123:415–424. doi:https://doi.org/10.1007/s10658-008-9378-y.
- Gillespie TJ. 1979. A predictive scheme for timing fungicide applications to control Alternaria leaf blight in carrots. Can J Plant Pathol. 1:95–99. doi:https://doi.org/10.1080/07060667909501469.
- Haddadderafshi N, Pósa TB, Péter G, Gáspár L, Ladányi M, Hrotkó K, Lukács N, Halász K. 2016. Characterization of community structure of culturable endophytic fungi in sweet cherry composite trees and their growth-retarding effect against pathogens. Acta Biol Hung. 67:269–285. doi:https://doi.org/10.1556/018.67.2016.3.5.
- Hahuly MV, Sumardiyono C, Wibowo A, Subandiyah S, Harper S. 2018. Identification of purple blotch pathogen of shallot by PCR using specific primer for Alternaria genus. Arch Phytopathol Plant Prot. 51:103–121. doi:https://doi.org/10.1080/03235408.2017.1384196.
- Hilje-Rodríguez I, Albertazzi FJ, Rivera-Coto G, Molina-Bravo R. 2020. A multiplex qPCR TaqMan-assay to detect fungal antagonism between Trichoderma atroviride (Hypocreaceae) and Botrytis cinerea (Sclerotiniaceae) in blackberry fruits using a de novo tef1-α- and an IGS-sequence based probes. Biotechnol Rep. 27:e00447. doi:https://doi.org/10.1016/j.btre.2020.e00447.
- Hindson BJ, Ness KD, Masquelier DA, Belgrader P, Heredia NJ, Makarewicz AJ, Bright IJ, Lucero MY, Hiddessen AL, Legler TC, et al. 2011. High-throughput droplet digital PCR system for absolute quantitation of DNA copy number. Anal Chem. 83(22):8604–8610. doi:https://doi.org/10.1021/ac202028g
- Holz G, Gütschow M, Coertze S, Calitz FJ. 2003. Occurrence of Botrytis cinerea and subsequent disease expression at different positions on leaves and bunches of grape. Plant Dis. 87:351–358. doi:https://doi.org/10.1094/PDIS.2003.87.4.351.
- Hua SST, Palumbo JD, Parfitt DE, Sarreal SBL, O’Keeffe TL. 2018. Development of a droplet digital PCR assay for population analysis of aflatoxigenic and atoxigenic Aspergillus flavus mixtures in soil. Mycotoxin Res. 34:187–194. doi:https://doi.org/10.1007/s12550-018-0313-6.
- Iacomi-Vasilescu B, Avenot H, Bataillé-Simoneau N, Laurent E, Guénard M, Simoneau P. 2004. In vitro fungicide sensitivity of Alternaria species pathogenic to crucifers and identification of Alternaria brassicicola field isolates highly resistant to both dicarboximides and phenylpyrroles. Crop Prot. 23:481–488. doi:https://doi.org/10.1016/j.cropro.2003.10.003.
- Janisiewicz WJ, Korsten L. 2002. Biological control of postharvest diseases of fruit. Annu Rev Phytopathol. 40:411–441. doi:https://doi.org/10.1146/annurev.phyto.40.120401.130158.
- Kim TG, Jeong SY, Cho KS. 2014. Comparison of droplet digital PCR and quantitative real-time PCR for examining population dynamics of bacteria in soil. Appl Microbiol Biotechnol. 98:6105–6113. doi:https://doi.org/10.1007/s00253-014-5794-4.
- Kordalewska M, Brillowska-Dąbrowska A, Jagielski T, Dworecka-Kaszak B. 2015. PCR and real-time PCR assays to detect fungi of Alternaria alternata species. Acta Biochim Pol. 62:707–712. doi:https://doi.org/10.18388/abp.2015_1112.
- Larrabee MM 2019. Environmental effects on the presence and quantity of postharvest fungal pathogens on sweet cherry in the Okanagan Valley [MSc. Thesis]. Kelowna (BC): University of British Columbia.
- Lee HB, Patriarca A, Magan N. 2015. Alternaria in food: ecophysiology, mycotoxin production and toxicology. Mycobiology. 43:93–106. doi:https://doi.org/10.5941/MYCO.2015.43.2.93.
- Leiminger J, Bäßler E, Knappe C, Bahnweg G, Hausladen H. 2014. Quantification of disease progression of Alternaria spp. on potato using real-time PCR. Eur J Plant Pathol. 141:295–309. doi:https://doi.org/10.1007/s10658-014-0542-2.
- Ma Z, Felts D, Michailides TJ. 2003. Resistance to azoxystrobin in Alternaria isolates from pistachio in California. Pestic Biochem Physiol. 77:66–74. doi:https://doi.org/10.1016/j.pestbp.2003.08.002.
- Malarczyk D, Panek J, Frac M. 2019. Alternative molecular-based diagnostic methods of plant pathogenic fungi affecting berry crops—a review. Molecules. 24(7):1200. doi:https://doi.org/10.3390/molecules24071200
- McClellan WD, Hewitt WB. 1973. Early Botrytis rot of grapes: time of infection and latency of Botrytis cinerea Pers. in Vitis vinifera L. Phytopathol. 73:1151–1157.
- McDermott GP, Do D, Litterst CM, Maar D, Hindson CM, Steenblock ER, Legler TC, Jouvenot Y, Marrs SH, Bemis A, et al. 2013. Multiplexed target detection using DNA-binding dye chemistry in droplet digital PCR. Anal Chem. 85:11619–11627. doi:https://doi.org/10.1021/ac403061n
- Michailides TJ, Morgan DP, Luo Y, Prusky D, Gullino ML. 2010. Epidemiological assessments and postharvest disease incidence. In: Prusky D, Gullino ML, editors. Postharvest pathology. 1st ed. New York: Springer; p. 69–88.
- Miotke L, Lau BT, Rumma RT, Ji HP. 2014. High sensitivity detection and quantitation of DNA copy number and single nucleotide variants with single color droplet digital PCR. Anal Chem. 86:2618–2624. doi:https://doi.org/10.1021/ac403843j.
- Mirmajlessi SM, Destefanis M, Gottsberger RA, Mänd M, Loit E. 2015. PCR-based specific techniques used for detecting the most important pathogens on strawberry: a systematic review. Syst Rev. 4:1–11. doi:https://doi.org/10.1186/2046-4053-4-9.
- Northover J, Biggs AR. 1990. Susceptibility of immature and mature sweet and sour cherries to Monilinia fructicola. Plant Dis. 75:280–284. doi:https://doi.org/10.1094/PD-74-0280.
- Palumbo JD, O ’Keeffe TL, Ho YS, Fidelibus MW. 2016. Population dynamics of Aspergillus Section Nigri species on vineyard samples of grapes and raisins. J Food Prot. 79:448–453. doi:https://doi.org/10.4315/0362-028X.JFP-15-437.
- Palumbo JD, O’Keeffe TL, Quejarro BJ, Yu A, Zhao A. 2019. Comparison of Aspergillus Section Nigri species populations in conventional and organic raisin vineyards. Curr Microbiol. 76:848–854. doi:https://doi.org/10.1007/s00284-019-01697-6.
- Pangga IB, Hanan J, Chakraborty S. 2011. Pathogen dynamics in a crop canopy and their evolution under changing climate. Plant Pathol. 60:70–81. doi:https://doi.org/10.1111/j.1365-3059.2010.02408.x.
- Pavón M, González I, Martín R, García Lacarra T. 2012. ITS-based detection and quantification of Alternaria spp. in raw and processed vegetables by real-time quantitative PCR. Food Microbiol. 32:165–171. doi:https://doi.org/10.1016/j.fm.2012.05.006.
- Pavón MÁ, González I, Rojas M, Pegels N, Martín R, García T. 2011. PCR detection of Alternaria spp. in processed foods, based on the internal transcribed spacer genetic marker. J Food Prot. 74:240–247. doi:https://doi.org/10.4315/0362-028X.JFP-10-110.
- Qiao X, Yin J, Yang Y, Zhang J, Shao B, Li H, Chen H. 2018. Determination of Alternaria mycotoxins in fresh sweet cherries and cherry-based products: method validation and occurrence. J Agric Food Chem. 66:11846–11853. doi:https://doi.org/10.1021/acs.jafc.8b05065.
- R Core Team. 2017. R: A language and environment for statistical computing. R Foundation for Statistical Computing, Vienna, Austria. https://www.R-project.org/.
- Roberts R, Reymond S, Andersen B. 2010. Alternaria cerasidanica sp. nov., isolated in Denmark from drupes of Prunus avium. Mycotaxon. 111:175–182. doi:https://doi.org/10.5248/111.175.
- Romanazzi G, Smilanick JL, Feliziani E, Droby S. 2016. Integrated management of postharvest gray mold on fruit crops. Postharvest Biol Technol. 113:69–76. doi:https://doi.org/10.1016/j.postharvbio.2015.11.003.
- Sanzani SM, Schena L, De Cicco V, Ippolito A. 2012. Early detection of Botrytis cinerea latent infections as a tool to improve postharvest quality of table grapes. Postharvest Biol Technol. 68:64–71.
- Selvaraj V, Maheshwari Y, Hajeri S, Chen J, Greg Mccollum T, Yokomi R. 2018. Development of a duplex droplet digital PCR assay for absolute quantitative detection of ‘Candidatus Liberibacter asiaticus’. PLoS One. 13:1–16. doi:https://doi.org/10.1371/journal.pone.0197184.
- Selvaraj V, Maheshwari Y, Hajeri S, Yokomi R. 2019. Droplet digital PCR for absolute quantification of plant pathogens. In: Khurana SMP, Gaur RK, editors. Plant biotechnology: progress in genomic era. Singapore: Springer; p. 583–595.
- Serrano M, Guillén F, Martínez-Romero D, Castillo S, Valero D. 2005. Chemical constituents and antioxidant activity of sweet cherry at different ripening stages. J Agric Food Chem. 53:2741–2745. doi:https://doi.org/10.1021/jf0479160.
- Si Ammour M, Fedele G, Morcia C, Terzi V, Rossi V. 2019. Quantification of Botrytis cinerea in grapevine bunch trash by real-time PCR. Phytopathol. 109:1312–1319. doi:https://doi.org/10.1094/PHYTO-11-18-0441-R.
- Suarez MB, Walsh K, Boonham N, O’Neill T, Pearson S, Barker I. 2005. Development of real-time PCR assays for the detection and quantification of Botrytis cinerea in planta. Plant Physiol Biochem. 43:890–899. doi:https://doi.org/10.1016/j.plaphy.2005.07.003.
- Tarbath MP, Measham PF, Glen M, Barry KM. 2014. Host factors related to fruit rot of sweet cherry (Prunus avium L.) caused by Botrytis cinerea. Australas Plant Pathol. 43:513–522. doi:https://doi.org/10.1007/s13313-014-0286-7.
- Taylor SC, Laperriere G, Germain H. 2017. Droplet digital PCR versus qPCR for gene expression analysis with low abundant targets: from variable nonsense to publication quality data. Sci Rep. 7:1–8. doi:https://doi.org/10.1038/s41598-017-02217-x.
- Wani AA, Singh P, Gul K, Wani H, Langowski HC. 2014. Sweet cherry (Prunus avium): critical factors affecting the composition and shelf life. Food Packag Shelf Life. 1:86–99. doi:https://doi.org/10.1016/j.fpsl.2014.01.005.
- Weerakoon KG, Gordon CA, Gobert GN, Cai P, Mcmanus DP. 2016. Optimisation of a droplet digital PCR assay for the diagnosis of Schistosoma japonicum infection: a duplex approach with DNA binding dye chemistry. J Microbiol Methods. 125:19–27. doi:https://doi.org/10.1016/j.mimet.2016.03.012.
- Whale AS, Huggett JF, Tzonev S. 2016. Fundamentals of multiplexing with digital PCR. Biomol Detect Quantif. 10:15–23. doi:https://doi.org/10.1016/j.bdq.2016.05.002.
- White TJ, Bruns TD, Lee SB, Taylor JW. 1990. Amplification and direct sequencing of fungal ribosomal RNA genes for phylogenetics. In: Innis M, Gelfand D, Sninsky J, White T, editors. PCR protocols: a guide to methods and applications. New York: Academic; p. 315–322.
- Woudenberg JHC, Seidl MF, Groenewald JZ, De Vries M, Stielow JB, Thomma BPHJ, Crous PW. 2015. Alternaria section Alternaria: species, formae speciales or pathotypes? Stud Mycol. 82:1–21. doi:https://doi.org/10.1016/j.simyco.2015.07.001.
- Yin WX, Adnan M, Shang Y, Lin Y, Luo CX. 2018. Sensitivity of Botrytis cinerea from nectarine/cherry in China to six fungicides and characterization of resistant isolates. Plant Dis. 102:2578–2585. doi:https://doi.org/10.1094/PDIS-02-18-0244-RE.