
 ?Mathematical formulae have been encoded as MathML and are displayed in this HTML version using MathJax in order to improve their display. Uncheck the box to turn MathJax off. This feature requires Javascript. Click on a formula to zoom.
Abstract
Tracking the occurrence and spread of Grapevine red blotch virus (GRBV) depends on robust and reliable diagnostics. Tissue sampling strategy and optimal choice of molecular test are critical for diagnostic success. This study investigated GRBV titres from several grapevine tissues, including roots, buds, cortical scrapings, and leaves, at varying distances from the cordons, and at different times during the growing season and winter dormancy. Two common nucleic acid extraction techniques were compared, a low-cost high-throughput nucleic acid extraction method (GES) and a DNA column purification method. Optimal combinations of sampling parameters were determined for summer and winter diagnostics. In dormant samples, cortical scrapings yielded the highest GRBV titres and produced no false-negatives. In summer samples, basal leaves yielded high GRBV titres throughout the summer months, with only one false negative on the earliest sample date. These two tissues provide the best samples for reliable and reproducible GRBV diagnostics. The crude GES and DNA column purification methods performed comparably well for binary diagnostics, however, the GES method performed poorly in quantitative analysis.
Résumé: Afin de détecter l’occurrence et la dissémination du virus de la tache rouge de la vigne (VTRV), il faut avoir accès à des méthodes diagnostiques robustes et fiables. Une stratégie d’échantillonnage des tissus et un choix optimal du test moléculaire sont essentiels à la précision du diagnostic. Cette étude examine les titres du VTRV provenant de plusieurs tissus de vignes, y compris de racines, de bourgeons, de raclages corticaux et de feuilles, à différentes distances des cordons et à différentes périodes de la saison de croissance ainsi que durant la période de dormance hivernale. Deux techniques courantes d’extraction des acides nucléiques ont été comparées, soit une méthode économique d’extraction à haut débit des acides nucléiques (GES) et une méthode de purification de l’ADN sur colonne. La combinaison optimale des paramètres d’échantillonnage a été déterminée pour les diagnostics d’été et d’hiver. Chez les échantillons en dormance, les raclages corticaux ont fourni les titres de VTRV les plus élevés et n’ont produit aucun faux négatif. Chez les échantillons d’été, les feuilles basales ont fourni des titres élevés de VTRV durant les mois d’été avec un seul faux négatif à la première date d’échantillonnage. Ces deux tissus fournissent les meilleurs échantillons pour des diagnostics fiables et reproductibles du VTRV. La méthode grossière GES et celle de purification de l’ADN sur colonne ont fonctionné relativement bien pour ce qui est des diagnostics binaires, toutefois, la méthode GES n’a pas été très efficace sur le plan de l’analyse quantitative.
Introduction
Grapes (Vitis vinifera and Vitis spp. L.) and wine production represent a significant component of the Canadian economy, with the full economic impact estimated at CAD $9.04 billion in 2015 (Rimerman and Eyler Citation2017). Much as for other grape-growing regions of the world, production of grapes in Canada is challenged by virus diseases such as grapevine leafroll disease (GLD), caused primarily by Grapevine leafroll-associated virus 3 (GLRaV-3), and most recently grapevine red blotch disease (GRBD) caused by Grapevine red blotch virus (GRBV) (Poojari et al. Citation2017a, Citation2017b). The effects of these viral diseases on grapevine varies considerably depending on complex biotic and abiotic factors (Almeida et al. Citation2013; Pereira et al. Citation2021). In the case of GRBD, reduced yields, undesirable berry quality parameters, and decreased plant vigour in both red and white cultivars are commonly observed (Poojari et al. Citation2013; Blanco-Ulate et al. Citation2017; Bowen et al. Citation2020). A study conducted in a British Columbia (BC) Cabernet franc vineyard further found that GRBD reduced photosynthesis rates by 21% from July to September, reduced soluble solids by at least four °brix, decreased yield by 42% on average, and GRBD-infected vines were less winter hardy than non-GRBD vines (Bowen et al. Citation2020).
GRBV is a monopartite geminivirus (family Geminiviridae) with a 3.2kb circular ssDNA genome and is the type-species of the genus Grablovirus (Krenz et al. Citation2012; Rwahnih et al. Citation2013; Varsani et al. Citation2017). GRBV was first reported in 2012 by Krenz et al. from a declining Cabernet franc vineyard in New York. Within a few years of its discovery, it had become clear that GRBV is present in most of the major grape growing regions of North America (Krenz et al. Citation2012; Rwahnih et al. Citation2013; Krenz et al. Citation2014; Poojari et al. Citation2017b, Citation2020; Yao et al. Citation2018; Schoelz et al. Citation2019; Gasperin-Bulbarela et al. Citation2019; Thompson et al. Citation2019a). Natural spread of GRBV has been reported in vineyards in California and Oregon (Perry et al. Citation2016; Cieniewicz et al. Citation2017, Citation2019; Dalton et al. Citation2019). Documented spread of GRBV in study vineyards may be exaggerated due to inherent difficulties obtaining reliable diagnostic data, depending on methods and sampling strategies used. Grapevine tissues are notoriously recalcitrant to nucleic acid extraction due to their high levels of endogenous inhibitors such as polyphenols and polysaccharides (Geuna et al. Citation1998; Zherdev et al. Citation2018). To complicate matters further, grapevine viruses are unevenly distributed in plant tissues and there is seasonal variation in virus titre in affected tissues, making sampling inherently difficult and unreliable (Setiono et al. Citation2018). Year-to-year variations in the robustness of molecular testing as a result of variable inhibition and non-standardized sampling strategies may result in observed and reported increases in disease incidence absent of any true spread. Though work is underway, there is currently no antiserum to GRBV, making nucleic acid-based techniques the only available methods for GRBV molecular diagnosis (Liou Citation2018).
A short report released in 2000 provided grapevine virus researchers with a low cost, high-throughput nucleic acid extraction protocol that utilizes only two simple buffers, an extraction buffer and a stabilization buffer (GES), comprised inexpensive and relatively safe-to-use reagents (Rowhani et al. Citation2000). Sample tissues, such as grape leaf petioles, are ground in the extraction buffer then significantly diluted in GES solution to obtain crude extracts of plant and virus total nucleic acids (TNA). These crude TNA extracts can then be directly used as template in polymerase chain reactions (PCR) and reverse transcription (RT)-PCRs. This technique was adopted by many research groups, including some that studied GRBV (Dovas and Katis Citation2003; Osman and Rowhani Citation2006; Osman et al. Citation2007; Kumar et al. Citation2015; Poojari et al. Citation2017a, Citation2020; Thompson et al. Citation2019b). While this protocol has undeniable benefits, a major drawback must be considered: using crude grapevine extracts in PCR implies a high risk of reaction inhibition and the potential to interpret the amplification-negative reaction as a true-negative. This dilemma is exemplified in a study by Osman et al. (Citation2007) where purified RNA and crude GES TNA extracts from grapevines infected with GLRaV-1, −2, −3, and −5 were used in TaqMan® RT-PCR to compare the ability to detect these viruses using these two different input templates. In every instance, the purified RNA performed better, with detection rates between 95 and 100%, whereas the GES templates only produced detection rates between 61 and 84%. As such, it is paramount that parameters such as sampled tissue, timing of sampling, and methods of nucleic acid extraction and virus detection are optimized to achieve reliable and reproducible diagnostic data.
This study aimed to investigate GRBV titres from various grapevine tissues, including roots, buds, cortical scrapings, and leaves from shoots at varying distances from the cordons, at different times during the growing season and winter dormancy. This study also compared the two nucleic acid extraction techniques, the crude GES method and a commercially available DNA column purification method, to determine the best combination of sampling parameters to achieve reproducible diagnostics.
Materials and methods
Site selection
In 2013, a commercial vineyard located in the South Okanagan, British Columbia, was established with ‘Petit Verdot’ clone 400 on V. riparia rootstock ‘Riparia Gloire de Montpellier’. Conventional vineyard practices were employed in the initial year of planting, then organic practices in subsequent years. In 2018 and onward, biodynamic preparations and no till practices were employed to improve soil health. The vines are yearly cane pruned and basally leaf thinned once during bloom, again at fruit set, and fully around harvest.
After noticing leafroll virus-like foliar symptoms in a substantial portion of these ‘Petit Verdot’ vines in 2018, leaf samples were tested at the Summerland Research and Development Centre following Poojari et al. (Citation2017a), Citation(2017b)) protocols. Results showed tested vines to be negative for GLRaV’s −1 to −4 but positive for GRBV. Due to the limited number of vineyards with known GRBV infection in the Okanagan and Similkameen valleys (Poojari et al. Citation2017b), this site was selected for this study. Ten randomly selected ‘Petit Verdot’ grapevines confirmed infected with GRBV and one GRBV-free control vine were selected for use in this study.
Dormant sample collection
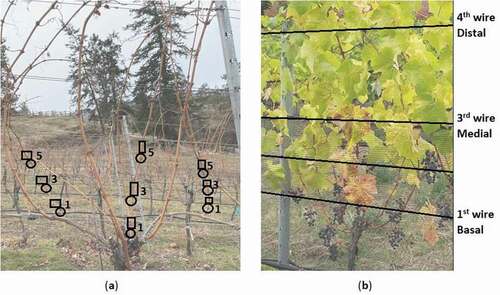
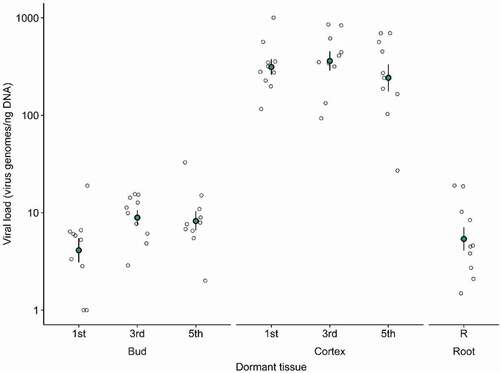
Three random shoots were collected from each of the eleven study grapevines on January 16, 2019. From these three shoots per vine, buds and cortical scrapings were collected in composites with the 1st, 3rd and 5th buds removed and pooled by node number for extractions. Three cortical scraping composites were collected directly adjacent to the collected buds and pooled by scraping number (bud position) for extractions (). Buds and cortical scrapings were ground to a fine powder in liquid nitrogen using sterile pestle and mortars immediately following collection. The ground samples were then immediately stored at −80°C in three aliquots. Root samples were collected from each vine on November 20, 2019, using a 30.5 cm dry soil corer with a 1.9 cm core diameter, 15 cm from the base of each vine’s trunk. For all grinding steps, the pestles and mortars were washed before use in a Alconox® Liquinox® detergent solution (VWR, PA), rinsed thoroughly using distilled water, soaked for at least one hour in a 10% bleach solution, rinsed thoroughly again using distilled water, and then air dried. Dormant samples were processed within four hours of collection.
Fig. 1 Grapevine tissue sampling scheme. (a) Dormant buds (circles) and cortical scrapings (rectangles) were collected from three randomly selected shoots at three different sections per vine (the 1st, 3rd, and 5th buds with scrapings directly adjacent) and pooled by section; (b) Leaf samples were collected randomly in threes from any of the shoots at three different sections per vine (the 1st, 3rd, and 4th wire regions) and pooled by section.
Leaf sample collection
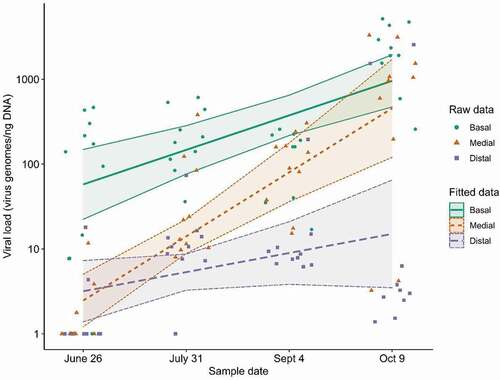
Leaf samples were collected at five-week intervals throughout the 2019 growing season on June 26th, July 31st, September 4th, and October 9th. Leaves were collected from random shoots at three distances from the vine cordons: around the 1st, 3rd and 4th trellis wires with designated section names of basal, medial, and distal, respectively (). For the last two sample dates, basal leaves were collected slightly higher than the 1st wire as these were the only available leaves after the vineyard owners conducted extensive leaf removal. Three leaves were collected from each section per vine, pooled, and placed on ice for transport. For the extractions, leaf petioles were excised from the leaves, ground to a fine powder in liquid nitrogen, and then immediately stored at −80°C in three aliquots. Leaf samples were processed within four hours of collection.
Nucleic acid extraction and quantification
Two methods of extraction were used for each sample: a crude TNA extraction designated the GES method, and a commercial column DNA purification method.
TNA extraction by GES method
The GES method was that described by Rowhani et al. (Citation2000). Approximately 10 mg of sample ground in liquid nitrogen was suspended in 1 mL of extraction buffer (15 mM sodium carbonate, 35 mM sodium bicarbonate 2% (w/v) polyvinylpyrrolidone (PVP-40), 0.2% (w/v) bovine serum albumin (BSA), 0.05% (v/v) Tween-20) in a 1.5 mL Eppendorf tube and vortexed on high for 30 seconds. Then, 10 µL of the suspension was added to 90 µL of GES stabilization buffer (100 mM glycine, 50 mM sodium chloride, 1 mM EDTA, 0.5% (v/v) Triton X-100, 1% β-mercaptoethanol). This GES suspension was then incubated at 95°C for 10 minutes to deactivate endogenous deoxyribonucleases (DNases). After cooling on the benchtop for one minute, 100 µg of DNase-free ribonuclease A (RNase A) (Thermo Fisher Scientific, MA) was added to the GES suspension and incubated at 37°C for 15 minutes to degrade the contained RNA. The RNase-treated GES suspension was then stored at −80°C.
DNA purification by column method
DNA column purification was done using the Qiagen DNeasy™ Plant Pro Kit (Qiagen Sciences Inc, MD) following the prescribed protocol (DNeasy Plant Pro Kit Handbook 2019). As the samples were already homogenized in liquid nitrogen, the initial bead beating step was omitted and instead approximately 10 mg of liquid nitrogen ground sample was suspended in the extraction buffer and vortexed on high for 30 seconds before continuing with the protocol. DNA was eluted in 50 µL of elution buffer and stored at −80°C.
Qubit quantification of total DNA
The total DNA content of each RNase-treated GES extracted sample and each column purified DNA sample was determined using the Qubit® ssDNA Assay Kit (Qubit, NY) following the prescribed protocol which detects ssDNA, dsDNA, ssRNA, and dsRNA (Qubit ssDNA Assay Kit 2015). Measurements were taken with a Qubit 1.0 Fluorometer.
Primer design and optimization of Droplet Digital™ PCR (ddPCR™)
Forward primer 5ʹ-CGATCTGAGCGCGGAGAGGTGA-3ʹ and reverse primer 5ʹ-CCTAGCTCCAGGTCCAGACGTC-3ʹ specific for a 151 bp segment of GRBV V3 open reading frame were selected for use in this study. These were designed using NCBI’s Primer-BLAST (Ye et al. Citation2012) and their suitability and stability were confirmed using Premier Biosoft’s Net Primer online tool (http://www.premierbiosoft.com/netprimer/). Ideal primer concentrations of 100 nM were determined by conducting droplet digital PCR (ddPCR) (Bio-Rad Laboratories Inc, CA) on diluted fully synthesized GRBV (GenBank accession: KX234088) on a pMK-RQ-Ba vector backbone (ThermoFisher Scientific) over a primer concentration gradient of 50 to 250 nM in increments of 50. An ideal ddPCR thermal cycler annealing temperature of 58°C was similarly determined over a thermal gradient of 50.7–62.2°C to maximize primer specificity and minimize droplets exhibiting fluorescence ranging between those of explicit positive and negative droplets, called ‘rain’. ddPCR was conducted using QX200™ ddPCR EvaGreen® chemistry (Bio-Rad Laboratories Inc).
GRBV quantification by Droplet Digital PCR
Crude GES extracts were serially diluted as 10 µL of extract in 90 µL of DNase-free UltraPure™ Distilled Water (Invitrogen, CA) twice to a final dilution of 1/100. Purified DNA extracts were similarly serially diluted three times to a final dilution of 1/1000. Working solutions of 2X QX200 ddPCR EvaGreen Supermix and primers were prepared to accommodate 96-well plates. Plated ddPCR reactions contained 12.5 µL of Supermix, 1.25 µL each of forward primer and reverse primer both at final concentrations of 100 nM, and 10 µL of diluted DNA or TNA template, for total reaction volumes of 25 µL. Droplets were generated following manufacturer instructions using a QX200 AutoDG Droplet Digital PCR System (Bio-Rad Laboratories Inc). After droplet generation, sealed plates were loaded into a C1000 Touch Thermal Cycler (Bio-Rad Laboratories Inc) and cycled using the following settings: 1 cycle of enzyme activation at 95°C for 5 minutes; 40 cycles of denaturation at 95°C for 30 seconds followed by annealing/extension at 58°C for 45 seconds; 1 cycle of signal stabilization at 4°C for 5 minutes then 90°C for 5 minutes; then held at 4°C. Lid temperature was held constant at 105°C during all stages and reaction volume was inputted as 40 µL.
Following thermal cycling, sealed plates were loaded into a QX200 Droplet Reader (Bio-Rad Laboratories Inc) and plate layouts were inputted into QuantaSoft™ Software v1.7.4 (Bio-Rad Laboratories Inc). Experiment types were set as absolute quantification by EvaGreen and readings were taken in channel 1:FAM. All plates included three no-template controls and three positive controls. Positive controls contained fully synthesized GRBV genome. Positive droplets generally fell between the fluorescence amplitude range of 18 000–25 000 and baseline negative droplets generally fell between 4000 and 8000. Each well had on average 18 652 droplets (range 15 699–20 399). The threshold for positive droplets was set at 15 000 for all wells on all plates.
Statistical analysis
All data transformations, calculations, visualizations, and statistical analyses were carried out in R version 4.0.3 (R Core Team Citation2013). An alpha level of 0.05 was used for all tests.
Viral load calculation
Viral load (virus genome copies/ng DNA) was calculated using the following equation:
where virus concentration is the sample-specific Poisson-adjusted output value obtained by ddPCR, reaction volume is the ddPCR reaction volume, dilution factor is the ratio of undiluted DNA/TNA in the final diluted solution, DNA/TNA volume loaded is the volume of diluted DNA/TNA loaded in each ddPCR reaction, and DNA concentration is the sample-specific value obtained by Qubit quantification. For statistical analysis, viral load was log10 transformed to address the multiplicative nature of viral replication evident on the original scale. Transforming viral load allowed for linear analysis of these now additive values on the log scale. A constant of 1 was added to all viral load values to avoid calculating the undefined log(0). Original and transformed viral load distributions were visually assessed using ‘ggplot2ʹ strip charts (Wickham Citation2016) with sample date as a continuous explanatory variable and section as a grouping variable.
Mixed effects model to predict the effects of sampling date and section on viral load in leaves
We fitted a linear mixed model (estimated using REML and nloptwrap optimizer) to predict viral load with sampling date and sampling section (formula: log.virus.particles ~ date * section). The model included date, section and subject as random effects (formula: ~1 + date * section | subject). The main effects of date, the date for which leaves were collected, and section, the regions on the vines from which leaves were collected, were included in a linear mixed model analysis to predict spatiotemporal viral loads. Additionally, the interaction between date and section was included. The model included the maximal random effect structure justified by the data (Barr et al. Citation2013). The maximal random effect structure was determined by comparing performance indices of the fully specified random effects model to reduced models, following the hierarchy principal. Performance indices were calculated and tabulated using the function ‘compare_performance’ from the R package ‘performance’ (Lüdecke et al. Citation2020). The best performing model included correlated random intercepts and slopes and allowed the interactions between date and section to vary by subject plants. No data points were treated as outliers. Normality of model residuals were visually confirmed using a quantile-quantile plot (function ‘qqnorm’). Estimated marginal means were computed for viral load at all levels of date and section using the function ‘ggpredict’ from the R package ‘ggeffects’ (Lüdecke Citation2018) with 95% confidence intervals (CI). 95% CI’s and p-values were computed using the Wald approximation. The statistical report for the linear mixed model presented in the results section below was adapted from the R package ‘report’ (Makowski et al. Citation2020).
Two-way repeated measures ANOVA to determine the effects of tissue type and section on viral load in dormant buds, cortical scrapings, and roots
Main effects of dormant tissue types (buds, cortical scrapings, and roots) and the sections of these tissues (1st, 3rd, 5th) were included in a two-way repeated measures ANOVA to determine if viral load differences exist between tissues and sections. The root samples were not included in the analysis as they were collected in a separate year, had a significantly smaller sample size, and a different sampling strategy than the other dormant samples. No extreme outliers were found in the data. The assumption of normality of the conditional response variable, viral load, was visually checked using a quantile-quantile plot (function ‘ggqqplot` from the package ‘ggpubr`) (Kassambara CitationKassambara, 2020a) and tested using the Shapiro-Wilk Normality Test (function ‘shapiro_test’ from the package ‘rstatix’) (Kassambara CitationKassambara, 2020b). The ANOVA model was created using the function ‘anova_test’ from the package ‘rstatix’ (Kassambara CitationKassambara, 2020b). This model creation tool automatically checks the assumption of sphericity using Mauchly’s Test for Sphericity and by default applies the Greenhouse-Geisser correction to all within-subjects factors for which the assumption of sphericity is not met. In this case, sphericity was not met in the within-subject factor ‘section’ so sphericity corrections were applied.
Method comparison by scatter plot
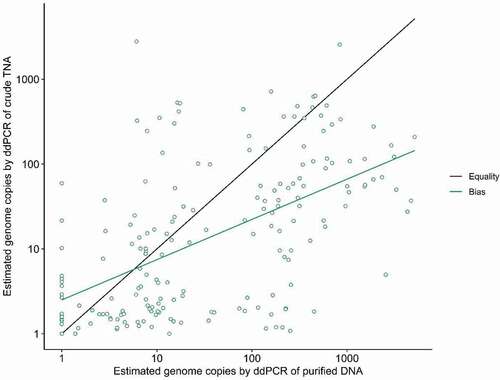
Log viral loads (virus genome copies/ng DNA) as determined by ddPCR of column purified DNA and GES crude TNA were plotted against each other using the R package ‘ggplot2ʹ (Wickham Citation2016) to visualize agreement of methods and to compare their coefficients of correlation. As it is assumed to be more reliable than the crude extraction method, log viral loads obtained from purified DNA were plotted on the x-axis, and log viral loads obtained from crude DNA were plotted on the y-axis. Agreement between the two methods was determined by calculating the variance between the plotted points and a hypothetical line representing perfect agreement between the methods (y ~ x).
Results
Mixed effects model to predict the effects of sampling date and section on viral load in leaves
A linear mixed model was generated to determine if measured viral loads varied significantly across the sampling dates and sampled sections. The model’s explanatory power related to the fixed effects alone (marginal R2) is 0.75. The model’s intercept (and reference), is set at date = June 26 and section = Basal (). The random effect variance parameters (Table A1) can be found in supplementary data. Standardized parameters were obtained by fitting the model on a standardized version of the dataset (). Results showed major differences in viral loads between sampled sections at different sample dates. GRBV was most consistently detected and at the highest titres in basal leaves across all sampling dates (). Only one single basal leaf sample tested negative for GRBV on the first sample date of June 26. Conversely, the majority of the sampled medial (6/10) and distal (7/10) leaves tested negative for GRBV on the first sample date. Viral loads in the medial leaves increased over the summer, approximately one order of magnitude every five weeks, and had comparable virus titres to basal leaves by the final sampling date, October 9 (). Viral loads in the distal leaves did not increase significantly throughout the growing season, although false-negatives stopped occurring in the latter two sampling dates, September 4 and October 9 (). In the GRBV-negative control vine, GRBV was not detected in any of the sampled sections on all sample dates.
Table 1. Linear mixed effects model summary statistics
Fig. 2 Estimated marginal effects of section and date on viral load in leaves (lines). Ribbons represent 95% confidence intervals. Shaped points represent raw measurements from individual plants (n = 119). Raw data points are jittered to minimize overlap for optimal visualization.
Two-way repeated measures ANOVA to determine the effects of tissue type and section on viral load in dormant buds, cortical scrapings, and roots
Results showed no statistically significant differences in viral loads between sections of respective tissue types, including the 1st, 3rd and 5th bud as well as the 1st, 3rd, and 5th cortex scraping, F(1.09, 9.78) = 2.38, p = 1.54 x 10⁻¹ (). As such, no post hoc tests were run. However, there was a statistically significant difference in viral loads between dormant buds and cortical scrapings, F(1, 9) = 298.60, p = 3.28 x 10⁻⁸, the latter showing a 50 fold higher increase on average. GRBV was not detected in two dormant samples, both from the lowest sampled buds (). GRBV was detected from all ten root samples collected from individual vines though viral loads ranged significantly from two to 10 genomes ng−1 of DNA (). In the GRBV-negative control vine, GRBV was not detected in any of the sampled sections for all dormant tissues.
Fig. 3 Mean viral loads in dormant tissues (filled circles) and standard error (line ranges). Hollow circles represent raw measurements from individual plants (n = 70). Raw data points are jittered to minimize overlap for optimal visualization.
Comparison of extraction methods
Overall, there was minimal agreement in viral load values obtained by the two extraction methods (). The crude method had a variable proportional bias, where ddPCR of crude TNA tended to overestimate viral load when the true value was low, and underestimate viral load when the true value was high. The coefficient of correlation of the crude method was 0.55, much lower than the hypothetical coefficient of correlation of 1.0 corresponding to an ideal agreement between methods (). In fourteen cases, where detection of viral DNA was not possible in purified DNA, detection did occur in the crude extract. The majority of these values were near zero, however, two of these crude measurements were an order of magnitude higher.
Fig. 4 Plot of paired measures (green dots) of GRBV titres determined by ddPCR of crude DNA (y-axis) versus titres from column purified DNA (x-axis). Comparison of the variance between the paired measures and a hypothetical ideal agreement (black line) produced a corresponding coefficient of correlation value of 0.55 (green line), indicating minimal agreement between the two methods (n = 188).
Discussion
The first objective of this study was to determine GRBV titers from roots, buds, cortical scrapings, and from leaves at varying distances from the cordons and at different times during the growing and dormant seasons. Our results indicated major differences in viral loads among leaf samples from different sections, with over 50% of the medial and distal leaves testing negative for GRBV on the first sample date of June 26 (). These results agree with Setiono et al. (Citation2018) who reported that 37 of 84 (44%) younger distal leaves of field-grown plants falsely tested negative for GRBV in June 2015. Basal leaves collected in our study consistently showed the highest GRBV titres over the growing season. Virus titres in medial leaves were comparable to those obtained from basal leaves by the final sampling date (October 9). Though false-negatives were absent after July 31, virus titres in distal leaves did not increase significantly throughout the growing season. Contrary to our findings, a similar spatiotemporal study conducted from May to September with ‘Chardonnay’ and ‘Cabernet franc’ either co-infected with GLRaV-2 and −3 or with GLRaV-3 showed titre increases in both basal and distal leaves (Shabanian et al. Citation2020), suggesting that a mechanism to limit GRBV movement to distal leaves may exist in grapevines. Such a resistance mechanism has been described, where the absence of virus in distal leaves suggests that the virus’ ability to ingress into the sieve element of the phloem is limited (Waigmann et al. Citation2004; Ueki and Citovsky Citation2006).
Grapevine viruses are largely detected using leaf extracts, however there may be an interest or need to detect infections when leaves are not present. As such, this study sought to determine if all dormant tissues work equally well for GRBV detection, and if not, which is the best. Previous studies have primarily focused on GRBV detection from leaf tissues and cortical scrapings (Poojari et al. Citation2013, Citation2020; Krenz et al. Citation2014; Rwahnih et al. Citation2015; Wallis and Sudarshana Citation2016; Cieniewicz et al. Citation2017; Setiono et al. Citation2018; Dalton et al. Citation2019), although GRBV has also been detected in the root tips (Rwahnih et al. Citation2013). Other grapevine viruses have also been found in roots, such as GLRaV-3 (Bell et al. Citation2009) and GFLV (Krebelj et al. Citation2015). Our detection of GRBV in buds is not unexpected, as this has been found with many grapevine viruses and has been exploited in chip-bud inoculations for Grapevine fanleaf virus (GFLV) (Krebelj et al. Citation2015), Grapevine rupestris stem pitting-associated virus (GRSPaV), Grapevine fleck virus, Grapevine viruses A and B, GLRaVs-1, −2, −3, and −4 strain 9 (Constable et al. Citation2013), to name a few. Viral loads were on average two orders of magnitudes higher in cortical scrapings than in roots or in buds, and virus was successfully detected in all scrapings, indicating that these provide the most reliable dormant samples for detection of GRBV. Our study showed no spatial differences in virus titres in the sections within cortical scrapings or buds. These results may have been different if buds and bark scrapings had been sampled from sections spaced farther along the canes, although any differences would have limited practical value as there are no factors dictating where samples can be collected from a dormant cane. A similar study investigated if GRSPaV could be detected in buds collected from winter canes or in buds collected from spring and summer shoots (Stewart and Nassuth Citation2001). They detected GRSPaV in almost all dormant buds, but detection fell off significantly in opening buds in the spring. They found in summer that detection was high in buds from shoots that had lignified and low in buds from green shoots. Future research on GRBV should similarly investigate seasonal variations in detection of virus in buds.
The second objective of this study aimed to compare two nucleic acid extraction techniques, a crude GES method and a commercially available DNA column purification method to determine the best combination of sampling parameters to achieve reproducible diagnostics. We did not consider the cheapest or fastest extraction method, but rather the one with the highest fidelity. Monitoring the spread of GRBV requires reliable testing of plants over time, where eventual positive results are indicative of spread. There is little tolerance for false results that could be misinterpreted as new infections or absence of spread. In this context, high fidelity takes precedence over cost and efficiency, within reason.
Traditional diagnostics do not often rely on quantitative techniques, with the exception of diagnostic qPCR due to its scalability and non-reliance on electrophoresis, but to better evaluate the agreement between our two methods we took a quantitative approach. When comparing the outcomes of the two experimental pipelines, column purification of DNA was considered the golden standard for GRBV extraction. Significant deviations between the two methods’ viral load determinations were assumed to have resulted from inherent flaws of the crude method, such as high levels of inhibitors in the crude extracts that interfere with PCR. Correct calculation of viral loads relies on accurate Qubit quantification of sample DNA concentrations as well as accurate ddPCR quantification of sample virus copy numbers. Incompatibility between crude extract matrices and either Qubit or ddPCR would result in incorrect viral load calculations and, as a result, non-agreement between the two methods. Extreme care was taken to mitigate random error, such as proper pipetting and adherence to high standards of bench and equipment sanitation. Use of Bio-Rad’s automated droplet generator produced consistent pipetting volumes and minimized potential for airborne contamination. While this study did observe significant differences in viral loads between methods, this aspect merely suggests incompatibility of crude extracts in quantitative but not qualitative experiments. Overall, the crude method exhibited a variable proportional bias where ddPCR of crude TNA tended to overestimate viral load when the true value was low and underestimated viral load when the true value was high.
There were 14 leaf samples for which GRBV was not detected in the purified DNA extracts but was detected in the crude extracts. This anomaly has severe implications in respect to diagnostics. The presence of high-fluorescence droplets in the ddPCR spectra of these samples may be explained by non-specific binding and subsequent photoactivation of the EvaGreen dye in the reaction solutions, resulting in false-positive droplets. In this study, the GES method did not perform as poorly as it did in the study by Osman et al. (Citation2007) where detection of GLRaVs was between 11% and 39% lower in leaf GES extracts compared to column purified RNA. This can likely be attributed to the fact that GRBV has a ssDNA genome and does not require an initial reverse transcription step, a process that is highly prone to inhibition by complex secondary metabolites, to produce cDNA for use in diagnostic PCR. A higher frequency of false-negatives from ddPCR might be expected had our study involved an RNA virus, although potentially at lower levels than the Osman et al. (Citation2007) study, as reverse transcriptases (RNA-directed DNA polymerases) and their resilience to inhibitors have improved remarkably since 2007 (Bustin et al. Citation2015; Zucha et al. Citation2020). With all considered, our study does not objectively conclude an optimal extraction method for diagnostics, as both the GES method and column purification method performed similarly well in terms of detection, although not quantification.
In conclusion, this study found that sampling cortical scrapings from the lower portion of dormant canes yielded the highest GRBV titres and no false-negatives and should therefore be the first choice for dormant tissue selection. When removal of canes or scraping of intact canes is undesirable, GRBV can also be detected in dormant buds or root extracts, albeit at lower titres and at the risk of false-negatives in the case of buds.
When sampling leaves, the most common route for grapevine tissue collection, basal leaves, with their consistently high titre, remains the best option from bloom to leaf fall, although waiting until veraison significantly improves detection rates. Medial leaves should only be sampled near or after veraison, and distal leaves only after veraison if medial or basal leaf sampling is not possible.
This study found that, overall, column purified DNA and crude GES TNA performed equally well in diagnostic PCR of GRBV; while, crude TNA performed poorly for quantitative ddPCR. Future research should investigate the discrepancy of GRBV detection in crude grapevine extracts where GRBV is not detected in column purified extracts to better understand if this anomaly is attributed to greater sensitivity in PCR of crude extracts or higher non-specific amplification.
Table_A1.docx
Download MS Word (22.7 KB)Disclosure statement
No potential conflict of interest was reported by the author(s).
Supplementary material
Supplemental data for this article can be accessed online here: https://doi.org/10.1080/07060661.2021.1993346
Additional information
Funding
Related Research Data
References
- Almeida R, Daane K, Bell V, Blaisdell GK, Cooper M, Herrbach E, Pietersen G. 2013. Ecology and management of grapevine leafroll disease. Front Microbiol. 4:94. doi:https://doi.org/10.3389/fmicb.2013.00094.
- Barr DJ, Levy R, Scheepers C, Tily HJ. 2013. Random effects structure for confirmatory hypothesis testing: keep it maximal. J Mem Lang. 68(3):255–278. doi:https://doi.org/10.1016/j.jml.2012.11.001.
- Bell VA, Bonfiglioli RGE, Walker JTS, Lo PL, Mackay JF, McGregor SE. 2009. Grapevine leafroll-associated virus 3 persistence in Vitis vinifera remnant roots. J Plant Pathol. 91(3):527–533.
- Blanco-Ulate B, Hopfer H, Figueroa-Balderas R, Ye Z, Rivero RM, Albacete A, Pérez-Alfocea F, Koyama R, Anderson MM, Smith RJ, et al. 2017. Red blotch disease alters grape berry development and metabolism by interfering with the transcriptional and hormonal regulation of ripening. J Exp Bot. 68(5):1225–1238. doi:https://doi.org/10.1093/jxb/erw506
- Bowen P, Bogdanoff C, Poojari S, Usher K, Lowery T, Úrbez-Torres JR. 2020. Effects of grapevine red blotch disease on Cabernet franc vine physiology, bud hardiness, and fruit and wine quality. Am J Enol Vitic. 71(4):308–318. doi:https://doi.org/10.5344/ajev.2020.20011.
- Bustin S, Dhillon HS, Kirvell S, Greenwood C, Parker M, Shipley GL, Nolan T. 2015. Variability of the reverse transcription step: practical implications. Clin Chem. 61(1):202–212. doi:https://doi.org/10.1373/clinchem.2014.230615.
- Cieniewicz E, Flasco M, Brunelli M, Onwumelu A, Wise A, Fuchs MF. 2019. Differential spread of grapevine red blotch virus in California and New York vineyards. Phytobiomes J. 3(3):203–211. doi:https://doi.org/10.1094/PBIOMES-04-19-0020-R.
- Cieniewicz EJ, Pethybridge SJ, Gorny A, Madden LV, McLane H, Perry KL, Fuchs M. 2017. Spatiotemporal spread of grapevine red blotch-associated virus in a California vineyard. Virus Res. 241:156–162. doi:https://doi.org/10.1016/j.virusres.2017.03.020.
- Constable FE, Connellan J, Nicholas P, Rodoni BC. 2013. The reliability of woody indexing for detection of grapevine virus‐associated diseases in three different climatic conditions in Australia. Aust J Grape Wine Res. 19(1):74–80. doi:https://doi.org/10.1111/j.1755-0238.2012.00204.x.
- Dalton DT, Hilton RJ, Kaiser C, Daane KM, Sudarshana MR, Vo J, Zalom ZG, Buser JZ, Vaughn MW. 2019. Spatial associations of vines infected with grapevine red blotch virus in Oregon vineyards. Plant Dis. 103(7):1507–1514. doi:https://doi.org/10.1094/PDIS-08-18-1306-RE.
- Dovas CI, Katis NI. 2003. A spot nested RT-PCR method for the simultaneous detection of members of the Vitivirus and Foveavirus genera in grapevine. J Virol Methods. 107(1):99–106. doi:https://doi.org/10.1016/S0166-0934(02)00197-0.
- Gasperin-Bulbarela J, Licea-Navarro AF, Pino-Villar C, Hernández-Martínez R, Carrillo-Tripp J. 2019. First report of grapevine red blotch virus in Mexico. Plant Dis. 103(2):381. doi:https://doi.org/10.1094/PDIS-07-18-1227-PDN.
- Geuna F, Hartings H, Scienza A. 1998. A new method for rapid extraction of high quality RNA from recalcitrant tissues of grapevine. Plant Mol Biol Rep. 16(1):61–67. doi:https://doi.org/10.1023/A:1007433910213.
- Kassambara A. 2020a. ggpubr: ‘ggplot2’ based publication ready plots. R package version 0.4.0; [cited 2021 May 25]. https://CRAN.R-project.org/package=ggpubr.
- Kassambara A. 2020b. rstatix: pipe-friendly framework for basic statistical tests. R package version 0.6.0; [cited 2021 May 25]. https://CRAN.R-project.org/package=rstatix.
- Krebelj AJ, Čepin U, Ravnikar M, Novak MP. 2015. Spatio-temporal distribution of Grapevine fanleaf virus (GFLV) in grapevine. Eur J Plant Pathol. 142(1):159–171. doi:https://doi.org/10.1007/s10658-015-0600-4.
- Krenz B, Thompson JR, Fuchs M, Perry KL. 2012. Complete genome sequence of a new circular DNA virus from grapevine. J Virol. 86(14):7715. doi:https://doi.org/10.1128/JVI.00943-12.
- Krenz B, Thompson JR, McLane HL, Fuchs M, Perry KL. 2014. Grapevine red blotch-associated virus is widespread in the United States. Phytopathology. 104(11):1232–1240. doi:https://doi.org/10.1094/PHYTO-02-14-0053-R.
- Kumar S, Rai R, Baranwal VK. 2015. Development of an immunocapture–reverse transcription–polymerase chain reaction (IC-RT-PCR) using modified viral RNA release protocol for the detection of grapevine leafroll-associated virus 3 (GLRaV-3). Phytoparasitica. 43(3):311–316. doi:https://doi.org/10.1007/s12600-014-0445-y.
- Liou H. 2018. Investigating the gene expression strategy of Grapevine Red Blotch Virus. Honors Thesis Cornell.
- Lüdecke D. 2018. ggeffects: tidy data frames of marginal effects from regression models. J Open Source Softw. 3(26):772. doi:https://doi.org/10.21105/joss.00772.
- Lüdecke D, Makowski D, Waggoner P, Patil I. 2020. Assessment of regression models performance. R package version 0.4, 8. CRAN.
- Makowski D, Lüdecke D, Ben-Shachar MS. 2020. Automated reporting as a practical tool to improve reproducibility and methodological best practices adoption. CRAN; [cited 2021 May 25]. https://github.com/easystats/report.
- Osman F, Leutenegger C, Golino D, Rowhani A. 2007. Real-time RT-PCR (TaqMan®) assays for the detection of Grapevine Leafroll associated viruses 1–5 and 9. J Virol Methods. 141(1):22–29. doi:https://doi.org/10.1016/j.jviromet.2006.11.035.
- Osman F, Rowhani A. 2006. Application of a spotting sample preparation technique for the detection of pathogens in woody plants by RT-PCR and real-time PCR (TaqMan). J Virol Methods. 133(2):130–136. doi:https://doi.org/10.1016/j.jviromet.2005.11.005.
- Pereira GE, Padhi EM, Sudarshana MR, Fialho FB, Medina-Plaza C, Girardello RC, Tseng D, Bruce RC, Erdmann JN, Slupsky CM, et al. 2021. Impact of grapevine red blotch disease on primary and secondary metabolites in ‘Cabernet Sauvignon’grape tissues. Food Chem. 342:128312. doi:https://doi.org/10.1016/j.foodchem.2020.128312.
- Perry KL, McLane H, Hyder MZ, Dangl GS, Thompson JR, Fuchs MF. 2016. Grapevine red blotch-associated virus is present in free-living Vitis spp. proximal to cultivated grapevines. Phytopathology. 106(6):663–670. doi:https://doi.org/10.1094/PHYTO-01-16-0035-R.
- Poojari S, Alabi OJ, Fofanov VY, Naidu RA. 2013. A leafhopper-transmissible DNA virus with novel evolutionary lineage in the family geminiviridae implicated in grapevine redleaf disease by next-generation sequencing. PloS One. 8(6):e64194. doi:https://doi.org/10.1371/journal.pone.0064194.
- Poojari S, Boulé J, DeLury N, Lowery DT, Rott M, Schmidt AM, Úrbez-Torres JR. 2017a. Epidemiology and genetic diversity of grapevine leafroll-associated viruses in British Columbia. Plant Dis. 101(12):2088–2097. doi:https://doi.org/10.1094/PDIS-04-17-0497-RE.
- Poojari S, Lowery DT, Rott M, Schmidt AM, Úrbez-Torres JR. 2017b. Incidence, distribution and genetic diversity of Grapevine red blotch virus in British Columbia. Can J Plant Pathol. 39(2):201–211. doi:https://doi.org/10.1080/07060661.2017.1312532.
- Poojari S, Moreau DL, Kahl D, Ritchie M, Ali S, Úrbez-Torres JR. 2020. Disease incidence and genetic variability of economically important grapevine viruses in Nova Scotia. Can J Plant Pathol. 42(4):584–594. doi:https://doi.org/10.1080/07060661.2020.1730443.
- R Core Team. 2013. R: a language and environment for statistical computing. Vienna (Austria): R Foundation for Statistical Computing; [cited 2021 May 25]. http://www.R-project.org/
- Rimerman F, Eyler R. 2017. The economic impact of the wine and grape industry in Canada 2015. St. Helena (CA): Frank, Rimerman + Company LLP.
- Rowhani A, Biardi L, Johnson R, Saldarelli P, Zhang YP, Chin J, Green M. 2000. Simplified sample preparation method and one-tube RT-PCR for grapevine viruses. Proceedings of XIII International Council for the Study of Viruses and Virus-Like Diseases of the Grapevine. Adelaide. p. 148.
- Rwahnih MA, Dave A, Anderson MM, Rowhani A, Uyemoto JK, Sudarshana MR. 2013. Association of a DNA virus with grapevines affected by red blotch disease in California. Phytopathology. 103(10):1069–1076. doi:https://doi.org/10.1094/PHYTO-10-12-0253-R.
- Rwahnih MA, Rowhani A, Golino DA, Islas CM, Preece JE, Sudarshana MR. 2015. Detection and genetic diversity of Grapevine red blotch-associated virus isolates in table grape accessions in the National Clonal Germplasm Repository in California. Can J Plant Pathol. 37(1):130–135. doi:https://doi.org/10.1080/07060661.2014.999705.
- Schoelz JE, Adhab M, Qiu W, Petersen S, Volenberg D. 2019. First report of grapevine red blotch virus in hybrid grapes in Missouri. Plant Dis. 103(2):379. doi:https://doi.org/10.1094/PDIS-07-18-1202-PDN.
- Setiono FJ, Chatterjee D, Fuchs M, Perry KL, Thompson JR. 2018. The distribution and detection of grapevine red blotch virus in its host depend on time of sampling and tissue type. Plant Dis. 102(11):2187–2193. doi:https://doi.org/10.1094/PDIS-03-18-0450-RE.
- Shabanian M, Xiao H, Meng B. 2020. Seasonal dynamics and tissue distribution of two major viruses associated with grapevine Leafroll under cool climate condition. Eur J Plant Pathol. 158(4):1017–1031. doi:https://doi.org/10.1007/s10658-020-02137-z.
- Stewart S, Nassuth A. 2001. RT-PCR based detection of Rupestris stem pitting associated virus within field-grown grapevines throughout the year. Plant Dis. 85(6):617–620. doi:https://doi.org/10.1094/PDIS.2001.85.6.617.
- Thompson BD, Dahan J, Lee J, Martin RR, Karasev AV. 2019b. A novel genetic variant of Grapevine leafroll-associated virus-3 (GLRaV-3) from Idaho grapevines. Plant Dis. 103(3):509–518. doi:https://doi.org/10.1094/PDIS-08-18-1303-RE.
- Thompson BD, Eid S, Vander Pol D, Lee J, Karasev AV. 2019a. First report of grapevine red blotch virus in Idaho grapevines. Plant Dis. 103(10):2704. doi:https://doi.org/10.1094/PDIS-04-19-0780-PDN.
- Ueki S, Citovsky V. 2006. Arrest in viral transport as the basis for plant resistance to infection. In: Loebenstein G, Carr JP, editors. Natural resistance mechanisms of plants to viruses. Dordrecht: Springer; p. 289–314.
- Varsani A, Roumagnac P, Fuchs M, Navas-Castillo J, Moriones E, Idris A, Briddon RW, Rivera-Bustamante R, Zerbini FM, Martin DP. 2017. Capulavirus and Grablovirus: two new genera in the family Geminiviridae. Arch Virol. 162(6):1819–1831. doi:https://doi.org/10.1007/s00705-017-3268-6.
- Waigmann E, Ueki S, Trutnyeva K, Citovsky V. 2004. The ins and outs of nondestructive cell-to-cell and systemic movement of plant viruses. CRC Crit Rev Plant Sci. 23(3):195–250. doi:https://doi.org/10.1080/07352680490452807.
- Wallis CM, Sudarshana MR. 2016. Effects of grapevine red blotch-associated virus (GRBaV) infection on foliar metabolism of grapevines. Can J Plant Pathol. 38(3):358–366. doi:https://doi.org/10.1080/07060661.2016.1227374.
- Wickham H. 2016. ggplot2: elegant graphics for data analysis. New York (NY): Springer-Verlag New York.
- Yao XL, Han J, Domier LL, Qu F, Lewis Ivey ML. 2018. First report of grapevine red blotch virus in Ohio vineyards. Plant Dis. 102(2):463. doi:https://doi.org/10.1094/PDIS-08-17-1141-PDN.
- Ye J, Coulouris G, Zaretskaya I, Cutcutache I, Rozen S, Madden TL. 2012. Primer-BLAST: a tool to design target-specific primers for polymerase chain reaction. BMC Bioinform. 13(1):1. doi:https://doi.org/10.1186/1471-2105-13-S6-S1.
- Zherdev AV, Vinogradova SV, Byzova NA, Porotikova EV, Kamionskaya AM, Dzantiev BB. 2018. Methods for the diagnosis of grapevine viral infections: a review. Agriculture. 8(12):195. doi:https://doi.org/10.3390/agriculture8120195.
- Zucha D, Androvic P, Kubista M, Valihrach L. 2020. Performance comparison of reverse transcriptases for single-cell studies. Clin Chem. 66(1):217–228. doi:https://doi.org/10.1373/clinchem.2019.307835.