
Abstract
The prevalence of maize, wheat and other cereal crops in Ontario, Canada, has led to frequent epidemics of ear rot and head blight disease caused by the broad host pathogen Fusarium graminearum. This fungus produces the trichothecene deoxynivalenol (DON) which is one of the most common mycotoxins contaminating food and feed globally and poses a risk to human and animal health. DON is commonly glycosylated by plant hosts into deoxynivalenol-3-glucoside (DON-3G) as part of a defence mechanism to detoxify and sequester mycotoxins. However, it has been documented that DON-3G can be hydrolyzed in the digestive system of animals, increasing the bioavailability of DON. There is a need for additional documentation of the incidence and ratio of DON-3G to DON in Canadian cereal crops. We investigated the occurrence and relative proportion of DON and modified DON compounds in Canadian-adapted maize germplasm with a wide range of ear rot tolerance. Forty-nine maize inbreds were manually challenged (kernel inoculation) with F. graminearum (15-ADON chemotype) as well as phenotyped for tolerance to Gibberella ear rot (GER) under field conditions. LC/MS was used to analyse 581 maize samples for DON, DON-3G, 15-ADON, and 15-ADON-3G. The DON-3G to DON mean molar ratio ranged from 3.1 to 19.7%. DON content was positively correlated with GER disease severity (r = 0.66, p < 0.01), while the DON-3G:DON molar ratio and disease severity were negatively correlated (r = −0.64, p < 0.001). Thus, GER-tolerant maize genotypes had relatively lower total DON content and higher DON-3G:DON ratios.
Résumé
La prévalence des cultures de maïs, de blé et d’autres céréales en Ontario, au Canada, a engendré de nombreuses épidémies de fusariose et de brûlure de l’épi causées par l’agent pathogène à large éventail d’hôtes Fusarium graminearum. Ce champignon produit le déoxynivalénol (DON), de la classe des thricothécènes, une des toxines les plus courantes qui contamine généralement la nourriture ainsi que les aliments pour animaux et représente un risque pour la santé humaine et animale. Le DON est habituellement glycolysé par les plantes hôtes en déoxynivalénol-3-glucoside (DON-3G) comme mécanisme de défense pour détoxifier et séquestrer les mycotoxines. Toutefois, on a rapporté que le DON-3G peut être hydrolysé dans le système digestif des animaux, accroissant la biodisponibilité du DON. Nous avons besoin de documentation supplémentaire sur l’incidence et le rapport du DON-3G au DON dans les céréales canadiennes. Nous avons analysé l’occurrence et la proportion relative du DON et de ses composés modifiés dans les germoplasmes du maïs adapté au Canada affichant une grande tolérance à la fusariose de l’épi. Quarante-neuf autogames de maïs ont été traités manuellement (inoculation des grains) avec F. graminearum (chimiotype 15-ADON) ainsi que phénotypés pour la tolérance à la fusariose de l’épi (FE) au champ. La LC/MS a été utilisée pour analyser 581 échantillons de maïs pour leur contenu en DON, en DON-3G, en 15-ADON, et en 15-ADON-3G. Le rapport molaire moyen de DON-3G à DON variait de 3,1 à 19,7%. La teneur en DON était positivement corrélée à la gravité de la FE (r = 0,66, p < 0,01), tandis que le rapport molaire DON-3G:DON moyen et la gravité de la maladie étaient négativement corrélés (r = −0,64, p < 0,001). En conséquence, les génotypes de maïs tolérants à la FE possédaient une teneur totale en DON relativement plus faible et des rapports de DON-3G:DON plus élevés.
Introduction
Fusarium graminearum is the main cause of Gibberella ear rot (GER) of maize as well as Fusarium head blight (FHB; primarily wheat, barley, and oats), causing immense economic loss through decreased yield and quality worldwide (Munkvold Citation2003; Goswami and Kistler Citation2004; Wilson et al. Citation2018). In maize, F. graminearum can infect the ear by travelling down the silks through the silk channel to the developing kernels or directly to kernels wounded by insects, birds or extreme weather (Sutton Citation1982).
F. graminearum produces a range of toxic secondary metabolites (mycotoxins) of concern for human and animal health, including trichothecenes such as the regulated toxin deoxynivalenol (DON), acetylated forms (3-ADON, 15-ADON), and nivalenol (NIV) (McCormick et al. Citation2011). A global survey of feed samples over a 10 year period revealed that 67% of maize samples were contaminated with DON (median concentration 520 µg kg−1) (Gruber-Dorninger et al. Citation2019). An inhibitor of eukaryotic protein synthesis, DON has been reported to act as a virulence factor for F. graminearum, promoting further disease spread after infection in maize ears and wheat spikes in field trials (Desjardins et al. Citation1996; Harris et al. Citation1999; Bai et al. Citation2002).
In Ontario, Canada, maize is planted on >800,000 ha and maize grain is harvested for both animal feed (~60%) and industrial uses (~40%) (OMAFRA 2021). While GER is present to some degree every year, epidemic years can occur when weather conditions are conducive for ear rot development (Sutton Citation1982; Miller and Richardson Citation2013). After the most recent Ontario epidemic in 2018, an annual survey revealed that 40% of 146 maize grain samples contained > 2 mg kg−1 DON (Rosser and Tenuta Citation2018). The F. graminearum 15-ADON chemotype has consistently remained the most commonly isolated in Ontario (Crippin et al. Citation2020).
Many organisms have evolved mechanisms to mitigate the toxicity posed by mycotoxins by converting them into less toxic metabolites. Detoxification of mycotoxins through biotransformation can be accomplished by bacteria, fungi, plants, and animals and has been recently reviewed (Freire and Sant’Ana Citation2018; Zhang et al. Citation2020; Li et al. Citation2020). In plants, modified or ‘masked’ mycotoxins are biologically modified metabolites often generated as part of a defence mechanism against pathogens. These modifications may reduce toxicity through a variety of mechanisms including directly impeding mode of action, subcellular sequestration or binding (Berthiller et al. Citation2013). Once conjugated, these molecules may not be detected by routine analysis of food and feed products during testing for the parent mycotoxin and therefore do not appear to contribute to the overall toxin levels.
The most frequently detected modified mycotoxins are glucose conjugates formed through glycosylation catalysed by uridine diphosphate-glucosyltransferases (Zhang et al. Citation2020). Of these, the most thoroughly investigated is deoxynivalenol-3-glucoside (DON-3G), first described derived from DON in maize suspension cultures (Sewald et al. Citation1992). Host plants have evolved several resistance mechanisms against F. graminearum; of these, Type V resistance involves toxin resistance by either modification via conjugation with other molecules leading to reduced toxicity or by limitation of toxin production (Mesterházy Citation1995; Boutigny et al. Citation2008). Mechanisms of resistance have been well studied in barley, where a uridine diphosphate glycosyltransferase (UGT) barley gene HvUGT13248 has been functionally characterized (Schweiger et al. Citation2010; Shin et al. Citation2012). Resistant wheat varieties that carry the Fhb1 QTL show a greater ability for conversion of DON to DON-3G in resistant genotypes (Lemmens et al. Citation2005; Kluger et al. Citation2015). The gene responsible for the FHB resistance mapped to chromosome 7EL (Fhb7) of wheat relative Thinopyrum elongatum has been reported to be a glutathione-S-transferase involved in DON detoxification (Wang et al. Citation2020). In general, more resistant wheat lines with an elevated detoxification rate contain lower levels of both DON and DON-3G compared to susceptible ones (Buerstmayr and Lemmens Citation2015; Lemmens et al. Citation2016). Spanic et al. (Citation2019) also showed that more resistant varieties of Croatian wheat are more successful at converting DON to DON-3G. While conversion of DON to DON-3G has been clearly documented in maize (Sewald et al. Citation1992; Berthiller et al. Citation2005), the specific enzyme(s) responsible have not yet been identified.
Evidence exists that DON-3G can be converted into the parent mycotoxin during digestion in both humans and animals through hydrolysis, thus contributing to a higher toxin load (Berthiller et al. Citation2011; Dall’Erta et al. Citation2013; Gratz et al. Citation2013). This conversion of DON-3G to DON increases bioavailability of DON and may pose a potential risk to human and animal health, leading the European Food Safety Authority to add DON-3G to total DON exposure and initiate regulations on total DON including DON derivatives (EFSA Citation2017). DON-3G in foodstuffs including cereal products and beer are normally low but some samples contained nearly equal amounts of DON-3G as DON (Berthiller et al. Citation2009a, Citation2013; De Boevre et al. Citation2012). During maize dry-mill processing for food and feed, DON and modified DON derivatives can be reduced by up to 50%, but may also be concentrated in the germ and animal feed flour fractions (Scarpino et al. Citation2021). DON-3G content was shown to increase during bread dough preparation from contaminated wheat in the presence of enzyme mixtures employed to improve dough quality, and both DON and DON-3G were only slightly reduced by thermal degradation during baking (Kostelanska et al. Citation2011). The high thermal stability of trichothecenes observed after food production and cooking processes have necessitated the maximum guidance levels for DON adopted for unprocessed cereals (Schaarschmidt and Fauhl-Hassek Citation2020).
Originally, it was theorized that in most rapid detection methods, DON-3G escaped detection, especially if bound (Berthiller et al. Citation2009b). Recent studies have shown that some commercial ELISA kits have moderate to full cross reactivity to DON-3G (Nguyen et al. Citation2019) while Righetti and associates (Citation2017) have reported an ELISA method that can simultaneously detect DON, 3-ADON and DON-3G. In general, those monoclonal antibodies that show cross reactivity to DON and 3-ADON will also react to DON-3G. However, inconsistencies between test kits lead to variability in the estimation of total DON content. The only reliable method to properly quantitate both DON and DON-3G in the same sample is by the more expensive and time-consuming LC-HRMS (Malachová et al. Citation2018).
The presence of DON-3G in small grain cereals has been well documented. DON-3G levels in Austrian wheat were reported to be approximately 10% of DON levels but in some cultivars was almost 30% (Berthiller et al. Citation2005). Chinese wheat cultivars contained DON-3G as a percentage of DON ranging from 7–56% (Li et al. Citation2011). Tucker et al. (Citation2019) evaluated sixteen manually inoculated barley varieties from Canada, China, Netherlands and USA with respect to their ability to produce DON-3G from both 3- and 15-ADON chemotypes, concluding that DON-3G constituted a significant percentage (~26%) of the total trichothecene content and that more resistant varieties contained a higher DON-3G to DON ratio. Naturally infected Canadian wheat varieties have been reported with DON-3G to DON ratios of 14–18% as have oats and oat products (Tittlemier et al. Citation2019; Tittlemier et al. Citation2020). Amarasinghe et al. (Citation2016) reported DON-3G to DON ratios as high as 64% in inoculated Canadian spring wheat cultivars, with higher ratios being associated with more resistant varieties.
There have been a few reports of DON-3G occurrence in maize. Berthiller et al. (Citation2009a) reported an average of 14% DON-3G/DON molar ratio in 54 naturally infected maize samples from Europe including one at 46%. A large survey of maize samples from 17 maize production regions in China had DON-3G values ranging from 5–28% of the DON concentration (Wei et al. Citation2012). DON-3G/DON molar ratios of four forage maize cultivars grown in Germany ranged from 14.6 to 24.3% (Birr et al. Citation2021). A recent study (Crippen et al. 2020) which surveyed natural contamination in Ontario maize (genotypes not recorded) from 2015 to 2017 showed that the DON-3G to DON molar ratio ranged from 2.8% to 17.2% with an average of 8.08%. An analysis of 36 naturally contaminated maize varieties in Belgium reported DON levels up to 5660 µg kg−1 (mean 845 µg kg−1) and DON-3G levels up to 1100 µg kg−1 (mean 37 µg kg−1) but did not report on the ratio (De Boevre et al. Citation2014).
To provide data on the occurrence of DON-3G and related trichothecenes in a range of Canadian maize germplasm, 581 inoculated maize samples were evaluated for DON, DON-3G, 15-ADON, and 15-ADON-3G concentration by UHPLC-HRMS. These represented 49 different maize inbreds grown over two crop years that were inoculated with a 15-ADON chemotype of F. graminearum as well as phenotyped for Gibberella ear rot disease severity.
Materials and methods
Fungal inoculum
Two locally isolated 15A-DON-producing strains (DAOM 180378 and DAOM 194276) of F. graminearum were obtained from the Canadian Collection of Fungal Cultures (Agriculture & Agri-Food Canada, Ottawa, ON). Inoculum preparation in a modified Bilay’s liquid medium was as previously described (Reid et al. Citation1992). Macroconidia of the two isolates were obtained separately, filtered and their concentration determined by a haemocytometer. The two isolates were mixed in equal proportions, reaching a final concentration of 1.25 × 10⁵ or 2.5 × 10⁵ spores mL−1, to be used for mycotoxin analysis and phenotyping, respectively.
Inoculation for mycotoxin analysis
Fifty Agriculture & Agri-Food Canada (AAFC) maize inbred lines were chosen for this study, representing a range from moderately resistant to susceptible to F. graminearum kernel infection based on an evaluation of 218 maize inbreds (Jindal et al. Citation2019). These inbreds were planted in one main plot with three blocks of 50 randomized 20-kernel rows for a total of 150 rows over three consecutive field seasons, 2014 through 2016, at the AAFC Central Experimental Farm in Ottawa, Ontario, Canada. One inbred was lost due to early herbicide treatment. Up to five plants per row were shoot-bagged prior to silk emergence and two to three plants were self-crossed in each row to optimize seed set and coordinate timing of inoculations for mycotoxin analysis.
The self-crossed ears were kernel inoculated in the middle of the ear through the husks using a four-pin inoculator device with 1 mL of a F. graminearum macroconidia suspension at eleven days post fertilization, as previously described (Reid et al. Citation1997). The pin length on the inoculator device was adjusted to optimize piercing the husk and three to four developing kernels but not the cob. After inoculation, the plot was irrigated on days without rainfall to maintain high humidity. Two self-crossed and kernel inoculated ears per row were harvested seven to eight weeks post inoculation and stored at −80°C until analysed for trichothecenes.
Mycotoxin extraction
The 2014 samples were lost due to a freezer breakdown and consequently mycotoxin analysis was conducted on up to six ears per inbred for each of the 2015 and 2016 field seasons. A single replicate of 40 infected kernels was removed from each ear while frozen, starting at the inoculation zone and working outwards. Kernels were lyophilized, and ground into homogenized powder using a coffee grinder. Mycotoxins were extracted based on an established multi-mycotoxin extraction protocol (Sulyok et al. Citation2006; Renaud and Sumarah Citation2016) with slight modifications. A quantity of 300 mg was aliquoted from each 40-kernel ground sample, suspended in 2 mL of extraction solvent containing acetonitrile/Milli-Q water/glacial acetic acid (80/18/2) and sonicated at room temperature for 30 minutes in an extraction tube. The suspension was then extracted using an end-to-end extractor for 1 hour at 50 rpm and centrifuged at room temperature at 3000 rpm for 10 minutes. A total of 1 mL of supernatant was removed to a 4 mL vial and evaporated to dryness at room temperature using a GenevacTM Concentrator EZ-2 (ThermoFisher Scientific). The dry content was reconstituted in 1 mL of Milli-Q water/acetonitrile/glacial acetic acid (80/18/2), followed by vortexing for 30 sec and centrifugation in the GenevacTM by changing the setting to ‘centrifuge’ for 10 minutes. The clean supernatant (500 uL) was transferred to autosampler vials for mycotoxin analysis.
LC-MS analyses
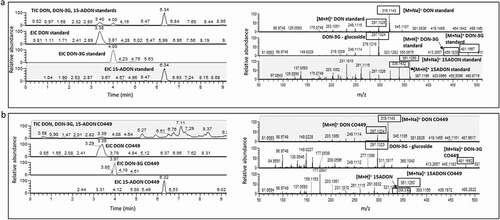
Aliquots were analysed using a Thermo Scientific Dionex Ultimate 3000 UHPLC coupled with Thermo LTQ Orbitrap XL high-resolution mass spectrometer system. Chromatographic conditions were adapted to increase separation of DON, 15-ADON and DON-3G using a Kinetex, F5 100 Å C18 column (Phenomenex, 2.1 × 50 mm, 1.7 µm) with a flow rate of 0.350 mL min−1. Separation was achieved with mobile phase (A) being LC-MS grade water (Thermo Scientific, Fairlawn, NJ) containing 0.1% formic acid and 5 mM ammonium acetate and mobile phase (B) was LC-MS grade methanol (Thermo Scientific, Fairlawn, NJ) containing 0.1% formic acid and 5 mM ammonium acetate. The gradient programme started with 5% mobile phase B for 0.5 min, increased to 95% over the following 10.5 min, then held at 95% B for 3 min. Finally, the gradient returned to 5% B over the course of 2 min and remained at this concentration for 4 min to equilibrate between samplings. The HRMS was performed using Thermo LTQ Orbitrap XL high-resolution mass spectrometer in ESI+ mode, monitoring m/z 50–1000 range with the following parameters: capillary temperature (320°C), sheath gas flow (40 arbitrary units), auxiliary gas flow (5 units), sweep gas flow (2 units), source voltage (4.2 kV), capillary voltage (35 V), tube lens (100 V), maximum injection time (500 ms), microscans (1). DON, 15-ADON and DON-3G annotations were made by comparing retention times, accurate mass within 5 ppm and mass fragmentation patterns observed from in-house (DON, 15-ADON) and commercial (DON-3G: Sigma-Aldrich) standards (). Under the above specified conditions DON, DON-3G and 15-ADON were eluted at 3.38, 4.0 and 6.34 minutes, respectively. The ions detected were the pseudomolecular ions [M+ Na]+, [M + H]+ and corresponding characteristic product ions. 15-ADON-3G was identified by comparing the product ion spectrum in the HRMS with the published literature (Schmeitzl et al. Citation2015; Renaud and Sumarah Citation2016) and eluted at 5.95 minutes just before 15-ADON under the specified experimental conditions.
Fig. 1 Total ion chromatogram (TIC) and extracted ion chromatogram (EIC) (left panel) and HR-mass spectra (right panel) of DON, DON-3G and 15-ADON standards (a) and a representative extract from a CO449 kernel sample (b).
Quantitation of DON, 15-ADON and DON-3G was carried out by building a processing method in Thermo XCalibur 2.2 software (ThermoFisher Scientific Inc, Waltham, MA). Extracted ion chromatogram of precursor ion was generated using a ± 5 ppm mass accuracy threshold. ICIS peak integration algorithm using nine smoothing points and baseline window of 70 was used. External calibration curves were used while building a processing method. The limit of detection (LOD) and limit of quantitation (LOQ) were determined as the lowest concentration achievable whereupon the ion detected and peak area of three consecutive injections resulted in relative standard deviation (RSD) less than 20% respectively. As there was no authentic standard for 15-ADON-3G, the concentration of 15-ADON-3G was estimated using the retro analysis method of Renaud and Sumarah (Citation2016), where 15-ADON-3G concentration is calculated using the DON-3G calibration curve assuming that both of these compounds ionize in a similar manner.
Method validation and quality control
The analytical method was validated by spiking toxin-free maize extract with DON, 15-ADON and DON-3G standards at three different levels in triplicate for each level. Recovery of extraction was calculated by comparing the ratio of analyte signal from the laboratory-fortified sample matrices spiked at 0.5 mg kg−1, 5 mg kg−1 and 10 mg kg−1 before extraction and after extraction. Recovery was calculated as 82% to 93% for DON, 92% to 115% for 15-ADON and 78% to 89% for DON-3G (Supplemental Table 1). The precision of the method calculated in terms of percentage RSD for DON was between (6–15%), for 15-ADON between (2.4–15.2%) and DON-3G between (2.2–5.3%) all showed values lower than 20% of threshold. The limit of detection (LOD) for DON/15-ADON and DON-3G were found to be 0.01 mg kg−1 and 0.02 mg/kg−1 whereas the limit of quantitation (LOQ) was found to be 0.025 mg kg−1 for DON/15-ADON and 0.05 mg kg−1 for DON-3G. Signal suppression/enhancement (SSE) were calculated by the ratio of signal between the laboratory fortified sample matrices after extraction with the laboratory fortified blank spiked at the equivalent concentration (Supplemental Table 1). Five points solvent blank and matrix matched external calibration curves were constructed using in-house DON, 15-ADON and commercial DON-3G (Sigma-Aldrich) to check the linearity (R2 > 0.99) and to minimize matrix interference during calculation of analyte concentration respectively. Quality control samples were processed and analysed along with the study samples to ensure method and instrument performance. Matrix blanks were used to monitor for contamination. Matrix-matched blanks, matrix-matched fortified blanks spiked with a solution of standards were extracted and analysed to monitor method performance.
Disease severity evaluation
For phenotyping analysis, the open-pollinated ears in each row were kernel-inoculated with 2 ml of F. graminearum macroconidial suspension at 11 to 15 days post-silk emergence (2014–2016). At approximately 70 days after inoculation, open-pollinated ears were husked and evaluated for severity of ear rot infection by a single evaluator, using a visual rating scale (ERK, ear rot kernel inoculation), where 1 = no visual infection and 2 = 1 to 3, 3 = 4 to 10, 4 = 11 to 25, 5 = 26 to 50, 6 = 51 to 75, and 7 = >75% of kernels exhibit visible symptoms (Reid and Hamilton Citation1996).
Statistical analysis
A generalized linear mixed model (GLMM) was used to analyse the data over years. R-based software, META-R (Multi-Environment Trial Analysis with R: Alvarado et al. Citation2015), was used to test for differences in genotypes across years for mycotoxin content and disease rating. Pearson correlations were generated in R Studio (R Studio Team Citation2015). One way Analysis of Variance (ANOVA) followed by Tukey multiple comparison test (Graph Pad Prism Software, La Jolla, CA) was used to test for significant differences (DON, DON-3G, DON-3G:DON) between genotypes. All data was tested for normality using the D’Agostino-Pearson and Shapiro-Wilk test in Graph Pad Prism Software. Means were calculated from samples with detectable concentrations of specific compounds.
Results
This study evaluated DON and modified DON content in a set of maize inbred lines adapted to Canada’s short season with improved crop yield and a range of tolerance to ear rot caused by F. graminearum (Supplementary Table 2). GER was induced through artificial kernel inoculation over three field seasons, 2014 to 2016, at the Central Experimental Farm in Ottawa, Ontario. Using a 1 to 7 visual disease rating scale with 7 representing visual infection covering 75–100% of the ear (Reid and Hamilton Citation1996), ear rot kernel (ERK) symptoms showed differentiation in severity amongst maize inbred lines, ranging from a mean of 3.4 to 6.8 (Supplementary Table 2). ERK disease ratings were observed to be fairly consistent between years (r = 0.81; p < 0.001) (). These disease ratings correlate very well (Pearson correlation 0.88, p < 0.001) with previously acquired ERK ratings for these inbreds (Jindal et al. Citation2019).
Table 1. Estimates of variance components, heritability and mean performance of inbred lines for ERK, DON, DON-3G and molar ratio of DON-3G:DON combined over two field test years (2015–2016).
Deoxynivalenol and modified deoxynivalenol determination
A total of 581 field samples (40 kernels nearest the inoculation zone per ear) derived from 9 to 12 ears of each inbred collected over two years (2015, 2016) were analysed for deoxynivalenol (DON), deoxynivalenol-3-glucoside (DON-3G), 15-acetyldeoxynivalenol (15-ADON), and 15-acetyldeoxynivalenol-3-glucoside (15-ADON-3G) by LC-HRMS (single technical replicate per ear). The two F. graminearum strains used as inoculum produce only 15-ADON and not 3-ADON (Bily et al. Citation2004). Each sample represented kernels collected from a single ear. A typical chromatogram of a sample along with that of the standards is shown in . DON, 15-ADON and DON-3G annotations were made by comparing retention times, accurate mass within 5 ppm and mass fragmentation patterns observed from in-house and commercial standards (). More polar than DON, DON-3G has a stronger interaction with the fluorinated reversed phase column (F5, C18), eluting after DON, while 15-ADON elutes at a much higher retention time with the gradient elution programme as described in the methods. Thus, there is clear separation between the three peaks. The extracted ion chromatogram centred ±5 ppm of the exact mass in , exhibiting accurate mass (m/z 319.1139) and (m/z 297.1321) corresponding to pseudomolecular ions for DON [M+ Na]+ and [M + H]+. and for DON-3G (m/z 481.1668) and (m/z 459.1833) corresponding to [M+ Na]+ and [M + H]+, respectively. In addition, the stable fragment (m/z 297.1321) corresponding to DON after glucoside loss were also detected as the characteristic fragmentation pattern in extracted ion chromatogram of DON-3G. Similarly, (m/z 361.1250) and (m/z 339.1432) corresponding to [M+ Na]+ and [M + H]+ for 15-ADON. The characteristic product ion (m/z 137.0593) was used to characterize 15-ADON as seen in . An example of a kernel extract analysis is shown in , which corresponds to 43 mg kg−1 DON, 6.9 mg kg−1 DON-3G and 0.84 mg kg−1 15-ADON. The limit of detection and quantification of DON and 15-ADON was: 0.01 mg kg−1 and 0.025 mg kg−1, whereas for DON-3G was: 0.02 mg kg−1 and 0.05 mg kg−1, respectively (Supplementary Table 1). The presence of 15-ADON-3G was determined using a data-independent acquisition method (Renaud and Sumarah Citation2016). As estimated concentrations were not supported by a standard, 15-ADON-3G was not included in total DON content.
Since maize ears were manually inoculated during the optimal developmental window for GER kernel infection (eleven days post silk emergence) (Reid et al. Citation2002), plants irrigated regularly to maintain high moisture levels, and kernels collected nearest the inoculation zone, the majority of samples were heavily infected with high mycotoxin loads. DON and its conjugated form DON-3G were both detected and quantified in 535 samples. Mean DON concentrations ranged from 51 to 787.5 mg kg−1 while mean DON-3G concentrations ranged from 4.95 to 38.10 mg kg−1 (; Supplementary Table 3). Mean 15-ADON concentrations ranged from 1.4 to 7.8 mg kg−1 and 15-ADON-3G from 0.6–13.8 mg kg−1 (Supplementary Table 3). 15-ADON-3G was not detected in 28% and 36% of 2015 and 2016 samples, respectively. Levels of 15-ADON were lower or undetectable in 2016 compared to 2015. The highest levels for individual samples were 1441.6 mg kg−1 for DON, 97.1 mg kg−1 for DON-3G, 21 mg kg−1 for 15-ADON and 50 mg kg−1 for 15-ADON-3G. DON was not detected in one sample while eight samples contained DON at below quantifiable levels (0.025 mg kg−1). DON-3G was not detected in 22 samples whereas fifteen samples were below the limit of quantitation (0.05 mg kg−1). We compared DON levels between years for each inbred and found no significant difference for 39 inbreds (α = 0.05). The calculated DON-3G to DON mean molar ratio per inbred displayed a range of 3.1% to 19.7% (, Supplemental Table 3) with only CO430 demonstrating a significantly higher DON-3G:DON ratio relative to the lowest 25 lines (p < 0.05). In individual maize samples, DON-3G levels ranged as high as 74.1% of calculated DON levels and the median ratio was 7.6%.
Fig. 2 DON-3G:DON molar ratio and concentrations of DON (a) and DON-3G (b) in manually inoculated maize kernels (2015 and 2016 combined, n = 12). Maize inbreds are ordered by Gibberella ear rot (GER) disease severity, from low to high (left to right). Left axis: average DON or DON-3G (mg kg−1); Right axis: DON-3G:DON % molar ratio. Error bars represent standard deviation.
DON-3G:DON molar ratios and correlations between trichothecenes and disease severity
Both single year and combined over two years (three years for ERK) analysis of variance showed significant differences between genotypes for ERK, DON, DON-3G and molar ratio of DON-3G:DON (). Genotype by environment interaction was significant for all traits tested except DON-3G. Broad sense heritability estimate was the highest for ERK (0.92) and the lowest for DON-3G:DON molar ratio (0.49).
We compared the DON-3G:DON % molar ratio to DON and DON-3G levels in maize inbreds ordered from left to right as a function of disease severity (). In general, the DON-3G:DON molar ratio decreased as disease severity increased, while both the values of DON and DON-3G increased. Kernels of three inbreds contained significantly higher levels of DON-3G (CO272, CO423 and CO437: p < 0.05, ), while inbred CO437 contained significantly higher DON. Conversion of DON to DON-3G seems comparatively lower in these inbreds resulting in lower DON-3G:DON % molar ratios and higher disease severity. For example, CO272, which contained ~563 mg kg−1 DON and ~38 mg kg−1 DON-3G, with a DON-3G:DON molar ratio of 5.4%, is one of the most susceptible lines when kernel inoculated (). In contrast, CO430, containing on average ~72 mg kg−1 DON and ~ 14 mg kg−1 DON-3G with a 19.7% molar ratio, is among the most tolerant lines and showed the lowest disease severity. Therefore, tolerant lines not only have higher DON-3G:DON molar ratios but also have comparatively lower DON content.
Table 2. Comparing DON and modified DON content in the most Gibberella ear rot-susceptible and resistant inbreds via kernel inoculation. The ERK (ear rot kernel) disease rating is based on a visual rating scale ranging from 1 (no visible infection) to 7 (heavily infected).
We examined possible associations between and among mycotoxin levels and disease severity (; Supplementary Table 4). Host susceptibility status measured by ERK disease symptoms was associated with DON levels (r = 0.66; p < 0.01; ). As expected, most of the lines with the lowest observed ERK severity also had the lowest detectable DON levels but there was a moderate correlation between DON-3G levels and disease severity (r = 0.41, p < 0.01; ). There was a negative correlation between DON-3G:DON molar ratio and disease severity (r = −0.64, p < 0.001; ). The DON-3G:DON molar ratio was not correlated with values of DON-3G (r = −0.16, p = 0.28; ), but was negatively correlated with DON levels (r = −0.60, p < 0.0001; ). The strongest correlation was between DON and DON-3G concentrations (r = 0.73; p < 0.01; ). Thus, the most GER resistant lines tended to contain the lowest DON and DON-3G contamination and the highest relative level of DON-3G to DON.
Fig. 3 Linear relationships of Gibberella ear rot kernel (ERK) disease rating with DON content (a), ERK disease rating with DON-3G content (b), ERK disease rating with DON-3G:DON molar ratio (c), DON-3G content with DON-3G:DON molar ratio (d), DON content with DON-3G:DON molar ratio (e), and DON-3G with DON content (f) in kernels of manually inoculated maize inbred ears. Mean values for each inbred are represented by open triangles for the three most Gibberella ear rot-tolerant inbreds, open squares for the three most susceptible inbreds and black circles for the remaining inbreds.
With respect to the acetylated derivatives, the levels of 15-ADON and 15-ADON-3G were not correlated with disease severity (Supplementary Table 4). There was a correlation between 15-ADON and 15-ADON-3G levels (r = 0.43, p < 0.01) but this was not as strong as between DON and DON-3G (Supplementary Table 4). However, there was some correlation (r = 0.4, p < 0.01) between DON-3G and 15-ADON-3G. This lower correlation between the acetylated derivatives might be expected since their levels are so much lower than DON and DON-3G.
We compared the percent reduction in DON, 15-ADON and DON-3G between the three most resistant and most susceptible lines and, to highlight differences and consistency, calculated the percent reduction of DON, DON-3G and total DON between three pairs of contrasting inbreds (). The most susceptible lines contain about 500 mg kg−1 DON compared to the more resistant at about 85 mg kg−1 DON. In general, the reduction of DON is more pronounced than the reduction of DON-3G in the more resistant inbreds compared to the most susceptible lines, which is consistent with a higher capacity to convert DON to DON-3G as well as reduced fungal biomass able to biosynthesize trichothecenes. The DON-3G:DON molar ratio of the most resistant inbreds is 11 to 20% compared to the susceptible ones at ~4 to 5%. The most resistant inbreds contain approximately 85% less total DON (DON +15-ADON + DON-3G) than the most susceptible after a strong fungal challenge.
Discussion
The Canadian-adapted maize inbreds exhibited a wide range of trichothecene content and GER disease tolerance. DON, DON-3G, 15-ADON and 15-ADON-3G were detected in all maize inbreds in this study. Overall, the inbred lines with the least severe GER infection levels also tended to have the higher DON-3G:DON ratios, while at the same time the lowest DON, DON-3G and total DON (DON+15-ADON+DON-3G) content.
Due to the method of artificial kernel inoculation, the focus on kernels closest to the inoculation zone, and the use of maize inbreds with comparatively small ears, trichothecene levels were much higher in our study compared with other studies which generally have surveyed naturally contaminated maize hybrids. Studies from Europe, South Africa, and China reported mean levels for both DON and DON-3G under 2 mg kg−1 (Berthiller et al. Citation2005, Citation2009a; Li et al. Citation2011; Ma et al. Citation2011; De Boevre et al. Citation2012, Citation2014; Wei et al. Citation2012; Ekwomadu et al. Citation2020). Jensen et al. (Citation2020) reported levels of DON up to 18 mg kg−1 (mean of 4.5 mg kg−1) and DON-3G up to 0.506 mg kg−1 (mean of 0.3 mg kg−1) from naturally infected field maize samples in Germany. A survey of naturally infected maize harvested in Ontario, Canada between 2015–2017 reported mean levels of DON and DON-3G to be 41 and 3.8 mg kg−1, respectively, with ranges of 0.1 to 398 mg kg−1 for DON and 0.04 to 28 mg kg−1 for DON-3G (Crippen et al. 2020). Similarly high DON levels relative to this study have been reported in other Canadian studies after artificial inoculation of maize inbreds (Reid et al. Citation1996; Vigier et al. Citation2001; Bolduan et al. Citation2009).
In general, the levels of 15-ADON and 15-ADON-3G were quite low relative to DON and DON-3G. In a time course study of F. graminearum-inoculated maize ears, levels of 15-ADON slowly decreased over time while DON levels first increased significantly prior to falling just before harvest (Miller et al. Citation1983). Yoshizawa and colleagues (Citation1995) had proposed that acetylated DON was hydrolyzed to DON by plant enzymes as F. graminearum grown in vitro predominantly secreted acetylated DON. The glycosylation of 15-ADON was suggested by Schmeitzl et al. (Citation2015) as a major detoxification pathway in a wheat suspension culture, possibly before deacetylation to DON and DON-3G. The deacetylation of 15-ADON to DON appears quite efficient in maize.
We found a good correlation between DON concentration and GER disease. This is in agreement with other studies finding a significant relationship between GER infection and DON levels in manually inoculated maize (Reid et al. Citation1996; Löffler et al. Citation2011; Butrón et al. Citation2015). The inbred lines showing the most resistance had a more pronounced reduction in the level of DON than that of DON-3G in this study (). As a result, the molar ratio of DON-3G to DON was higher in the lines displaying the lowest level of GER infection and total DON content. In a Belgium study, De Boevre and associates (2014) found that in naturally infected samples of 36 maize varieties, the variety influenced DON levels more than DON-3G levels. The focus of breeding programme has been on developing hybrids with reduced visual ear rot symptoms and low DON accumulation. Any resistance mechanisms which work to limit fungal biomass would have a strong impact on inhibiting trichothecene production.
Other maize studies using defined germplasm have reported DON-3G to DON molar ratio ranges similar to what was found in our study. Kernel inoculation of ten maize varieties led to DON-3G:DON mean molar ratios for each genotype ranging from 6.2% to 19.5% (Mitsuhashi et al. Citation2019). DON-3G:DON molar ratios of four forage maize cultivars grown in Germany ranged from 14.6 to 24.3% (Birr et al. Citation2021). In this study, the DON-3G to DON mean molar ratio of 49 inbreds ranged from 3.1 to 19.7% and represents an analysis with a range of known GER-resistance levels.
Overall, the range of the DON-3G to DON percent molar ratio observed in maize studies appears lower than that observed in wheat and barley. The range of DON-3G:DON ratios reported in western Canada spray inoculated wheat and barley was 8 to 63.8% and 15 to 31%, respectively, with the majority of cultivars showing DON-3G:DON ratios greater than 20% (Amarasinghe et al. Citation2016; Tucker et al. Citation2019). Surveying 11 wheat cultivars over two years across the Chinese province of Jiangsu, Dong and associates (2017) determined DON-3G:DON ratios averaged 30% and ranged as high as 83%. These higher observed DON-3G:DON ratios have also been reported in several other European studies of either artificial or naturally contaminated wheat (Berthiller et al. Citation2009a; Rasmussen et al. Citation2012; Bryla et al. Citation2018, Bryla et al. Citation2019). Sampling kernels nearest the inoculation site may have selected for more severely damaged tissues which were less able to convert DON to DON-3G over time. However, despite much lower toxin levels, the calculated molar ratio of DON-3G to DON of 2.8% to 17.2% (mean 8.08%) in a previous study of naturally contaminated maize collected in Ontario was very similar to what we have observed under manual inoculation conditions (Crippen et al. 2020). This suggests that rates of DON to DON-3G conversion may be relatively independent of the DON load present, assuming the disease resistance levels of the maize lines were within a similar range. The conversion of DON to DON-3G may play a more prominent role as a resistance mechanism in wheat and barley than in maize.
In numerous wheat studies regardless of inoculation method (Dall’Asta et al. Citation2013; Ovando-Martinez et al. Citation2013; Audenaert et al. Citation2013; Schweiger et al. Citation2013; Lemmens et al. Citation2016; Amarasinghe et al. Citation2016; Dong et al. Citation2017), more resistant lines exhibit higher DON-3G:DON ratios in response to Fusarium infection. The Pearson correlation coefficients between FHB severity and DON-3G to DON ratio among the wheat trials ranged from −0.27 to −0.96. Lemmens et al. (Citation2016) described studies in which the molar ratio of DON-3G to DON ranged from 7.4% to 18.7%. in sensitive to resistant wheat lines. As in the present study, Byla et al. (2019) also showed a strong correlation (r = 0.96) between DON and DON-3G in Polish wheat with a range of 3.2 to 53.6% DON-3G:DON but this was more correlated with region (reflective of environmental conditions) rather than cultivar. Tucker et al. (Citation2019) found a strong linear relationship amongst DON, DON-3G and FHB disease severity in field inoculated barley, but did not observe a strong association between FHB symptoms and DON-3G:DON molar ratio. The range of 15 to 31% DON-3G:DON at the mature grain stage across 16 barley genotypes suggests a high basal level of UGT activity in barley. DON-3G:DON ratios in rachis tissue were much higher than in barley grain, suggesting a mechanism for the type II resistance (resistance to spread within a spike) observed in barley.
To date, there has not been a maize UGT linked to resistance to GER, however even the most sensitive lines are able to convert DON to DON-3G. We can only speculate that perhaps the more resistant lines may have an enhanced UGT capability. Schweiger et al. (Citation2013) and Lemmens et al. (Citation2016) found that resistant wheat lines displayed high DON-3G to DON % molar ratios and that the effect was quantitative with the introgression of several QTLs. They also demonstrated that various combinations of QTLs with different resistance mechanisms that significantly reduce DON content showed an increase in DON-3G:DON ratio. Whether this same effect would be seen in maize requires further studies and information on maize QTLs in these inbred lines. In a recent study of the effect of various fungicides on GER disease severity and DON accumulation over three years in Southern Ontario maize, Eli et al. (Citation2021) observed that while the use of fungicide reduced disease severity as well as both DON and DON-3G in a similar magnitude, the DON-3G/DON ratio was only affected by hybrid. A detailed time course study tracking fungal biomass and trichothecene profiles in maize lines exhibiting contrasting DON-3G:DON ratios may provide further insight into the 15-ADON conversion pathway and impact of trichothecene detoxification on fungal infection.
As breeding for disease resistance is considered the best approach to reducing mycotoxin contamination of grain, identifying a trait contributing to ear rot resistance can be an additional tool in the selection of disease-resistant germplasm. Genetic mapping and associated studies have used ear rot disease ratings and DON content to map numerous regions of the maize genome making small contributions to resistance, but the underlying mechanisms have not been elucidated (Gaikpa and Miedaner Citation2019). The DON-3G:DON ratio has been interpreted as a DON detoxification indicator (Berthiller et al. Citation2013) and the mapping of this trait may help to dissect mechanisms, identify genes responsible for this trait, and determine the importance of this trait relative to other resistance mechanisms.
Supplementary_Tables1-4v2.xlsx
Download MS Excel (37.2 KB)Disclosure statement
No potential conflict of interest was reported by the author(s).
Supplementary data
Supplemental data for this article can be accessed online here: https://doi.org/10.1080/07060661.2022.2032830
Additional information
Funding
Related Research Data
References
- Alvarado G, López M, Vargas M, Á P, Rodríguez F, Burgueño J, and Crossa J 2015. META-R (Multi Environment Trial Analysis with R for Windows) Version 6.04, CIMMYT Research Data & Software Repository Network 2, https://data.cimmyt.org/dataset.xhtml?persistentId=hdl:11529/10201 Accessed April 15 2020.
- Amarasinghe CC, Senay Simsek S, Brûlé-Babel A, Fernando WGD. 2016. Analysis of deoxynivalenol and deoxynivalenol-3-glucosides content in Canadian spring wheat cultivars inoculated with Fusarium graminearum. Food Addit Contam Part A. 33(7):1254–1264. doi:https://doi.org/10.1080/19440049.2016.1198050.
- Audenaert K, De Boevre M, Vanheule A, Callewaert J, Bekaert B, Höfte M, De Saeger S, Haesaert G. 2013. Mycotoxin glucosylation in commercial wheat varieties: impact on resistance to Fusarium graminearum under laboratory and field conditions. Food Control. 34(2):756–762. doi:https://doi.org/10.1016/j.foodcont.2013.06.019.
- Bai GH, Desjardins AE, Plattner RD. 2002. Deoxynivalenol-nonproducing Fusarium graminearum causes initial infection, but does not cause disease spread in wheat spikes. Mycopathologia. 153(2):91–98. doi:https://doi.org/10.1023/A:1014419323550.
- Berthiller F, Crews C, Dall’Asta C, De Saeger S, Haesaert G, Karlovsky P, Oswald IP, Seefelder W, Speijers G, Stroka J. 2013. Masked mycotoxins: a review. Mol Nutr Food Res. 57(1):165–186. doi:https://doi.org/10.1002/mnfr.201100764.
- Berthiller F, Dall’asta C, Corradini R, Marchelli R, Sulyok M, Krska R, Adam G, Schuhmacher R. 2009a. Occurrence of deoxynivalenol and its 3-β-D-glucoside in wheat and maize. Food Addit Contam Part A. 26(4):507–511. doi:https://doi.org/10.1080/02652030802555668.
- Berthiller F, Dall’asta C, Schuhmacher R, Lemmens M, Adam G, Krska R. 2005. Masked mycotoxins: determination of a deoxynivalenol glucoside in artificially and naturally contaminated wheat by liquid chromatography−tandem mass spectrometry. J Agric Food Chem. 53(9):3421–3425. doi:https://doi.org/10.1021/jf047798g.
- Berthiller F, Krska R, Domig KJ, Kneifel W, Juge N, Schuhmacher R, Adam G. 2011. Hydrolytic fate of deoxynivalenol-3-glucoside during digestion. Toxicol Lett. 206(3):264–267. doi:https://doi.org/10.1016/j.toxlet.2011.08.006.
- Berthiller F, Schuhmacher R, Adam G, Krska R. 2009b. Formation, determination and significance of masked and other conjugated mycotoxins. Anal Bioanal Chem. 395(5):1243–1252. doi:https://doi.org/10.1007/s00216-009-2874-x.
- Bily AC, Reid LM, Savard ME, Reddy R, Blackwell BA, Campbell CM, Krantis A, Durst T, Philogene BJR, Arnason JT, et al. 2004. Analysis of Fusarium graminearum mycotoxins in different biological matrices by LC/MS. Mycopathologia. 157(1):117–126. doi:https://doi.org/10.1023/B:MYCO.0000012218.27359.ec
- Birr T, Jensen T, Preußke N, Sönnichsen FD, De Boevre M, De Saeger S, Hasler M, Verreet JA, Klink H. 2021. Occurrence of Fusarium mycotoxins and their modified forms in forage maize cultivars. Toxins. 13(2):110. doi:https://doi.org/10.3390/toxins13020110.
- Bolduan C, Miedaner T, Schipprack W, Dhillon BS, Melchinger AE. 2009. Genetic variation for resistance to ear rots and mycotoxins contamination in early European maize inbred lines. Crop Sci. 49(6):2019–2028. doi:https://doi.org/10.2135/cropsci2008.12.0701.
- Boutigny A-L, Richard-Forget F, Barreau C. 2008. Natural mechanisms for cereal resistance to the accumulation of Fusarium trichothecenes. Eur J Plant Pathol. 121(4):411–423. doi:https://doi.org/10.1007/s10658-007-9266-x.
- Bryła M, Ksieniewicz-Woźniak E, Waśkiewicz A, Szymczyk K, Jędrzejczak R. 2018. Natural occurrence of nivalenol, deoxynivalenol, and deoxynivalenol-3-glucoside in Polish winter wheat. Toxins. 10(2):81. doi:https://doi.org/10.3390/toxins10020081.
- Bryła M, Ksieniewicz-Woźniak E, Yoshinari T, Waśkiewicz A, Szymczyk K. 2019. Contamination of wheat cultivated in various regions of Poland during 2017 and 2018 agricultural seasons with selected trichothecenes and their modified forms. Toxins. 11(2):88. doi:https://doi.org/10.3390/toxins11020088.
- Buerstmayr H, Lemmens M. 2015. Breeding healthy cereals: genetic improvement of Fusarium resistance and consequences for mycotoxins. World Mycotoxin J. 8(5):591–602. doi:https://doi.org/10.3920/WMJ2015.1889.
- Butrón A, Reid LM, Santiago R, Cao A, Malvar RA. 2015. Inheritance of maize resistance to gibberella and fusarium ear rots and kernel contamination with deoxynivalenol and fumonisins. Plant Pathol. 64(5):1053–1060. doi:https://doi.org/10.1111/ppa.12351.
- Crippin T, Limay-Rios V, Renaud JB, Schaafsma AW, Sumarah MW, Miller JD. 2020. Fusarium graminearum populations from maize and wheat in Ontario, Canada. World Mycotoxin J. 13(3):355–366. doi:https://doi.org/10.3920/WMJ2019.2532.
- Dall’Asta C, Dall’Erta A, Mantovani P, Massi A, Galaverna G. 2013. Occurrence of deoxynivalenol and deoxynivalenol-3-glucoside in durum wheat. World Mycotoxin J. 6(1):83–91. doi:https://doi.org/10.3920/WMJ2012.1463.
- Dall’Erta A, Cirlini M, Dall’Asta M, Del Rio D, Galaverna G, and Dall’Asta C. 2013. Masked mycotoxins are efficiently hydrolyzed by human colonic microbiota releasing their aglycones. Chem Res Toxicol. 26(3):305–312. https://doi.org/https://doi.org/10.1021/tx300438c.
- De Boevre M, Di Mavungu JD, Maene P, Audenaert K, Deforce D, Haesaert G, De Saeger S. 2012. Development and validation of an LC-MS/MS method for the simultaneous determination of deoxynivalenol, zearalenone, T-2-toxin and some masked metabolites in different cereals and cereal- derived food. Food Addit Contam Part A. 29:819–835. doi:https://doi.org/10.1080/19440049.2012.656707.
- De Boevre M, Landschoot S, Audenaert K, Maene P, Di Mavungu D, Eeckhout M, Haesaert G, De Saeger S. 2014. Occurrence and within field variability of Fusarium mycotoxins and their masked forms in maize crops in Belgium. World Mycotoxin J. 7(1):91–102. doi:https://doi.org/10.3920/WMJ2013.1608.
- Desjardins AE, Proctor RH, Bai G, McCormick SP, Shaner G, Buechley G, Hohn TM. 1996. Reduced virulence of trichothecene antibiotic-non-producing mutants of Gibberella zeae in wheat field tests. Mol Plant-Microbe Interact. 9:775–781. doi:https://doi.org/10.1094/MPMI-9-0775.
- Dong F, Wang S, Yu M, Sun Y, Xu J, Shi J. 2017. Natural occurrence of deoxynivalenol and deoxynivalenol-3-glucoside in various wheat cultivars grown in Jiangsu province, China. World Mycotoxin J. 10(3):285–293. doi:https://doi.org/10.3920/WMJ2016.2158.
- EFSA (European Food Safety Authority) Panel on Contaminants in the Food Chain (CONTAM). 2017. Risks to human and animal health related to the presence of deoxynivalenol and its acetylated and modified forms in food and feed. EFSA J. 15:e04718.
- Ekwomadu TI, Dada TA, Nleya N, Gopane R, Sulyok M, Mwanza M. 2020. Variation of Fusarium free, masked, and emerging mycotoxin metabolites in maize from agriculture regions of South Africa. Toxins. 12(3):149. doi:https://doi.org/10.3390/toxins12030149.
- Eli K, Schaafsma AW, Limay-Rios V, Hooker DC. 2021. Effect of pydiflumetofen on Gibberella ear rot and Fusarium mycotoxin accumulation in maize grain. World Mycotoxin J. 14(4):495–512. doi:https://doi.org/10.3920/WMJ2020.2638.
- Freire L, Sant’Ana AS. 2018. Modified mycotoxins: an updated review on their formation, detection, occurrence, and toxic effects. Food Chem Toxicol. 111:189–205. doi:https://doi.org/10.1016/j.fct.2017.11.021.
- Gaikpa DS, Miedaner T. 2019. Genomics-assisted breeding for ear rot resistances and reduced mycotoxin contamination in maize: methods, advances and prospects. Theor Appl Genet. 132(10):2721–2739. doi:https://doi.org/10.1007/s00122-019-03412-2.
- Goswami RS, and Kistler HC. 2004. Heading for disaster: Fusarium graminearum on cereal crops. Mol Plant Pathol. 5(6):515–525. doi:https://doi.org/10.1111/j.1364-3703.2004.00252.x.
- Gratz SW, Duncan G, Richardson AJ. 2013. The human fecal microbiota metabolizes deoxynivalenol and deoxynivalenol-3-glucoside and may be responsible for urinary deepoxy-deoxynivalenol. Appl Environ Microbiol. 79(6):1821–1825. doi:https://doi.org/10.1128/AEM.02987-12.
- Gruber-Dorninger C, Jenkins T, Schatzmayr G. 2019. Global mycotoxin occurrence in feed: a ten-year survey. Toxins. 11(7):375. doi:https://doi.org/10.3390/toxins11070375.
- Harris LJ, Desjardins AE, Plattner RD, Nicholson P, Butler G, Young JC, Weston G, Proctor RH, Hohn TM. 1999. Possible Role of Trichothecene Mycotoxins in Virulence of Fusarium graminearum on Maize. Plant Dis. 83(10):954–960. doi:https://doi.org/10.1094/PDIS.1999.83.10.954.
- Jensen T, De Boevre M, De Saeger S, Preußke N, Sönnichsen FD, Kramer E, Klink H, Verreet JA, Birr T. 2020. Effect of ensiling duration on the fate of deoxynivalenol, zearalenone and their derivatives in maize silage. Mycotoxin Research. 36(2):127–136. doi:https://doi.org/10.1007/s12550-019-00378-4.
- Jindal KK, Zhu X, Tenuta AU, Javed N, Daayf F, Reid LR. 2019. Maize inbreds for multiple resistance breeding against major foliar, ear and stalk rot diseases. Maydica. 64:22.
- Kluger B, Bueschl C, Lemmens M, Michlmayr H, Malachova A, Koutnik A, Maloku I, Berthiller F, Adam G, Krska R. 2015. Biotransformation of the mycotoxin deoxynivalenol in Fusarium resistant and susceptible near isogenic wheat lines. PLoS ONE. 10(3):e0119656. doi:https://doi.org/10.1371/journal.pone.0119656.
- Kostelanska M, Dzuman Z, Malachova A, Capouchova I, Prokinova E, Skerikova A, Hajslova J. 2011. Effects of milling and baking technologies on levels of deoxynivalenol and its masked form deoxynivalenol-3-glucoside. J Agric Food Chem. 59(17):9303–9312. doi:https://doi.org/10.1021/jf202428f.
- Lemmens M, Scholz U, Berthiller F, Dall’Asta C, Koutnik A, Schuhmacher R, Adam G, Buerstmayr H, Á M, Krska R. 2005. The ability to detoxify the mycotoxin deoxynivalenol colocalizes with a major quantitative trait locus for Fusarium head blight resistance in wheat. Mol Plant Microbe Interact. 18:1318–1324. doi:https://doi.org/10.1094/MPMI-18-1318.
- Lemmens M, Steiner B, Sulyok M, Nicholson P, Mesterhazy A, Buerstmayr H. 2016. Masked mycotoxins: does breeding for enhanced Fusarium head blight resistance result in more deoxynivalenol-3-glucoside in new wheat varieties? World Mycotoxin J. 9(5):741–754. doi:https://doi.org/10.3920/WMJ2015.2029.
- Li F-Q, Yu CC, Shao B, Wang W, Yu W, Yu H-X. 2011. Natural occurrence of masked deoxynivalenol and multi-mycotoxins in cereals from China harvested in 2007 and 2008. Chin J Prev Med. 45:57–63.
- Li P, Su R, Yin R, Lai D, Wang M, Liu Y, Zhou L. 2020. Detoxification of mycotoxins through biotransformation. Toxins. 12(2):121. doi:https://doi.org/10.3390/toxins12020121.
- Löffler M, Kessel B, Ouzunova M, Miedaner T. 2011. Covariation between line and testcross performance for reduced mycotoxin concentrations in European maize after silk channel inoculation of two Fusarium species. Theor Appl Genet. 122(5):925–934. doi:https://doi.org/10.1007/s00122-010-1499-y.
- Ma J, Bing S, Xiaohui L, Hongxia Y, Fengqin L. 2011. Study on the natural occurrence of multi-mycotoxin in cereal and cereal-based product samples collected from parts of China in 2010. Chin J Food Hyg. 23:481–488.
- Malachová A, Stránská M, Václavíková M, Elliott CT, Black C, Meneely J, Hajšlová J, Ezekiel CN, Schuhmacher R, Krska R. 2018. Advanced LC–MS-based methods to study the co-occurrence and metabolization of multiple mycotoxins in cereals and cereal-based food. Anal Bioanal Chem. 410(3):801–825. doi:https://doi.org/10.1007/s00216-017-0750-7.
- McCormick SP, Stanley AP, Stover NA, Alexander NJ. 2011. Trichothecenes: from simple to complex mycotoxins. Toxins. 3(7):802–814. doi:https://doi.org/10.3390/toxins3070802.
- Mesterházy A. 1995. Types and components of resistance to Fusarium Head Blight of wheat. Plant Breed. 114(5):377–386. doi:https://doi.org/10.1111/j.1439-0523.1995.tb00816.x.
- Miller JD, and Richardson SN. 2013. Mycotoxins in Canada: a perspective for 2013. Ottawa (ON): Regulatory Governance Initiative, Carleton University. https://scabusa.org/pdfs/Mycotoxins-in-Canada_Sept-13.pdf. Accessed September 15, 2020.
- Miller JD, Young JC, Trenholm HL. 1983. Fusarium toxins in field corn. I. Time course of fungal growth and production of deoxynivalenol and other mycotoxins. Can J Botany. 61(12):3080–3087. doi:https://doi.org/10.1139/b83-345.
- Mitsuhashi S, Nakagawa H, Matsuo Y, Kikawada T, Tamaki H, Sato H. 2019. 飼料用トウモロコシにおけるF. graminearum由来のデオキシニバレノールおよび配糖体(モディファイドマイコトキシン)濃度の品種系統間差. JSM Mycotoxins. 69(1):1–8. doi:https://doi.org/10.2520/myco.69-1-5.
- Munkvold GP. 2003. Epidemiology of Fusarium diseases and their mycotoxins in maize ears. Eur J Plant Pathol. 109(7):705–713. doi:https://doi.org/10.1023/A:1026078324268.
- Nguyen NT, Varga E, Maragos C, Baumgartner S, Adam G, Berthiller F. 2019. Cross-reactivity of commercial and non-commercial deoxynivalenol-antibodies to emerging trichothecenes and common deoxynivalenol-derivatives. World Mycotoxin J. 12(1):45–53. doi:https://doi.org/10.3920/WMJ2018.2363.
- Ontario Ministry of Agriculture, Food and Rural Affairs ( OMAFRA). 2021. http://www.omafra.gov.on.ca/english/stats/crops/index.html Accessed September 13, 2020.
- Ovando-Martínez M, Ozsisli B, Anderson J, Whitney K, Ohm J-B, Simsek S. 2013. Analysis of Deoxynivalenol and Deoxynivalenol-3-glucoside in Hard Red Spring Wheat Inoculated with Fusarium graminearum. Toxins. 5(12):2522–2532. doi:https://doi.org/10.3390/toxins5122522.
- Rasmussen PH, Nielsen KF, Ghorbani F, Spliid NH, Nielsen GC, Jørgensen LN. 2012. Occurrence of different trichothecenes and deoxynivalenol-3-β-D-glucoside in naturally and artificially contaminated Danish cereal grains and whole maize plants. Mycotoxin Research. 28(3):181–190. doi:https://doi.org/10.1007/s12550-012-0133-z.
- Reid LM, Hamilton RI. 1996. Effects of inoculation position, timing, macroconidial concentration, and irrigation on resistance of maize to Fusarium graminearum infection through kernels. Can J Plant Pathol. 18(3):279–285. doi:https://doi.org/10.1080/07060669609500625.
- Reid LM, Hamilton RI, Schaafsma AW. 1997. Automatic pipettor for inoculation of maize kernels for evaluation of resistance to ? Fusarium graminearum. Can J Plant Pathol. 19(2):185–187. doi:https://doi.org/10.1080/07060669709500551.
- Reid LM, Mather DE, Hamilton RI, Bolton AT. 1992. Genotypic differences in the resistance of maize silk to Fusarium graminearum. Can J Plant Pathol. 14(3):211–214. doi:https://doi.org/10.1080/07060669209500877.
- Reid LM, Stewart DW, Hamilton RI. 1996. A 4-Year Study of the Association Between Gibberella Ear Rot Severity and Deoxynivalenol Concentration. Journal of Phytopathology. 144(9–10):431–436. doi:https://doi.org/10.1111/j.1439-0434.1996.tb00319.x.
- Reid LM, Woldemariam T, Zhu X, Stewart DW, Schaafsma AW. 2002. Effect of inoculation time and point of entry on disease severity in Fusarium graminearum, Fusarium verticillioides, or Fusarium subglutinans inoculated maize ears. Can J Plant Pathol. 24(2):162–167. doi:https://doi.org/10.1080/07060660309506991.
- Renaud JB, Sumarah MW. 2016. Data independent acquisition-digital archiving mass spectrometry: application to single kernel mycotoxin analysis of Fusarium graminearum infected maize. Anal Bioanal Chem. 408:3083–3091.
- Righetti L, Galaverna G, Dall’Asta C. 2017. Group detection of DON and its modified forms by an ELISA kit. Food Addit Contam Part A. 34:248–254.
- Rosser B, and Tenuta A. 2018. 2018 grain corn ear mould and vomitoxin (DON) survey. Field Crop News. https://fieldcropnews.com/2018/10/2018-grain-corn-ear-mould-and-vomitoxin-don-survey/. Accessed September 15, 2020.
- Scarpino V, Vanara F, Sulyok M, Krska R, Blandino M. 2021. Fate of regulated, masked, emerging mycotoxins and secondary fungal metabolites during different large-scale maize dry-milling processes. Food Res Int. 140:109861. doi:https://doi.org/10.1016/j.foodres.2020.109861.
- Schaarschmidt S, Fauhl-Hassek C. 2020. The fate of mycotoxins during secondary food processing of maize for human consumption. Comp Rev Food Sci Food Safety. 20(1):91–148. doi:https://doi.org/10.1111/1541-4337.12657.
- Schmeitzl C, Warth B, Fruhmann P, Michlmayr H, Malachová A, Berthiller F, Schuhmacher R, Krska R, Adam G. 2015. The Metabolic Fate of Deoxynivalenol and Its Acetylated Derivatives in a Wheat Suspension Culture: identification and Detection of DON-15-O-Glucoside, 15-Acetyl-DON-3-O-Glucoside and 15-Acetyl-DON-3-Sulfate. Toxins. 7(8):3112–3126. doi:https://doi.org/10.3390/toxins7083112.
- Schweiger W, Boddu J, Shin S, Poppenberger B, Berthiller F, Lemmens M, Muehlbauer GJ, Adam G. 2010. Validation of a candidate deoxynivalenol-inactivating UDP-glucosyltransferase from barley by heterologous expression in yeast. Mol Plant Microbe Interact. 23(7):977–986. doi:https://doi.org/10.1094/MPMI-23-7-0977.
- Schweiger W, Steiner B, Ametz C, Siegwart G, Wiesenberger G, Berthiller F, Lemmens M, Jia H, Adam G, Muehlbauer GJ, et al. 2013. Transcriptomic characterization of two major Fusarium resistance quantitative trait loci (QTLs), Fhb1 and Qfhs.ifa-5A, identifies novel candidate genes. Mol Plant Pathol. 14:772–785.
- Sewald N, von Gleissenthall Jl, Schuster M, Müller G, Aplin RT, von Gleissenthall JL. 1992. Structure elucidation of a plant metabolite of 4-desoxynivalenol. Tetrahedron Asymmetry. 3(7):953–960. doi:https://doi.org/10.1016/S0957-4166(00)82193-X.
- Shin S, Torres-Acosta JA, Heinen SJ, McCormick S, Lemmens M, Paris MPK, Berthiller F, Adam G, Muehlbauer GJ. 2012. Transgenic Arabidopsis thaliana expressing a barley UDP-glucosyltransferase exhibit resistance to the mycotoxin deoxynivalenol. J Exp Bot. 63(13):4731–4740. doi:https://doi.org/10.1093/jxb/ers141.
- Spanic V, Zdunic Z, Drezner G, Sarkanj B. 2019. The pressure of Fusarium disease and its relation with mycotoxins in the wheat grain and malt. Toxins. 11(4):198. doi:https://doi.org/10.3390/toxins11040198.
- Studio Team R. 2015. R Studio: integrated Development for R Studio. Boston (MA): Inc. http://www.rstudio.com/ Accessed April 15, 2020.
- Sulyok M, Berthiller F, Krska R, Schuhmacher R. 2006. Development and validation of a liquid chromatography/tandem mass spectrometric method for the determination of 39 mycotoxins in wheat and maize. Rapid Commun Mass Spectrom. 20(18):2649–2659. doi:https://doi.org/10.1002/rcm.2640.
- Sutton JC. 1982. Epidemiology of wheat head blight and maize ear rot caused by Fusarium graminearum. Can J Plant Pathol. 4(2):195–209. doi:https://doi.org/10.1080/07060668209501326.
- Tittlemier SA, Blagden R, Chan J, Gaba D, Mckendry T, Pleskach K, and Roscoe M. 2019. Fusarium and Alternaria mycotoxins present in Canadian wheat and durum harvest samples. Can J Plant Pathol. 41(3):403–414. doi:https://doi.org/10.1080/07060661.2019.1592784.
- Tittlemier SA, Blagden R, Chan J, McMillan TL, Pleskach K, and Izydorczyk MS. 2020. Effects of processing whole oats on the analysis and fate of mycotoxins and ergosterol. World Mycotoxin J. 13(1):45–56. doi:https://doi.org/10.3920/WMJ2019.2530.
- Tucker JR, Badea A, Blagden R, Pleskach K, Tittlemier SA, Fernando WGD. 2019. Deoxynivalenol-3-glucoside content is highly associated with deoxynivalenol levels in two-row barley genotypes of importance to Canadian barley breeding programs. Toxins. 11:319.
- Vigier B, Reid LM, Dwyer LM, Stewart DW, Sinha RC, Arnason JT, Butler G. 2001. Maize resistance to gibberella ear rot: symptoms, deoxynivalenol, and yield. Can J Plant Pathol. 23(1):99–105. doi:https://doi.org/10.1080/07060660109506915.
- Wang H, Sun S, Ge W, Zhao L, Hou B, Wang K, Lyu Z, Chen L, Xu S, Guo J, et al. 2020. Horizontal gene transfer of Fhb7 from fungus underlies Fusarium head blight resistance in wheat. Science. 368(6493):6493. doi:https://doi.org/10.1126/science.aba5435
- Wei W, Jiao-Jie M, Chuan-Chuan Y, Xiao-Hui L, Hong-Ru J, Bing S, Feng-Qin L. 2012. Simultaneous determination of masked deoxynivalenol and some important type B trichothecenes in Chinese corn kernels and corn-based products by ultra-performance liquid chromatography-tandem mass spectrometry. J Agric Food Chem. 60(46):11638–11646. doi:https://doi.org/10.1021/jf3038133.
- Wilson W, Dahl B, Nganje W. 2018. Economic costs of Fusarium Head Blight, scab and deoxynivalenol. World Mycotoxin J. 11(2):291–302. doi:https://doi.org/10.3920/WMJ2017.2204.
- Yoshizawa T, Jin Y-Z. 1995. Natural occurrence of acetylated derivatives of deoxynivalenol and nivalenol in wheat and barley in Japan. Food Addit Contam. 12(5):689–694. doi:https://doi.org/10.1080/02652039509374358.
- Zhang Z, Nie D, Fan K, Yang J, Guo W, Meng J, Zhao Z, Han Z. 2020. A systematic review of plant-conjugated masked mycotoxins: occurrence, toxicology, and metabolism. Critical Rev Food Sci Nutr. 60(9):1523–1537. doi:https://doi.org/10.1080/10408398.2019.1578944.