
ABSTRACT
In recent decades, shared mobility has gained prominence as a sustainable alternative in transport, yet a comprehensive understanding of its effects on travel behaviour remains limited. This paper provides a narrative review of quantitative empirical studies, focusing on car-sharing and bike-sharing, and revisits the magnitude of the effects on four indicators: public transport use, active transport use, auto dependence, and auto ownership. Both cross-sectional and longitudinal perspectives are considered, examining variances in trip characteristics. Shared mobility users tend to rely less on private vehicles and increase cycling, with varying effects on transit use and walking. Car-sharing typically replaces private vehicles for non-commuting trips, while bike-sharing mainly competes with rather than complements public transport, especially for shorter commutes. The longitudinal effects of shared mobility appear more limited than those observed in cross-sectional analyses, indicating that shared mobility can potentially lead to a positive trend in travel mode shifts over time, albeit slowly. Additionally, this study highlights differences in shared mobility outcomes between Australia and other global contexts, exploring potential reasons for these discrepancies. Integrating shared mobility and other transport paradigms requires long-term strategies to shape travel behaviour towards multimodality, offering a continuum of choices covering most daily trips without private vehicles.
1. Introduction
Urbanisation and the associated surge in motor vehicles and travel demand have led to significant challenges for transport planners worldwide. Public transport systems have played a critical role in urban mobility over the years, despite facing various challenges such as limited coverage, inconsistent service levels, and overcrowding during peak hours. Shared mobility has emerged as a solution to urban transport issues in recent years, allowing users short-term access to shared transport modes including vehicles, bicycles, or scooters. These mobility services offer users the convenience and flexibility of private vehicle use without the associated costs of ownership. Shared mobility services present a cost-effective solution for short-term transport needs by bridging the gap between private car usage and traditional public transit systems with their intermediate transport mode (Vasconcelos et al. Citation2017; Shaheen, Chan, and Micheaux Citation2015). Shared mobility offers a solution to mitigate urban transport issues, such as reducing energy consumption and greenhouse gas emissions (Martin and Shaheen Citation2011a; Ou et al. Citation2023), alleviating traffic congestion (Santos Citation2018), providing cost and time efficiencies for travellers and improving spatial and temporal accessibility (Hu and Creutzig Citation2022).
Car-sharing and bike-sharing emerge as the two most prevalent forms of shared mobility, representing motorised and non-motorised transport modes, respectively. These distinct modes serve different segments of the population and address varying transport needs. Car-sharing typically appeals to individuals or groups requiring a vehicle for a few hours a day, which is ideal for medium to long distances, non-commuting trips, leisure activities, or instances where public transit is not feasible (Cervero Citation2003; Cervero and Tsai Citation2004; Cervero, Golub, and Nee Citation2007). While bike-sharing primarily serves short-distance commuters, tourists exploring a city, or those trying to bridge the gap between a public transport station and their origin or destination (Buck et al. Citation2013; Fishman Citation2016; Shaheen, Chan, and Micheaux Citation2015). While both car-sharing and bike-sharing can influence travel behaviour, they do so in varied manners. Assessing them together not only provides an in-depth perspective of shared mobility but also brings into focus the unique challenges and advantages each mode offers. Understanding why individuals opt for one mode over the other or how they integrate them with other transport modes can provide valuable insights into evolving travel patterns.
Extensive research has been conducted on how shared mobility affects users’ travel behaviour, revealing that it can serve as either a supplement or alternative to traditional modes of transport (Liao and Correia Citation2022). While shared mobility might influence modal choices and vehicle ownership patterns, the full magnitude of its impact remains unclear. Shared mobility has the potential to encourage users to adopt sustainable travel modes like cycling, and reduce their reliance on private vehicles, which can help slow the growth rate of auto ownership (Martin and Shaheen Citation2011a). However, its impact on walking is complex, with bike-sharing often decreasing walking frequency while increasing cycling (Shaheen et al. Citation2012&2013). Additionally, shared mobility can complement or compete with public transport, as it allows users to access transit sites through shared mobility or leading to a modal shift to shared mobility for specific trips (Zhu et al. Citation2022).
A growing body of literature has emerged to understand who uses shared mobility services and their travel behaviour characteristics (Zhang et al. Citation2018). However, the impact of trip characteristics such as the trip purpose, distance, or time of trip on the choice of shared mobility has been relatively unexplored in the literature. Studies show positive outcomes like decreased vehicle reliance, but results vary due to methodological differences. Cross-sectional analyses compare the observable travel behaviour of shared mobility users and non-users, while longitudinal analyses of shared mobility examine changes in users’ travel behaviour over time, including before and after using shared mobility (Bao et al. Citation2023; Rindfleisch et al. Citation2008). However, there seems to be a lack of distinction in the literature between these two different analytical approaches and their implications.
Australia, known for its entrenched car culture, has 20 million motor vehicles registered for a population of 25 million (Soltani et al. Citation2022). Despite this prevailing vehicle reliance, there is a noticeable shift towards shared mobility solutions. Sydney took the lead in this transformation, introducing the nation's first car-sharing scheme, GoGet, in Newtown in 2003. Currently, car-sharing schemes are operating in multiple cities such as Adelaide, Brisbane, Canberra, and Melbourne. Regarding cycling, while private bike usage in Australia has increased, bike-sharing has not kept pace with global trends (Fishman et al. Citation2015). Melbourne and Brisbane first rolled out their bike-sharing schemes in 2010, however, the usage rates were modest (Fishman Citation2016; Mateo-Babiano et al. Citation2016). Since 2017, a wave of dockless bike-sharing programs like Ofo and ReddyGo emerged in cities like Sydney. However, these services faced setbacks and some ceased operations, facing challenges such as low usage rates, extensive vandalism, and heavy fines, leading to their underdevelopment in Australia (Heymes Citation2019; Soltani et al. Citation2019). Challenging its prevailing car-dominated paradigm, Australia's trajectory in shared mobility will be shaped by strategic policy decisions, infrastructure enhancement, and addressing unique challenges such as helmet legislation.
This is a narrative review that examines the quantitative impact of shared mobility on travel behaviour, with a particular focus on car-sharing and bike-sharing. The review primarily sources English-language literature from Google Scholar, employing targeted search terms such as ‘shared mobility’, ‘shared transport’, ‘bike-sharing’, ‘bikeshare’, ‘shared bikes’, ‘public bike’, ‘car-sharing’, ‘carshare’, ‘shared cars’, ‘travel pattern’, and ‘travel behaviour’. To enhance the robust coverage, particularly for Australian research, the Web of Science was also utilised. In addition to this targeted search, the review employed a backward snowballing approach for more in-depth exploration, examining references from initially identified articles. This method was vital for discovering studies potentially missed by database searches. The selection was limited to quantitative research, encompassing both cross-sectional and longitudinal studies. An effort was made to identify and exclude redundant studies using the same dataset. While this review features research from global regions, it is important to acknowledge the rapid growth in shared mobility research. As a result, some recent publications postdating our literature selection might not be covered here.
This review begins by examining the characteristics of trips including trip purpose, trip distance, and time of trip undertaken by these shared mobility modes. It evaluates the impacts of these shared mobility services on four aspects of travel behaviour: transit use, active travel, auto dependence, and auto ownership. It also distinguishes between cross-sectional and longitudinal analytical approaches, addressing the frequent conflation of these methodologies in existing literature. The review further probes into the comparison between Australian with global trends, shedding light on the unique aspects and challenges of shared mobility within the Australian context. Finally, the review proposes strategic recommendations for the integration of shared mobility services into the existing public transport infrastructures, aiming to enhance the overall efficiency of urban mobility systems.
2. Trip characteristics of shared mobility users
Beyond socio-demographic factors, research suggests that people's selection of shared mobility is greatly influenced by trip characteristics, such as trip purpose and travel distance. This section presents a synthesis and comparison of previous studies that have examined the trip purposes, time of day of trips, and travel distance of car-sharing and bike-sharing users. To facilitate this analysis, and depict the breakdown of trip purposes for car-sharing and bike-sharing users, respectively. While the figures offer a visual representation of the data, the subsequent textual analysis extends beyond these visual depictions, elaborating on findings that are either not amenable to graphical representation or are not predominantly quantified in the extant literature.
Figure 1. The trip purpose of using car-sharing.
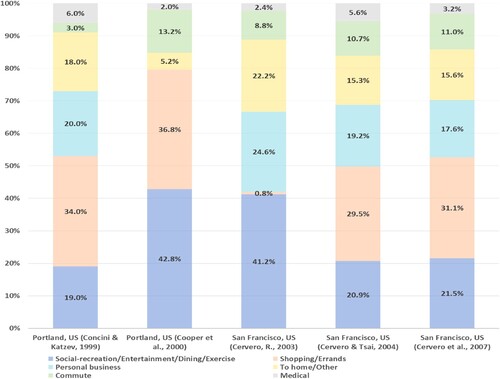
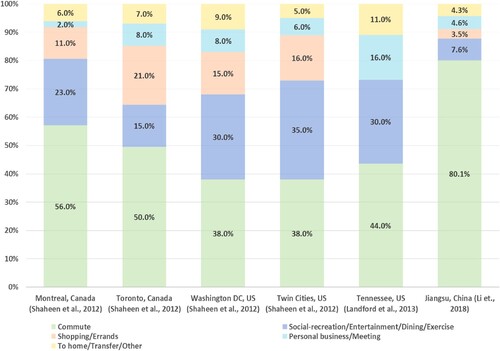
Figure 2. The trip purpose of using bike-sharing.
Car-sharing was initially seen as a way to encourage people to use alternative modes of transport, particularly for non-essential trips that would otherwise be made in private vehicles (Cooper, Howe, and Mye Citation2000). Most studies suggest that car-sharing is a popular mode of transport for non-commuting purposes, such as social and recreational activities, as well as shopping and personal errands. A series of surveys were carried out to examine the car-sharing users’ trip purposes in San Francisco (Cervero Citation2003; Cervero and Tsai Citation2004; Cervero, Golub, and Nee Citation2007), revealing that non-commuting makes up the majority of trip purposes. For example, car-sharing was found more popular for social-recreation (41.2%) and personal business (24.6%) trips during non-peak hours than for non-discretionary, routine trips such as to school (5.6%) or work (3.2%) during morning peak hours (Cervero Citation2003). Cervero and Tsai (Citation2004) and Cervero, Golub, and Nee (Citation2007) observed that shopping was the most common purpose of car-sharing, followed by social or recreational activities, and personal business, while journeys to commute constituted less than 11% of car-sharing trips. Similarly, additional studies in five US cities demonstrate that car-sharing is predominantly utilised for shopping, services, and miscellaneous purposes, as opposed to commuting (Clewlow and Laberteaux Citation2016; Jiao, Bischak, and Hyden Citation2020).
Shaheen et al. (Citation2017) further examined car-sharing use by service types. Round-trip car-sharing better serves non-work trips such as grocery shopping, which may require carrying goods. In contrast, one-way car-sharing is more appropriate for commuting or access or egress purposes. Regarding the travel distance and the time of travel, Ogata et al. (Citation2018) discovered that car-sharing is popular for distances of approximately 5 km, while Cervero (Citation2003) reported that most car-sharing trips occur during non-peak hours. Cervero and Tsai (Citation2004) found that the longest travel distances booking order for car-sharing was for commuting purposes, followed by social-recreational, shopping, and personal business. The literature is consistent in the view that car-sharing is primarily used for short-distance, non-commuting trips during off-peak hours.
In Australia, while there is a lack of extensive peer-reviewed research specifically on car-sharing trip purposes, various reports have shed some light on the matter, providing valuable insights into how these services are used. As reported by RAC (Citation2015), in Perth, car-sharing is often used for short, infrequent trips like grocery shopping or special occasions (38% each), running errands, or visiting friends or family (33% each), and leisure activities (32%). In Adelaide, car-sharing is more for non-work than work-related trips (Allan and Soltani Citation2019). A study by Dowling and Maalsen (Citation2020) in Sydney, indicated that car-sharing commonly accommodates the carrying of children, groceries, and other items, roles that were previously fulfilled by private vehicles for familial mobility. These usage patterns, focusing on short-term, casual access rather than daily commuting, are consistent with car-sharing services internationally.
Bike-sharing usages show distinct patterns by trip purpose from car-sharing. It appears that most users take a shared bike for commuting purposes or access and egress to transit. Shaheen et al. (Citation2012) found from four North American cities that commuting trips comprised 38%−56% of trips, followed by social/entertainment, and shopping/errands purposes, accounting for about half of the commuting trips. Zhang et al. (Citation2018) confirmed that in Zhongshan, China, was adopted primarily for commuting purposes, followed by after-work shopping activities. In Washington DC, US, Brisbane, Australia and Lyon, France, studies have revealed that long-term users tend to ride for commuting purposes, whereas short-term users use the service mostly for occasional trips (Buck et al. Citation2013; Fishman Citation2016; Tran, Ovtracht, and d’Arcier Citation2015). The literature suggests that bike-sharing could provide more affordable and flexible mobility options to substitute local bus services (Shaheen et al. Citation2017) or to access long-haul transit like commuter rail (Martin and Shaheen Citation2014). It is effective for access and egress trips, thereby expanding transit catchment areas (Shaheen et al. Citation2012; Martin and Shaheen Citation2014; Shaheen et al. Citation2017). Tingting, Li, and Wei (Citation2011) echoed that access from or to public transport facilities was the predominant usage of bike sharing (43%), followed by direct travel between locations and leisure purposes, which accounted for 37% and 27%, respectively.
Given the inherent characteristics of bikes, bike-sharing is primarily used for trips of short distance and duration, often proving more convenient than alternatives like walking, driving, or public transport (Eren and Uz Citation2020). Research indicates that the average distance covered in bike-sharing systems frequently falls under 4 km. For instance, trips average 1.88 km in Brisbane, Australia, and 1.91 km in Washington DC, US (Ahillen, Mateo-Babiano, and Corcoran Citation2016). In the cities of Seoul and Daejeon in Korea, the distances are 1.96 km for origin-to-station and 2.13 km for station-to-work trips (Lee, Choi, and Leem Citation2016). Other examples include an average of 2.1 miles (3.4 km) in Sacramento, US (Fitch, Mohiuddin, and Handy Citation2021), distances up to 4 km in Jiangsu, China (Li et al. Citation2018), and ranges from 1.8 km to 4.05 km in Mumbai, India (Rastogi, Rao, and V Citation2003). Additionally, trips are typically kept under 30 min to avoid incurring extra charges in Washington DC, Brisbane, Montreal and Paris (Ahillen, Mateo-Babiano, and Corcoran Citation2016; Fuller et al. Citation2011; Nair et al. Citation2013).
Australian studies on bike-sharing reveal diverse usage patterns. In Adelaide, Soltani et al. (Citation2022) highlighted various purposes for bike-sharing: socialising (62%), shopping (25%), returning home (23%), commuting to work (20%), sightseeing (12%), accessing transit (8%) and educational sites (5%). In Brisbane, leisure or sightseeing is prevalent among CityCycle users accounting for 65% (Fishman Citation2016). A Western Australia survey showed 93.5% using shared mobility for social and leisure activities, with work-related use at 77.4% coming in second (Jie et al. Citation2021). Similarly, Mateo-Babiano et al. (Citation2016) noted a trend towards recreational use in Brisbane, especially on weekends. While these studies confirm that social activities and commuting are primary reasons for bike-sharing, consistent with global trends, the proportion of non-work-related bike-sharing trips in Australia appears higher compared to work-related trips, differing from international patterns.
3. A cross-sectional comparison of travel behaviour among shared mobility users and non-users
This section examines research comparing travel behaviour between shared mobility users and non-users to identify differences in their travel patterns. The synthesised research is detailed in and , focusing on car-sharing and bike-sharing users respectively. Notably, while there is a substantial body of literature on the travel behaviours of bike-sharing users, cross-sectional comparative studies between users and non-users are relatively rare, particularly in the Australian context. The review is carried out by focusing on four aspects of travel behaviour including public transport use, active travel, auto dependence, and auto ownership. Auto dependence is further divided into auto mode share and vehicle miles travelled (VMT), presented in ratios of shared-mobility users over non-users. Given the varied indicators employed by the literature to compare auto ownership, the details are conveyed in the text of Section 3.4 instead of being tabulated.
Table 1. Comparison of travel behaviour between car-sharing users and non-users.
Table 2. Comparison of travel behaviour between bike-sharing users and non-users.
In the tables, cells shaded in green indicate favourable impacts such as increased public transport use, more active travel, and reduced automobile reliance. Conversely, cells shaded in red denote unfavourable effects. The shading intensity reflects the effect strength, with lighter colours for weaker and darker for stronger effects. Additionally, cells shaded in yellow represent statistically insignificant effects. Where specific statistics are lacking, a ‘+’ or ‘-’ symbol is used to show whether users’ values exceed or are lower than non-users, with the lightest colour indicating variations without specific statistical cut-offs.
3.1. Public transport use
Research has consistently demonstrated that individuals who use car-sharing have a greater propensity to use public transport than those who do not. For instance, in the San Francisco Bay Area, Mishra et al. (Citation2015) conducted a comparative analysis of car-sharing users and non-users with comparable socio-demographic backgrounds and discovered that the former group exhibited a higher proportion of trips taken via transit modes. Studies conducted in Portland and San Francisco, US, found that car-sharing users exhibited a greater tendency to use public transport than non-users, with the former group using transit modes 3.7 times more frequently (Cooper, Howe, and Mye Citation2000). Clewlow (Citation2016) likewise reported similar findings, with car-sharing users using transit modes 1.4 times more often than non-users. A recent study by Göddeke, Krauss, and Gnann (Citation2022) surveyed car-sharing users in two cities in Germany and found that their propensity to use public transport was 1.6 times higher than non-users. However, a study by Sioui, Morency, and Trépanier (Citation2013) in Montreal reported that the transit mode share of car-sharing users was marginally lower (0.8 times) than the citywide average for both one- and two-adult households without a vehicle. One possible explanation for this trend is that, as reliance on car-sharing grows, it gradually replaces the use of public transport, resulting in a decline in public transport mode share.
Research examining the difference in public transport use between bike-sharing users and non-users is somewhat scarce. These studies generally reveal that individuals who utilise bike-sharing services also tend to engage more frequently with public transport. In Melbourne, Australia, Fishman et al. (Citation2015) observed that 35% of bike-sharing users primarily used public transport, a figure significantly higher than the city average of 15%. This indicates that the usage of public transport among bike-sharing users is 2.33 times higher than the city average. A similar observation was made in Brisbane, where the rate of public transport use among bike-sharing users was recorded at 32%, surpassing the city average of 15%. This suggests that bike-sharing users in Brisbane are approximately 2.13 times more inclined to utilise public transport compared to the general city population. Collectively, these findings underscore a significant correlation between the utilisation of bike-sharing services and a greater propensity for public transport use within the Australian context.
3.2. Active transport use
A prevailing trend identified in the literature suggests that shared mobility users tend to favour active transport, notably walking and cycling, more frequently than non-users do. Mishra et al. (Citation2015) reported a positive correlation between car-sharing and the share of non-motorised modes in the San Francisco Bay Area, estimating that car-sharing members are more inclined to walk and cycle than non-members by 0.17-0.53 standard deviations. Recent studies from both the Bay Area and two German cities found that car-sharing users had a higher mode share for walking and cycling, with cycling being slightly more prevalent than walking. Specifically, the mode shares of walking and cycling among car-sharing users were found to be 1.3–1.5 times and 1.6–2 times higher than non-users, respectively (Clewlow Citation2016; Göddeke, Krauss, and Gnann Citation2022). However, Sioui, Morency, and Trépanier (Citation2013) reported slightly different findings in Montreal, with the non-motorised mode share being slightly lower (30.2% vs. 36.3%) than the citywide average for 1-adult households without a vehicle, and slightly higher for 2-adult households without a vehicle (37.15% vs. 33.9%). The study, however, does not elucidate the reasons behind this differential.
Bike-sharing has demonstrably influenced travel behaviours, with users often switching from other active transport modes to bike-sharing, while non-users exhibit a contrasting trend. In a study conducted in Montreal, Fuller et al. (Citation2013) found that 18.4% of bike-sharing users in 2009 and 21.41% in 2011 made such a transition. In contrast, a higher percentage of non-users, 7.63% in both years, reported an increased engagement in walking and cycling. Complementing these findings, Shaheen et al. (Citation2011) noted that individuals who are not members of bike-sharing schemes tend to cycle less frequently compared to those who are members. In the Australian context, Fishman et al. (Citation2015) noted that approximately 20% of bike-sharing users primarily relied on private bikes for commuting, whereas in both Greater Melbourne and Greater Brisbane, private bike usage constituted less than 2% of the main transport mode. This indicates that the usage of active transport among bike-sharing users is nearly 10 times higher than the city-wide average.
3.3. Auto dependence
Research consistently indicates that car-sharing users show reduced auto dependence in terms of both private vehicle usage and VMT when compared to non-members. A series of investigations by Cervero in the San Francisco Bay area (Cervero Citation2003; Cervero and Tsai Citation2004; Cervero, Golub, and Nee Citation2007) showed that car-sharing members had a faster decline in average daily VMT compared to non-members over four years. During the first two years, the average daily VMT slightly decreased for members but increased for non-members. However, by the fourth year, members’ VMT had decreased noticeably, while VMT for non-members had decreased but was still higher than in the first year. Moreover, other studies found that car-sharing users tend to have a lower vehicular mode share compared to non-users, with ratios varying from 0.04 times in Portland to 0.7 times in the Bay Area relative to non-users mode shares. In addition, car-sharing users have lower VMT than non-users, varying between 0.2 times in Portland to 0.8 times in the Bay area. In a related observation, car-sharing users in Montreal had a lower vehicle trip generation rate compared to the citywide average though specific data was not delineated in the study by Sioui, Morency, and Trépanier (Citation2013).
The patterns observed for bike-sharing exhibit variances. For instance, in Montreal, Fuller et al. (Citation2013) revealed that 7.92% and 10.13% of bike-sharing users transitioned from private vehicle trips to bike-sharing in 2009 and 2010, respectively. In contrast, a minimal proportion of non-users, amounting to 0.81% in 2009 and 0.62% in 2010, indicated a reduction in their private vehicle use. Delving into the Australian context, Fishman et al. (Citation2015) identified that in Melbourne, bike-sharing users had a substantially lower mode share of private vehicles for their most recent commute, at 0.19 times that of non-users (15% vs. 80%). A parallel trend was observed in Brisbane, where the rate was 0.25 times less (20% vs. 80%). Conversely, research by Fitch, Mohiuddin, and Handy (Citation2021) spanning four US regions reported mixed outcomes. In Davis and West Sacramento, the VMT for bike-sharing users surpassed that of non-users by 1.2 times. Meanwhile, it was 0.75 times less in Natoma and remained relatively consistent in downtown Sacramento. The authors postulate that the quality of public transport, coupled with the presence of micro mobility services, might be instrumental in driving these disparities.
3.4. Auto ownership
Research constantly underscores that car-sharing users typically possess fewer vehicles than those not using the service, though the indicator of this effect varies. Klincevicius, Morency, and Trépanier (Citation2014) discovered a negative correlation between car-sharing availability and auto ownership rates in Montreal. Extensive studies in the San Francisco Bay Area indicate that car-sharing members are less likely to increase household auto ownership and more inclined to relinquish ownership. Specifically, rates of reducing ownership and avoiding car purchases of users are 3.6 and 1.7 times higher respectively than non-users (Cervero Citation2003; Cervero and Tsai Citation2004; Cervero, Golub, and Nee Citation2007). Studies also found that users had significantly lower auto ownership rates than non-users with similar socio-demographic features (Mishra et al. Citation2015). For example, in the Bay Area, urban car-sharing users tend to possess fewer household vehicles (0.58 vs. 0.96 vehicles per household) than non-users. Yet, there is no significant reduction observed in suburban contexts (Clewlow Citation2016). In Montreal, the rates vary, with 0.13 vehicles per household for users and 0.89 for non-users (Sioui, Morency, and Trépanier Citation2013). Some studies have shown that car-sharing groups feature a higher proportion of carless households. For example, in Portland, 57.3% of users were carless compared to citywide 13% (Cooper, Howe, and Mye Citation2000). In five US cities, urban areas had 57% car-less versus 37% of non-users; whereas in suburban areas, the figures stood at 33% for users and 19% for non-users (Clewlow and Laberteaux Citation2016). The literature often underscores the role of multiple influencing factors, such as urban planning, transit options, parking infrastructure, socio-demographics, and personal preferences, that drive these differences in car ownership (Clewlow Citation2016; Mishra et al. Citation2015).
On the subject of bike-sharing, the data is somewhat less abundant. An interesting finding by Shaheen et al. (Citation2011) in Hangzhou, China, revealed that bike-sharing members typically had higher vehicle ownership relative to non-members. This hints that the appeal of bike-sharing goes beyond the traditional assumptions and might be attractive even to those who already own vehicles. The study suggests that high auto ownership does not necessarily diminish the likelihood of using bike-sharing services.
4. Longitudinal trends in travel behaviour of shared mobility users
Longitudinal studies conducted in the context of shared mobility aim to capture the potential evolution of travel behaviour among users over time. These studies assume that users of these services could gradually adapt their travel patterns, which can be observed by tracking changes in their behaviour through a series of observations over time. and demonstrate the changes in public transport use, active travel, automobile dependence and automobile ownership from longitudinal perspectives.
Table 3. Travel behaviour changes of car-sharing users.
Table 4. Travel behaviour changes of bike-sharing users.
There are two kinds of longitudinal studies in the literature. The first stream examines behavioural changes over a longer time period of shared mobility users, and studies typically compare observed travel behaviours from different years rather than tracking the behavioural changes of the exact same group of people. Here we use the term value change in the measurement column of the table. The other stream examines the mode use of current shared mobility users before and after joining shared mobility by collecting self-reported perceived mode shifts by respondents. In the context of car-sharing, the ‘Rate’ column represents mode share changes over time, and in the pre- and post-comparison scenarios, it indicates the percentage of users who changed their mode choice after joining car-sharing. The ‘Ratio’ column shows the data of a later year relative to a prior year. For bike-sharing, the values presented in the table correspond to the ‘Rate’ in the car-sharing table. Green shading implies the encouraging trends in sustainable transport, whereas red implies the opposite. Lighter colours correspond to weaker effects, darker shades to more robust effects, and yellow depicts neutral. In instances where specific statistics are lacking, a ‘+’ symbol indicates an increase, while ‘-’ denotes a decrease in value. The lightest shade is used to show variations in values where precise statistics are not available.
4.1. Changes in public transport use
The effects of car-sharing on public transport usage are diverse across empirical investigations. As shown in , the shifts in public transport mode usage fluctuate between a decline of 3.1% in North America (Martin and Shaheen Citation2011b) to an increase of 14.1% in Portland (De Concini and Katzev Citation1999). A longitudinal study conducted in Portland, US, investigated the impact of car-sharing on transport behaviour over a period of two years. Results showed that 13.5% of participants increased their reliance on public transport, while 7.9% decreased, resulting in a net increase of 5.6% (Cooper, Howe, and Mye Citation2000). On the other hand, a study has shown contradictory result. Martin and Shaheen (Citation2011b) reported a net 3.1% decline in public transport use among North American car-sharing users, with 19.5% increasing their transit usage and 22.6% decreasing it. The effect was largely due to that most people who started using car-sharing didn't own a car, so they used car-sharing instead of other means like public transport, which led to a decrease in public transport use as they explored new options.
Bike-sharing has been evaluated as having the potential to both compete with and complement public transport. The spectrum of influence spans from a fall of 41% in Washington DC (Shaheen et al. Citation2012&2013) to a rise of 11.8% in Minneapolis (Martin and Shaheen Citation2014). In Hangzhou, China, around 80% of respondents switched from public transport to bike-sharing (Shaheen et al. Citation2011). After bike-sharing was introduced in Montreal, Toronto, and Washington DC, a tangible decline, ranging from 19% to 41%, was perceived in rail and bus ridership (Shaheen et al. Citation2012&2013). Similarly, Martin and Shaheen (Citation2014) reported two contrasting findings. In Minneapolis, a greater fraction increased their transit ridership (29.2%) than those who decreased (19.6%), while in Washington DC, 86.5% reduced their public transport usage, with only 11.9% reporting an increase. It is worth noting a consistent trend: while rail usage fluctuates, bus usage typically declines. This trend suggests that, in urban areas, bike-sharing may replace shorter-distance bus trips, but in suburban, it could complement rail by serving as an FMLM (first mile and last mile) connection (Martin and Shaheen Citation2014).
4.2. Changes in active transport use
According to the majority of relevant literature, individuals who use car-sharing are more likely to adopt walking and cycling (Mishra et al. Citation2015). Compared to the mode shifts towards public transport, the increase in walking and cycling trips after individuals enrolled in a car-sharing service was more pronounced, as noted by Martin and Shaheen (Citation2011a). Overall, the increase in walking ranged between 3% in North America (Martin and Shaheen Citation2011b) and 23.6% in Portland (Cooper, Howe, and Mye Citation2000). In terms of cycling, increases varied from 3.4% in Portland (Cooper, Howe, and Mye Citation2000) to 6.3% in North America (Martin and Shaheen Citation2011b). It is evident that car-sharing users typically exhibit between 1.1 and 1.24 times more active transport usage than non-users (De Concini and Katzev Citation1999; Cooper, Howe, and Mye Citation2000).
Most literature indicates an increase in active transport use upon adopting bike-sharing, with cycling trips seeing an uptick and walking trips a slight reduction. However, the rise in cycling outweighs the decline in walking. In studies from four North American cities, Shaheen et al. (Citation2012 & Citation2013) found that 23% of bike-sharing members increased walking, while 31% walked less. Yet, there was a consistent rise in cycling, ranging from 48% to 81%. Martin and Shaheen (Citation2014) in Washington DC and Minneapolis showed similar trends, with significant cycling increases and opposite changes in walking after joining bike-sharing. Heinen, Kamruzzaman, and Turrell (Citation2018) in Brisbane, Australia, after the bike-sharing scheme launch in 2010, noted minimal changes in cycling time between 2009 and 2013. Most respondents (81.5%) reported little change, with a small fraction reporting significant increases (8.8%) or decreases (9.7%) in cycling durations. The older age cohort of the sample could account for this trend.
4.3. Changes in auto dependence
The literature indicates a reduction in auto dependence among car-sharing users. Cervero initiated a series of studies assessing the short-, intermediate- and long-term effects of a car-sharing program in San Francisco from 2001 to 2005 (Cervero Citation2003; Cervero and Tsai Citation2004; Cervero, Golub, and Nee Citation2007). Overall, car-sharing members’ mean daily VMT decreased by only 2.2% (4.5–4.4 miles) during the first two years. However, this reduction further increased to 31% (4.4–3.0 miles) over the intermediate term. Martin and Shaheen (Citation2011b) proposed that car-sharing members tend to decrease their overall vehicle use, including commuting. De Concini and Katzev (Citation1999) and Cooper, Howe, and Mye (Citation2000) classified car-sharing users based on vehicle ownership. They found that non-vehicle-owning users increased their VMT after the car-sharing program's launch while vehicle-owning users decreased. This aligns with Cervero's (Citation2003) observation that car-sharing members had a higher VMT than non-members during the first nine months after enrolment. The author attributed this temporary increase in VMT to the fact that more than two-thirds of the car-sharing members were from carless households and used car-sharing as a substitute for trips previously made by cycling or walking.
Studies have shown that bike-sharing tends to diminish the use of vehicles, including driving and taxis (Martin and Shaheen Citation2014). Shaheen et al. (Citation2011) found that in Hangzhou, 50% of survey respondents switched from vehicle use and 40% from taxi use. Moreover, in London and Washington DC, the rate of vehicle substitution by bike-sharing in London and Washington DC was minimal at 2% and 7% respectively (Transport for London, 2010; LDA Consulting, 2012). However, in Brisbane and Melbourne, the substitution rates were more significant at 21% and 19% respectively (Fishman, Washington, and Haworth Citation2014). Furthermore, bike-sharing has had a significant impact on reducing private vehicle travel distances, leading to a decrease in vehicle travel by an estimated 90,000 km annually in Melbourne and Minneapolis/St. Paul, and 243,291 km in Washington DC. However, London witnessed an uptick of 766,341 km in vehicle use. This can be attributed mainly to a minor shift from car usage combined with extensive truck usage for bike-sharing system rebalancing.
4.4. Changes in auto ownership
Shared mobility has the potential to reduce car ownership. Several studies have indicated a decrease in car ownership after the introduction of car-sharing programs, ranging from 3.6% in a European city (Fromm et al. Citation2019) to 29.1% in San Francisco (Cervero and Tsai Citation2004). A study from North America demonstrated that even though 60% of households joining car-sharing were carless, they reduced their vehicle ownership from an average of 0.47–0.24 per household (Martin, Shaheen, and Lidicker Citation2010). Martin and Shaheen (Citation2011a) observed a decline from 0.55–0.29 vehicles per household. Furthermore, a significant percentage of participants altered their future car purchasing intentions due to car-sharing, with a range of 14.3% (Fromm et al. Citation2019) to 67.5% (Cervero and Tsai Citation2004). A Munich survey highlighted that 12% of respondents forwent a vehicle, 40% refrained from a new purchase, and 27% contemplated relinquishing a car in the future (Miramontes et al. Citation2017). Shared vehicles have been seen to replace multiple personal cars in several North American cities (Jochem et al. Citation2020; Lane Citation2005; Martin, Shaheen, and Lidicker Citation2010). Conversely, some research indicated minimal influence. For instance, Klincevicius, Morency, and Trépanier (Citation2014) identified negligible changes in the mean car ownership in Montreal over a decade (from 0.865 in 1998–0.886 in 2008). Another qualitative study in four Australian cities by Zhou et al. (Citation2020) found no significant car-sharing impact on auto ownership. This research, differing from others, analysed data from the general public rather than car-sharing users, suggesting potential selection of sample selection bias or self-selection bias. Car-sharing users are often more environmentally conscious and less car-dependent than the general population.
Regarding the longitudinal effects of bike-sharing on auto ownership, the literature is relatively limited. Shaheen et al. (Citation2012), in a multi-city study including Montreal, Toronto, Twin Cities, and Washington DC, provided noteworthy insights. They found a shift amongst bike-sharing users: approximately 5% had deposed a personal vehicle, and 7% were considering selling a vehicle. This suggests that the proliferation of bike-sharing schemes may nudge some users towards a less car-centric lifestyle. Further studies in this domain would be invaluable in the future.
5. Discussions
5.1. Substitution or complementation
Although shared mobility has been proven to be an effective alternative to traditional transport modes, research findings about how shared mobility interacts with other forms of transport are inconsistent in the literature. Cross-sectional and longitudinal analyses reveal that while shared mobility users generally decrease reliance on private vehicles and increase cycling, the impacts on walking vary with car-sharing and bike-sharing. The implications for public transport usage remain uncertain. This variance can be attributed to factors such as trip purpose, trip distance, vehicle ownership, transport infrastructural developments, and built environment.
It appears that car-sharing typically allows users to reduce their auto dependency, both in terms of auto ownership and VMT, which implies that car-sharing works as a substitution for private vehicles. Car-sharing is more popular for non-commuting trips than commuting trips, as public transport may prove cumbersome for carrying goods during shopping and errand trips. Designated parking space is another benefit for those trips at multifunctional shopping centres. Given leisure trip destinations could be spatially dispersed and distanced where transit access is difficult, shared car mimics the flexibility and convenience of private vehicles, thus substituting private vehicles for non-commuting trips. On the other hand, one-way car-sharing and round-trip car-sharing are used in different scenarios. Most studies have proved that one-way car-sharing often substitutes public transport, especially for commuting purposes, as it provides a flexible alternative for shorter trips and fills service gaps in areas with limited public transport services (Firnkorn Citation2012; Le Vine et al. Citation2014; Ogata et al. Citation2018; Shaheen et al. Citation2017). Some studies pointed out that commuters took one-way car-sharing as FMLM to transit stations for access or egress purposes (Shaheen and Chan Citation2016; Shaheen et al. Citation2017), while the empirical evidence is relatively less (Ogata et al. Citation2018). Round-trip car-sharing has the potential to complement public transport since the members exhibit higher usage in public transport (Becker, Ciari, and Axhausen Citation2017; Le Vine et al. Citation2014), one possible interpretation is that car-sharing members are particularly frequent users of public transit, and they consider car-sharing as complementary to public transport (Becker, Ciari, and Axhausen Citation2017). Furthermore, as reported by Cervero (Citation2003), Cooper, Howe, and Mye (Citation2000), De Concini and Katzev (Citation1999), Martin and Shaheen (Citation2011b) and Sioui, Morency, and Trépanier (Citation2013), car ownership can be another determinant, as car-less members tend to reduce transit use and increase auto dependence, especially during the initial phases of service adoption.
Bike-sharing has been shown to reduce auto dependence, particularly for non-commuting trips that were previously made by car, and it often replaces transit and walking commutes (Fishman, Washington, and Haworth Citation2014; Fishman Citation2016). Bike-sharing was initially established as a means to facilitate better FMLM connections to mainline public transport systems. However, such effects on transit use are multifaceted, indicating that bike-sharing acted as a competitor and complement to public transport due to context and trip-related variations (Shaheen et al. Citation2011; Zhang et al. Citation2018). Cross-sectional and longitudinal perspectives mostly revealed that bike-sharing substituted transit use rather than increased or connected it, especially for shorter-distance bus rides. Shaheen and Chan (Citation2016) found that the level of transport connectivity and land use patterns where bike-sharing is located may explain the different effects. For example, Shaheen et al. (Citation2012) advised that bike-sharing in larger cities takes riders off crowded buses, while bike-sharing in smaller cities improves access or egress from bus lines. Martin and Shaheen (Citation2014) suggested that bike-sharing could lead to a decline in public transport use in dense urban areas, but increase public transport use in suburban areas because trips in high-density urban areas are relatively shorter and thus more easily replaced by bicycles. Subsequent research by Nikitas, Wallgren, and Rexfelt (Citation2015) and Jiménez et al. (Citation2016) confirmed the role of bike-sharing is mainly restricted to inner city areas and serves as an alternative to private vehicles or a complement to public transport. By incorporating trip characteristics, the literature supported the notion that bike-sharing usually caters to shorter commuting trips previously made by buses (Shaheen et al. Citation2012; Zhang et al. Citation2015). Consequently, in densely populated areas, bike-sharing competes with public transit, while in less dense areas, it supplements the FMLM connectivity.
5.2. Comparison of cross-sectional studies and longitudinal studies
The findings from cross-sectional and longitudinal studies reported that shared mobility users exert sustainable travel behaviours, including lower private auto dependence and higher walking and cycling usage. Notably, the effects observed in longitudinal studies are generally weaker compared to those in cross-sectional studies. Cross-sectional research compares multiple indicators of travel behaviour between shared mobility users and non-users at a given point in time, but it is insufficient to pin down a definitive cause–effect relationship between shared mobility and travel behaviour. In contrast, longitudinal studies can detect the evolution of shared mobility users’ travel behaviour over extended periods, or before and after joining shared mobility. There are two prominent approaches within longitudinal research: one examines travel indicator values across different years, and the other assesses self-reported shifts in transport mode choice after adopting shared mobility.
Comparatively, the variances observed in cross-sectional studies appear more pronounced than those in longitudinal research, which may be inferred that shared mobility users seem to change their travel behaviour very slowly. The data from self-reported mode shifts in longitudinal studies appear to echo this claim, with many showing little change in mode share after individuals join shared mobility (De Concini and Katzev Citation1999; Heinen, Kamruzzaman, and Turrell Citation2018; Shaheen, Martin, and Cohen Citation2013). The consistency of these patterns suggests that travel behaviour is highly habitual (Van Wee and Witlox Citation2021), emphasising that individuals do not always change their travel mode choice. Jain, Johnson, and Rose (Citation2020) also highlight that the availability of car-sharing primarily acts as a facilitator for changes in travel behaviour rather than as a direct cause. Such travel behavioural changes were often initiated by significant life events, such as residential relocation. This underscores that shared mobility, in isolation, might not be a panacea for influencing travel patterns.
Research has shown that shared mobility users are often characterised by specific socio-demographic and travel behavioural features. As reported in the previous sections, the literature consistently indicates that differences in shared mobility effects may be attributed to individuals’ auto ownership (Cervero Citation2003; Cooper, Howe, and Mye Citation2000; De Concini and Katzev Citation1999; Martin and Shaheen Citation2011b). Auto ownership also implies attitudes towards vehicles, influencing shared mobility's impact. Shared mobility users are found to be younger, better educated, have higher incomes, are environmentally aware, more innovative, socially active and demonstrate favourable attitudes towards sustainable travel patterns (Becker, Ciari, and Axhausen Citation2017; Costain, Ardron, and Habib Citation2012; Fishman et al. Citation2015; Rodier and Shaheen Citation2003; Steer Davies Gleave Citation2016). In this case, it remains uncertain whether shared mobility triggered this trend of travel patterns or arose from users’ innate preferences. This has provoked discussions of endogeneity or self-selection bias, which refers to the difficulty in distinguishing the effects resulting from shared mobility participation and the fact that the travel patterns of shared mobility users would be differentiated even without the presence of shared mobility. Such bias could potentially overstate the perceived impacts of shared mobility (Le Vine and Polak Citation2015; Zhou et al. Citation2020). Although this bias is widely discussed in the realm of residential self-selection (Cao, Mokhtarian, and Handy Citation2009), it has received little attention in the context of shared mobility and thus warrants further investigation in the future.
5.3. Australian context
The analysis of both cross-sectional and longitudinal studies indicates that the differences in the impact of shared mobility between countries appear to be minimal. Instead, disparities in study outcomes are more likely attributed to micro-level factors such as the regional built environment (urban vs. suburban), public transport infrastructure, and socio-demographic characteristics of users, rather than macro-level influences. A considerable amount of research on shared mobility in Australia is predominantly based on non-peer-reviewed literature, primarily consulting and operator reports, and qualitative research articles. Furthermore, the volume of qualitative cross-sectional and longitudinal studies specifically focusing on the Australian context is notably limited. This scarcity poses challenges in generating robust, data-driven insights. Nevertheless, the existing sources, despite their limitations, still contribute valuable perspectives and understandings that are uniquely relevant to the Australian context.
As highlighted in previous sections, in Australia, the travel patterns of car-sharing users mainly involve non-work trips, a trend consistent with global observations. However, several qualitative studies report that car-sharing has a limited effect on reducing vehicle ownership in Australia (Jain, Johnson, and Rose Citation2020; Zhou et al. Citation2020), differing from findings in other international contexts. This discrepancy is often attributed to Australia's car-loving culture and long-standing dependence on private cars, which pose challenges to changing established travel preferences and habitual travel behaviours (Butler et al. Citation2022). Although car-sharing serves as an alternative to private vehicles for certain uses, individuals might still keep their cars for specific needs, such as convenience, privacy concerns and child car seats, not covered by car-sharing (Dowling and Maalsen Citation2020). Studies also highlight the need for educational campaigns and societal changes to alter the prevailing mindset on car ownership and encourage the adoption of car-sharing (Anable et al. Citation2004; Jain, Johnson, and Rose Citation2020; Zhou et al. Citation2020).
There are some disparities in travel patterns of bike-sharing in Australia compared to other regions. In Australia, bike-sharing is primarily used for non-work-related trips, contrasting with the global trend where commuting predominates. Additionally, the role of bike-sharing in facilitating FMLM connectivity, as observed in other places, remains unclear in the Australian context. Bike-sharing usage rates appear to be lower than in the global context, leading many bike-sharing companies to exit the market (Fishman Citation2016; Heymes Citation2019; Soltani et al. Citation2019). Literature suggests several barriers contribute to this trend. First, cycling occupies a smaller share of the transport mode in Australia compared to European counterparts (Butterworth and Pojani Citation2018). Recent data shows a decline in cycling rates, with fewer Australians cycling now than in 2011 (Munro Citation2023). Second, cycling is predominantly for leisure and sports, rather than for commuting. Bike-sharing mainly substitutes trips that would otherwise be made by private cycling and plays a limited role in FMLM connectivity to transit services. Third, mandatory helmet laws have been identified as a significant deterrent to increased bike-sharing usage (Alta Bike Share Citation2011; Fishman, Washington, and Haworth Citation2013; Traffix Group Citation2012). Other challenges include a lack of dedicated cycling infrastructure (Fishman et al. Citation2015; Soltani et al. Citation2022), issues of vandalism and theft (Heymes Citation2019; Soltani et al. Citation2019), and complex sign-up process (Ahillen, Mateo-Babiano, and Corcoran Citation2016; Soltani et al. Citation2022).
The current trends in shared mobility within Australia underscore its potential not merely as a standalone intervention, but as a critical component of a broader, integrated multimodal transport system. Research increasingly shows that shared mobility enhances the flexibility and appeal of multimodal transport (Dowling and Maalsen Citation2020; Shaheen, Guzman, and Zhang Citation2010), demonstrating that shared mobility users tend to adopt more multimodal travel patterns (Clewlow and Laberteaux Citation2016; Giesel and Nobis Citation2016; Kopp, Gerike, and Axhausen Citation2015; Miramontes et al. Citation2017; Raux, Zoubir, and Geyik Citation2017). This trend is particularly potent when aligned with urban planning strategies such as transit-oriented development (TOD). Shared mobility, within the TOD framework, not only provides short, occasional trips but also strengthens connections to major transit hubs as an effective FMLM facilitator (APTA Citation2022; Liao and Correia Citation2022; Smith and Schwieterman Citation2018). This integration transforms TOD areas by connecting residential, commercial, and recreational spaces with transit hubs through strategic placement of bike-sharing stations or car-sharing fleets, thereby encouraging higher public transport ridership and promoting more cyclable and walkable communities. By seamlessly incorporating shared mobility into existing public transport systems, cities can enhance multimodal transport behaviours and urban accessibility. This strategy offers an efficient and flexible solution that could potentially decrease private car ownership and encourage a shift towards shared mobility, thus aiding in the development of more sustainable urban mobility.
6. Conclusion
In the realm of travel behaviour research, this study provides a narrative and quantitative review of the impacts of different types of shared mobility on travel behaviours, incorporating insights from both cross-sectional and longitudinal perspectives. The literature consistently reveals that shared mobility is linked to a shift towards active transport and contributes to the shedding of auto ownership and reduction of auto dependence. The modal shift in public transport is a complex pattern of substitution or complementarity, rather than a discrete shift from one mode to another. Car-sharing and bike-sharing have distinct capabilities in influencing travel behaviour. Car-sharing is typically utilised for non-commuting trips that were previously made by car, while bike-sharing seems to substitute shorter commuting trips previously taken by bus. Furthermore, car-sharing and bike-sharing bridge gaps in existing public transport and encourage multimodality for FMLM connections rather than driving. The long-term impact on travel behaviour appears to be minimal, suggesting that individuals’ modal shift over time is a gradual process, and travel preference bias may partially counteract the effects of shared mobility. In Australia, car-sharing is mainly used for non-work trips, mirroring global trends. Yet, its effect on reducing car ownership is limited, largely due to the entrenched car culture. Bike-sharing in Australia predominantly caters to non-work-related trips, contrasting with global trends where commuting is more common. Its lower usage rates are attributed to factors such as the limited role of cycling, leisure-focused cycling culture, mandatory helmet laws, inadequate infrastructure, and operational challenges. Given that shared mobility users tend to exhibit multimodal travel patterns, promoting sustainable transport should encourage the integration of shared mobility with other transport components to shape people's multimodal travel patterns.
This review aims to enhance the understanding of the extent to which shared mobility impacts travel behaviour. Some of the literature is dated, primarily due to a shortage of quantitative studies examining trip characteristics and longitudinal changes over time. Future research needs to focus on updated studies reflecting current trends and societal acceptance of shared mobility. Additionally, emphasis should be placed on trip characteristics, particularly trip purposes, when examining shared mobility effects on travel behaviour. While most studies have focused on the socio-demographic characteristics of shared mobility users, few have included non-users. It is crucial to have a comprehensive understanding of both users and non-users of these systems. Furthermore, the actual effect of bike-sharing in substituting motor vehicle trips and its role in solving the FMLM problem remains an area warranting exploration. Considering the environmental and long-term benefits of shared mobility, it is pivotal to undertake more empirical, longitudinal analyses, especially within the Australian context, to quantify shared mobility's effect on travel behaviour and determine strategies to promote this mode shift.
Disclosure statement
No potential conflict of interest was reported by the author(s).
References
- Ahillen, M., D. Mateo-Babiano, and J. Corcoran. 2016. “Dynamics of Bike Sharing in Washington, DC and Brisbane, Australia: Implications for Policy and Planning.” International Journal of Sustainable Transportation 10 (5): 441–454.
- Allan, A., and A. Soltani. 2019. Servicing the Needs of Major Inner-Urban Trip Generators. Sydney, Australia: CRC for Low Carbon Living.
- Alta Bike Share. 2011. Melbourne Bike Share Survey.
- American Public Transport Agency. 2022, February 01. “Shared Mobility is Changing Public Transportation”. https://tomorrow.city/a/shared-mobillity-is-changing-public-transportation/.
- Anable, J., A. Kirkbride, L. Sloman, C. Newson, S. Cairns, and P. Goodwin. 2004. “Smarter Choices? Changing the Way We Travel.” Case Study Reports.
- Bao, Z., W. Lu, Z. Peng, and S. T. Ng. 2023. “Balancing Economic Development and Construction Waste Management in Emerging Economies: A Longitudinal Case Study of Shenzhen, China Guided by the Environmental Kuznets Curve.” Journal of Cleaner Production 396: 136547.
- Becker, H., F. Ciari, and K. W. Axhausen. 2017. “Comparing car-Sharing Schemes in Switzerland: User Groups and Usage Patterns.” Transportation Research Part A: Policy and Practice 97: 17–29.
- Buck, D., R. Buehler, P. Happ, B. Rawls, P. Chung, and N. Borecki. 2013. “Are Bikeshare users Different from Regular Cyclists? A First Look at Short-Term Users, Annual Members, and Area Cyclists in the Washington, DC, Region.” Transportation Research Record: Journal of the Transportation Research Board 2387 (1): 112–119.
- Butler, L., T. Yigitcanlar, A. Paz, and W. Areed. 2022. “How Can Smart Mobility Bridge the First/Last Mile gap? Empirical Evidence on Public Attitudes from Australia.” Journal of Transport Geography 104: 103452.
- Butterworth, E., and D. Pojani. 2018. “Why Isn’t Australia a Cycling Mecca.” European Transport 69 (4): 1–22.
- Cao, X., P. L. Mokhtarian, and S. L. Handy. 2009. “Examining the Impacts of Residential Self-Selection on Travel Behaviour: A Focus on Empirical Findings.” Transport Reviews 29 (3): 359–395.
- Cervero, R. 1993. “Ridership Impacts of Transit-Focused Development in California”.
- Cervero, R. 2003. “City CarShare: First-Year Travel Demand Impacts.” Transportation Research Record: Journal of the Transportation Research Board 1839 (1): 159–166.
- Cervero, R., A. Golub, and B. Nee. 2007. “City CarShare: longer-term travel demand and car ownership impacts.” Transportation Research Record: Journal of the Transportation Research Board 1992 (1): 70–80.
- Cervero, R., and Y. Tsai. 2004. “City CarShare in San Francisco, California: Second-Year Travel Demand and car Ownership Impacts.” Transportation Research Record: Journal of the Transportation Research Board 1887 (1): 117–127.
- City of Paris. 2007. “Le Bilan des Deplacements en 2007 a Paris.” La Mairie de Paris, L’Observatorie de Deplacements, Paris, France. http://www.paris.fr/portail/deplacements/Portal.lut?page_id=7627&document_type_id=4&document_id=26324&portlet_id=17647&multileveldocument_sheet_id=11982/.
- City of Paris. 2008. “La lettre Vélib’”. May. 10. http://velib.centraldoc.com/newsletter/10_aujourd_hui_nous_vous_connaissons_mieux/.
- City of Paris. 2009. “La lettre Vélib’”. June. 22. http://velib.centraldoc.com/newsletter/22_bientot_2_ans_d_utilisation_votre_regard_sur_le_service/.
- Clewlow, R. R. 2016. “Carsharing and Sustainable Travel Behavior: Results from the San Francisco Bay Area.” Transport Policy 51: 158–164.
- Clewlow, R., and K. L. Laberteaux. 2016, January. “Shared-use Mobility in the United States: Current Adoption and Potential Impacts on Travel Behavior.” 95th Annual Meeting of the Transportation Research Board (TRB), Washington DC, United States.
- Cooper, G., D. A. Howe, and P. Mye. 2000. The Missing Link: An Evaluation of Car. Portland, Oregon: Sharing Portland Inc.
- Costain, C., C. Ardron, and K. N. Habib. 2012. “Synopsis of Users’ Behaviour of a Carsharing Program: A Case Study in Toronto.” Transportation Research Part A: Policy and Practice 46 (3): 421–434.
- De Concini, N., and R. Katzev. 1999. “CarSharing Portland: Review and Analysis of Its First Year”.
- Dowling, R., and S. Maalsen. 2020. “Familial Mobilities Beyond the Private car: Electric Bikes and car Sharing in Sydney, Australia.” Applied Mobilities 5 (1): 53–67.
- Eren, E., and V. E. Uz. 2020. “A Review on Bike-Sharing: The Factors Affecting Bike-Sharing Demand.” Sustainable Cities and Society 54: 101882.
- Firnkorn, J. 2012. “Triangulation of two Methods Measuring the Impacts of a Free-Floating Carsharing System in Germany.” Transportation Research Part A: Policy and Practice 46 (10): 1654–1672.
- Fishman, E. 2016. “Bikeshare: A Review of Recent Literature.” Transport Reviews 36 (1): 92–113.
- Fishman, E., S. Washington, and N. Haworth. 2013. “Bike Share: A Synthesis of the Literature.” Transport Reviews 33 (2): 148–165.
- Fishman, E., S. Washington, and N. Haworth. 2014. “Bike Share’s Impact on car use: Evidence from the United States, Great Britain, and Australia.” Transportation Research Part D: Transport and Environment 31: 13–20.
- Fishman, E., S. Washington, N. Haworth, and A. Watson. 2015. “Factors Influencing Bike Share Membership: An Analysis of Melbourne and Brisbane.” Transportation Research Part A: Policy and Practice 71: 17–30.
- Fitch, D. T., H. Mohiuddin, and S. L. Handy. 2021. “Examining the Effects of the Sacramento Dockless e-Bike Share on Bicycling and Driving.” Sustainability 13 (1): 368.
- Fromm, H., L. Ewald, D. Frankenhauser, A. Ensslen, and P. Jochem. 2019. A study on free-floating carsharing in Europe: Impacts of car2go and DriveNow on modal shift, vehicle ownership, vehicle kilometers traveled, and CO2 emissions in 11 European cities (No. 36). Working Paper Series in Production and Energy.
- Fuller, D., L. Gauvin, Y. Kestens, M. Daniel, M. Fournier, P. Morency, and L. Drouin. 2011. “Use of a new Public Bicycle Share Program in Montreal, Canada.” American Journal of Preventive Medicine 41 (1): 80–83.
- Fuller, D., L. Gauvin, Y. Kestens, P. Morency, and L. Drouin. 2013. “The Potential Modal Shift and Health Benefits of Implementing a Public Bicycle Share Program in Montreal, Canada.” International Journal of Behavioral Nutrition and Physical Activity 10 (1): 66–66.
- Giesel, F., and C. Nobis. 2016. “The Impact of Carsharing on car Ownership in German Cities.” Transportation Research Procedia 19: 215–224.
- Göddeke, D., K. Krauss, and T. Gnann. 2022. “What is the Role of Carsharing Toward a More Sustainable Transport Behavior? Analysis of Data from 80 Major German Cities.” International Journal of Sustainable Transportation 16 (9): 861–873.
- Heinen, E., M. Kamruzzaman, and G. Turrell. 2018. “The Public Bicycle-Sharing Scheme in Brisbane, Australia: Evaluating the Influence of its Introduction on Changes in Time Spent Cycling Amongst a Middle- and Older-age Population.” Journal of Transport & Health 10: 56–73.
- Heymes, C. 2019. “Stationless in Sydney: The Rise and Decline of Bikesharing in Australia.” Findings.
- Hu, J. W., and F. Creutzig. 2022. “A Systematic Review on Shared Mobility in China.” International Journal of Sustainable Transportation 16 (4): 374–389.
- Jain, T., M. Johnson, and G. Rose. 2020. “Exploring the Process of Travel Behaviour Change and Mobility Trajectories Associated with car Share Adoption.” Travel Behaviour and Society 18: 117–131.
- Jiao, J., C. Bischak, and S. Hyden. 2020. “The Impact of Shared Mobility on Trip Generation Behavior in the US: Findings from the 2017 National Household Travel Survey.” Travel Behaviour and Society 19: 1.
- Jie, F., C. Standing, S. Biermann, S. Standing, and T. Le. 2021. “Factors affecting the adoption of shared mobility systems: Evidence from Australia.” Research in Transportation Business and Management 41: 100651. https://doi.org/10.1016/j.rtbm.2021.100651.
- Jiménez, P., M. Nogal, B. Caulfield, and F. Pilla. 2016. “Perceptually Important Points of Mobility Patterns to Characterise Bike Sharing Systems: The Dublin Case.” Journal of Transport Geography 54: 228–239.
- Jochem, P., D. Frankenhauser, L. Ewald, A. Ensslen, and H. Fromm. 2020. “Does Free-Floating Carsharing Reduce Private Vehicle Ownership? The Case of Share Now in European Cities.” Transportation Research Part A: Policy and Practice 141: 373–395.
- Klincevicius, M. G., C. Morency, and M. Trépanier. 2014. “Assessing Impact of Carsharing on Household car Ownership in Montreal, Quebec, Canada.” Transportation Research Record: Journal of the Transportation Research Board 2416(1): 48–55.
- Kopp, J., R. Gerike, and K. W. Axhausen. 2015. “Do Sharing People Behave Differently? An Empirical Evaluation of the Distinctive Mobility Patterns of Free-Floating car-Sharing Members.” Transportation 42 (3): 449–469.
- Lane, C. 2005. “PhillyCarShare: First-Year Social and Mobility Impacts of Carsharing in Philadelphia, Pennsylvania.” In Transportation Research Record: Journal of the Transportation Research Board, No. 1927, Transportation Research Board of the National Academies, Washington, D.C., pp. 158–166.
- Lee, J., K. Choi, and Y. Leem. 2016. “Bicycle-based Transit-Oriented Development as an Alternative to Overcome the Criticisms of the Conventional Transit-Oriented Development.” International Journal of Sustainable Transportation 10 (10): 975–984.
- Le Vine, S., M. Lee-Gosselin, A. Sivakumar, and J. Polak. 2014. “A new Approach to Predict the Market and Impacts of Round-Trip and Point-to-Point Carsharing Systems: Case Study of London.” Transportation Research Part D: Transport and Environment 32: 218–229.
- Le Vine, S., and J. Polak. 2015. “Introduction to Special Issue: New Directions in Shared-Mobility Research.” Transportation 42: 407–411.
- Li, X., Y. Zhang, L. Sun, and Q. Liu. 2018. “Free-floating Bike Sharing in Jiangsu: Users’ Behaviors and Influencing Factors.” Energies 11 (7): 1664.
- Liao, F., and G. Correia. 2022. “Electric Carsharing and Micromobility: A Literature Review on Their Usage Pattern, Demand, and Potential Impacts.” International Journal of Sustainable Transportation 16 (3): 269–286.
- Martin, E. W., and S. A. Shaheen. 2011a. “Greenhouse gas Emission Impacts of Carsharing in North America.” IEEE Transactions on Intelligent Transportation Systems 12 (4): 1074–1086.
- Martin, E., and S. Shaheen. 2011b. “The Impact of Carsharing on Public Transit and non-Motorized Travel: An Exploration of North American Carsharing Survey Data.” Energies 4 (11): 2094–2114.
- Martin, E. W., and S. A. Shaheen. 2014. “Evaluating Public Transit Modal Shift Dynamics in Response to Bikesharing: A Tale of two U.S. Cities.” Journal of Transport Geography 41: 315–324.
- Martin, E., S. A. Shaheen, and J. Lidicker. 2010. “Impact of carsharing on household vehicle holdings: Results from North American shared-use vehicle survey.” Transportation Research Record: Journal of the Transportation Research Board 2143 (1): 150–158.
- Mateo-Babiano, I., R. Bean, J. Corcoran, and D. Pojani. 2016. “How Does our Natural and Built Environment Affect the use of Bicycle Sharing?” Transportation Research Part A: Policy and Practice 94: 295–307.
- Miramontes, M., M. Pfertner, H. S. Rayaprolu, M. Schreiner, and G. Wulfhorst. 2017. “Impacts of a Multimodal Mobility Service on Travel Behavior and Preferences: User Insights from Munich’s First Mobility Station.” Transportation 44 (6): 1325–1342.
- Mishra, G. S., R. R. Clewlow, P. L. Mokhtarian, and K. F. Widaman. 2015. “The Effect of Carsharing on Vehicle Holdings and Travel Behavior: A Propensity Score and Causal Mediation Analysis of the San Francisco Bay Area.” Research in Transportation Economics 52: 46–55.
- Munro, C. 2023. “National Walking and Cycling Participation Survey 2023”.
- Nair, R., E. Miller-Hooks, R. C. Hampshire, and A. Bušić. 2013. “Large-scale Vehicle Sharing Systems: Analysis of Vélib’.” International Journal of Sustainable Transportation 7 (1): 85–106.
- Nikitas, A., P. Wallgren, and O. Rexfelt. 2015. “The Paradox of Public Acceptance of Bike Sharing in Gothenburg.” In Proceedings of the Institution of Civil Engineers-Engineering Sustainability (Vol. 169, No. 3, 101–113). Thomas Telford Ltd. doi:10.1680/jensu.14.00070.
- Ogata, R., J. D. Schmöcker, T. Nakamura, and M. Kuwahara. 2018. “One-Way car Sharing Station Demand Analysis Considering Public Transport Availability.” Proceedings of the 23rd International Conference of Hong Kong Society for Transportation Studies (HKSTS), Transportation Systems in the Connected Era, 547–554.
- Ou, Y., Z. Bao, S. T. Ng, and W. Song. 2023. “Estimating the Effect of air Quality on Bike-Sharing Usage in Shanghai, China: An Instrumental Variable Approach.” Travel Behaviour and Society 33: 100626.
- RAC. 2015. “Exploring the role of car sharing in Perth.” Retrieved from https://www-cdn.rac.com.au/-/media/files/rac-website/about-rac/community-programs/publications/reports/2015/exploring-the-role-of-car-sharing-in-perth.pdf.
- Rastogi, R., Krishna Rao, and K. V. 2003. “Travel Characteristics of Commuters Accessing Transit: Case Study.” Journal of Transportation Engineering 129 (6): 684–694.
- Raux, C., A. Zoubir, and M. Geyik. 2017. “Who are Bike Sharing Schemes Members and do They Travel Differently? The Case of Lyon’s “Velo’v” Scheme.” Transportation Research Part A: Policy and Practice 106: 350–363.
- Rindfleisch, A., A. J. Malter, S. Ganesan, and C. Moorman. 2008. “Cross-sectional Versus Longitudinal Survey Research: Concepts, Findings, and Guidelines.” Journal of Marketing Research 45 (3): 261–279.
- Rodier, C., and S. A. Shaheen. 2003. “Carsharing and Carfree Housing: Predicted Travel, Emission, and Economic Benefits: A Case Study of the Sacramento, California Region”.
- Romero, C. 2008. “SpiCycles in Barcelona”. Presented to Chamber of Commerce and Industry, December 19. Bucharest, Romania, 31.
- Santos, G. 2018. “Sustainability and Shared Mobility Models.” Sustainability 10 (9): 3194.
- Shaheen, S., C. Bell, A. Cohen, B. Yelchuru, and B. A. Hamilton. 2017. Travel Behavior: Shared Mobility and Transportation Equity (No. PL-18-007). United States. Federal Highway Administration. Office of Policy & Governmental Affairs.
- Shaheen, S., and N. Chan. 2016. “Mobility and the Sharing Economy: Potential to Facilitate the First- and Last-Mile Public Transit Connections.” Built Environment 42 (4): 573–588.
- Shaheen, S. A., N. D. Chan, and H. Micheaux. 2015. “One-way Carsharing’s Evolution and Operator Perspectives from the Americas.” Transportation 42: 519–536.
- Shaheen, S. A., S. Guzman, and H. Zhang. 2010. “Bikesharing in Europe, the Americas, and Asia: past, present, and future.” Transportation Research Record: Journal of the Transportation Research Board 2143 (1): 159–167.
- Shaheen, S., E. Martin, and A. Cohen. 2013. “Public bikesharing and Modal Shift Behavior: a Comparative Study of Early Bikesharing Systems in North America”.
- Shaheen, S. A., E. W. Martin, A. P. Cohen, and R. S. Finson. 2012. Public bikesharing in North America: early operator and user understanding (No. CA-MTI-12-1029). Mineta Transportation Institute.
- Shaheen, S. A., H. Zhang, E. Martin, and S. Guzman. 2011. “China's Hangzhou public bicycle: understanding early adoption and behavioral response to bikesharing.” Transportation Research Record: Journal of the Transportation Research Board 2247 (1): 33–41.
- Sioui, L., C. Morency, and M. Trépanier. 2013. “How Carsharing Affects the Travel Behavior of Households: A Case Study of Montréal, Canada.” International Journal of Sustainable Transportation 7 (1): 52–69.
- Smith, C. S., and J. P. Schwieterman. 2018. “E-Scooter Scenarios: Evaluating the Potential Mobility Benefits of Shared Dockless Scooters in Chicago”.
- Soltani, A., A. Allan, H. A. Nguyen, and S. Berry. 2019. “Bikesharing Experience in the City of Adelaide: Insight from a Preliminary Study.” Case Studies on Transport Policy 7 (2): 250–260.
- Soltani, A., A. Allan, D. Pojani, F. Khalaj, and M. Mehdizadeh. 2022. “Users and non-Users of Bikesharing: How do They Differ?” Transportation Planning and Technology 45 (1): 39–58.
- Steer Davies Gleave. 2016. “Carplus Annual Survey of car Clubs 2015/2016”. Tech. rep. Leeds.
- Tingting, L., L. Li, and L. Wei. 2011, December. “Analysis of Public Bicycles’ Impact on Residents’ Trip Chain.” Proceedings 2011 International Conference on Transportation, Mechanical, and Electrical Engineering (TMEE). (pp. 182-185). IEEE
- Traffix Group. 2012. Evaluation of Melbourne Bike Share.
- Tran, T. D., N. Ovtracht, and B. F. d’Arcier. 2015. “Modeling Bike Sharing System Using Built Environment Factors.” Procedia Cirp 30: 293–298.
- Van Wee, B., and F. Witlox. 2021. “COVID-19 and its Long-Term Effects on Activity Participation and Travel Behaviour: A Multiperspective View.” Journal of Transport Geography 95: 103144.
- Vasconcelos, A. S., L. M. Martinez, G. H. Correia, D. C. Guimarães, and T. L. Farias. 2017. “Environmental and Financial Impacts of Adopting Alternative Vehicle Technologies and Relocation Strategies in Station-Based one-way Carsharing: An Application in the City of Lisbon, Portugal.” Transportation Research Part D: Transport and Environment 57: 350–362.
- Zhang, Y., M. J. Brussel, T. Thomas, and M. F. van Maarseveen. 2018. “Mining Bike-Sharing Travel Behavior Data: An Investigation Into Trip Chains and Transition Activities.” Computers, Environment and Urban Systems 69: 39–50.
- Zhang, L., J. Zhang, Z. Y. Duan, and D. Bryde. 2015. “Sustainable Bike-Sharing Systems: Characteristics and Commonalities Across Cases in Urban China.” Journal of Cleaner Production 97: 124–133.
- Zhou, F., Z. Zheng, J. Whitehead, R. K. Perrons, S. Washington, and L. Page. 2020. “Examining the Impact of car-Sharing on Private Vehicle Ownership.” Transportation Research Part A: Policy and Practice 138: 322–341.
- Zhu, J., N. Xie, Z. Cai, W. Tang, and X. Chen. 2022. “A Comprehensive Review of Shared Mobility for Sustainable Transportation Systems.” International Journal of Sustainable Transportation 138: 1–25.