
ABSTRACT
How does students’ academic commitment develop over the course of their first term? Process research on students’ early academic experiences has been scarce due to a lack of appropriate high-density-high-frequency research designs. We thus have very limited knowledge on how students become academically committed over time. Drawing on the analogue of workplace commitment, I extracted five process-theoretical accounts regarding how students’ AC might evolve over time: Learning to Love, Honeymoon Hangover, High Match, Moderate Match, or Low Match. I measured 180 students’ weekly levels of commitment across 18 weeks (2,778 observations) of post-secondary education. In line with expectations, I found evidence for the above-mentioned five distinct AC trajectories. These findings illustrate the utility of a more nuanced, temporal approach to the study of commitment, and carry both theoretical and practical implications for student development and learning potential.
First-year post-secondary students often struggle to adjust to their new environment . So much so, that Griffiths et al. (Citation2005) termed this struggle a learning shock to liken it to the emotional jolt of adjusting to a new culture. Like newcomers confronting life in an unfamiliar country, first-year post-secondary students attempt to relate to a new academic culture; the transition seems to be a critical period of self-discovery and the success or failure of adjustment can determine how well students perform in the long-term (e.g., Hu & Wolniak, Citation2013). Understanding how first-year post-secondary students commit to their new educational pursuit is therefore of crucial importance.
Indeed, most scholars (see Human-Vogel & Mahlangu, Citation2009) agree that first-year post-secondary students go through a period of adjustment during which they become committed to their educational pursuit; a transition that can be understood in light of the seminal work by Tinto (Citation1975, Citation1998, Citation2006) and Bean (Citation1980, Citation1982). In this work, academic and social integration, commitment and persistence have been positioned as important predictors of student retention, achievements, and success. Although very little research on first-year post-secondary student retention and success has been done, it is important to recognize that authors have acknowledged the beneficial role of students' ability to self-regulate one’s learning (Bjork et al., Citation2013), self-efficacy (Zajacova et al., Citation2005), persistence (Wright et al., Citation2013) and, more recently and directly relevant to this study, academic commitment (Human-Vogel & Rabe, Citation2015).
Cross-sectional research seems to support the notion that academic commitment (AC) – broadly defined as ‘a force that binds an individual to a course of action of relevance to one or more targets’ (Meyer & Herscovitch, Citation2001, p. 301) – takes a pivotal role as a consistent predictor of later achievements and student success (Van den Bogaard, Citation2012; Willcoxson et al., Citation2011). Vogel and Human-Vogel (Citation2016) indeed found a positive association between one’s levels of self-efficacy and meaningfulness and one’s levels of AC, which in turn may positively affect one’s semester mark among South African engineering students. Similarly, Bong (Citation2001), Chemers et al. (Citation2001), and Gore (Citation2006) underscored the pivotal role of one’s AC in relation to future academic performance. Moreover, Fredricks et al. (Citation2004, p. 60) have noted that ‘establishing a commitment to education is essential if youth are to benefit from what schools have to offer and acquire the capabilities they will need to succeed in the workplace’. While these cross-sectional studies have provided us with insights into the importance of AC for students, these studies do not explore the dynamics or ‘what happens’ as these relations unfold over time (Roe, Citation2008) and they fail to recognize that these students must engage in a socialization process of relating to others, engaging in goal-oriented work, facing distinct challenges and supports, and meeting and internalizing others’ expectations (e.g., Scanlon et al., Citation2007). By omitting the role of time, research implicitly assumes that all first-year post-secondary students will uniformly commit to their education. Such uniformity seems implausible because theoretical and empirical evidence indicates that individuals react to events differently, directions or rates of response change differently, and situational influences are experienced differently (Preacher et al., Citation2008; Solinger et al., Citation2013, Citation2016). In the current research, I therefore embrace a dynamic perspective by exploring distinct patterns of change in AC (i.e., trajectories).
Trajectories of AC refer to the functional form of intra-individual changes that occur in some variable over time from an initial starting point (Chan & Schmitt, Citation2000). Longitudinal studies typically assume that all individuals represent a single population and that a single trajectory can explain the experience of all members of this population. Unlike these studies, I expect and explicitly test inter-individual differences in intra-individual systematic change over time. As such, I explore how different AC trajectories – through the application of a statistical technique that identifies groups of individuals that follow a different developmental nature over time – change over time by surveying students weekly on their emotional (feelings), cognitive (thoughts), and conative orientation (intentions) toward their educational pursuit. Specifically, I study the development of AC by adopting an a priori configuration of commitment scenarios, originally derived from a sample of new employees in organizations (Solinger et al., Citation2013). Extant qualitative research (e.g., Scanlon et al., Citation2007) provides an intimate view into students’ experiences and feelings of transition, and extant longitudinal research (e.g., Tracey, Citation2002) provides an initial sense of the dynamic nature of student growth. However, a person-centered process-based examination of student commitment can be more replicable (i.e., generalizable) than a qualitative approach, and can provide a more detailed account of the student experience than a longer-term lag study. Specifically, there are two main benefits of studying AC this way. First, AC is recognized and measured as a two-way dynamic and adaptive phenomenon. Consistent with social cognitive theories of student development (Lent et al., Citation1994; Lent & Brown, Citation2013), students adjust their AC according to an appraisal of events in real time, and these changes in AC have corresponding effects on students’ behavior and achievement outcomes. Second, as students’ commitment develops and changes alongside their values, norms, and related attitudes (e.g., Fredricks et al., Citation2004), it has a strong historical connection to the study of individual adjustment to institutions. As a consequence, the study of AC, in its true form as a developing concept, is well suited to longitudinal, experiential, and process-based methods.
This study makes two important contributions to the literature. First, at a substantial theoretical level, I advance process knowledge on the development of AC among new post-secondary students by empirically examining an a priori configuration of theoretical AC scenarios. By doing so, I provide configurative theory as to (1) the types of AC trajectories, and (2) the number of said trajectories. By focusing on the process, rather than elements (e.g., recency, primacy, halo effects), of commitment development, I meet the repeated calls for more descriptive research and in-depth exploration of phenomena (Hambrick, Citation2007; Kozlowski, Citation2009). Second, this study also makes a substantial methodological contribution by demonstrating the utility of high-density repeated measurement to overcome limitations of the traditional variable-centered approach to AC (i.e., assuming equal trajectories of commitment among all students; Fredricks et al., Citation2004). Because commitment changes over time and not all students change in the same direction or at the same rate, I used weekly measures of AC and analyzed the data using latent class growth modeling (LCGM) to typify students according to their trajectories of AC. In doing so, I identify subgroups of students that develop AC differently in the first term of post-secondary schooling.
A theoretical taxonomy of AC trajectories: hypothesis development
In the education context, the seminal work of Tinto (Citation1975, Citation1998, Citation2006) and Bean (Citation1980, Citation1982) has allowed us to argue that individual and contextual characteristics serve as important antecedents to students’ learning experience, which in turn inform the social cognitive mechanisms involved in self-appraisal (Lent et al., Citation1994; Lent & Brown, Citation2013), which ultimately will determine the developmental nature of students’ AC. In the literature, it is often proposed that individuals will become committed to an object because they experience either a High, Moderate, or Low Match between their dispositions (e.g., values, character, abilities, identity) and environmental characteristics (e.g., institutional values, culture, educational demands, opportunities, security). In other words, matching seems to be the dominant mechanism by which people commit, and that one could expect there to be low-match and high-match scenarios, as well as some middle ground of moderate match. Empirical work indeed suggests that students relate their personal values to a set of values consonant with their educational pursuit (Arieli et al., Citation2016) and their personal attributes to the attributes of their peers, with some students dispositionally more likely to maintain positive (high levels of initial AC), moderate (moderate levels of initial AC), or negative (low levels of initial AC) feelings, attitudes, or behaviors toward their learning culture (Arieli et al., Citation2016; Christie et al., Citation2016). Furthermore, empirical work by Cooper et al. (Citation2014), Morin et al. (Citation2011), and Solinger et al. (Citation2013) indicates that some individuals are dispositionally more likely to maintain high or low levels of commitment, whereas other individuals are more likely to maintain moderate levels of commitment. I thus expect that there exists a number of students characterized by High, Moderate, or Low Match AC trajectories.
However, building on the argument that one’s educational pursuit is part of a long-term process of self-discovery, characterized by critical life periods of exceptional change and development such as the transition to the first year of post-secondary education (Lent & Brown, Citation2013; Scanlon et al., Citation2007), I also propose the existence of dynamic AC trajectories. That is, many students learn to love their learning culture (Scanlon et al., Citation2007) and educational pursuit as they gradually internalize the values consonant with their area of study (Arieli et al., Citation2016). In contrast, many students set unrealistic expectations, and find themselves overwhelmed, isolated, and displeased with their learning culture and educational pursuit (Christie et al., Citation2016). That is, the initial ‘love for one’s education’ may take a turn for the worse and one may suffer from a ‘honeymoon hangover’. In other words, first-year post-secondary students’ initial learning experiences may inform a reappraisal of oneself in relation to one’s educational pursuit, and this reappraisal may result in changes in attitudes and behavior (e.g., Lent et al., Citation2006; Tracey, Citation2002). This argument for the existence of a Learning to Love – characterized by increasing levels of AC – and Honeymoon Hangover – characterized by initial increasing and later decreasing levels of AC – trajectory of AC is based on the argument that AC is considered to unfold across three stages of events: (1) anticipatory socialization, characterized by one’s initial expectations, (2) an initial encounter, during which one meets and initially adjusts to one’s new environment, and (3) long-term integration, during which one acquires and fine-tunes the required skills, attitudes, and behaviors to successfully integrate and become academically committed. This process resembles that of a romantic relationship in which two people gradually ‘learn to love’ each other. In contrast, one may easily ‘fall out of love’ as time passes by. Hence, opposite to the Learning to Love trajectory is the Honeymoon Hangover trajectory. An initial ‘honeymoon’ period can dissipate into a ‘hangover’ for either of the following two reasons: (1) initial positive attitudes toward the object of desire gradually and naturally return to a stable dispositional set-point (e.g., Boswell et al., Citation2009), or (2) initial impressions about one’s organization or academic choice do not line up with actual experiences (e.g., resulting in withdrawal behaviors, Jokisaari & Nurmi, Citation2009; Maia et al., Citation2016). Following the above arguments, I thus also expect that there exists a number of students characterized by Learning to Love and Honeymoon Hangover AC trajectories.
In sum, this leads me to the formulation of the following hypothesis with respect to the existence of AC trajectories.
Hypothesis 1: AC generally conforms to five subgroup trajectories: (1) High Match, (2) Medium Match, (3) Low Match, (4) Learning to Love, and (5) Honeymoon Hangover.
Method
Procedure
I conducted the current study among first-year psychology students from a large Belgian university during the first term of the academic year 2015–2016. The administration provided the email addresses of all registered first-year psychology students so that I could contact them via email and ask them to complete a general online survey prior to completing weekly surveys throughout the first term of the academic year. Once respondents had completed the general survey, I invited them to complete a short weekly survey for 18 consecutive weeks. I chose a weekly survey design because several scholars (e.g., Bakker & Bal, Citation2010) have argued that a weekly timeframe can pick up meaningful changes but is not so frequent that it undermines respondents’ willingness to complete multiple surveys. Because I focused on AC as a phenomenon that unfolds over time, I adhered to Roe’s (Citation2008) recommendations to begin data collection prior to the start of the phenomenon. Hence, students received the first weekly survey two weeks prior to the start of the first term and the last survey one week after the first term final exams ended. In total, I asked participants to complete 18 weekly surveys. Students did not receive any incentive to participate in the current study, and participation was completely voluntary. This study was approved by the Research Ethics Boards of the first author’s institution.
Sample
I initially contacted 386 students. Two hundred and nine students agreed to participate in the online weekly survey (response rate = 54.15%). The final sample included 180 students who completed 15.43 measurement occasions on average, resulting in a total of 2,778 observations. On average, respondents were 18.24 years old (SD = 1.78), 69% were female, 98.6% had already obtained a high school diploma and 1.4% had already obtained a higher educational degree in a different field of study. Using a Pearson chi-square test, I found no demographic differences between this sample and all enrolled first-year psychology students. In terms of representativeness of our sample, I would like to note that the seemingly disproportional female composition of this sample is in line with the American Psychology Association’s report on the change gender composition of psychology because they report that nearly 75% of all enrollments in Psychology are female (Cynkar, Citation2007).
Measures
General Survey Measures: The general online survey included demographic information (age, gender, and educational background). This information was used to describe the sample and included as control variables in the below described analytical procedure.
Weekly Survey Measures: Consistent with recommendations for high-density repeated measures research (e.g., Ohly et al., Citation2010), I used short validated scales to ensure a reasonable survey length and to avoid respondent fatigue. I counterbalanced scales to rule out potential order effects. Finally, to clarify that respondents were required to report about the past week, I adapted wording by (1) including ‘during the past week’ to all items, and (2) using the past tense (e.g., this is how I felt).
AC was measured with a 3-item Commitment Attitude Scale (3CAS; Solinger et al., Citation2008, Citation2013). The 3CAS was originally developed by Solinger et al. (Citation2013) based on Solinger et al.’s (Citation2008) reconceptualization of the three-component model of commitment as a measurement tool to be used to assess commitment in a high-density repeated measures design such as the one deployed in the current study. The affective component of AC was measured by ‘What I feel about my education: I am proud,’ the cognitive component of AC was measured by ‘What I think about my education: I belong to it,’ and the conative component of AC was measured by ‘What I do for my education: I engage’.Footnote1 Note that the wording of the 3CAS items corresponds to items that are found in conventional scales of commitment (e.g., Meyer & Herscovitch, Citation2001). Respondents scored each of these items on a 100-point scale ranging from 0 (not at all applicable to me) to 100 (fully applicable to me) as per the original conceptualization (Solinger et al., Citation2008, Citation2013). I computed one overall AC score for each time point. The level-specific within-person omega reliability (Geldhof et al., Citation2014) was satisfactory (.92) and traditional Cronbach’s coefficients ranged from .76 to .89 (mean Cronbach’s coefficient = .83).
Analysis
I used latent class growth modeling (LCGM) to identify different latent classes of student AC trajectories over time (Andruff et al., Citation2009; Nagin, Citation2005). LCGM is a statistical technique that identifies groups of individuals that follow different trajectories over time based on their responses on a focal variable, such as AC. Individuals within the group are more similar than those in other groups in their development of AC. Unlike traditional latent growth curve modeling (LGCM), which assumes that one trajectory can capture the experiences of the entire population, LCGM allows for each group of individuals to have its own specific growth model, growth parameters (e.g., intercept, slope, quadratic term), and relationship to (time-varying) covariates (Muthen & Asparouhov, Citation2006). In doing so, it recognizes the option that not all individuals’ AC develops in the same direction (e.g., some may experience a decline whereas others may experience an increase) or at the same rate (e.g., some may increase very fast whereas others may require more time to become committed). I conducted all analyses in Mplus version 7.4 using the full- information maximum likelihood (FIML) algorithm for handling missing data. I refer interested readers to Appendix 1 for a step-by-step and in-depth explanation of LCGM as applied in this manuscript.
Results
Preliminary analyses
When estimating the LCGM of OC, I started by estimating a single-class LCGM for OC. Next, I gradually increased the number of latent classes (i.e., available trajectories of AC). I used 1000 iterations, 6000 random sets of starting values, and 500 initial rounds of optimization (Jung & Wickrama, Citation2008). To determine the optimal number of latent classes, I used the Parametric Bootstrapped Likelihood Ratio Test (BLRT; McLachlan & Peel, Citation2000), the Bayesian Information Criteria (BIC) and the Sample Size Adjusted Bayesian Information Criteria (ABIC) to determine the number of AC trajectories because these fit indices have been shown to perform best (Nylund et al., Citation2007). Moreover, in line with recommendations in the literature (Nagin, Citation2005; Querishi & Fang, Citation2011), I also reported entropy value (i.e., the level of accuracy with which individuals are classified in a trajectory of AC), percentage of observation per trajectory (i.e., minimum 1% of observations within an AC trajectory to keep different trajectories meaningful), and classification probabilities for the most likely AC trajectory membership (i.e., the conditional probability that students belong to an AC trajectory). Based on these criteria, I found that the five latent class model fit the data best. That is, I found that the BIC, ABIC, and BLRT indices continue to improve until a model with six AC trajectories. For the six trajectory model, I found that the proportion for one of the AC trajectories fell below the suggested 1% of total counts and that the posterior probabilities of one of the six AC trajectories was dropping closer to the .90 cut-off (see – columns ‘% of total counts and posterior probabilities’ of model six). Hence, I selected the model with five AC trajectories for further analysis.
Table 1. Fit indices of the latent classes models of AC.
I assessed the replicability of the selected latent class models because LCGMs are particularly susceptible to converging on local solutions (i.e., a suboptimal solution with untrustworthy parameter estimations; Hipp & Bauer, Citation2006). I found that the best loglikelihood values and parameter estimates replicated when I reanalyzed the data; bolstering confidence that the obtained solution reached a global optimum with trustworthy parameter estimations (McLachlan & Peel, Citation2000).
Testing the taxonomy of AC trajectories
shows the growth parameter estimates of the model with five AC trajectories. For each trajectory, I present the associated growth parameter estimates and the number of post-secondary students characterized by each trajectory. When presenting and describing the results of each of these AC trajectories, I will make specific reference to the growth parameters in . Based on the parameter estimates, is a graphical representation of the trajectories.
Figure 1. Five distinct AC trajectories during the first term of university. The dashed line indicates the start of the first term of the university.
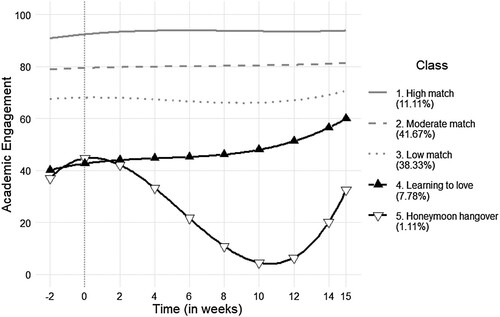
Table 2. Growth parameters of the latent classes models of AC.
The first trajectory (indicated by black triangles in ) contained 14 respondents and corresponded to the theoretical Learning to Love trajectory wherein students displayed moderate AC two weeks prior to the start of the first term (see significant intercept of 42.65 for class 1 in ), but gradually increased their level of AC as the first term progressed (see significant positive slope of .93 for class 1 in ). The second trajectory (indicated by a solid line in ) contained 20 students and corresponded to the theoretical High Match trajectory wherein students displayed high AC throughout the term (see significant intercept of 92.43 for class 2 in ) and continued to gradually increase their levels of AC as the term progressed (see significant positive slope of .62 for class 2 in ). The third trajectory (indicated by a dotted line in ) contained 69 students and was characterized by students with a low and stable AC throughout the term (see significant intercept of 68.09 for class 3 in ); this latent class corresponds to the theoretical Low Match trajectory. The fourth trajectory (indicated by white triangles in ) contained 2 students who displayed a moderate level of AC two weeks prior to the start of the first term (see significant intercept of 44.61 for class 4 in ) and continued to increase their AC in the first weeks of post-secondary education (see significant positive slope of .99 for class 4 in ), but later de-committed (see significant negative quadratic term of −1.26 for class 4 in ), and eventually partially recovered their levels of AC upon completing exams (see significant positive cubic term of .076 for class 4 in ). As such, this latent class corresponds to the Honeymoon Hangover trajectory. At this point it should be noted that this group, despite being a small class, contains meaningful information with regards to the developmental nature of AC and that a small Honeymoon Hangover trajectory was already present as of the three trajectory solution; demonstrating its robustness when adding more trajectories. Finally, the fifth group (indicated by a dashed line in ) contained 75 students and was characterized by students who displayed moderate and stable AC throughout the first term of post-secondary education (see significant intercept of 79.46 for class 5 in ). Hence this latent class corresponds to the theoretical Moderate Match trajectory.
Discussion
The present study offers a nuanced approach to mapping the development of transitioning students’ AC. In this study, I proposed that trajectories of new students’ AC were to follow five distinct AC trajectories: High, Moderate, and Low Match and Learning to Love and Honeymoon Hangover. As expected, students indeed became academically committed conform to one of five trajectories of AC (in decreasing prevalence): Moderate Match (41.67%), Low Match (38.33%), High Match (11.11%), Learning to Love (7.78%), and Honeymoon Hangover (1.11%).
Theoretical contributions
The findings of this study can aid future theory on the development of AC in at least two important ways. First, and perhaps most importantly, my study demonstrates the utility of person-centered process approaches to study AC. In particular, this study illustrates that subgroups of post-secondary students become academically committed according to five distinct and predictable patterns. These patterns can indicate critical moments of change in the adjustment period. Theoretical accounts of AC that emphasize a stable match or fit (e.g., attraction–selection–attrition theories) cannot equally represent all students – students with stable match trajectories will be better accounted for than Learning to Love and Honeymoon Hangover trajectories. Similarly, theoretical accounts of teaching styles (e.g., Biggs’ active–passive teaching styles, Citation2012) may be improved by recognizing that a small group of students begin on a path of increasing (Learning to Love) or decreasing (Honeymoon Hangover) AC approximately one month into the first term of post-secondary education. These findings have implications for the above-cited seminal work of Tinto (Citation1975, Citation1998, Citation2006) and Bean (Citation1980, Citation1982) in the sense that these models should potentially recognize the importance of one’s trend, rather than absolute level, of AC in relation to student retention, achievements, and success. It is therefore important to look at previous work on AC in light of my findings. For example, the positive correlation between one’s levels of self-efficacy and meaningfulness and one’s levels of AC reported by Vogel and Human-Vogel (Citation2016) may only apply to those students characterized by a Moderate Match (41.67%), High Match (11.11%), or Learning to Love (7.78%) trajectory. Similarly, the previously found positive correlation between one’s AC and future academic performance (Bong, Citation2001; Chemers et al., Citation2001; Gore, Citation2006) may also only apply to those students characterized by a Moderate Match (41.67%), High Match (11.11%) or Learning to Love (7.78%) trajectory; ultimately leaving out the experience of approximately 40% of all post-secondary students.
Second, consistent with the literature in the education context (see for example, Arieli et al., Citation2016; Briggs et al., Citation2012; Christie et al., Citation2016; Lent et al., Citation1994; Scanlon et al., Citation2007), it appears that post-secondary students go through a period of adjustment to their new educational pursuit; a phase of adjustment that results in five distinct profiles of AC. While the Stable High, Moderate, and Low Match trajectories are proposed to represent dispositional set points of commitment based on the match between students’ values, skills, and identities with their chosen educational pursuit (see Arieli et al., Citation2016; Christie et al., Citation2016; Lent et al., Citation1994), the dynamic Learning to Love trajectory occurs as a subset of students make an initial low appraisal of their match with their educational pursuit but recognize increased personal potential and match as the term progresses. Similarly, the Honeymoon Hangover trajectory characterizes students that initially appraise themselves as high matching, but have difficulty adjusting to their academic career, and as a result become disillusioned and de-committed as the term progresses.
Practical implications
This study offers multiple implications for post-secondary education policymakers, instructors, and students. First, having a map of the full taxonomy of commitment trajectories allows educators and support staff (e.g., student counseling) to systematically monitor and predict students future AC development. In doing so, they are better equipped to pick up on early warning signals (e.g., Low Match of Honeymoon Hangover students) and intervene at an earlier time. My findings suggest that higher educational institutions should monitor (e.g., through the 3-item scale I used in this study) the AC of their first-year students to determine how their commitment evolves over time and to intervene according to the specific AC trajectory students belong to. For example, I found that students characterized by a Honeymoon Hangover trajectory start the term at approximately the same level of commitment as their peers in the Learning to Love trajectory. However, as the term progresses, students in the Honeymoon Hangover trajectory experience a steep and rapid decrease in AC, whereas students in the Learning to Love trajectory continue to become increasingly committed. As such, students who are characterized by the Honeymoon Hangover trajectory may especially benefit from support and guidance by educators and support staff (e.g., student counseling, one-on-one student orientation) to keep them academically committed, whereas students who are characterized by the Learning to Love trajectory may especially benefit from motivation and skill-based interventions to keep them on a positive trajectory.
Limitations & future research
Despite the high-density high-frequency nature of our data, I would like to point out that I adopted LCGM, which fixes the within-class variance for the growth parameters of AC to zero (see Jung & Wickrama, Citation2008). By doing so, all students who belong to the same AC trajectory were expected to behave in exactly the same way (see Morin et al., Citation2011 for an extended discussion and illustration of the limitations of this approach). However, despite this limitation, my hypothesis was supported, reinforcing the theoretical and practical value of the hypothesized trajectories for describing students’ development of AC.
Second, I have provided empirical evidence of different trajectories of AC, yet one could rightly question whether more specific targets of commitment (e.g., to a school, to a class) would be subject to the same set of trajectories or whether the trajectories would fit the same timeline. Note that I only demonstrated how students’ AC differed across different trajectories of commitment at the end of the first term. However, it is equally important to identify the determinants of trajectory membership by, for example, demonstrating whether high school cumulative grades are predictive of students’ trajectories of AC, or whether sets of individual characteristics interact with environment factors (e.g., teaching style, Biggs, Citation2012) to bring about these trajectories.
Finally, despite a dominant focus on the seminal work of Tinto (Citation1975, Citation1998, Citation2006) and Bean (Citation1980, Citation1982) to support the argument that students will become committed to their education following a High, Moderate, or Low Matching principle, our findings indicate that a substantial proportion of students follow a more dynamic evolution, characterized by ups and downs in their commitment levels. That is, students who are characterized by a Learning to Love and Honeymoon Hangover AC trajectory show clear deviations in academic engagement from the start to the end of the term. A more complete model of AC and academic success must thus acknowledge the trend in AC after an initial degree of match has been accomplished. To further elucidate these findings we deem it imperative to hold in-depth interviews or focus groups with students who experience such strong upwards and downwards fluctuations in their AC throughout the term to (1) better understand the individual and contextual factors driving these changes, and (2) identify hindrances and challenges associated with the inflection points (i.e., tipping point at which their AC moves from an upward trend to a downward trend and vice versa) in their AC. Such knowledge would help researchers and practitioners alike to better understand the dynamic nature of AC and intervene at the right time to prevent a further decrease in AC.
Data Availability Statement
The data that support the findings of this study are openly available in the Open Science Framework at DOI 10.17605/OSF.IO/NS8RC.
Acknowledgments
We would like to thank two anonymous reviewers and the Editor (Ly Tran) who handled our manuscript for their suggestions to further improve our manuscript. We would also like to thank Jesse Fenneman for his assistance in creating the R script that was used to generate the figures in this manuscript.
Disclosure statement
No potential conflict of interest was reported by the author(s).
Notes
1 The Dutch translation used here may also be translated to English as ‘I participated’ or ‘I joined in to act’.
References
- Aiken, L. S., West, S. G., & Reno, R. R. (1991). Multiple regression: Testing and interpreting interactions. Sage.
- Andruff, H., Carraro, N., Thompson, A., Gaudreau, P., & Louvet, B. (2009). Latent class growth modelling: A tutorial. Tutorials in Quantitative Methods for Psychology, 5(1), 11–24. https://doi.org/10.20982/tqmp.05.1.p011
- Arieli, S., Sagiv, L., & Cohen-Shalem, E. (2016). Values in business schools: The role of selfselection and socialization. Academy of Management Learning and Education, 15(3), 493–507. https://doi.org/10.5465/amle.2014.0064
- Bakker, A. B., & Bal, M. (2010). Weekly work engagement and performance: A study among starting teachers. Journal of Occupational and Organizational Psychology, 83(1), 189–206. https://doi.org/10.1348/096317909X402596
- Bean, J. P. (1980). Dropouts and turnover: The synthesis and test of a causal model of student attrition. Research in Higher Education, 12(30), 155–187. https://doi.org/10.1007/BF00976194
- Bean, J. P. (1982). Student attrition, intentions, and confidence: Interaction effects in a path model. Research in Higher Education, 17(4), 291–320. https://doi.org/10.1007/BF00977899
- Biggs, J. (2012). What the student does: Teaching for enhanced learning. Higher Education Research & Development, 31(1), 39–55. https://doi.org/10.1080/07294360.2012.642839
- Bjork, R. A., Dunlosky, J., & Kornell, N. (2013). Self-regulated learning: Beliefs, techniques, and illusions. Annual Review of Psychology, 64(1), 417–444. https://doi.org/10.1146/annurev-psych-113011-143823
- Bong, M. (2001). Role of self-efficacy and task-value in predicting college students’ course performance and future enrollment intentions. Contemporary Educational Psychology, 26(4), 553–570. https://doi.org/10.1006/ceps.2000.1048
- Boswell, W., Shipp, A., Payne, S., & Culbertson, S. (2009). Changes in newcomer job satisfaction over time: Examining the pattern of honeymoons and hangovers. Journal of Applied Psychology, 94(4), 844–858. https://doi.org/10.1037/a0014975
- Briggs, A. R. J., Clark, J., & Hall, A. (2012). Building bridges: Understanding student transition to university. Quality in Higher Education, 18(1), 3–21. https://doi.org/10.1080/13538322.2011.614468
- Chan, D., & Schmitt, N. (2000). Interindividual differences in intraindividual changes in proactivity during organizational entry: A latent growth modeling approach to understanding newcomer adaptation. Journal of Applied Psychology, 85(2), 190–210. https://doi.org/10.1037/0021-9010.85.2.190
- Chemers, M. M., Hu, L., & Garcia, B. F. (2001). Academic self-efficacy and first year college student performance and adjustment. Journal of Educational Psychology, 93(1), 55–64. https://doi.org/10.1037/0022-0663.93.1.55
- Christie, H., Tett, L., Cree, V. E., Hounsell, J., & McCune, V. (2016). ‘It all just clicked’: A longitudinal perspective on transitions within university. Studies in Higher Education, 41(3), 478–490. https://doi.org/10.1080/03075079.2014.942271
- Cooper, J. T., Stanley, L. J., Klein, H. J., & Tenhiälä, A. (2014). Profiles of commitment in standard and fixed-term employment arrangements: Implications for work outcomes. European Journal of Work and Organizational Psychology, 25(1), 149–165. https://doi.org/10.1080/1359432X.2014.990443
- Cynkar, A. (2007). The changing gender composition of psychology. Monitor on Psychology, 38(6), 46.
- Fredricks, J. A., Blumenfeld, P. C., & Paris, A. H. (2004). School engagement: Potential of the concept, state of the evidence. Review of Educational Research, 74(1), 59–109. https://doi.org/10.3102/00346543074001059
- Geldhof, G. J., Preacher, K. J., & Zyphur, M. J. (2014). Reliability estimation in a multilevel confirmatory factor analysis framework. Psychological Methods, 19(1), 72–91. https://doi.org/10.1037/a0032138
- Gore, P. A. (2006). Academic self-efficacy as a predictor of college outcomes: Two incremental validity studies. Journal of Career Assessment, 14(1), 92–115. https://doi.org/10.1177/1069072705281367
- Griffiths, D. S., Winstanley, D., & Gabriel, Y. (2005). Learning shock: The trauma of return to formal learning. Management Learning, 36(3), 275–297. https://doi.org/10.1177/1350507605055347
- Hambrick, D. (2007). The field of management's devotion to theory: Too much of a good thing? Academy of Management Journal, 50(6), 1346–1352. https://doi.org/10.5465/amj.2007.28166119
- Hipp, J. R., & Bauer, D. J. (2006). Local solutions in the estimation of growth mixture models. Psychological Methods, 11(1), 36–53. https://doi.org/10.1037/1082-989X.11.1.36
- Hu, S., & Wolniak, G. C. (2013). College student engagement and early career earnings: Differences by gender, race/ethnicity, and academic preparation. The Review of Higher Education, 36(2), 211–233. https://doi.org/10.1353/rhe.2013.0002
- Human-Vogel, S., & Mahlangu, P. P. (2009). Commitment in academic contexts: First year education students’ beliefs about aspects of the self, the lecturer and instruction. South African Journal of Higher Education, 23(2), 309–328.
- Human-Vogel, S., & Rabe, P. (2015). Measuring self-differentiation and academic commitment in university students: A case study of education and engineering students. South African Journal of Psychology, 45(1), 60–70. https://doi.org/10.1177/0081246314548808
- Jokisaari, M., & Nurmi, J. E. (2009). Change in newcomers’ supervisor support and socialization outcomes after organizational entry. Academy of Management Journal, 52(3), 527–544. https://doi.org/10.5465/amj.2009.41330971
- Jung, T., & Wickrama, K. A. S. (2008). An introduction to latent class growth analysis and growth mixture modeling. Social and Personality Psychology Compass, 2(1), 302–317. https://doi.org/10.1111/j.1751-9004.2007.00054.x
- Kozlowski, S. W. J. (2009). Editorial. Journal of Applied Psychology, 94(1), 1–4. https://doi.org/10.1037/a0014990
- Lent, R. W., Schmidt, J., & Schmidt, L. (2006). Collective efficacy beliefs in student work teams: Relation to self-efficacy, cohesion, and performance. Journal of Vocational Behavior, 68(1), 73–84.
- Lent, R. W., & Brown, S. D. (2013). Social cognitive model of career self-management: Toward a unifying view of adaptive career behavior across the life span. Journal of Counseling Psychology, 60(4), 557–568. https://doi.org/10.1037/a0033446
- Lent, R. W., Brown, S. D., & Hackett, G. (1994). Toward a unifying social cognitive theory of career and academic interest, choice, and performance. Journal of Vocational Behavior, 45(1), 79–122. https://doi.org/10.1006/jvbe.1994.1027
- Maia, L. G., Bastos, A. V. B., & Solinger, O. N. (2016). Which factors make the difference for explaining growth in newcomer organizational commitment? A latent growth modeling approach. Journal of Organizational Behavior, 37(4), 537–557. https://doi.org/10.1002/job.2096
- McLachlan, G., & Peel, D. (2000). Robust mixture modeling using the t-distribution. Statistics and Computing, 10(4), 339–348. https://doi.org/10.1023/A:1008981510081
- Meyer, J. P., & Herscovitch, L. (2001). Commitment in the workplace: Toward a general model. Human Resource Management Review, 11(3), 299–326. https://doi.org/10.1016/S1053-4822(00)00053-X
- Morin, A. J. S., Morizot, J., Boudrias, J. S., & Madore, I. (2011). A multifoci person-centered perspective on workplace affective commitment: A latent profile/factor mixture analysis. Organizational Research Methods, 14(1), 59–90.
- Muthen, B., & Asparouhov, T. (2006). Item response mixture modeling: Application to tobacco dependence critiera. Addictive Behaviors, 31(6), 1050–1066. https://doi.org/10.1016/j.addbeh.2006.03.026
- Nagin, D. (2005). Group-based modeling of development. Harvard University.
- Nylund, K. L., Asparouhov, T., & Muthén, B. O. (2007). Deciding on the number of classes in latent class analysis and growth mixture modeling: A monte carlo simulation study. Structural Equation Modeling: A Multidisciplinary Journal, 14(4), 535–569. https://doi.org/10.1080/10705510701575396
- Ohly, S., Sonnentag, S., Niessen, C., & Zapf, D. (2010). Diary studies in organizational research. Journal of Personnel Psychology, 9(2), 79–93. https://doi.org/10.1027/1866-5888/a000009
- Petras, H., & Masyn, K. (2010). General growth mixture analysis with antecedents and consequences of change. In Handbook of quantitative criminology (pp. 69–100). Springer: New York, NY.
- Preacher, K. J., Wichman, A. L., MacCallum, R. C., & Briggs, N. E. (2008). Latent growth curve modeling. Sage.
- Querishi, I., & Fang, Y. (2011). Socialization in open source software projects: A growth mixture modeling approach. Organizational Research Methods, 14(1), 208–238. https://doi.org/10.1177/1094428110375002
- Roe, R. A. (2008). Time in applied psychology: The study of “what happens” rather than “what is”. European Psychologist, 13(1), 37–52. https://doi.org/10.1027/1016-9040.13.1.37
- Scanlon, L., Rowling, L., & Weber, Z. (2007). ‘You don’t have like an identity … you are just lost in a crowd’: Forming a student identity in the first-year transition to university. Journal of Youth Studies, 10(2), 223–241. https://doi.org/10.1080/13676260600983684
- Solinger, O. N., Hofmans, J., Bal, P. M., & Jansen, P. G. (2016). Bouncing back from psychological contract breach: How commitment recovers over time. Journal of Organizational Behavior, 37(4), 494–514. https://doi.org/10.1002/job.2047
- Solinger, O. N., van Olffen, W., & Roe, R. A. (2008). Beyond the three-component model of organizational commitment. Journal of Applied Psychology, 93(1), 70–83. https://doi.org/10.1037/0021-9010.93.1.70
- Solinger, O. N., van Olffen, W., Roe, R. A., & Hofmans, J. (2013). On becoming (un)committed: A taxonomy and test of newcomer onboarding scenarios. Organization Science, 24(6), 1640–1661. https://doi.org/10.1287/orsc.1120.0818
- Tinto, V. (1975). Dropout from higher education: A theoretical synthesis of recent research. Review of Educational Research, 45(1), 89–125. https://doi.org/10.3102/00346543045001089
- Tinto, V. (1998). Colleges as communities: Taking research on student persistence seriously. The Review of Higher Education, 21(2), 167–177.
- Tinto, V. (2006). Research and practice of student retention. What next? Journal of College Student Retention, 8(1), 1–19. https://doi.org/10.2190/4YNU-4TMB-22DJ-AN4W
- Tracey, T. J. G. (2002). Development of interests and competency beliefs: A 1-year longitudinal study of fifth- to eighth-grade students using the ICA-R and structural equation modeling. Journal of Counseling Psychology, 49(2), 148–163. https://doi.org/10.1037/0022-0167.49.2.148
- Van den Bogaard, M. (2012). Explaining student success in engineering education at delft university of technology: A literature synthesis. European Journal of Engineering Education, 37(1), 59–82. https://doi.org/10.1080/03043797.2012.658507
- Vogel, F. R., & Human-Vogel, S. (2016). Academic commitment and self-efficacy as predictors of academic achievement in additional materials science. Higher Education Research & Development, 35(6), 1298–1310. https://doi.org/10.1080/07294360.2016.1144574
- Willcoxson, L., Cotter, J., & Joy, S. (2011). Beyond the first-year experience: The impact on attrition of students’ experiences throughout undergraduate degree studies in six diverse universities. Studies in Higher Education, 36(3), 331–352. https://doi.org/10.1080/03075070903581533
- Wright, S. L., Jenkins-Guarnieri, M. A., & Murdock, J. L. (2013). Career development among firstyear college students: Self-efficacy, student persistence, and academic success. Journal of Career Development, 40(4), 292–310. https://doi.org/10.1177/0894845312455509
- Zajacova, A., Lynch, S. M., & Espenshade, T. J. (2005). Self-efficacy, stress, and academic success in college. Research in Higher Education, 46(6), 677–706. https://doi.org/10.1007/s11162-004-4139-z
Appendix
Analytical appendix for capturing the process of academic commitment: a taxonomy and test of post-secondary student academic commitment trajectories
I used latent class growth modeling (LCGM) to identify different latent classes of student engagement trajectories over time (Andruff et al., Citation2009; Nagin, Citation2005). LCGM allowed for each group of students to have its own growth model of AC, including its own specific growth parameters (e.g., intercept, slope, quadratic term; Muthen & Asparouhov, Citation2006). I conducted all analyses in Mplus version 7.4 using the full-information maximum likelihood (FIML) algorithm for handling missing data. Below, I describe all the steps required to identify these different AC trajectories.
Step 1: Specification of a Single-Class LGCM. To test the level of complexity (i.e., the number and order of growth parameters) required to describe different groups / classes of AC trajectories over time, I started by specifying a univariate model of AC with an intercept (i.e., the starting position of the regression line, depicting stability). Next, I stepwise increased the complexity of the LGCM by adding a slope term (provides the direction of the regression line, depicting linear change), a quadratic term (second-order polynomial term capturing curvilinear change or a recovery point in the regression line), a cubic term (third-order polynomial term capturing two points of change in the regression line), and a tetra term (fourth-order polynomial term capturing three points of change in the regression line). To determine the best fitting LCGM to the data, I relied on the Bayesian Information Criteria (BIC) and the Sample Size Adjusted Bayesian Information Criteria (ABIC; Aiken et al., Citation1991); lower values point toward better fitting models. The LGCM with the best fit to the data was used in subsequent steps.
Step 2: Specification of an Unconditional LCGM Without (Time-Varying) Covariates. Next, I specified an unconditional LCGM to identify the number of different AC trajectories over time (Andruff et al., Citation2009). To do so, I specified a LCGM of AC using the TYPE = MIXTURE option in Mplus version 7.4. I followed the recommendations of Jung and Wickrama (Citation2008) and fixed the within-class variance for the growth parameters of AC to zero to simplify the identification of the different latent classes and to reduce the computational burden. I started by estimating a single-class model of AC (i.e., assuming that all students followed the same trajectory). Next, I gradually increased the number of latent classes by one (i.e., allowing for different trajectories of AC) until the model no longer converged (Jung & Wickrama, Citation2008).
Step 3: Determining the Number of Latent Classes. In this step, I compared the previously estimated unconditional models of AC with each other to determine the optimal number of different AC trajectories. To do so, I used the Parametric Bootstrapped Likelihood Ratio Test (BLRT; McLachlan & Peel, Citation2000), the BIC, and the ABIC because these fit indices have been shown to perform best (Nylund et al., Citation2007). An LCGM with k latent classed was considered to offer a better fit to the data compared to an LCGM with k-1 latent classes when the BLRT was statistically significant (p < .05) and when BIC and ABIC values were lower. However, because BIC and ABIC often improve when more latent classes are added and because the BLRT often favors the more complex k latent class model over the k-1 latent class model (Petras & Masyn, Citation2010), I used additional criteria to evaluate the optimal number of latent classes. Nagin (Citation2005) and Querishi and Fang (Citation2011) consider an LCGM with k latent classes to offer a good fit to the data when this LCGM had a high entropy value (i.e., the level of accuracy with which individuals are classified in a trajectory of AC), no fewer than 1% of total observations in a single trajectory of AC (to ensure that different AC trajectories are meaningful), and high posterior probabilities (i.e., the conditional probability that students belong to an AC trajectory).
Step 4: Assessing the Replicability of the Selected LCGM. Once I determined the number of different AC trajectories, I assessed the replicability of this LCGM. This is a necessary approach because LCGMs, especially when the number of trajectories increases, were found to be particularly susceptible to converge on local or suboptimal solutions with untrustworthy parameter estimations (Hipp & Bauer, Citation2006). In this respect, I followed the recommendations of McLachlan and Peel (Citation2000) to estimate the best fitting LCGM with multiple sets of start values to distinguish these local solutions from the global optimum or replicable solution. Specifically, I scrutinized the seed values (i.e., random numbers assigned to the loglikelihood values) of the best loglikelihood values in the OPTSEED output of the best fitting model of AC. I used the seed values of all identical best loglikelihood values to re-analyze the best fitting LCGM using the OPTSEED function in Mplus version 7.4. If all outputs yield identical model parameter estimates, I can be confident that the initial solution is not a local or suboptimal solution and can thus be used for hypothesis testing.
Step 5: Preliminary analysis to support hypothesis testing. I compared the different unconditional LCGMs of AC; that is, I compared the BIC, ABIC, and BLRT indices for a unconditional LCGM with one AC trajectory (all students follow the same AC trajectory) with increasingly complex unconditional LCGMs with increasingly more AC trajectories. As previously mentioned, I noticed that each k latent class model resulted in significant improvement in model fit over its preceding k-1 latent class model (see of main manuscript). However, when I compared the model with five AC trajectories with the model with six AC trajectories, the proportion for one of the AC trajectories fell below the suggested 1% of total counts in the six AC trajectory model and that the posterior probabilities for one of the six AC trajectories was dropping closer to the .90 cut-off. Hence, I selected the model with five AC trajectories for further analysis (Morin et al., Citation2011; Nagin, Citation2005; Querishi & Fang, Citation2011). Moreover, I then scrutinized the OPTSEED output for the seed values of the best loglikelihood values and found two identical best loglikelihood values. I used their seed values to re-analyze the model with five AC trajectories using the OPTSEED function to check whether the best loglikelihood was still obtained and replicated in each of these LCGMs. When comparing the results of these outputs, the best loglikelihood values and parameter estimations were replicated, which bolsters my confidence that the obtained solution reached a global optimum with trustworthy parameter estimations (McLachlan & Peel, Citation2000).