
ABSTRACT
Universities actively promote themselves to potential students, control admissions and deliver programs of study. For most students globally, there are financial costs to attending university. At the extreme end of failure are students who receive ‘zero-fails’: they enrol, do not submit any assessments, and receive a mark of 0 out of 100. A quantitative descriptive analysis was performed and provides student performance details for bachelor-level students enrolled in a large, regional Australian university from 2019–2021. At a unit level, zero-fails accounted for 20% of all failing grades. There was a significant increase in zero-fail grades in 2020 and 2021 compared to 2019. However, zero-fails are not entirely a COVID-19 phenomenon. Only 8% of students who received any zero-fail grade in their commencing semester of study continued onto their second semester and passed most of their units. We argue universities operating in countries with deferred payment schemes such as Australia and the United Kingdom have a responsibility to track unit failure in finer detail and consider ways to mitigate debt associated with students who are clearly not receiving value from their educational experience. This must be done as we continue to expand higher education opportunities to students from non-traditional backgrounds.
Introduction
This study investigates how undergraduate students are failing. A key report published by the National Centre for Student Equity in Higher Education defined a type of unit result in which students do not submit any assessments and receive a cumulative unit mark of zero, sometimes referred to as ghost students or zero-fails (Stephenson et al., Citation2021). This study contributes to understanding student failure by showing: the prevalence of zero-fails, how COVID-19 impacted rates of zero-fails and how students typically perform following a period of study in which they receive a zero-fail. We are in an era of rapid technological development that is expected to transform the job market. The job market of the future necessitates more people accessing tertiary education (Department of Education, Citation2023). In this context it is more important than ever to seek a greater understanding of failure, including zero-fails to ensure we find ways of facilitating the growth of tertiary education while mitigating results in which students aren’t receiving any benefit.
For students around the globe, one consequence of enrolling in units without completion is a financial cost. Most domestic students in Organisation for Economic Co-operation and Development (OECD) countries are financially liable to some extent for tuition fees, and the cost of attending university full time is usually over USD 3000 per year (OECD, Citation2021). Despite the use of a variety of systems worldwide to make these fees more affordable for students, such as deferred government loans or scholarships, students often still shoulder a significant financial expense (OECD, Citation2021). Australia and the United Kingdom share a similar high cost, high support model with support in the form of a deferred government loan (OECD, Citation2021). This means students only need to start making re-payments when threshold earnings are met, a feature first introduced in Australia which is becoming widespread internationally (Chapman & Nicholls, Citation2013). Many students in both countries are not able to pay off their student loans within their lifetime (Parliament, Citation2022). For most countries that do not have free domestic tuition, financial models of tertiary education are applied equally to students who both pass and fail. Failing is not free.
Students who are required to make up-front payments necessarily perceive the cost of attending university at the point of payment; however, this is not so for students with access to deferred government loans. There is a bourgeoning body of literature on human decision-making that supports this. ‘Delay discounting’ explains a tendency for most people to minimise the value of a financial loss when there is a delay from the moment the decision must be made, to when the consequence is applied (Furrebøe, Citation2022; Hardisty et al., Citation2013; Myerson et al., Citation2016). Most people become less reluctant to take on a financial loss as the length of the delay is increased (Myerson et al., Citation2016). In countries with deferred government loans, students can delay the financial consequences for years (Chapman & Nicholls, Citation2013). The significance given to the cost of study may be greatly reduced by most students when they are making decisions about their enrolment. In one way, this is precisely the point of such loans. They are intended to enable all students to study without being discouraged by the tuition cost (Chapman & Nicholls, Citation2013). The fairness of the system is predicated on the assumption that most students will graduate, benefit from higher lifetime earnings and therefore should pay for their course, rather than have the education subsidised by taxpayers (Chapman & Nicholls, Citation2013). Failing is not free, but many domestic students in the UK and Australia (and any other country with a deferred loan scheme) are making enrolment decisions as if it is. Students are, predictably, minimising the relative importance of the financial consequence of university level study. As such, we think there are some types or degrees of student failure that should warrant some institutional concern.
Unit level failure is a common experience at university and yet research investigating various degrees of failure remains limited. According to first year students, passing units is the most important element of success at university (Naylor, Citation2017). While failing can be an important learning experience, in some cases it seems unlikely; some students fail without having submitted a single assessment item (Stephenson et al., Citation2021; Wimshurst & Allard, Citation2008). The term ‘ghost student’ has colloquially emerged among some academic circles in Australia to describe these students (Stephenson et al., Citation2021). Although a nebulous term, ghost students enrol in units, rarely access resources or participate in learning activities and never submit any of the assessment items. Their names appear in the student enrolment list, yet they show no signs of engagement (Stephenson et al., Citation2021). For domestic ghost students, despite little or no evidence of engagement or learning, the students still accrue debt.
The current study builds on the report by Stephenson et al. (Citation2021), which called for a sector wide definition and terminology to replace informal terms such as ‘ghost students’. In this study we have used the same definition as proposed by Stephenson et al. (Citation2021, p. 12): ‘ … any credit-bearing unit attempt that results in a reported failure and a numeric mark of zero’ but have chosen to refer to this result as a ‘zero-fail’.
When it comes to research on unit level failure that specifically reports on zero-fails, or other equivalent terms at an undergraduate level, a literature review has identified only two studies internationally. The single institution study by Stephenson et al. (Citation2021) reported that 26.8% of all unit level failing grades from commencing students were zero-fails. Wimshurst and Allard (Citation2008) provide another point of comparison from a smaller sample of students within a single Australian university faculty from students enrolled from 1998–2000. In this study, 32.4% of all failing grades were zero-fail grades and students were more likely to receive zero-fail grades if they chose to defer the fees (Stephenson et al., Citation2021; Wimshurst & Allard, Citation2008). Stephenson et al. (Citation2021) reported that at one Australian university, approximately 10% of commencing bachelor students recorded at least one zero-fail grade and the biggest risk factors were part-time study and low Australian Tertiary Admission Rank (ATAR). Students from equity groups (groups who have not traditionally attended university or who have a history of disadvantage in higher education) were more likely to study part-time, have a lower ATAR and to receive a zero-fail grade. Among the students from equity groups, Australian First Nations students were found to be at greatest risk of receiving a zero-fail grade (Stephenson et al., Citation2021). There is an absence of qualitative research explicitly focusing on the student experience of receiving a zero-fail grade.
One barrier to gaining a more thorough understanding of failure and differentiating different types of unit failure is how grades are recorded. In Australia alone, the classification of unit failure varies across universities and does not always include something like a zero-fail category (Stephenson et al., Citation2021). From a student’s perspective, this is unsurprising; the binary pass or fail is the pragmatic distinction (Naylor, Citation2017). In Australia, there is a well-known saying among students: ‘p’s get degrees. Similar inconsistencies exist in relation to grades public universities are required to report to their regulators (Stephenson et al., Citation2021). We suspect that because neither regulators nor students require a detailed typology of failure, it has flown under the radar in higher education literature.
Australia is currently in the process of higher education reform (Department of Education, Citation2023). The interim report has urgently highlighted that too few Australians are going to university. In the next five years, half of the new jobs created will require a bachelor level degree or higher. To meet the projected workforce demands, university enrolments must increase and most of the growth must come from under-represented groups (Department of Education, Citation2023). These calls for widening participation continue an established trend in Australia. In 2008, the Bradley review of Australian Higher Education advocated for changes to be made to the higher education system to increase numbers of students from under-represented backgrounds and make them proportional to students from no equity groups (Bradley et al., Citation2008). Subsequent demand driven funding introduced in 2012 led to more than 75,000 additional enrolments from students from equity group backgrounds from 2013 to 2019 (NCSEHE, Citation2022). However, attainment rates of these students have remained lower than students from no equity group background. In Australia, the largest gap is for Australian First Nations students, whose risk of not completing their program of study is 45%, 15 percentage points higher than non-First Nations students. The next largest gap is for students with a disability who were five percentage points higher than average (Cherastidtham et al., Citation2018). Unit failure at university is also disproportionately higher for some equity groups, and higher still for students that belong to multiple equity groups (Edwards & McMillan, Citation2015; Li & Carroll, Citation2020). This means that while we have successfully increased the number of students attending and succeeding at university from equity group backgrounds, we have also increased the number who have attempted and failed. These students now have a student debt, and no qualifications. Similar patterns of educational outcomes linked to equity students exist outside of Australia. Within the OECD, First in Family students make up 47% of commencing students although they make up 65% of the population, with indicators showing the lower the level of education the parents have the later the student enters tertiary education. For countries that have the data available, only 44% of these students graduate. These increases in equity group student volume combined with persistent gaps in attainment rates place an even greater importance on understanding student success and failure.
At this stage, it is not clear how the disruptions to education from the COVID-19 pandemic and rapid move to online learning have impacted how students are failing. There was a concern that lockdown measures may have increased failure rates (Guppy et al., Citation2023). However, some studies have reported increased performance that was attributed to students spending greater time engaged with their learning (Gonzalez et al., Citation2020; Means & Neisler, Citation2020). Other studies have reported no apparent change to fail rates (Bawa, Citation2020) and there was no change in the fail rate in students enrolled in the California Community College system between 2019 and 2021 (Bulman & Fairlie, Citation2022). No study has yet looked at the zero-fail rate during 2020 including how it impacted equity groups.
It is important for universities to understand the factors that contribute to students receiving zero-fail grades. For many years, the Australian Government has been holding universities to account for failing grades by monitoring and setting standards around attrition, progress rates and completion (1.3.5 HESF). These metrics do not differentiate between types of failure. In October 2020, the Australian Government passed Job-ready Graduates package legislation, aimed to reform higher education funding and prioritise funding for courses in areas of national importance while increasing student contributions for some degrees (DESE, Citation2021). Within the Job-ready Graduates package legislation, albeit vague, there were measures outlined that require universities to consider the nature of student failure to protect students from incurring unnecessary debt (DESE, Citation2021). Universities are to ensure that only ‘genuine students’ have access to commonwealth-supported places. But beyond compliance, student-centred universities have an inherent interest in their students’ success and failure.
Aim
The broad aim of this study was to develop a better understanding of how undergraduate students are failing. Specifically, our aims were to answer the following research questions:
What is the prevalence of zero-fail grades at a unit level and how does this vary among equity groups?
What was the effect of COVID-19 on zero-fails?
How do commencing students perform in the subsequent semester after receiving a zero-fail result?
Methods
Description of educational context
Charles Sturt is an Australian public university that has six main teaching campuses located across regional areas of the state of New South Wales. Charles Sturt has approximately 40,000 enrolled students and is one of the largest providers of online and blended learning in Australia. Undergraduate students typically enrol in bachelor level programs of 3–4 years duration, delivered over the first two trimesters of each year. These will be referred to as Semester 1 and Semester 2. The third trimester, Semester 3, is typically used for additional flexibility and accelerated learning.
The 32,312 undergraduate students in the sample had the following characteristics: 71% were female, 26% were from low socioeconomic status (low SES) postcodes, and 25% were studying with a full-time program load. According to the Accessibility and Remoteness Index of Australia, 58% of students included in the analysis resided in regional areas and 2.4% in remote areas of Australia. The mode of content delivery for students in the sample is complicated by the COVID-19 lockdowns throughout 2020 and 2021. 73% of students were enrolled exclusively in units delivered online. The remaining 27% of students were enrolled in units that were administratively recorded as being delivered on-campus or a combination of online and on-campus. However, although administratively recorded as on-campus units, the reality in 2020 and 2021 was that most units were at least partially delivered online.
In Australia, the census date is when domestic students must decide if they wish to continue with their university studies, and which units they will remain in for the given semester. In Australia, students can reduce their study load by removing units prior to census without any financial or academic penalty. After the census date, students are liable to pay tuition fees (most often through deferred government loans) and will have unit grades added to their permanent academic record. At Charles Sturt the census date is on the Friday of the fourth week of Semester 1 and 2, and the third week of Semester 3. Commencing students who enrolled and withdrew prior to the first census date, and as such did not record a grade, were omitted from the analysis. Ethics approval was received from the Charles Sturt University Human Research Ethics Committee (HREC Protocol No H21170). While preparing the application our institutional Learning Analytics Code of Practice and the Ethics of Learning Analytics in Australian Higher Education documents were consulted and all data was joined and then anonymised before analysis. The requirement for consent was waived.
Descriptive analysis of unit failure
This study uses a quantitative, descriptive research design focusing on unit failure based on previously published literature (Stephenson et al., Citation2021; Wimshurst & Allard, Citation2008). The similarity of this design with previous research allows important comparisons to be made regarding the prevalence of zero-fail unit results. All data presented in this study has been analysed from domestic students enrolled in a bachelor-level program at Charles Sturt from 2019–2021 inclusive, from any of the three main teaching semesters. The scope included all teaching semesters and was not limited to any field of study or faculty to capture a broad picture of unit failure. These years were chosen to provide data prior to and during the COVID-19 disruptions. Study mode was not a focus of the study design because during the period of study the distinction between internal and distance offerings was unstable. Grades (n = 272,841), student enrolment and demographics data were downloaded from the university data warehouse. All passing grades are grouped together in this study and represent cumulative marks of 50% or higher. Two categories of failing unit grades are presented: a zero-fail (students had not submitted any assessment and had a cumulative mark of 0%) or a fail (students had a cumulative mark of greater than 0% and less than 50%).
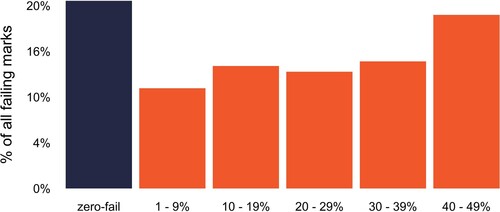
Cumulative unit marks out of 100 that had been entered into the learning management system (LMS, Blackboard) grading platform (Grade Centre) were downloaded from the Blackboard Direct Data Access (DDA) database. Units with incomplete assessment marks in Grade Centre were omitted from the unit mark analysis. In total, 38.6% of failing grades were able to be matched with a cumulative unit mark between 0% and 49% ().
Figure 1. Failing grades from 2019–2021 matched to a cumulative mark between 0–49%.
The LMS unit activity data was also downloaded from Blackboard DDA. The last LMS unit access date for each student was grouped by week and only includes data from students studying in Semester 1 or Semester 2 which are 14 weeks in duration.
When describing students’ enrolment level results in a semester we will use the terminology adapted from Stephenson et al. (Citation2021) but substituting non-participating enrolment with zero-fail: ‘total zero-fail’ or ‘partial zero-fail’. A ‘total zero-fail’ describes the result of a student receiving all zero-fail unit grades in a single semester. A ‘partial zero-fail’ describes the situation when a student receives at least one zero-fail grade, but not all zero-fail grades (e.g., 4 units: zero-fail, fail, fail, pass). A student who receives a partial zero-fail has submitted at least one assessment item in at least one unit.
Statistical analysis was completed in GraphPad Prism (version 9.4.1). A Pearson’s Chi-squared test was used to determine the statistical significance between the number of zero-fail grades from 2019 to 2021. Statistical significance was set at p <0.05.
Results
Unit marks and grades – the prevalence of zero-fail grades
From 2019–2021, 10.35% (3344) of the failing students did not submit any assessment items for at least one unit and thus received a zero-fail grade. There were significantly more zero-fail grades awarded in 2020 and 2021 compared to 2019 (p <0.05; ). There was a small, non-significant decrease in the percentage of zero-fail grades awarded from 2020 to 2021.
Table 1. Incidence of zero-fails among substantive and failing grades.
The most common failing mark was a zero-fail (, blue 20.5% of all failing marks). The remaining failing marks represented students scoring somewhere between 1%–49% (orange); after grouping the marks into 10% ranges, the second most common failing range of marks was 40–49% (19.0%). The pattern of non-zero failing grades did not change from 2019–2021 (data not shown).
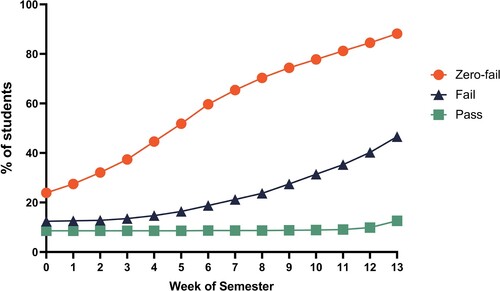
shows the last week when students accessed the unit LMS site for students with a zero-fail result, fail or passing result. Only 24% of students who received a zero-fail grade did not access the subject LMS at all (). The final date that students with zero-fail grades logged into the LMS subject site was spread quite evenly throughout the semester. Students who failed with a cumulative mark above 0% logged into the LMS much deeper into the semester compared to students who received zero-fails. Just under half of the students who received zero-fails (45%) did not log into the unit LMS site beyond census date compared to 15% of students with failing cumulative marks greater than 0%. A small percentage of students (11.8%) who received zero-fail grades logged into the LMS in the final weeks of semester.
Figure 2. The percentage of students who did not access the LMS beyond the given week of semester.
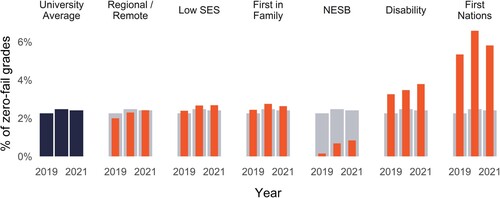
provides the percentage of grades that were a zero-fail grade in 2019, 2020 and 2021 by equity group. Students studying online are at a greater risk of receiving a zero-fail grade compared to the same demographic group studying internally (data not shown). First Nations students are at greatest risk of receiving a zero-fail grade. Students with a disability are also at elevated risk compared to the university average (grey). All other student demographic groups are at lower risk and are close to the university average. For students studying online, the risk is greatest for First Nations students and students living with a disability, while online students from a non-English speaking background (NESB) have the lowest risk of receiving a zero-fail grade.
Figure 3. The percentage of grades that are a zero-fail by equity group. Data is presented for 2019, 2020, and 2021 combined. Students from equity groups (orange) are shown compared to the university average (blue and grey shadow for comparison to each equity group).
Enrolment level analysis of zero-fail grades
Almost half (46.7%) of the domestic undergraduate students who received a zero-fail grade in a semester, received a zero-fail grade in every unit that semester. A total of 90.2% of students who received at least one zero-fail grade, failed all or most of their units for the semester. Only 9.8% of students passed most of their units in a semester in which they also receive a zero-fail grade.
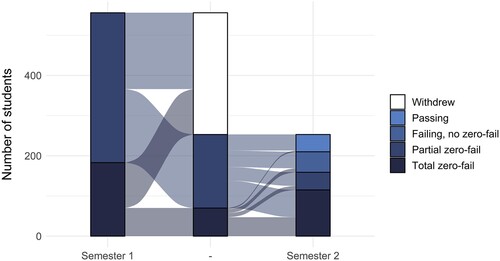
provides a graphic of all students who received at least one zero-fail in their commencing semester of study (left) and an overview of their performance in the second semester (right). When students received a zero-fail in their commencing semester of study, over half withdraw. Those who continued in the second semester of study were at high risk of receiving more zero-fail grades; 63% obtained more zero-fails and only 17% went on to pass the majority of their units. The balance between total and partial zero-fails changed from the first to the second semester of study, with 33% total zero-fails in the first semester compared to 72% total zero-fails in the second semester.
Figure 4. Semester 1 result of students with at least one zero-fail in their commencing semester, followed by their results in Semester 2.
Discussion
Unit level failure: research questions 1 and 2
This study shows that zero-fail grades consistently account for a significant proportion of all unit fails. While there was some variation between years, the proportion of all failing grades that were zero-fails was no less than 17.4%. Both other studies that have included undergraduate students have found even higher rates of zero-fail grades (Stephenson et al., Citation2021; Wimshurst & Allard, Citation2008). We now have seen substantial rates of zero-fails from three Australian universities at varying points in time; prior to the year 2000 (Wimshurst & Allard, Citation2008), from 2012–2017 (Stephenson et al., Citation2021) and from 2019–2021 (this study). The case is building that, in Australia at least, zero-fails have been and continue to be a common type of failure.
Until now, no study has investigated the effect of the COVID-19 pandemic on rates of zero-fails. In our sample, there was a significant increase in the proportion of zero-fail grades in 2020 and 2021 compared to 2019. The COVID-19 pandemic caused a great deal of disruption, and it is very likely that the flow-on effects have impacted the number of students receiving zero-fails. However, the higher rates of zero-fails among failing grades in other studies (Stephenson et al., Citation2021; Wimshurst & Allard, Citation2008) indicate that there are many other important factors beyond those related to COVID-19. Zero-fails will persist beyond COVID-19 related disruptions.
The equity group patterns of zero-fail grades in this study are very similar to the patterns seen for attrition risk (Norton et al., Citation2018; Walker-Gibbs et al., Citation2019). Australian First Nations students have the highest attrition rates followed by students with a disability, while students from NESB have lower rates of attrition (Norton et al., Citation2018). We have shown that Australian First Nations students were much more likely to receive a zero-fail grade, followed by students with a disability, while NESB students had lower rates of zero-fails. Stephenson et al. (Citation2021) also observed that Australian First Nations students were receiving zero-fails at significantly higher rates. It should be noted that the combined number of zero-fail grades from First Nations students only account for a very small percentage of all zero-fail grades at the university. Our study indicates that in 2020, the pandemic may have uniquely impacted First Nations students with respect to zero-fails. No other equity group showed the level of increase seen among First Nations students. The methodology and scope of this study cannot explain why this may be the case.
After zero-fails, the next most common range of marks leading to fail were the ‘near misses’, between 40–49%. These students are submitting some or all assessment items and have cumulative marks within 10% of the pass threshold. Previous qualitative research (Ajjawi et al., Citation2020; Walker-Gibbs et al., Citation2019) on failure has investigated the perspective of students at this end of the failure spectrum. Students expressed the importance of marks in the first assessment item (Walker-Gibbs et al., Citation2019) or the results of the entire unit (Ajjawi et al., Citation2020), representing an attempt that resulted in a fail. Students with zero-fail grade results indicate that students have not submitted any assessment items and presumably would not expect to pass that unit. As such, the student experience of a semester of study resulting in a zero-fail is likely to be different compared to the experiences in the qualitative studies above. We are yet to find any in-depth qualitative studies explicitly focusing on students with zero-fail grades. Future qualitative studies that interview or survey students who have received zero-fails are needed to understand the student experience and help uncover reasons for the behaviour. This would help universities decide the best ways to support these students.
Unpublished data by the authors suggest that many of the students who fall between zero-fails and ‘near passes’ (i.e., in the following ranges: 1–9%, 10–19%, 20–29%, 30–39%) are progressively disengaging throughout the semester and are not submitting all assessment items. This type of pattern has been reported on as far back as 2004 (Simpson, Citation2004). To better appreciate the nuance of student failure, two dimensions could be considered: assessment marks and assessment submission ratio. Further research is needed in this area to provide a more complete framework for understanding different behaviours leading to unit failure.
Enrolment level failure: research question 3
When students received any zero-fail grade in a semester, most students did not succeed in their other units. Only 9.8% of students passed most of their units if they received a zero-fail grade, which is comparable to the 10.5% reported previously (Stephenson et al., Citation2021). In a single period of study, most students with a zero-fail received a combination of more zero-fails or other failing grades. The most common enrolment level result of students who received at least one zero-fail was a total zero-fail. Given this, we can infer that individual unit-level factors are unlikely to be driving zero-fails. If this is true, we should not focus on making changes to individual units in which the student received the zero-fail grade if we wish to reduce the number of zero-fails across an institution.
Another finding from this study is that commencing students are far less likely to be successful in the following semester after receiving a zero-fail grade, and this was more evident for students with zero-fail grades in all units. Stephenson et al. (Citation2021) reported that 17.5% of students who had received zero-fail grades in all units in their commencing year were retained by the institution in the following year. Our results indicate that universities must look beyond first year retention. From a student-centred perspective, our results could be used to argue that retaining more students with a history of zero-fail grades may not be a great outcome, unless students’ likelihood of success can actually be improved. Once again, qualitative studies that directly bring forward the perspective of these students is needed.
‘Zero-fail’ rather than ‘non-participating enrolment’
In this study we have adopted the definition as proposed by Stephenson et al. (Citation2021) but have chosen to use the term ‘zero-fail’ rather than ‘non-participating enrolment’. We recommend that ‘zero-fail’ should be adopted by the sector in place of ‘non-participating enrolment’ with the following justification: ‘zero-fail’ more closely reflects the definition and avoids misleading readers. ‘Non-participating enrolment’ introduces an assumption that the student is not participating. Paradoxically, it is possible that a student could receive a non-participating enrolment (NPE) result even after participating in every class and tutorial, being active on the unit site and regularly posting on discussion boards. Provided they do not submit any assessments, the result would be misleadingly termed an NPE. This example may not be typical behaviour of students who receive a cumulative mark of zero but it illustrates the problem with using ‘non-participating enrolment’. However, as shown in this study, some participation is not uncommon among students who receive a cumulative mark of zero. We acknowledge the arguments around giving distance to the risk of adding to ‘deficit discourse’ within university culture (McKay & Devlin, Citation2016; Smit, Citation2012), but contend that ‘zero-fail' is overall a more appropriate term and should be adopted by the sector.
The broader context
When considering the domestic, financial deferred payment system in place in Australia and the associated research into behavioural psychology, the incidence of zero-fail grades can be understood (Myerson et al., Citation2016; Wimshurst & Allard, Citation2008). The deferred payment system is working as intended: students are attempting programs of study without being discouraged by the financial implications. But this strength shared by the Australian and the UK financial models is also a weakness. Some students disregard the financial consequences and receive questionable value from their experience. This is most clear for the one in four students who receive a zero-fail grade who never access the LMS during the semester. These students are not engaging to any extent with the learning materials and cannot be receiving any educational benefits and yet they chose to remain in the unit past census date. Many students who receive a zero-fail grade are not concerned, at the time when they must make enrolment decisions, about the impending financial liability.
Tertiary education providers are partially responsible for both successful and unsuccessful student attempts. In Australia we play an active role in attracting and admitting students: we spend millions of dollars in aspiration building and advertising, and ultimately have control over who we admit into our programs of study. Under regulatory guidance, we then control the delivery of the programs. In Australia, we have successfully provided educational opportunities to more students, from increasingly diverse backgrounds (Tomaszewski et al., Citation2020). This study shines a light on the experience of many of these students who hear our call, come, but leave with a student loan and little to show for it. Unfortunately, this happens at higher rates for First Nations students or those with a disability. It is important for tertiary institutions and the higher education sector more broadly to consider the nature of failing grades more than has been done previously and ask questions, such as: how can we continue to widen participation, without causing or at least limiting any adverse consequences?
At the highest level of intervention is changing the financial system for domestic students. Many countries have systems in which domestic students do not have any financial liability (OECD, Citation2021). France has a model where the commencing year is free for the student, and then fees are introduced for subsequent years of study. In these systems, the zero-fails would not disappear, but the students would not be left with any financial debt, reducing the financial significance of zero-fails. In Australia, there are no explicit links drawn to students receiving zero-fails and the student protections in the 2021 Job-ready Graduates Package of legislation. However, we believe that the Government was edging towards it. Given the lack of research into failure down to the unit level, it is unsurprising that the guidelines are lacking specificity. At a minimum, governments should consider including zero-fails as an additional metric to monitor university performance.
At the institutional level, more can be done in the pre-census period to ensure that students know what the census date means, when it is and to take a more proactive approach in advising and supporting students who appear at risk of zero-fails (Linden et al., Citation2023; Norton et al., Citation2018). The approach detailed by Linden et al. (Citation2023) involves an outreach campaign that is triggered by non-submission of a pre-census assessment item. In this study we show that over half of students who receive zero-fail grades are logging into the LMS up to and beyond census date. Logically, all zero-fail students are not submitting any pre-census assessment items. Therefore, in terms of identifying students on track for a zero-fail, tracking assessment submission is better – although more difficult – than relying on LMS activity data (Linden et al., Citation2023; Van Der Ploeg et al., Citation2020). Identifying students at-risk of zero-fails early in semester and providing support is worth exploring. However, exactly what should be done following identification of at-risk students becomes less clear. With the deferred payment system in place, the effect of ‘delay discounting’ will also persist. Future research should investigate the effectiveness of pre-census interventions to achieve better student outcomes, such as fewer zero-fails.
Summary of recommendations
Qualitative research should include studies that interview or survey students from various equity groups who have received zero-fails to understand the student experience of the result and help uncover reasons for the behaviour.
Future research should investigate identifying students at-risk of zero-fails using early assessment item engagement and trialling pre-census interventions to support students towards better academic outcomes and less debt.
Future research should continue studying the typology of student unit failure and consider including assessment submission ratios alongside cumulative unit marks and learning management system access.
Universities and governing bodies adopt the term ‘zero-fails’ with the definition provided by Stephenson et al. (Citation2021) and include them as an additional metric to monitor university performance.
The Australian Universities Accord should consider zero-fails as part of the bold higher education reforms currently taking place.
Conclusion
We have shown that unit level zero-fail grades are a common type of unit failure and are often clustered with more zero-fails or failing grades. Students who receive at least one zero-fail grade in their first semester at university are unlikely to achieve passing grades in the following semester. The number of students who received a zero-fail grade increased in 2020 and 2021, most likely due to COVID-19 disruptions. First Nations students and students with a disability appear to be more likely to receive zero-fails, introducing a reason to consider the nature of unit failure in more detail grounded in social justice. Future research is required to understand the influences on students receiving zero-fail grades, looking beyond COVID-19, and to explore the impact of students who belong to one or multiple equity groups. Governments and universities alike should consider the following question: how can we continue to widen participation while mitigating student outcomes on the less favourable end of the spectrum, such as zero-fails?
Disclosure statement
No potential conflict of interest was reported by the author(s).
Data availability statement
The data that support the findings of this study are available from the corresponding author, Author 1, upon reasonable request.
Additional information
Funding
References
- Ajjawi, R., Dracup, M., Zacharias, N., Bennett, S., & Boud, D. (2020). Persisting students’ explanations of and emotional responses to academic failure. Higher Education Research & Development, 39(2), 185–199. https://doi.org/10.1080/07294360.2019.1664999
- Bawa, P. (2020). Learning in the age of SARS-COV-2: A quantitative study of learners’ performance in the age of emergency remote teaching. Computers and Education Open, 1, 100016. https://doi.org/10.1016/j.caeo.2020.100016
- Bradley, D., Noonan, P., Nugent, H., & Scales, B. (2008). Review of Australian higher education: Final report. Australian Government.
- Bulman, G., & Fairlie, R. (2022). The impact of COVID-19 on community college enrollment and student success: Evidence from California administrative data. Education Finance and Policy, 17(4), 745–764. https://doi.org/10.1162/edfp_a_00384
- Chapman, B., & Nicholls, J. (2013). Higher education contribution scheme (HECS). Crawford School Asia and the Pacific Policy Studies Research Paper, (2). https://doi.org/10.2139/ssrn.2307733.
- Cherastidtham, I., Norton, A., & Mackey, W. (2018). University attrition: What helps and what hinders university completion. Grattan Institute. https://grattan.edu.au/wp-content/uploads/2018/04/University-attrition-background.pdf
- Department of Education. (2023). Australian Universities Accord Interim Report. Australian Government. https://www.education.gov.au/download/16699/australian-universities-accord-interim-report/33941/document/pdf
- DESE. (2021). Job-ready Graduates Package. Australian Government. https://www.dese.gov.au/job-ready
- Edwards, D., & McMillan, J. (2015). Completing university in a growing sector: Is equity an issue? https://research.acer.edu.au/cgi/viewcontent.cgi?article = 1045&context = higher_education
- Furrebøe, E. F. (2022). Qualitative variations in delay discounting: A brief review and future directions. Behavioural Processes, 200, 104666–104666. https://doi.org/10.1016/j.beproc.2022.104666
- Gonzalez, T., De la Rubia, M. A., Hincz, K. P., Comas-Lopez, M., Subirats, L., Fort, S., & Sacha, G. M. (2020). Influence of COVID-19 confinement on students’ performance in higher education. PLoS One, 15(10), e0239490–e0239490. https://doi.org/10.1371/journal.pone.0239490
- Guppy, N., Matzat, U., Agapito, J., Archibald, A., De Jaeger, A., Heap, T., Moreno, M. M., Rodrigo, M. M., & Bartolic, S. (2023). Student confidence in learning during the COVID-19 pandemic: What helped and what hindered? Higher Education Research & Development, 42(4), 845–859. https://doi.org/10.1080/07294360.2022.2119372.
- Hardisty, D. J., Appelt, K. C., & Weber, E. U. (2013). Good or Bad, We want it Now: Fixed-cost present bias for gains and losses explains magnitude asymmetries in intertemporal choice. Journal of Behavioral Decision Making, 26(4), 348–361. https://doi.org/10.1002/bdm.1771.
- Li, I. W., & Carroll, D. R. (2020). Factors influencing dropout and academic performance: An Australian higher education equity perspective. Journal of Higher Education Policy and Management, 42(1), 14–30. https://doi.org/10.1080/1360080X.2019.1649993
- Linden, K., van der Ploeg, N., & Roman, N. (2023). Explainable learning analytics to identify disengaged students early in semester: An intervention supporting widening participation. Journal of Higher Education Policy and Management, 45(6), 1–15. https://doi.org/10.1080/1360080X.2023.2212418.
- McKay, J., & Devlin, M. (2016). Chapter 10 - Widening participation in Australia: Lessons on equity, standards, and institutional leadership. In M. Shah, A. Bennett, & E. Southgate (Eds.), Widening higher education participation (pp. 161–179). Chandos Publishing. https://doi.org/10.1016/B978-0-08-100213-1.00010-X.
- Means, B., & Neisler, J. (2020). Suddenly online: A national survey of undergraduates during the COVID-19 pandemic. Digital Promise.
- Myerson, J., Baumann, A. A., & Green, L. (2016). Individual differences in delay discounting: Differences are quantitative with gains, but qualitative with losses. Journal of Behavioral Decision Making, 30(2), 359–372. https://doi.org/10.1002/bdm.1947
- Naylor, R. (2017). First year student conceptions of success: What really matters? Student Success, 8(2), 9–20. https://doi.org/10.5204/ssj.v8i2.377
- NCSEHE. (2022). National Data. https://www.ncsehe.edu.au/data/national-data/
- Norton, A., Cherastidtham, I., & Mackey, W. (2018). Dropping out: the benefits and costs of trying university. (0648230775). Grattan Institute https://grattan.edu.au/wp-content/uploads/2018/04/904-dropping-out-the-benefits-and-costs-of-trying-university.pdf
- OECD. (2021). Education at a Glance 2021. In Education at a Glance. OECD. https://doi.org/10.1787/b35a14e5-en.
- Parliament. (2022). Updated Higher Education Loan Program (HELP) debt statistics—2020–21. Australian Parliament. https://www.aph.gov.au/About_Parliament/Parliamentary_Departments/Parliamentary_Library/FlagPost/2021/November/HELP-2020-21
- Simpson, O. (2004). The impact on retention of interventions to support distance learning students. Open Learning: The Journal of Open, Distance and e-Learning, 19(1), 79–95. https://doi.org/10.1080/0268051042000177863
- Smit, R. (2012). Towards a clearer understanding of student disadvantage in higher education: Problematising deficit thinking. Higher Education Research & Development, 31(3), 369–380. https://doi.org/10.1080/07294360.2011.634383
- Stephenson, B., Cakitaki, B., & Luckman, M. (2021, March). “Ghost student” failure among equity cohorts: Towards understanding non-participating enrolments. NCSEHE; National Centre for Student Equity in Higher Education. https://www.ncsehe.edu.au/publications/ghost-student-failure-equity-cohorts-non-participating-enrolments/
- Tomaszewski, W., Kubler, M., Perales, F., Clague, D., Xiang, N., & Johnstone, M. (2020). Investigating the effects of cumulative factors of disadvantage. University of Queensland.
- Van Der Ploeg, N., Linden, K., Hicks, B., & Gonzalez, P. (2020). Widening the net to reduce the debt: Reducing student debt by increasing identification of completely disengaged students. ASCILITE’s First Virtual Conference – ASCILITE, 20, 54–59. https://doi.org/10.14742/ascilite2020.0125
- Walker-Gibbs, B., Ajjawi, R., Rowe, E., Skourdoumbis, A., Thomas, M. K. E., O’Shea, S., Bennett, S., Fox, B., & Alsen, P. (2019). Success and failure in higher education on uneven playing fields.
- Wimshurst, K., & Allard, T. (2008). Personal and institutional characteristics of student failure. Assessment & Evaluation in Higher Education, 33(6), 687–698. https://doi.org/10.1080/02602930701772911