
Abstract
Background: Two facts are generally recognized: (1) development of nonalcoholic fatty liver disease (NAFLD) is consistently linked to insulin resistance which has dietary implications and (2) circulating alanine aminotransferase (ALT) levels are reasonable markers predicting NAFLD status. In a recent cross-sectional study employing nondiabetic subjects, ALT values rose steadily within a normal range early in the life cycle but begin decreasing steadily around age 65 years.
Objectives: Because of important nutritional implications, the association between ALT levels and aging in a significantly larger population of healthy volunteers was examined for corroborative purposes. A secondary goal was to gain further knowledge concerning mechanisms behind any age-related decline in ALT activity.
Methods: Baseline data from over 10,000 physician-approved, nondiabetic subjects (age 21–84 years) of both genders who had volunteered for previous clinical investigations were assessed.
Results: In this cross-sectional examination, the line of best fit (weighted) for average yearly circulating ALT levels displayed an upward surge from ages 21 to 64 years with a discernible steady downward decline around 65 years—mimicking earlier results. Examining linear lines of correlation in the younger and older age groups, the following calculations were determined: a significant positive slope for 21 to 64 years, r = 0.42, n = 44, p < 0.005, and a trending negative slope for 65 and beyond, r = −0.43, n = 20, p < 0.057. Using this same datum base, the correlations between age and fasting blood glucose (FBG) mimicked the ALT results by once more showing a similar upward rise in the younger and a steady decline the older group of volunteers.
Conclusions: A paradoxical downward age-related (≥ 65 years) decline of circulating ALT coinciding with a comparable steady decrease in FBG levels was replicated in a larger population of volunteers. The close association of these two chemistries along with other findings suggest that altered glucose-insulin metabolism may participate via “survivor bias” in the ubiquitously found age-related decline of serum ALT—suggesting that nutritional measures could advance optimal health over the life-span.
Introduction
The precise explanation for the growing incidence of nonalcoholic fatty liver disease (NAFLD), omnipresent throughout the world, remains uncertain but appears to be nutritionally and metabolically related (Citation1,Citation2). Its diagnosis is principally based upon finding excess hepatic fat accumulation through imaging procedures, ultrasonography, and/or biopsy; confirming a lack of excess alcohol intake; and discovering raised circulating aminotransferases levels—more so alanine aminotransferase (ALT) rather than aspartate aminotransferase (AST) (Citation1–4). Many believe that circulating ALT levels provide valid means to follow the progress of NAFLD (Citation5–9). Finding elevated ALT values in the presence of various disturbances linked to the metabolic syndrome (MS) in an individual of standard bodily proportions or even possessing excess fat, the case here, suggests the presence of NAFLD over alcoholic disease (Citation2,Citation6). Because of its close association with insulin resistance (IR), MS, many cardiovascular disorders, as well as certain aspects of hepatic dysfunction, circulating ALT has also been considered a reasonable surrogate for NAFLD (Citation5–9).
In a recent cross-sectional investigation centering on relatively healthy, nondiabetic subjects, circulating ALT showed significantly decreasing levels with advancing age (65–84 years) after displaying a significant positive trend at a younger yearly range (21–64 years) (Citation10). Unlike this paradox with circulating ALT, levels of AST even in the elderly appeared to gradually increase or at least level off and not decrease at the highest observed life-span (Citation2,Citation10). This age-related conundrum in serum ALT measurements has been mentioned previously via many investigators who had included the most elderly in their studies (Citation11–15). However, the latter findings never mentioned the consistent yearly regression in values with aging or the numerous additional age-related declines in other metabolic parameters.
At first glance, initial findings using ALT as the independent variable suggested that NAFLD actually improves with aging—a concept that clashes with reason (Citation1,Citation2). Because of important implications behind the “ALT aging paradox,” additional data were gathered from a much larger population of subjects for duplicative and replicative purposes. They further emphasized the strong linkage of hepatic fat accumulation with other elements of MS, especially the close association with IR, a perturbation commonly dietary induced (Citation10,Citation13,Citation16). Suffice it to say, the new, expanded findings corroborate the earlier observations and add further knowledge concerning the basis for the age-related decline in circulating ALT levels (Citation5,Citation10–15).
Material and methods
Correlation data
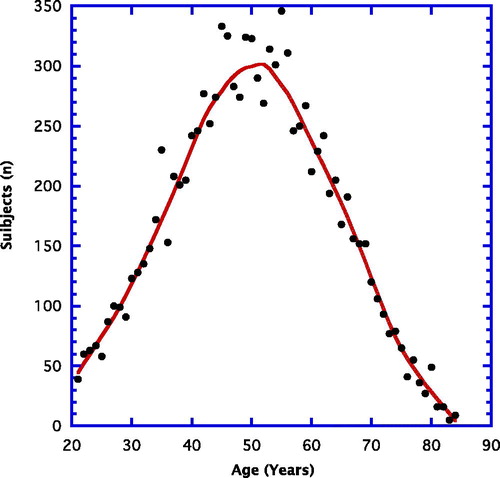
Data for this cross-sectional assessment were obtained from baseline materials gathered from a number of prior clinical investigations carried out by the research group Integrative Health Technologies (San Antonio, Texas) between 1985 and 2017. The selected subjects had volunteered to participate in a variety of clinical investigations. Data were gathered from more than 10,000 volunteers. reveals the number of volunteers (n) for each chronological year of age. The peak ages for participation fell somewhere between 40 and 60 years. There were more than 9,000 volunteers younger than 65 years and more than 1,500 at and older than that age. Roughly 75% were female.
Figure 1. Weighted line for number of volunteers (n) at each year of age (21–84 years).
In the present evaluation, activities of the enzymes ALT and AST and other clinical chemistries such as fasting blood glucose (FBG) were correlated with chronological age in two ways: yearly group averages and individually. Every year of age was composed of subjects possessing average circulating glucose levels that were within the so-called nondiabetic range (highest average group fasting glucose = 103 mg/dl). In addition, all average values for the aminotransferases (ALT, AST) in the remaining groups fell well within an established normal range (< 40 U/L).
General study procedures
To be eligible for the present assessments, the volunteer subjects previously provided written informed consent that was in compliance with the Helsinki Declaration and approved by an ethics committee of Integrative Health Technologies or an independent institutional review board. After appraising the study with a research coordinator, the subjects received a copy of the informed consent. Each subject was requested to review the protocol with a personal physician to determine whether there were any medical conditions that would disqualify participation. After an overnight fast, most subjects completed an initial test battery that could include the following: total-body dual energy x-ray absorptiometry (DEXA) measures of body composition, blood pressure and resting heart-rate, and/or a 43-blood chemistry and circulating blood cell test panel. Blood chemistries were evaluated at a Lab Corps Service Center chosen by each subject (http://www.labcorp.com).
Body composition
DEXA measurements were made using a steady potential energy source at 78 kVp and a K-edge filter (cerium) to achieve a congruent, dual-energy beam with effective energies of 40 and 70 keV.
Blood pressure
Blood pressure measurements were carried out with subjects lying in a prone position on the scanning table for 15–20 minutes during the DEXA measurement. Several subjects reported sleeping throughout the latter procedure. Post-scan blood pressures were usually lower than pre-scan and seated pressures.
Blood chemistries
Following an overnight fast, venous blood samples were drawn at the chosen local facility. After red blood cell removal in some cases, cooled samples were shipped to a central laboratory for blood chemistries. Analyses of chemistries, including ALT, AST, and FBG were performed by routine clinical procedures.
Statistical analyses
Averages, standard deviations, and counts with age as the independent variable and correlations were calculated in Microsoft Excel 2016 with pivot tables and formulas, respectively. Linear regression statistical analyses and weighted lines in the figures were carried out by KaleidaGraph graphing and datum analysis (version 3.6, Synergy Software). A p < 0.05 (two-tailed) determined by using a table of correlation coefficients (r values) was considered to be statistically significant and a p < 0.10 > 0.05 was designated as a trend (Pearson correlation analysis).
Results
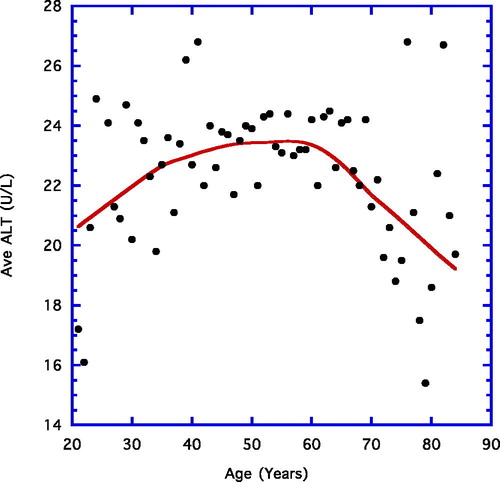
depicts the average ALT reading for each year of age between 21 and 84 years. A weighted line is shown. There is a small but steady increase from near 20 U/L to roughly 23 U/L in the younger age grouping (21–64 years), whereas from ages 65 to 84 years the final values decline gradually to approximately 19 U/L.
Figure 2. Age vs. average ALT for the given year (21–84 years). A weighted line is shown.
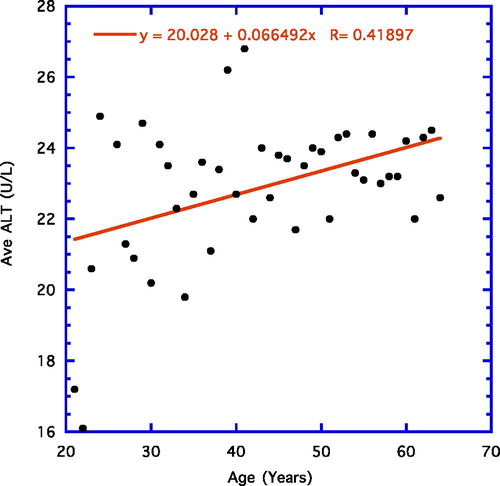
focuses on yearly average ALT levels from ages 21 years to 64 years and shows a significant linear correlation using average datum points for each year of age (r = 0.42, n = 44, p = 0.004).
Figure 3. Year of age vs. average group ALT for (21–64 years). Positive correlation is depicted.
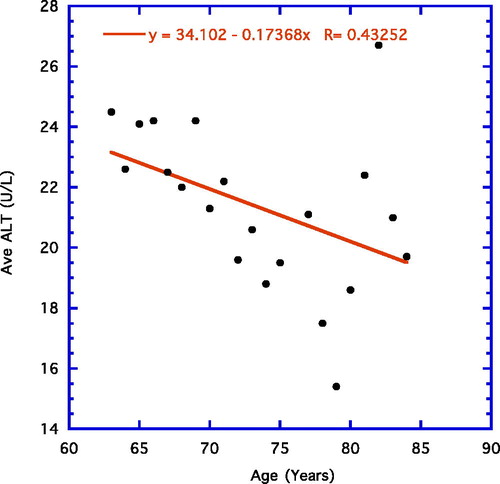
depicts the correlation for the older age group (65–84 years) that is negative and shows a trend (r = −0.43, n = 20, p = 0.059).
Figure 4. Year of age vs. average ALT (65–84 years). Negative correlation is depicted.
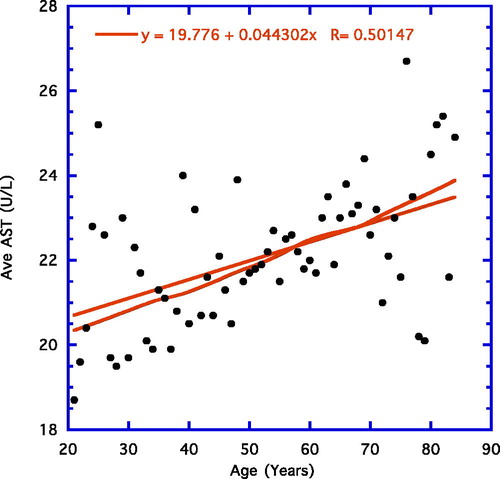
illustrates a weighted line for average values of AST readings from age groups 21 to 84 years. The weighted line is essentially straight over the entire age range. A linear line is also illustrated alongside the weighted line and its r value for average ages is shown in the figure (r = 0.43, n = 64, p = 0.003). For the younger age groups (21–64 years), there is a significant positive correlation (r = 0.50, n = 44, p = < 0.001). For the older age group (65–84 years), there is nonsignificant wide scattering of the points. These latter two examples are not shown as figures, nor are the results from examining individual genders—males and females. As to gender differences, the data from males and females individually are essentially no different and resemble the findings from the combined readings.
Figure 5. Year of age vs. average AST. Both weighted and linear correlation lines displayed.
To substantiate and strengthen conclusions, the ALT data were handled in another way: according to individuals rather than as above by average readings at the various ages (). In other words, we examined the linear correlations of each individual from the younger (21–64 years) and older age (65–84 years) groups. The following results were found: a positive trending slope for ages 21 to 64 years (r = 0.02, n = 9,196, p < 0.08) and a significant negative slope for 65 and beyond (r = −0.10, n = 1,613, p < 0.001).
Table 1. Correlation of aminotransferases (ALT, AST) at different ages of individual subjects.
For AST, ages 21 to 84, the line of best fit among individuals was essentially a straight line all the way (r = 0.05, n = 11,334, p < 0.001; ). Compared with the original correlations for AST, the outcomes were somewhat similar in the younger group that showed a significant positive correlation, but the older group displayed a nonsignificant wide scattering of points similar to the yearly average data depicted in .
shows the individual correlations between the aminotransferases (ALT, AST) and the younger and older age groupings to corroborate correlations obtained through group averages illustrated in .
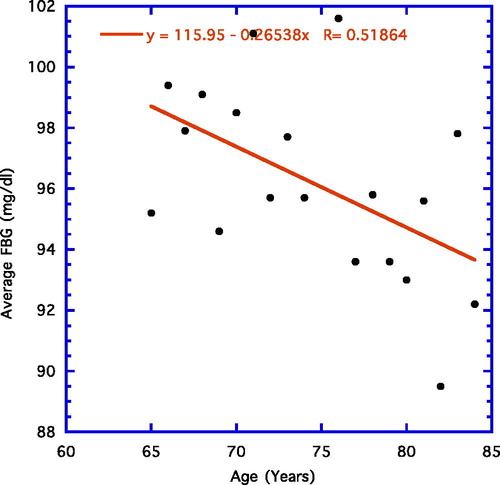
displays the results when the yearly average FBG is correlated with age using a weighted line. Similar to previous findings (Citation6), the early steady upward progression of FBG is eventually replaced by a downward one. The linear progression up to age 65 years proved significant (not shown; r = 0.89, n = 44, p < 0.001), whereas in , the significant linear negative correlation for ages 65–84 years is depicted (r = 0.52, n = 19, p = 0.02).
Figure 6. Year of age vs. average FBG. A weighted line is shown.
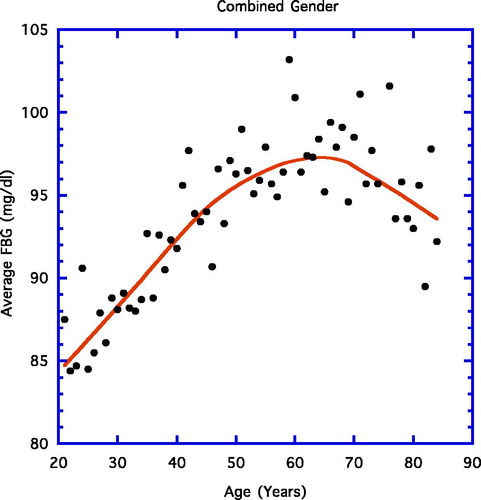
Figure 7. Year of age vs. FBG for older (64–84 years). A negative linear correlation is depicted.
reveals the linear regression lines (r) of many dependent metabolic variables for the overall (20–84 years), the younger (20–64 years), and the older (65–84 years) groups with chronological age being the independent variable. For comparative purposes, some data from previous figures and are included. As depicted in the figures earlier, both ALT () and FBG () demonstrate a clear positive rise with age in the younger group, but a significantly downward correlation in the older group. This pattern we refer to as the aging paradox is depicted in grey for distinction. Other parameters with the same age pattern, also depicted in grey, include fat mass, triglycerides, total cholesterol, and low-density lipoprotein cholesterol. Body weight (listed in bold) showed a downward trend in the younger but a profound negative correlation with age in the older volunteers. Systolic blood pressure (bold line) demonstrated a marked correlation upward and then a leveling off with wide scatter at later ages.
Table 2. Parameters showing aging paradox displayed in grey (age in years vs. dependent variable).
displays the correlations between FBG and the aminotransferases (ALT, AST) using data from individuals rather than groups. For ALT, all correlation lines were highly statistically significant. For AST, only correlations involving the combined ages or the younger age were significant—not the older age.
Table 3. Aminotransferases correlations with FBG at different ages of individual subjects.
Discussion
Background
The ubiquitous, potentially harmful liver disease recognized widely as NAFLD takes many forms—ranging from simple fat infiltration to fat infiltration plus resultant inflammatory perturbations with or without fibrosis (Citation1,Citation2). Although the figures are constantly changing, NAFLD is estimated to be present in some form in 20% to 33% of the United States population (Citation1,Citation2,Citation17) and as high as 15% to 39% in the rest of the world (Citation18,Citation19).
Numerous aspects of the precise pathogenesis are uncertain, however, IR and central fat accumulation, frequently associated with poor lifestyle choices in diet and exercise, appear to be key components in the pathophysiology (Citation1,Citation10,Citation13). Specifically, visceral fat accumulation favors eventual localization of this element to the liver (Citation1,Citation20–22). In addition to augmenting hepatic fat uptake due to the close proximity to the central fat deposits, the associated IR secondary to this phenomenon appears to alter pathways of uptake, synthesis, degradation, and secretion of free fatty acids ultimately favoring even more enhanced accrual of triglycerides in the hepatocytes creating a vicious unhealthful cycle (Citation1,Citation20). Since scores of investigators accept that IR is also the principal driving force behind MS (Citation22–24), it is not too surprising that hepatic fat infiltration has been connected to various aspects of the syndrome (Citation13, Citation25). As noted above and important not to forget, the pathological processes behind even seemingly benign NAFLD are not infrequently associated with the concomitant presence of multiple components of MS: obesity (47%–90%), diabetes mellitus (28%–55%), hyperlipidemia (4%–92%), and raised blood pressure—all especially harmful to the cardiovascular system (Citation9,Citation18–20,Citation23).
Because the disorder is mostly silent initially, it is often uncovered incidentally through the presence of accompanying elevated liver enzymes like ALT and to a lesser extent AST (Citation2,Citation3,Citation26,Citation27). Some believe that circulating ALT is the best means to follow progress of NAFLD (Citation5). Elevation of aminotransferases have been estimated to occur in 7.9% of the U.S. population and is unexplained in the majority (i.e., 69%) of those (Citation28). In both men and women early on, unexplained aminotransferase elevations are significantly associated with higher body mass index, waist circumference, triglycerides, and fasting insulin; lower high-density lipoprotein cholesterol; and type 2 diabetes and hypertension (Citation29). The usual biochemical pattern in NAFLD is increased levels of ALT exceeding those of AST. Thus, the ratio AST/ALT characteristically decreases below one in hepatic steatosis (Citation1,Citation22,Citation29). To add some confusion, appearance of fibrosis and cirrhosis are associated with a ratio > 1 (Citation26).
Regrettably, current laboratory handling of values not infrequently fail time and time again to convincingly identify the presence of clinically established NAFLD because measurements of aminotransferases (ALT, AST) as well as accompanying elements of the MS are often within their accepted normal limits (< 40 IU/L) (Citation22,Citation26,Citation30). Nevertheless, higher “normal” ALT levels, not so much AST levels, have been associated with greater risk for type 2 diabetes mellitus. Thus, imperative to note concerning the diagnosis of NAFLD, relatively high-normal ALT levels together with other clinical features of the MS should raise strong suspicion (Citation2,Citation22). Strengthening the latter suggestion, one study reported associated signs for MS increased in higher quintiles of the “normal” ALT range compared with lower quintiles (Citation4).
Along with studies of the high and low end of the normal range, checking various correlations can be helpful in gauging the presence of disturbances. Recent studies corroborate that higher levels of hepatic enzymes within the accepted limits of normality (continuum of risk) can reflect the early stages of NAFLD and/or MS (Citation9, Citation22). Each condition has the potential to amplify the other. IR is considered to be a major factor behind NAFLD as well as MS, and NAFLD is believed to play an important role in the development of IR (Citation4, Citation19). In any case, a harmful sequence may be established that must be reversed in order to obtain optimal health.
ALT aging paradox and other resembling aging paradoxes
Working with the current expanded datum base, many earlier findings have essentially been replicated; i.e., an age-associated ascent in ALT levels in the younger volunteers (age 21–64 years) precedes a gradual significant decline in the older age group (65–84 years; , ) (Citation10). In contrast, serum AST, for the most part, rises over the life-span, although this particular enzyme may level off to some extent in the older volunteers (, ).
The above findings described here are more readily acceptable having been analyzed in two different ways. The first way was to correlate the averages of the independent variable from groups established by chronological age with age itself ( and ) and the second, to correlate separately each individual value from subjects in the younger (21–64 year age range) and the older (65–84 year age range) with age ( and ). The close resemblance of results emanating from the two different procedures strengthens the overall conclusions.
From our earlier report, an issue arose whether the then found decreases in ALT in the elderly were by chance because of the small numbers of participants—data from approximately 300 subjects or fewer (Citation6). Therefore, the present close replication of results in the text, figures, and tables emanating from more than 10,000 subjects clearly refutes the “by chance” assumption. In further support, many others have also reported decreasing levels of circulating ALT in the very elderly (Citation10,Citation12–15). These additional papers generally refer to smaller number of subjects, do not concentrate on specific data for the younger age groups (21–64 years), actually do not reveal findings from individual years of age, and do not extensively examine the aging paradox for other elements of MS.
Concentrating on the last point, it is important to note that circulating ALT is not the only paradoxical aging health factor, even though the majority of papers dealing with the ALT aging paradox generally ignore the presence of similar happenings with other health parameters (Citation8–11). For example, FBG levels are particularly illuminating in this regard ( and , ) (Citation10). Further, in present and past datum sets, body weight and body fat decline markedly in a similar fashion in the elderly past age 65 years () (Citation10). In addition, total cholesterol, low-density lipoprotein cholesterol, and triglycerides follow the age-related paradoxical pattern of ALT in that they increase steadily over the younger ages but decline past age 65 years () (Citation10). Could the ALT paradox be driven by one of the other paradoxical phenomena with a metabolic basis, e.g., the FBG paradox?
FBG correlates as strongly with ALT in the older compared to the younger age groups, just as responsive (). Thus, we surmise that had the FBG levels not been in decline in the older group the ALT levels would not have either (). Many additional possibilities behind the lowering of ALT levels in the elderly () have already been proposed. These include liver shrinkage and fibrosis formation. Nevertheless, the data concerning the occurrence of parallel aging paradoxes in a variety of metabolic factors shown in provide a new direction to solve the background pathophysiology. Factors outside the liver may be involved.
Beyond the FBG and ALT link
With the existence of the aging ALT paradox illustrated in and associated with other metabolic paradoxes, especially FBG levels indicating the status of IR ( and and ), two broader possibilities behind the ALT aging paradox come to light: (1) that the volunteers used here experienced improved hepatic health in respect to NAFLD and MS with advancing older age (≥ 65 years) and/or (2) “survivor bias” is present, i.e., over the maturing years those with the higher ALT levels connoting more severe status of fatty liver infiltration and cardiovascular risk factors have died or perhaps are too disabled to volunteer for clinical studies, leaving available only the subjects possessing the “lower, more healthful” ALT levels. Important to note is that these two concepts are not mutually exclusive—they depend on when the primary driving force, metabolic factors, become significantly effective.
The first concept proposes that improved lifestyle (diet and/or exercise) around age 65 years favorably affects IR and associated elements of MS (Citation13,Citation19,Citation29). While it would be difficult to concede that a noteworthy portion of elderly institute a healthful exercise program late in life, many are inclined to eat less and thus consume fewer calories. Thus, the liver could sustain less abuse and perhaps even shrink, with resultant lowering of ALT. In addition, less caloric consumption brings about enhanced insulin sensitivity and lower FBG (Citation10,Citation31–34). We have been well aware that type 2 diabetes is a form of premature aging with a shortened life-span and that an adjustment to a better lifestyle could be beneficial (Citation31,Citation32,Citation35–38).
Concerning the second concept of survivor bias, we have long championed the possibility that even a slight increase in IR over the years can take its toll on aging and shorten life-span (Citation31,Citation32,Citation34). In a positive vein, the lower IR and circulating insulin levels even in a nondiabetic population linked to lessened cardiovascular risk development would slow aging over time and increase life-span (). Both theories are not mutually exclusive, but a laboratory study using rats may favor one postulate over the other.
An example favoring “survivor bias” can be made from a previous well-controlled animal study (Citation34). Caloric restriction, known to enhance insulin sensitivity, provides an excellent model to extend life-span (Citation39). Masoro et al. examined the effects of caloric restriction on mean circulating 24-hour glucose levels () (Citation34). Twenty-one control ad libitum-eating and 21 caloric-restricted rats were examined. For the first 19 months, the mean 24-hour glucose concentration ranged from 17 to 21 mg/dl higher in the ad libitum compared to the caloric-restricted male F344 rats. Near the two-year mark, six ad libitum and two caloric-restricted rats had died, but still the mean 24-hour glucose levels of the latter was 13 mg/dl lower. By 27–31 months, only 13 caloric-restricted rats had survived, and the mean glucose levels were still markedly lower than those of any of the preceding levels of the ad libitum fed rodents.
Table 4. Mean 24-hour plasma glucose concentration (mg/dl).
The above data () were used in order to illustrate “survival bias” in a well-controlled, longitudinal rodent model where changes in diet and exercise in later life would not be influential. The combined mean 24-hour glucose levels of 21 ad libitum fed and 21 caloric-restricted rats at 3–7 months of age averaged approximately 128 mg/dl (). The averages in the 42 rats rose roughly to 137 and 140 mg/dl after 9 to 13 and 15 to 19 months, respectively. By 21 to 25 months, 8 rats had died and the average mean 24-hour glucose level of the survivors was around 141 mg/dl. By 27 to 31 months, all the control ad libitum fed rats had died (n = 21), as had eight of the caloric-restricted. The remaining 13 caloric-restricted rats had an average glucose level of 127 mg/dl.
Figure 8. Example of survivor bias. Average mean 24-hour glucose levels over the combined life-span of ad libitum fed and caloric-restricted male F344 rats. Figures in parentheses indicate number of rats surviving at that point. Data derived from Masoro EJ, McCarter RJM, Katz MS, McMahan CA: Dietary restriction alters characteristics of glucose fuel use. J Gerontology. 47:B202–B208, 1992.
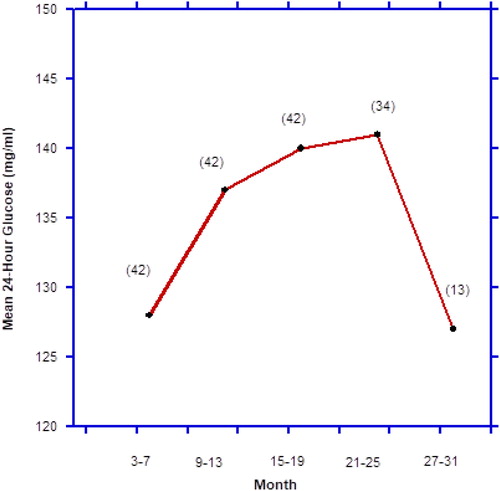
Accordingly, depicting combined data from ad libitum fed (relatively poorer health) and caloric-restricted (relatively better health) rats resembled the paradoxes shown in and . is an example of “survivor bias,” because the decrease in mean glucose levels at the end were due to the extinction via death of the ad libitum fed control rats, leaving only the caloric-restricted rats with the lowest mean glucose levels behind. The fact that the caloric-restricted rats possessed circulating insulin levels only half as much as the ad libitum fed ones also indicates a lower state of IR among the long-term survivors (Citation34).
In summary, we believe the aging paradox, i.e., the initial ascent in ALT activity followed by the gradual decline toward the culmination of life-span, may provide an important clue toward a concept long favored by us: Even slight perturbations in glucose–insulin metabolism such as augmented IR and hyperinsulinemia represented by the higher ALT and FBG readings can over time hasten onset of and worsen the aging process and it related disorders (Citation32,Citation33). The existence of this and the various other “age paradoxes” suggest that maintaining good insulin sensitivity early in life estimated by relatively low FBG values could lead to a longer, healthier life-span for many (Citation40). That insulin sensitivity is important for expanding life-span is corroborated in another rat study where chromium, an insulin sensitizer, did such (Citation41).
Disclosure statement
No potential conflict of interest was reported by the authors.
| Abbreviations | ||
| ALT | = | alanine aminotransferase |
| AST | = | aspartate aminotransferase |
| FBG | = | fasting blood glucose |
| IR | = | insulin resistance |
| MS | = | metabolic syndrome |
| NAFLD | = | nonalcoholic fatty liver disease |
References
- Carey E, Wieckowska A, Carey WD. Nonalcoholic fatty liver disease. Cleveland Clinic. Available from: http://www.clevelandclinicmeded/medicalpubs/diseasemanagement/hepatology/nonalcoholic-fatty-liver-disease/.
- Sattar N, Forrest E, Preiss D. Non-alcoholic fatty liver disease. BMJ. 2014;349(15):g4596. doi: 10.1136/bmj.g4596.
- Adams LA, Waters OR, Knuiman MW, Elliott RR, Olynyk JK. NAFLD as a risk factor for the development of diabetes and the metabolic syndrome: an eleven-year follow-up study. Am J Gastroenterol. 2009;104(4):861–867. doi: 10.1038/ajg.2009.67.
- Lonardo A, Ballestri S, Marchesini G, Angulo P, Loria P. Nonalcoholic fatty liver disease: a precursor of the metabolic syndrome. Dig Liver Dis. 2015;47(3):181–190. doi: 10.1016/j.dld.2014.09.020.
- Wang Z, Xu M, Peng J, Jiang L, Hu Z, Wang H, Zhou S, Zhou R, Hultström M, Lai EY. Prevalence and associated metabolic factors of fatty liver disease in the elderly. Exp Gerontol. 2013;48(8):705–709. doi: 10.1016/j.exger.2013.05.059.
- Kojima H, Sakurai S, Uemura M, Takekawa T, Morimoto H, Tamagawa Y, Fukui H. Difference and similarity between non-alcoholic steatohepatitis and alcoholic liver disease. Alcohol Clin Exp Res. 2005;29(Suppl 12):259s–263s. doi: 10.1097/01.alc.0000191776.37626.30.
- Schindhelm RK, Diamant M, Dekker JM, Tushuizen ME, Teerlink T, Heine RJ. Alanine aminotransferase as a marker of non-alcoholic fatty liver disease in relation to type 2 diabetes mellitus and cardiovascular disease. Diabetes Metab Res Rev. 2006;22(6):437–443. doi: 10.1002/dmrr.666.
- Chen CW, Chen LY, Dai HL, Chen J-H, Fang LZ. Relationship between alanine aminotransferase levels and metabolic syndrome in nonalcoholic fatty liver disease. J Zhejiang Univ Sci B. 2008;9(8):616–622. doi: 10.1631/jzus.B0720016.
- Porter SA, Pedley A, Massaro JM, Vasan RS, Hoffmann U, Fox CS. Aminotransferase levels are associated with cardiometabolic risk above and beyond visceral fat and insulin resistance: the Framingham Heart Study. Arterioscler Thromb Vasc Biol. 2013;33(1):139–146. doi: 10.1161/ATVBAHA.112.300075.
- Preuss HG, Mrvichin N, Clouatre D, Bagchi D, Preuss JM, Perricone NV, Swaroop A, Kaats GR. General lack of correlations between individual age and signs of the metabolic syndrome in those with non-diabetic fasting glucose levels. J Am Coll Nutr. 2017;36(7):556–564. doi: 10.1080/07315724.2017.1322545.
- Bertolotti M, Lonardo A, Mussi C, Baldelli E, Pelligrini E, Ballestri S, Romagnoli D, Loria P. Nonalcoholic fatty liver disease and aging: epidemiology to management. WJG. 2014;20(39):14185–14204. doi: 10.3748/wjg.v20.i39.14185.
- Frith J, Day CP, Henderson E, Burt AD, Newton JL. Non-alcoholic fatty liver disease in older people. Gerontology. 2009;55(6):607–613. doi: 10.1159/000235677.
- Koehler EM, Schouten JN, Hansen BE, van Rooij FJ, Hofman A, Stricker BH, Janssen HL. Prevalence and risk factors of non-alcoholic fatty liver disease in the elderly: results from the Rotterdam study. J Hepatol. 2012;57(6):1305–1311. doi: 10.1016/j.jhep.2012.07.028.
- Dong MH, Bettencourt MS, Brenner DA, Barrett-Connor E, Loomba R. Serum levels of alanine aminotransferase decrease with age in longitudinal analysis. Clin Gastroenterol Hepatol. 2012;10(3):285–290. doi: 10.1016/j.cgh.2011.10.014.
- Le Couteur DG, Blyth FM, Creasey HM, Handelsman DJ, Naganathan V, Sambrook PN, Seibel MJ, Waite LM, Cumming RG. The association of alanine transaminase with aging, frailty, and mortality. J Gerontol A Biol Sci Med Sci. 2010;65(7):712–717. doi: 10.1093/gerona/glq082.
- Targher B, Byrne CD. Clinical Review: Non-alcoholic fatty liver disease: a novel cardiovascular risk disease for T2DM and its complications. J Endocrinol Metab. 2013;98(2):483–495.
- Shyangdan D, Clar C, Ghouri N, Henderson R, Gurung T, Preiss D, Sattar N, Fraser A, Waugh N. Insulin sensitizers in the treatment of non-alcoholic fatty liver disease: a systematic review. Health Technol Assess. 2011;15:1–110.
- Kwon C, Day CP, Trenell MI. Lifestyle interventions for the treatment of non-alcoholic fatty liver disease in adults: a systematic review. J Hepatol. 2012;56:255–266. doi: 10.1016/j.jhep.2011.06.010.
- Wainwright P, Byrne CD. Bidirectional relationships and disconnects between NAFLD and features of the metabolic syndrome. Int J Mol Sci. 2016;17(3):367doi:103390/ijms17030367.
- Appel SJ, Harrell JS, Davenport ML. Central obesity, the metabolic syndrome, and plasminogen activator inhibitor-1 in young adults. J Am Acad Nurse Pract. 2005;17(12):535–541. doi: 10.1111/j.1745-7599.2005.00083.x.
- Petersen KF, Dufour S, Feng J, Befroy D, Dziura J, Dalla Man C, Cobelli C, Shulman GI. Increased prevalence of insulin resistance and nonalcoholic fatty liver disease in Asian-Indian men. Proc Natl Acad Sci USA. 2006;103(48):18273–18274. doi: 10.1073/pnas.0608537103.
- Preuss HG, Kaats GR, Mrvichin N, Swaroop A, Bagchi D, Clouatre D, Preuss JM. Examining the relationship between nonalcoholic fatty liver disease and the metabolic syndrome in nondiabetic subjects. J Am Coll Nutr. 2018;37(6):457–465. [Epub ahead of print] PMID:29652564. doi: 10.1080/07315724.2018.1443292.
- Hamaguchi M, Takeda N, Kojima T, Ohbora A, Kato T, Fukui M, Nagata C, Takeda J. Identification of individuals with non-alcoholic fatty liver disease by the diagnostic criteria for the metabolic syndrome. WJG. 2012;18(13):1508–1519. doi: 10.3748/wjg.v18.i13.1508.
- Sanya D, Mukherjee P, Raychaudhun M, Ghosh S, Mukherjee S, Chowdury S. Profile of liver enzymes in non-alcoholic fatty liver disease in patients with impaired glucose tolerance and newly detected untreated type 2 diabetes. Ind J Endocr Metab. 2015;19:597–601. doi: 10.4103/2230-8210.163172.
- Preuss HG, Mrvichin N, Bagchi D, Preuss J, Perricone N, Kaats GR. Fasting circulating glucose levels in the non-diabetic range correlate appropriately with many components of the metabolic syndrome. The Orig Intern. 2016;23:78–89.
- Ioannou GN, Boyko EJ, Lee SP. The prevalence and predictors of elevated serum aminotransferase activity in the United States in 1999-2002. Am J Gastroenterol. 2006;101(1):76–82.
- Ioannou GN, Weiss NS, Boyko EJ, Mozaffarian D, Lee SP. Elevated serum alanine aminotransferase activity and calculated risk of coronary heart disease in the United States. Hepatol. 2006;43(5):1145–1151. doi: 10.1002/hep.21171.
- Clark JM, Brancati FL, Diehl AM. The prevalence and etiology of elevated aminotransferase levels in the United States. Am J Gastroenterol. 2003;98(5):960–967. doi: 10.1111/j.1572-0241.2003.07486.x.
- Mofrad P, Contos MJ, Haque M, Sargeant C, Fisher RA, Luketic VA, Sterling RK, Shiffman MI, Stravitz RT, Sanyal AJ. Clinical and histologic spectrum of nonalcoholic fatty liver disease associated with normal ALT values. Hepatology. 2003;37(6):1286–1292.
- Xia MF, Yan HM, Lin HD, Bian H, Pan BS, Yao XZ, Li RK, Zeng MS, Gao X. Elevation of liver enzymes within the normal limits and metabolic syndrome. Clin Exp Pharmacol Physiol. 2011;38(6):373–379. doi: 10.1111/j.1440-1681.2011.05519.x.
- Preuss HG, Bagchi D, Clouatre D. Insulin resistance: a factor of aging. In: Ghen MJ, Corso N, Joiner-Bey H, Klatz R, Dratz A, editors. The advanced guide to longevity medicine, Ghen. Landrum SC; 2001. p. 239–250
- Preuss HG. Effects of glucose/insulin perturbations on aging and chronic disorders of aging: the evidence. J Am Coll Nutr. 1997;16(5):397–403.
- Reaven GR, Reaven EP. Prevention of age-related hypertriglyceridemia by caloric restriction and exercise training rats. Metabolism. 1981;30(10):982–986. doi: 10.1016/0026-0495(81)90096-2.
- Masoro EJ, McCarter RJM, Katz MS, McMahan CA. Dietary restriction alters characteristics of glucose fuel use. J Gerontology. 1992;47(6):B202–B208. doi: 10.1093/geronj/47.6.B202.
- Loukine L, Waters C, Choi BCK, Ellison J. Impact of diabetes mellitus on life expectancy in Canada. Population Health Metrics. 2012;10:7. http://www.pophealthmetrics.com/content/10/1/7
- Franco OH, Steyerberg EW, Hu FB, Mackenbach J, Nusselder W. Associations of diabetes mellitus with total life expectancy and life expectancy with and without cardiovascular disease. Arch Intern Med. 2007;167(11):1145–1151. doi: 10.1001/archinte.167.11.1145.
- Gu K, Cowie CC, Harris MI. Mortality in adults with and without diabetes in a national cohort of the U.S. population, 1971-1993. Diabetes Care. 1998;21(7):1138–1145.
- Paolisso G, Barbieri M, Rizzo MR, Carella C, Rotondi M, Bonafe M, Franceschi C, Rose G, De Benedictis G. Low insulin resistance and preserved beta-cell function contribute to human longevity but are not associated with TH-INS genes. Exp Gerontol. 2001;37(1):149–156. doi: 10.1016/S0531-5565(01)00148-6.
- Weindruch R, Walford R. The retardation of aging and disease by dietary restriction. Springfield IL: Charles C. Thomas; 1988.
- Preuss HG, Mrvichin N, Bagchi D, Preuss J, Perricone N, Kaats GR. Importance of fasting blood glucose in screening/tracking over-all health. Orig Intern. 2016;23:13–20.
- Preuss HG, Echard B, Clouatre D, Bagchi D, Perricone NV. Niacin-bound chromium increases life span in Zucker Fatty Rats. J Inorg Biochem. 2011;105(10):1344–1349. doi: 10.1016/j.jinorgbio.2011.01.005.