
Abstract
Objective: Our aims were to compare the vitamin D status of children with and without cancer and to examine the possible correlation between vitamin D levels in children with cancer before initiating treatment and prognosis.
Method: We compared the data of 173 children with cancer with those of 569 children without cancer.
Results: We measured a significant difference (p = 1.34E–08) between the vitamin D levels of children with cancer before treatment and children without cancer. There was a significant correlation between the initial vitamin D levels of children with cancer and the prognosis (p = 0.016, odds ratio = 51.33) at 5% significance.
Conclusions: The average vitamin D level was 19.76% lower in the population with cancer compared with the average of the control group, and we found a correlation between the lower vitamin D levels in children with cancer and the adverse prognosis. We suggest that supplying vitamin D is reasonable and a prospective study of vitamin D in pediatric patients with cancer is recommended.
Introduction
Over the past 15 years, more than 90,000 cohort studies about the correlation between vitamin D deficiency and cancer were published. Based on the findings about the correlation between malignity and vitamin D deficiency in adults, vitamin D supplementation for healthy adults and in cases of subclinical deficiency was recommended (Citation1–3). The correlation between initially lower vitamin D levels and worse prognosis was also described in cohort studies (Citation4). Hence, we assume that the normalization of vitamin D levels, along with the treatment of cancer, increases the survival rate (Citation1,Citation3,Citation5,Citation6). The normal vitamin D level is defined as the value that does not provoke the compensatory increase of parathormone (PTH) levels, specified as 30 ng/ml (75 nmol/l). A value below this level indicates subclinical vitamin D deficiency that is not necessarily manifested in musculoskeletal disorders but increases the probability of cardiovascular diseases, diabetes mellitus, autoimmune conditions, and tumors. According to the published data, 75% of the adult population worldwide experience vitamin D deficiency, of whom 13% fall under the category of extremely severe vitamin D deficiency (<10 ng/ml) (Citation7). In Hungary, almost three-quarters of the population have a low vitamin D status (Citation8); such a trend shows an increasing tendency along the geographical latitudes toward the North. This case is caused by low ultraviolet type B (UVB) exposure that is associated not only with the geographical location (which determines the angle of the sun’s rays and the length of daylight hours) but also with the indoor lifestyle and the use of sunscreen products to prevent melanoma (which characterize developed societies) (Citation9). The situation is aggravated by insufficient vitamin D and high phosphate intake. Individual vitamin D levels are also influenced by the genetic polymorphism of enzymes and proteins that play roles in the metabolism of vitamin D (Citation10). With the knowledge of data on adult patients, we conducted an introductory research on childhood malignancy in the form of a retrospective study. Our aim was to survey the vitamin D status of populations of children with and without cancer to determine whether there would be a relevant, significant difference. Furthermore, we studied the effects of vitamin D supplementation (as a complement to cancer treatment) on the vitamin D levels of children and the correlation of initial and normalized vitamin D levels with the prognosis.
Methods
Patients
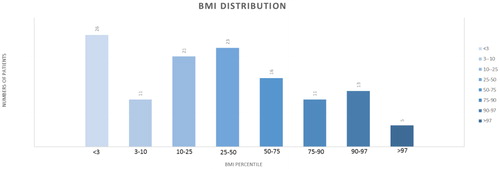
Our patient group comprised 173 children, aged 0 to 18 (mean age: 6.04 years) who were treated for cancer at the Semmelweis University (SE), 2nd Department of Pediatrics (Oncology Center in Hungarian Pediatric Oncology Network) of between January 1, 2009, and December 1, 2013. The examined group included 96 male (55.5%) and 77 female (44.5%) patients. We had and processed data of the body mass index (BMI) in 130 cases out of 173. Performing age- and gender-specific comparisons with a healthy average population by using the Hungarian BMI percentile table, we have found that 20% of our cancer patients were less than 3 percentile due tot he reason of rapidly growing cancer. Cancer cachexia is a wasting syndrome characterized by weight loss, anorexia, asthenia and anemia. The rest of the group corresponded to normal Gaussian distribution (). The cancer patients’ group contains 46 neuroblastoma (26.6%), 2 medulloblastoma (13.9%), 21 Ewing-sarcoma (12.1%), and 10 ganglioneuroma (5.8%) cases. The rest of the malignancies represented fewer than 10 patients. These tumors are 8 nephroblastoma (4.6%), 6 retinoblastoma (3.5%), 5 astrocytoma (2.9%), 5 ependymoma (2.9%), 5 glioblastoma (2.9%), 5 papillary thyroid carcinoma (2.9%), 4 atypical teratoid rhabdoid tumor (2.3%), 4 hepatoblastoma (2.3%), 4 teratoma (2.3%), 4 primtive neuroectodermal tumor (PNET) (2.3%), 4 teratoma (2.3%), 2 hemangioma (1.1%), 2 adrenal cortex carcinoma (1.1%), 2 histiocytosis (1.1%), 2 optic glioma (1.1%), 1 other brainstem tumor (0.5%), 1 AML (0.5%), 1 choroid plexus carcinoma (0.5%), 1 corpus pineal tumor (0.5%), 1 desmoplastic carcinoma (0.5%), 1 other endocrine tumor (0.5%), 1 testicular tumor (0.5%), 1 juvenile granulosa cell tumor (0.5%), 1 medullar thyroid carcinoma (0.5%), 1 myofibroma (0.5%), 1 pineoblastoma (0.5%), 1 plexus papilloma carcinoma (0.5%), 1 rhabdoid renal tumor (0.5%), and 1 sinus ethmoidalis tumor (0.5%). Patients received identical oncology treatment determined by the Hungarian National Protocols for the same pathological diagnosis; therefore, all diagnoses had been proved by histopathology.
Figure 1. Each different shade of blue column illustrates the number of patients (written on the top) in the certain percentile range (n(< 3 pc): 26, n(3–10 pc): 11, n(10–25 pc): 21, n(25–50 pc): 23, n(50–75 pc): 16, n(75–90 pc): 11, n(90–97 pc): 13, n(> 97 pc): 5).
The first sampling was done before the initiation of oncological treatment and parallel vitamin D supplementation. Regarding the Hungarian National Protocols, all cancer patients received vitamin D supplementation from the beginning of the treatment. Since it is known that with regular intake serum vitamin D level reaches a plateau in 4 to 6 weeks (Citation11), the second sampling took place after this time period. The core data on the children were provided by the Hungarian National Childhood Cancer Registry and the MedSolution system of the clinic. The full anonymity of the children was kept.
The control group consisted of 569 children, aged 0 to 4 (mean age: 1.96 years) who received treatment at the clinic for reasons other than cancer. Their data were collected between October 10, 2013, and September 29, 2014. The control group included 310 male (54.5%) and 259 female (45.5%) patients. Since an average Hungarian healthy population was used as a control group, BMI was considered normal Gaussian distribution. We accessed the list of children, together with their measured vitamin D levels, through the Department of Laboratory Medicine of SE. From the large data set (n = 694), we eliminated the data of those children who had manifest vitamin D deficiency and/or calcium-related metabolic disorders for they had been essentially receiving vitamin D supplementation. We could not exclude the possibility that similar to the children assigned to the control group, there might have been children in the group of patients with cancer who also might have taken vitamin D supplements. However, such scattered, random cases did not lead to distorted results since we found no difference between the two groups that we compared. In other words, all of the children had belonged to the same population before their admission and diagnosis; no one’s vitamin D status was known beforehand. They only formed two subpopulations when the diagnosis was provided and/or after initiating treatment—those of children with and without cancer in the larger population with mixed vitamin D levels.
Methodology
The Department of Laboratory Medicine of SE calculated the 25-(OH)-D3 vitamin levels from the serum samples by using immunoanalytical methods and electrochemiluminescens immunoassay (ECLIA). The laboratory used the Cobas 601 kit (marketed by the Swiss manufacturer Roche) and the Liaison kit (product of the Italian company DiaSorin). The PTH levels were measured with the Cobas 601 kit.
We used Microsoft Excel 2013 for statistical calculations. The serum vitamin D level shows a normal distribution in the nature. Using a cumulative distribution function, we checked whether our samples also satisfied the criteria of normal distribution. Since the samples of our control group satisfied these criteria, we compared and contrasted the vitamin D values of the group of patients with cancer and the control group with a two-sample T test at 5% significance. To measure the effectivity of vitamin D supplementation, we used the parametric paired T test, also at 5% significance.
We used Pearson’s chi-squared test to evaluate the correlation between the difference of the initial vitamin D levels and normalized values (with supplementation) and the prognosis. We also calculated the odds ratios (ORs).
We calculated Pearson’s correlation coefficient to study the inverse relationship between serum PTH and vitamin D levels.
Results
Our primary goal was to compare the vitamin D status of children with tumors with those of children without tumors. In each case, we defined the level of significance at 5% (to be interpreted the same way in every examination).
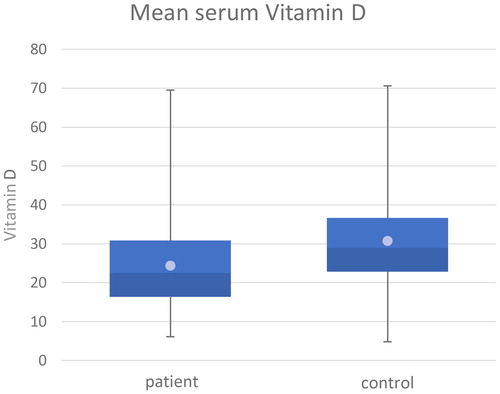
In the first step of this process, we compared the mean values of the initial serum vitamin D data of the patient group and the control group, which are shown in the box diagram (). The mean value of the control group was 30.15 ng/ml (SD = ± 12.04), while the patient group had a mean value of only 24.19 ng/ml (SD = ± 11.00). These mean values are represented by the bright points in ; deviation values and the median value of the data (median(control) = 29.00, median(patient) = 22.50) are presented traditionally, according to the methods of box plots. The calculated mean serum vitamin D level of children with cancer was 19.76% lower compared with the control population.
Figure 2. Darker blue: number of patients with serum vitamin D level under the average level; lighter blue: number of patients with serum vitamin D level above the average level; bright point: mean values in each (patient and control) groups.
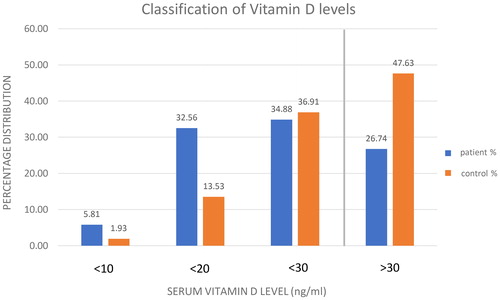
We arranged the measured vitamin D levels of the two examined groups into subcategories (). Based on current literature data, we generally accept that a serum vitamin D level of 20 to 29 ng/ml is considered insufficient, making vitamin D supplementation reasonable (this limit is indicated by a vertical line in ) (Citation12). In contrast, 10 to 19 ng/ml indicates deficiency (Citation13). Besides, we differentiate severe deficiency in cases when the vitamin D level is less than 10 ng/ml (Citation14,Citation15). We grouped and presented the vitamin D status of the patient and the control populations in the form of a bar chart according to these principles (). Hence, the proportions are shown in each category. The percentage values were calculated within the individual groups to present what percentage of the patient group and the control group belonged to a certain category. The fact that values above 30 ng/ml for children without cancer account for a much larger percentage is outstanding. In the case of our own samples, the percentages of insufficient values are nearly equal in the two groups, still within all of the subcategories under this value; therefore, in cases of deficiency and severe deficiency, the dominance of children with cancer is clear. These findings are consistent with the data reported in international literature (Citation16). In conclusion, we find that while 52.37% of the children in the control group require vitamin D supplements, the same is true for 73.26% of the children with cancer.
Figure 3. Blue column: number of children in the patient group. Numbers on the blue columns: the percentage of the patients with the certain vitamin D level in patient group (n(< 10 ng/ml): 10, n(< 20 ng/ml): 56, n(< 30 ng/ml): 60, n(> 30 ng/ml): 47). Orange: number of children in the control group. Numbers on the orange columns: the percentage of the children with the certain vitamin D level in control group (n(< 10 ng/ml): 11, n(< 20 ng/ml): 77, n(< 30 ng/ml): 210, n(> 30 ng/ml): 271). Vertical line: vitamin D supplementation reasonable under that (30 ng/ml) serum vitamin D level.
A cumulative distribution function was applied to analyze the normal distribution, which definitely proved that the parametric T test may be used in our study. Since the advanced F test had shown our samples’ equal variance (p(f) = 0.15), we used a two-sample T test with equal variance. The difference between the patient’s initial and the control groups’ vitamin D levels proved significant (p = 1.34E–08).
With the use of retrospective data, our study was extended to evaluate the possible correlation between vitamin D levels measured at the stages of diagnosis and prognosis. We grouped the five classes describing the prognosis of the disease into categories so that complete response (CR, n = 116), partial response (PR, n = 11), and stable disease (SDi, n = 15) were classified as favorable, while progressive disease (PD, n = 5) and exitus (EX, n = 26) were classified as unfavorable. Since these are categorical variables, Pearson’s chi-squared test was used for calculations. We transformed the continuous variable (the vitamin D value) into a categorical variable, according to the recommendation of the literature—above (n = 47) and below (n = 126) 30 ng/ml as normal and low levels, respectively. We found that vitamin D values measured at the initial and the prognosis stages were variables that depended on each other (χ2(1) = 5.84, p = 0.016 at 5% significance); furthermore, a high OR (51.33) showed that the probability of measuring an insufficient/deficient level rather than a normal value was 51.33 times higher in the unfavorable category. We present the distribution of initially measured vitamin D values () within certain prognostic classes in . Progressing toward groups with more favorable prognoses shows vitamin D levels shifting toward higher values.
Table 1. Number of patients in different serum vitamin D categories initially.
Table 2. Number of patients in different serum vitamin D categories showing responses to therapy.
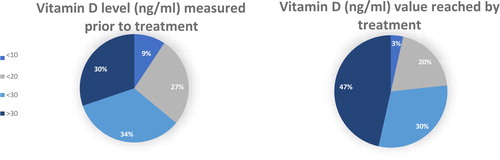
According to the current related literature, it is an accepted fact that with regular intake, the serum vitamin D level reaches a plateau phase after 4 to 6 weeks (Citation11). Therefore, when we examined the effectivity of 1,000 to 2,000 NE vitamin D supplement—administered in parallel with the oncological treatment at the clinic—we compared the initial vitamin D levels with the values measured after a minimum of 4 to 6 weeks, using a paired T test. The difference between early and late values was significant (p = 0.02); vitamin D supplementation in fact increased the serum vitamin D levels of children. The mean vitamin D value of 24.19 ng/ml before initiating the treatment increased to 27.92 ng/ml after the treatment. shows the elements of initially measured values, and lists the vitamin D values reached with treatment in each subcategory. The pie chart () depicts the measured vitamin D levels in advance of and after the treatment, where a section corresponds to the percentage values of the subcategories. The significant shift toward higher values in the case of values measured (at least 4–6 weeks) later is clearly visible.
Figure 4. The percentage of children with lower than 10 ng/ml serum vitamin D levels before and after vitamin D supplementation. The percentage of children with 10–20 ng/ml serum vitamin D levels before and after vitamin D supplementation. The percentage of children with 20–30 ng/ml serum vitamin D levels before and after vitamin D supplementation. The percentage of children with higher than 30 ng/ml serum vitamin D levels before and after vitamin D supplementation.
Our further goal was to examine whether there would be a correlation between the prognosis of the disease and the normalization of vitamin D levels, that is, to determine whether the prognosis improved in the cases of children whose serum vitamin D levels had successfully reached the minimum 30 ng/ml with supplementation, compared with those whose vitamin D values remained below the normal level. During the division into prognostic classes (CR, n = 63; PR, n = 8; SDi, n = 4; PD, n = 3; EX, n = 8) and the transfer of vitamin D levels into categorical variables (> 30 ng/ml, n = 40; < 30 ng/ml, n = 46), we carried out the same proceedings as we did when evaluating the effect of initial values on the prognosis. Pearson’s chi-squared test was used for calculations in this case as well. Our study could not support a significant correlation between the normalization of vitamin D and the prognosis of the disease (χ2(1) = 0.52, p = 0.47).
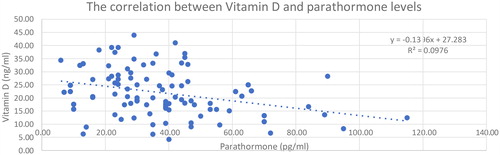
The correlation between serum vitamin D and PTH levels is known from the literature (Citation11,Citation17,Citation18). Thus, we raised the question of whether the serum vitamin D level might be securely derived from the value of PTH as a more frequently monitored parameter. During the process of data collection in case of cancer patients, we paid attention to the use of vitamin D and PTH values that were determined at the same time. To answer our question, Pearson’s correlation coefficient was calculated. Between the two values, a clear negative correlation (but not too close) could be determined (r = −0.31); the correlation significantly differed from 0 (p = 0.001). We performed a linear regression analysis to find out whether, in our case, the PTH value (x) would predict the corresponding vitamin D value (y) (). The coefficient of determination (r2 = 0.09) showed that only 9.7% of the total variance of vitamin D could be explained by the linear relation to PTH (SD = 8.64). According to this result, estimates based on this procedure cannot be recommended. Whereas PTH production is able to react to serum calcium levels relatively fast, vitamin D levels at a given time are rather dependent on supplementation (e.g., intake). This further reduces the codependence of the two parameters and the ability to estimate one from the other in case of a given sample.
Figure 5. Blue points: the PTH levels measured at the same time as the adherent serum vitamin D level; Blue line: the linear regression; visualise a negative correlation.
The vitamin D level’s seasonal fluctuations might be explained by changes in the length of daylight hours and the angle of the sun’s rays. As a result, the vitamin D level generated by UVB radiation on the skin fluctuates (Citation19). According to the data published by the National Meteorological Service (Citation20), the amounts of daylight hours in Hungary over the 1981 to 2010 period were similar to those measured in 2015, so we used the latter data as the basis of our calculations. The number of daylight hours showed a seasonal fluctuation between 51 and 310 hours per month, with the minimum in December and the maximum in July.
Based on this distribution, we divided our patients’ data into two categories—measured in the months of low (October–March) and high (April–September) numbers of daylight hours. According to the F test carried out in advance (p(f) = 0.46), we compared the patient group’s vitamin D values that were measured in the months with low and high numbers of daylight hours, using a two-sample T test. A significant difference (p = 0.30) could not be measured in our patient population at a 5% significance. The possible reasons for this result could be either the low number of elements or the diversity of the patient population (different types of cancer, disease diagnosed at different stages).
Discussion
We conducted research in Hungary about the possible role of subclinical vitamin D deficiency as a risk factor in tumorous diseases developing among children. Previous cohort studies involving adults clearly described a higher risk of certain tumorous diseases among individuals with lower vitamin D levels than the recommended dosage (Citation3). However, we evaluated a retrospective study. The results also showed significantly lower levels (p = 1.93E–08) among the children with cancer; their mean vitamin D level was 19% lower than in the control group. The procedure used and the fact that the serum vitamin D level is a result of numerous factors raise the question (as asked in the literature) of whether a causal relationship could be found or a reverse causality exists (Citation21). The argument states the possibility that the simultaneous occurrence of vitamin D deficiency and the development of cancer might be traced back to mutual risk factors, such as geographical location or seasonal and genetic factors. Furthermore, the vitamin D receptor (VDR) can be detected in various cells of the body that as a nuclear receptor reduces cell proliferation and stimulates differentiation through the complex network of genomic and non-genomic mechanisms, which are adverse processes of tumor genesis (Citation22,Citation23). Numerous cohort studies were conducted among adults to evaluate the correlation between initial vitamin D values and the prognosis. Lower mortality rates were registered with higher initial vitamin D values, while worse prognostic data were paired with lower values in cases of breast, lung, and colorectal cancers (Citation4,Citation24); lymphoma (Citation25); and gastric carcinoma (Citation26). In the course of our research, we also found an unfavorable correlation between the prognosis and low vitamin D values (<30 ng/ml) (p = 0.016, OR = 51.33). Although a significant correlation between vitamin D values (normalized by supplementation) and the prognosis could not be confirmed in the case of our patient data, several publications proposed the optional supplementation of vitamin D analogs as part of the treatment. They showed good results in treating retinoblastoma in an animal experiment (Citation27) and in breast cancer; in the cases of the so-called vitamin D-sensitive tumors (where higher VDR protein levels were measured in tumor cells), the vitamin D supplementation might prove effective (Citation23). A study showed the apoptosis-inducing effect of a vitamin D analog (EB1089) on chronic lymphoid leukemia cells (Citation28). Based on this sensitivity, the question about the role of VDR levels as possible prognostic factors was raised, not only in breast cancers but also in pancreatic cancers (Citation29). Besides, much cellular and molecular genetic research proved that among others, vitamin D inhibited cell adhesion and induced apoptosis and differentiation (Citation30). The T-cell-activating effect of vitamin D was also shown as a stimulator of the immune system against tumorous cells (Citation6). In conclusion, the literature in and the results of earlier research showed high similarity to the significant correlation that we found between the higher risks of cancer developing and insufficient serum vitamin D levels, as well as between lower initial vitamin D values and unfavorable prognosis. In the future, more extended cohort studies might prove the preventive value of vitamin D level normalization as a possible prophylactic treatment. They could also help resolve the inconsistent findings about the correlation between vitamin D normalization and prognosis, as shown in our own calculations and the vast literature published in the field. According to our study, 73% of the children with cancer require supplementation, which is a very high rate, especially since the normalization of vitamin D levels can easily be achieved. It is a simple process, which could reduce the incidence of other diseases developing as well (Citation3).
Several studies reported that in certain cancers, vitamin D increased the potency of chemotherapy and strengthened the fight against the diseases (Citation31). In some cases, it is already part of the treatment protocol. We found that vitamin D treatment in fact increased the serum vitamin D level, which (according to the literature) might weaken the further proliferation of the tumor, help in its destruction, and strengthen the immune system through the VDR.
According to some research, supplements containing 2,000 NE vitamin D may be taken safely on a daily basis by every age group (Citation1). The optimal procedure would be personalized supplementation. Specifically, the most efficient supplementation could be achieved by evaluating serum vitamin D levels and treating different degrees of severity of the deficiency on an individual basis (Citation11,Citation32), which are further complicated by individual variances.
Conclusion
Our examination results showed that the initial vitamin D levels of children with cancer were significantly lower than those of children without cancer. We found a correlation between insufficient and deficient initial serum vitamin D levels and unfavorable prognosis. However, the length of the history and the stage of the tumor at the time of the patients’ admission to our department have not yet been considered up to now. Based on the literature and our results, we propose a randomized and controlled cohort study with a larger number of cases to clarify the causation between tumor genesis and low serum vitamin D levels. Although vitamin D supplementation would be most efficient if medicine would follow the present trend of personalized therapy, the intake of 2,000 NE daily is a simpler, generally accepted, and recommended approach.
| Abbreviations | ||
| BMI | = | body mass index |
| CR | = | complete response |
| ECLIA | = | electrochemiluminescens immunoassay |
| EX | = | exitus |
| OR | = | odds ratio |
| PD | = | progressive disease |
| PR | = | complete response |
| PTH | = | parathormone |
| SD | = | standard deviation |
| SDi | = | stable disease |
| SE | = | Semmelweis University |
| UVB | = | ultraviolet B |
| VDR | = | vitamin D receptor |
Acknowledgments
This paper would not have been completed without the outstanding professional assistance of Dr. Levente Herényi, Dr. Zoltán Erdélyi, Dr. Barna Vásárhelyi, Dr. Dezső Schuler, Dr. Fruzsina Hernold, and Dr. Ivett Anna Fekete.
References
- Garland CF, Gorham ED, Mohr SB, Garland FC. Vitamin D for cancer prevention: global perspective. Ann Epidemiol. 2009;19(7):468–483. doi: 10.1016/j.annepidem.2009.03.021.
- Giovannucci E, Liu Y, Rimm EB, Hollis BW, Fuchs CS, Stampfer MJ, Willett WC. Prospective study of predictors of vitamin D status and cancer incidence and mortality in men. J Natl Cancer Inst. 2006;98(7):451–459. doi: 10.1093/jnci/djj101.
- Wei MY, Giovannucci EL. Vitamin D and multiple health outcomes in the harvard cohorts. Mol Nutr Food Res. 2010;54(8):1114–1126.
- Mezawa H, Sugiura T, Watanabe M, Norizoe C, Takahashi D, Shimojima A, Tamez S, Tsutsumi Y, Yanaga K, Urashima M. Serum vitamin D levels and survival of patients with colorectal cancer: post-hoc analysis of a prospective cohort study. BMC Cancer. 2010;10(1):347.
- Li M, Chen P, Li J, Chu R, Xie D, Wang H. Review: the impacts of circulating 25-hydroxyvitamin D levels on cancer patient outcomes: a systematic review and meta-analysis. J Clin Endocrinol Metab. 2014;99(7):2327–2336. doi: 10.1210/jc.2013-4320.
- Reichrath J, Reichrath S. Sunlight, vitamin D and malignant melanoma. Sunlight, vitamin D and skin cancer. Berlin: Springer; 2014. p. 390–405.
- Ginde AA, Liu MC, Camargo Jr CA. Demographic differences and trends of vitamin D insufficiency in the us population, 1988–2004. Arch Intern Med. 2009;169(6):626–632. doi: 10.1001/archinternmed.2008.604.
- Vásárhelyi B, Sátori A, Olajos F, Szabó A, Beko G. [Low vitamin D levels among patients at Semmelweis University: retrospective analysis during a one-year period]. Orv Hetil. 2011;152(32):1272–1277. doi: 10.1556/OH.2011.29187.
- Barna M, György B. A D-vitamin újonnan felismert funkciói; 2012.
- Wang TJ, Zhang F, Richards JB, Kestenbaum B, van Meurs JB, Berry D, Kiel DP, Streeten EA, Ohlsson C, Koller DL, et al. Common genetic determinants of vitamin D insufficiency: a genome-wide association study. Lancet. 2010;376(9736):180–188. doi: 10.1016/S0140-6736(10)60588-0.
- Vieth R. Vitamin D supplementation, 25-hydroxyvitamin D concentrations, and safety. Am J Clin Nutr. 1999;69(5):842–856. doi: 10.1093/ajcn/69.5.842.
- Szabo A. [skeletal and extra-skeletal consequences of vitamin D deficiency]. Orvosi Hetilap. 2011;152(33):1312–1319.
- Holick MF. Vitamin D status: measurement, interpretation, and clinical application. Ann Epidemiol. 2009;19(2):73–78. doi: 10.1016/j.annepidem.2007.12.001.
- Pearce S, Cheetham TD. Diagnosis and management of vitamin D deficiency. BMJ. 2010;340:b5664. doi: 10.1136/bmj.b5664.
- Wahl DA, Cooper C, Ebeling PR, Eggersdorfer M, Hilger J, Hoffmann K, Josse R, Kanis JA, Mithal A, Pierroz DD, et al. A global representation of vitamin D status in healthy populations. Arch Osteoporos. 2012;7:155–172. doi: 10.1007/s11657-012-0093-0.
- Gorham ED, Garland CF, Garland FC, Grant WB, Mohr SB, Lipkin M, Newmark HL, Giovannucci E, Wei M, Holick MF. Optimal vitamin D status for colorectal cancer prevention: a quantitative meta analysis. Am J Prev Med. 2007;32(3):210–216. doi: 10.1016/j.amepre.2006.11.004.
- Kmieć P, Żmijewski M, Waszak P, Sworczak K, Lizakowska-Kmieć M. Vitamin D deficiency during winter months among an adult, predominantly urban, population in Northern Poland. Endokrynol Pol. 2014;65(2):105–113. doi: 10.5603/EP.2014.0015.
- Tangpricha V, Pearce EN, Chen TC, Holick MF. Vitamin D insufficiency among free-living healthy young adults. Am J Med. 2002;112(8):659
- Eloi M, Horvath D, Szejnfeld V, Ortega J, Rocha D, Szejnfeld J, Castro C. Vitamin D deficiency and seasonal variation over the years in São Paulo, Brazil. Osteoporos Int. 2016;27(12):3449–3456. doi: 10.1007/s00198-016-3670-z.
- Szolgálat OM. Elmúlt évek időjárása. In. Elmúlt Évek Időjárása; 2016.
- Giovannucci E. Vitamin D status and cancer incidence and mortality. Sunlight, vitamin D and skin cancer. Berlin: Springer; 2008. p. 31–42.
- Szabo A, Merke J, Beier E, Mall G, Ritz E. 1,25(OH)2 vitamin D3 inhibits parathyroid cell proliferation in experimental uremia. Kidney Int. 1989;35(4):1049–1056.
- Vinh Quoc Luong K, Nguyen L. The beneficial role of vitamin D and its analogs in cancer treatment and prevention. Crit Rev Oncol Hematol. 2010;73(3):192–201. doi: 10.1016/j.critrevonc.2009.04.008.
- Ng K, Meyerhardt JA, Wu K, Feskanich D, Hollis BW, Giovannucci EL, Fuchs CS. Circulating 25-hydroxyvitamin D levels and survival in patients with colorectal cancer. J Clin Oncol. 2008;26(18):2984–2991. doi: 10.1200/JCO.2007.15.1027.
- Tretli S, Schwartz GG, Torjesen PA, Robsahm TE. Serum levels of 25-hydroxyvitamin D and survival in norwegian patients with cancer of breast, colon, lung, and lymphoma: a population-based study. Cancer Causes Control. 2012;23(2):363–370. doi: 10.1007/s10552-011-9885-6.
- Ren C, Qiu M-Z, Wang D-S, Luo H-y, Zhang D-S, Wang Z-Q, Wang F-h, Li Y-h, Zhou Z-W, Xu R-h. Prognostic effects of 25-hydroxyvitamin D levels in gastric cancer. J Transl Med. 2012;10:16. doi: 10.1186/1479-5876-10-16.
- Albert DM, Nickells RW, Gamm DM, Zimbric ML, Schlamp CL, Lindstrom MJ, Audo I. Vitamin D analogs, a new treatment for retinoblastoma: the first Ellsworth lecture. Ophthalmic Genet. 2002;23(3):137–156.
- Pepper C, Thomas A, Hoy T, Milligan D, Bentley P, Fegan C. The vitamin D3 analog EB1089 induces apoptosis via a p53-independent mechanism involving p38 MAP kinase activation and suppression of ERK activity in B-cell chronic lymphocytic leukemia cells in vitro. Blood. 2003;101(7):2454–2459. doi: 10.1182/blood-2002-07-1984.
- Wang K, Dong M, Sheng W, Liu Q, Yu D, Dong Q, Li Q, Wang J. Expression of vitamin D receptor as a potential prognostic factor and therapeutic target in pancreatic cancer. Histopathology. 2015;67(3):386–397. doi: 10.1111/his.12663.
- Garland CF, Garland FC, Gorham ED, Lipkin M, Newmark H, Mohr SB, Holick MF. The role of vitamin D in cancer prevention. Am J Public Health. 2006;96(2):252–261. doi: 10.2105/AJPH.2004.045260.
- Bittenbring JT, Neumann F, Altmann B, Achenbach M, Reichrath J, Ziepert M, Geisel J, Regitz E, Held G, Pfreundschuh M. Vitamin D deficiency impairs rituximab-mediated cellular cytotoxicity and outcome of patients with diffuse large B-cell lymphoma treated with but not without rituximab. JCO. 2014;32(29):3242–3248. doi: 10.1200/JCO.2013.53.4537.
- Kubeczko M, Nowara E, Spychałowicz W, Wdowiak K, Bednarek A, Karwasiecka D, Chudek J, Wojnar J. Efficacy and safety of vitamin D supplementation in patients with chronic lymphocytic leukemia. Postepy Hig Med Dosw (Online). 2016;70(0):534–541. doi: 10.5604/17322693.1202482.