
Abstract
Objective: This study was designed to assess the effects of replacing high-carbohydrate (CHO) foods with raw almonds on insulin sensitivity and cardiometabolic health markers in overweight or obese adults with prediabetes.
Method: This randomized crossover study consisted of two 6-week dietary intervention periods, separated by a ≥ 4-week washout. Subjects incorporated 1.5 oz of raw almonds twice daily or isocaloric CHO-based foods into their diets, with instructions to maintain body weight. Dietary intakes as well as insulin sensitivity, CHO metabolism indices, lipoprotein lipids and particles, and inflammatory markers were assessed.
Results: Thirty-three subjects (17 male, 16 female), mean age 48.3 ± 2.2 years and body mass index 30.5 ± 0.7 kg/m2, provided evaluable data. Compared to CHO, almonds resulted in significantly (p < 0.01) higher intakes of protein, fat (unsaturated fatty acids), fiber, and magnesium and significantly (p < 0.001) lower intakes of CHO and sugars. No differences were observed between diet conditions for changes from baseline in the insulin sensitivity index from a short intravenous glucose tolerance test or other indices of glucose homeostasis. No significant differences were observed in biomarkers of cardiovascular risk except that the CHO intervention led to a shift toward a higher concentration of cholesterol in small, dense low-density lipoprotein subfraction 3+4 (LDL3 + 4) particles (p = 0.024 vs almonds).
Conclusions: Intake of 3.0 oz/d raw almonds, vs energy-matched CHO foods, improved the dietary nutrient profile, but did not significantly affect insulin sensitivity and most markers of cardiometabolic health in overweight and obese men and women with prediabetes.
Clinical Trial Registry Number:
Introduction
Prediabetes is a primary risk factor for developing type 2 diabetes (T2D) (Citation1), which is a major risk factor for cardiovascular disease (CVD) (Citation2,Citation3). Insulin resistance and pancreatic beta-cell dysfunction are core mediators of T2D development (Citation4); therefore, preserving pancreatic beta-cell function is critical to preventing T2D (Citation5). Increasing insulin sensitivity reduces insulin secretion, which, in turn, reduces beta-cell workload, contributing to the prevention or delay of pancreatic beta-cell dysfunction (Citation5). Lifestyle interventions (e.g., increased physical activity, loss of excess body weight, Mediterranean-style diet intake) that enhance tissue responsiveness to insulin are associated with a lower risk of T2D and improved levels of markers of glucose homeostasis (Citation6–9). In contrast, a diet high in refined starches and added sugars appears to exacerbate disturbances in carbohydrate (CHO) metabolism (Citation10–12).
Results from a randomized controlled crossover trial in our laboratory suggested that partial substitution of refined starches and added sugars with a combination of protein and unsaturated fatty acids (UFA) improves the cardiometabolic health profile (Citation13). Specifically, subjects with hypertriglyceridemia consumed test food items containing egg protein (8% of total energy intake) and UFA (8% of total energy intake) or refined CHO (16% of energy from refined starches and added sugars). After 3 weeks of egg protein/UFA consumption, insulin sensitivity, calculated using the Matsuda insulin sensitivity index (Citation14) improved relative to the refined CHO condition by 24% and the disposition index (a measure of pancreatic β-cell function) improved by 40% (Citation13). Concentrations of triglycerides (TG) and very-low-density lipoprotein cholesterol decreased by 16% and 15%, respectively, during egg protein/UFA consumption, relative to the refined CHO condition. These changes were accompanied by a net increase of 0.27 nm in low-density lipoprotein (LDL) peak particle size (Citation13).
Tree nut consumption, including almonds, has been associated with lower risk of both T2D and CVD and with favorable changes in the metabolic profile, including improved lipoprotein lipid levels and reduced concentrations of fasting insulin and glucose (Citation15–20). Results from meta-analyses show that nut intake, in general, has been associated with lower fasting blood glucose, total cholesterol (total-C), and low-density lipoprotein cholesterol (LDL-C) concentrations (Citation21). Results from a randomized controlled trial (RCT) assessing the effect of partial dietary replacement of refined CHO with almonds or peanuts, within a low-calorie diet, indicated that both nut types reduced fasting and postprandial 2-hour blood glucose levels compared to baseline in adults with T2D (Citation22). Almond intake, specifically, has been found to improve the lipoprotein lipid profile and postprandial glycemia (Citation19,Citation23). In addition, almond consumption may reduce serum uric acid concentration (Citation24); hyperuricemia is a risk factor for both CVD and T2D (Citation25,Citation26). Almonds contain monounsaturated fatty acids (MUFA), polyunsaturated fatty acids (PUFA), protein, fiber, antioxidants, and magnesium (Citation27), all of which may contribute to the favorable metabolic effects reported in observational studies and clinical trials (Citation28,Citation29), particularly when displacing foods high in refined CHO. Therefore, the objective of this clinical trial was to evaluate the effect of consuming 1.5 oz of raw almonds twice daily (3.0 oz/d, 85 g/d), as a replacement for high-CHO foods, on insulin sensitivity and other markers of cardiometabolic health in overweight and obese men and women with prediabetes.
Materials and methods
Design
This randomized, controlled, two-period crossover study was conducted at three clinics (two sites in Chicago, Illinois, and one site in Boca Raton, Florida) in accordance with Good Clinical Practice Guidelines, the Declaration of Helsinki (Citation30), and the United States 21 Code of Federal Regulations. The protocol had institutional review board approval before initiation of the study (Aspire IRB, Santee, California, and Illinois Institute of Technology Review Board, Chicago, Illinois), and subjects provided written informed consent before any study procedures were performed. The study included two screening visits, two 6-week test periods with visits at weeks 5 and 6 within each test period, and a ≥ 4-week washout period between the test periods.
Subjects
Men and women, 18 to 69 years of age, inclusive, each with a body mass index of 25.0 to 39.9 kg/m2, who met the criteria for having prediabetes, defined as fasting glucose 100 to 125 mg/dL and/or glycated hemoglobin 5.7% to 6.4% measured with a fingerstick sample collected at screening, were eligible for the study (Citation31). Subjects had to be otherwise healthy and have fasting TG levels < 400 mg/dL and LDL-C levels < 200 mg/dL. Subjects had to be willing to avoid consumption of nuts and nut butters, other than the provided study foods, for 1 week prior to the first screening visit and throughout the duration of the study. Subjects also had to be willing to maintain their usual physical activity levels throughout the trial, and current smokers had to be willing to not change smoking habits during the study period. Potential subjects were excluded if they had atherosclerotic CVD or pulmonary, endocrine (including type 1 diabetes and T2D), chronic inflammatory, hepatic, renal, hematologic, immunologic, dermatologic, neurologic, psychiatric, or biliary disorders or if they had a recent history (prior 5 years) or presence of cancer other than nonmelanoma skin cancer. Those who had experienced significant weight change (4.5 kg in past 3 months), had extreme dietary habits (e.g., veganism), or had a recent history or strong potential for drug or alcohol abuse were excluded. Persons with uncontrolled hypertension (systolic blood pressure [SBP] ≥ 160 mm Hg and/or diastolic blood pressure [DBP] ≥ 100 mm Hg) or a known allergy, sensitivity, or intolerance to any study foods or their ingredients were also excluded. Eligible individuals were not permitted to have unstable use of any antihypertensive medication, be actively taking antibiotics or using dietary supplements or medications known to alter lipid (except for stable use of statins) or CHO metabolism, or be using weight loss drugs or programs. Women who were pregnant, planning to be pregnant during the study period, lactating, or of childbearing potential and unwilling to commit to the use of a medically approved form of contraception throughout the study were also excluded. Last, individuals who had a condition the investigator believed would interfere with his or her ability to provide informed consent or comply with the study protocol or put the person at undue risk were excluded.
Diets and clinic visit procedures
At baseline, eligible subjects were randomly assigned to one of the two dietary conditions (almond or CHO) for the first 6-week test period. Subjects were provided with study products, either 1.5 oz of raw almonds twice per day (3.0 oz/d) for the almond condition or energy-matched CHO-based foods for the CHO condition. Energy and select macronutrient composition of the provided study products, which included fruit and grain bars, baked potato chips, mini bagels, rice cakes, dinner rolls, pretzels, dried mango slices, pudding cups, and vanilla cookie wafers, are reported in Supplementary Table 1 in supplementary materials. Mean energy of the study products for the almond and CHO conditions was targeted to be ∼480 kcal per day. Subjects received instruction on the incorporation of food substitutions into their usual diets during each test period to maintain habitual energy intake. They were also instructed to maintain other lifestyle habits. After the last day of the first diet condition, subjects returned to their habitual diets for the duration of the ≥4-week washout period, after which they crossed over to the other diet condition for 6 weeks.
Dietary intakes were assessed at baseline and during each intervention period (including intakes of the almond and CHO study products) by collecting 3-day diet records that were analyzed using Food Processor® Nutrition Analysis software (version 11.4.548, ESHA Research, Salem, Oregon). To assess compliance, subjects were instructed to record study product consumption in a daily log. If a study product was not consumed in its entirety, subjects documented whether 0%, <50%, or ≥50% was consumed, and these percentages were included in the calculation of daily compliance. The Stanford 7-day Physical Activity Recall Questionnaire was completed at baseline and the end of each diet condition (Citation32).
Insulin sensitivity and CHO metabolism
A short (50-minute) intravenous glucose tolerance test (IVGTT) was conducted at baseline and the end of each dietary intervention period to assess insulin sensitivity and other indices of CHO metabolism. The short IVGTT insulin sensitivity index has been found by some investigators to have higher precision and test–retest reliability than insulin sensitivity indices calculated from oral glucose tolerance tests (Citation33,Citation34). After an overnight fast (12 ± 2 hours, water only), an indwelling catheter was inserted to deliver the glucose load and obtain blood samples. Samples were collected for glucose and insulin measurements at –10, –5, 5, 10, 20, 30, 40 and 50 ± 1 minute, where an intravenous glucose bolus (0.3 g/kg body weight, 50% dextrose solution [with a maximum of 25 g of glucose]) was provided over approximately 1.5 minutes starting at 0 minutes. Glucose was assessed in plasma samples using an enzymatic colorimetric assay (Randox Laboratories Ltd., Crumlin, United Kingdom), and insulin was assessed using an immunoturbidimetric assay (Kamiya Biomedicals, Seattle, Washington). Insulin sensitivity index (Si) was calculated as the fractional glucose disappearance rate (Kg) divided by the mean plasma insulin concentration from 10 to 50 minutes (i.e., total area under the curve [AUC]/40 minutes) (Citation35,Citation36). Acute insulin response to glucose (AIRg) was calculated as the average increment in glucose during the first 10 minutes after the glucose bolus. Disposition index (DI; Si × AIRg), a measure of pancreatic beta-cell function, and Kg from t = 10–50 minutes were also calculated. Kg was calculated as –1 * the slope of the value for loge glucose on time from 10–50 minutes. Fasting homeostasis model assessments of insulin sensitivity (HOMA2-%S) and beta-cell function (HOMA2-%B) were assessed from fasting glucose and insulin values (www.dtu.ox.ac.uk/homacalculator/index.php).
Other cardiometabolic health markers
At baseline and twice at the end of each treatment period, fasting blood samples were collected for assessment of plasma total-C, non-high-density lipoprotein cholesterol (non-HDL-C), calculated LDL-C, TG, and high-sensitivity C-reactive protein (hs-CRP). Lipid levels were analyzed according to the Standardization Program of the Centers for Disease Control and Prevention and the National Heart, Lung and Blood Institute using enzymatic colorimetric methodology (Randox Laboratories Ltd., Crumlin, United Kingdom). High-density lipoprotein cholesterol (HDL-C) was analyzed using the rate method (Randox Laboratories Ltd., Crumlin, United Kingdom). LDL-C concentrations (mg/dL) were calculated according to the Friedewald equation as follows in mg/dL: LDL-C = total-C–HDL-C–TG/5. hs-CRP levels were assessed using an immunoturbidimetric assay (Randox Laboratories Ltd., Crumlin, United Kingdom).
In fasting plasma samples collected at baseline and the last day of each treatment period, lipoprotein particles and subfractions were analyzed using a density gradient ultracentrifugation technique (VAP Diagnostics Laboratory, Inc., Birmingham, Alabama) (Citation37–40). At these same time points, apolipoprotein (Apo) B and Apo A1 were assessed using immunoturbidimetric methodology (Randox Laboratories Ltd., Crumlin, United Kingdom), fasting adiponectin and interleukin-6 (IL-6) levels were assessed using high-sensitive Sandwich ELISA methodology (R&D Systems, Inc., MN, USA), and fasting uric acid levels were assessed using an enzymatic colorimetric assay (Randox Laboratories Ltd., Crumlin, United Kingdom).
Measurements of body weight, waist circumference, and SBP and DBP were conducted at each clinic visit. Blood pressures were measured after the subject had been seated for a minimum of 2 minutes. An automated device (either Welch Allyn, Skaneateles Falls, New York; E-Sphyg 2, American Diagnostic Corp., Hauppauge, New York; or GE Dinamap V100, General Electric, Milwaukee, Wisconsin) took three measurements, each 1 minute apart. Subjects were queried at each clinic visit with an open-ended question about whether they had experienced any adverse events.
Statistical analysis
Sample size calculations indicated that an evaluable sample of 30 subjects was expected to provide 80% power to detect a difference of 0.53 standard deviations between diet conditions for the primary outcome variable, the Si from the short IVGTT. The pooled standard deviation used for the calculations was 22% for the change from baseline. Therefore, the study would have 80% power to detect a difference of 11.7% in response between conditions. All tests of significance were performed at alpha = 0.05, two-sided. The analysis utilized data from all subjects who provided data during both diet conditions. Statistical comparisons were made for differences between conditions in the changes or percentage changes from the pre-intervention baseline. Statistical modeling was completed using repeated measures analysis of covariance (IBM SPSS Statistics for Windows, Version 24.0, Armonk, New York). The initial models contained terms for diet condition, sequence, period, and baseline value as a covariate, with subject as a random effect. Models were reduced in a stepwise manner until only significant (p < 0.05) terms or diet condition and baseline remained in the model. Assumptions of normality of residuals were investigated for each model. If there was substantial departure from normality, assessed using a quantile-quantile (q-q) plot, a log or rank transformation was applied. Values are generally reported as means (standard error of the mean [SEM]), except for nonnormally distributed variables that are reported as medians (interquartile limits [IQL]). Separate models were run to evaluate potential treatment by research center or treatment by sequence (carryover) interactions. Since none were evident, only pooled data from both sequence groups and all three research sites are presented. Possible differences between treatment conditions for dichotomous variables were assessed using McNemar’s test or a binomial test. Post hoc subgroup analyses of insulin sensitivity and CHO metabolism parameters were conducted using analysis of covariance (as described above) to examine responses according to baseline HOMA2-%S values above and below the median.
Results
A total of 240 volunteers were screened, 54 subjects were randomized to a diet condition sequence, and 33 (16 females and 17 males) completed both treatment conditions and were included in the evaluable sample. Descriptions of the reasons for screen failures and for failure to complete the trial are shown in . Baseline demographic and anthropometric characteristics are presented in . Based on daily study product logs, during the almond condition participants had a median compliance of 100% (IQL: 97.5, 100) and during the CHO condition median compliance was 98.7% (IQL: 94.1, 100). There were no significant changes from baseline in physical activity, body weight, or waist circumference during either treatment condition (data not shown).
Figure 1. Flow diagram of subjects assessed for eligibility, excluded, randomized, and analyzed for the study. BMI = body mass index; CHO = carbohydrates; HTN = hypertension; PI, principal investigator.
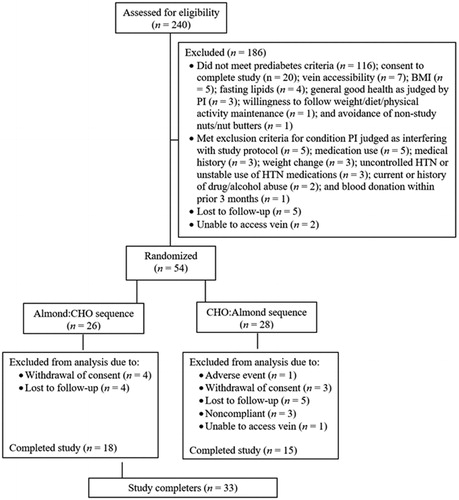
Table 1. Demographic and Anthropometric Baseline Characteristics of Subjects Who Completed the Study.a
Mean energy and nutrient intakes at baseline and during each diet condition are presented in . There were no significant changes from baseline in total energy intake in either diet condition. The mean percentage of energy from CHO (and from sugars) decreased significantly from baseline during the almond condition, and the percentage of energy from CHO increased significantly from baseline during the CHO condition (p < 0.05). Total fat, UFA, dietary fiber, and magnesium intakes were significantly (p < 0.05) increased from baseline during the almond condition. When compared between diet conditions, changes from baseline in CHO, sugar, protein, total fat, UFA, dietary fiber, and magnesium intakes were significantly different (p < 0.01 for all). The dietary intake differences were mainly attributable to the differing nutrient compositions of the study foods.
Table 2. Energy, Macronutrient, and Select Nutrient Intakes at Baseline and During Almond and Carbohydrate Treatment Periods of Subjects Who Completed the Study (N = 33).Table Footnotea–c
Neither intake of the almond nor the CHO test products significantly altered the primary outcome variable, Si (). Compared to baseline, median fasting insulin significantly increased after both diet conditions and, in the almond condition only, median fasting glucose was significantly increased and HOMA2-%S was significantly reduced (p < 0.05 for all). However, there were no significant differences in responses between diet conditions observed for any of the indices of glucose metabolism. Subgroup analyses showed similar effects in insulin sensitivity and CHO metabolism variables among subjects with baseline HOMA2-%S above and below the median (< or ≥ 104.2).
Table 3. Short Intravenous Glucose Tolerance Test and Other Glucose Metabolism Parameters at Baseline and Change or Percentage Change From Baseline Following Almond and Carbohydrate Conditions in Subjects Who Completed the Study (N = 33).Table Footnotea–d
Similarly, there were no significant differences in responses between diet conditions observed for lipoprotein lipids and Apo A1 or Apo B (), although median HDL-C significantly increased from baseline in the CHO condition and median Apo A1 significantly increased in the almond condition (p < 0.05 for both). Density gradient ultracentrifugation assessment of the lipoprotein particles and subfractions showed a significant (p = 0.024) increase in mean LDL3 + 4-C levels in the CHO condition, which was also significantly increased compared to the response in the almond condition (p < 0.05) (). Both diet conditions also had significantly increased median HDL3-C levels (p < 0.05). There were no other significant changes from baseline in either diet condition or between diet conditions.
Table 4. Fasting Lipoprotein Lipids and Apolipoproteins at Baseline and Percentage Changes From Baseline Following Almond and Carbohydrate Conditions in Subjects Who Completed the Study (N = 32–33).a–c
Table 5. Fasting Lipoprotein Particle and Subfraction Cholesterol Concentrations Assessed by Density Gradient Ultracentrifugation at Baseline and Changes From Baseline Following Almond and Carbohydrate Conditions in Subjects Who Completed the Study (N = 30–32).a–f
No significant changes from baseline were observed for either dietary intervention, and there were no differences in responses between treatment conditions, for hs-CRP, IL-6, adiponectin, uric acid, and blood pressures ().
Table 6. Interleukin-6, Adiponectin, High-Sensitivity C-Reactive Protein, Uric Acid, and Blood Pressures at Baseline and Percentage Changes From Baseline Following Almond and Carbohydrate Treatments in Subjects Who Completed the Study (N = 33).a,b
Discussion
The results of this randomized crossover study show that despite potentially favorable changes in the nutrient profile during the almond condition compared to baseline and to the CHO condition, substitution of refined CHO-based snacks with almonds for 6 weeks did not significantly affect the primary outcome variable of Si, or most other markers of cardiometabolic health, in men and women with prediabetes. It is unclear why lower energy intake from refined starches and added sugars, accompanied by higher intakes of protein, UFA, magnesium and fiber, did not improve the cardiometabolic biomarker profile, although others have reported similar findings (Citation20,Citation41–43). The lack of difference in Si response between conditions was confirmed by the HOMA-%S values.
Tan et al. reported no effect of 4 weeks of 43 g/d (1.5 oz/d) almond intake, vs a control diet that was nut-free and seed-free, in subjects with increased risk for T2D, on fasting glucose, insulin, total-C, LDL-C, and HDL-C, despite significantly higher MUFA and alpha-tocopherol intakes during the almond intervention (Citation41). However, acute postprandial glycemia (t = 60 minutes post-ingestion) and acute satiety (suppressed hunger and desire to eat) were significantly lower after almond intake versus intake of a control meal or snack (Citation41). A 12-week RCT by Dhillon et al. assessed the effects of an energy restricted (−500 kcal/d) diet enriched with almonds (15% of energy), compared to a nut-free energy-restricted diet, in overweight or obese subjects (Citation42). Results indicated no effect of almond intake on fasting serum glucose, insulin, total-C, LDL-C, HDL-C, and TG. However, compared to the nut-free condition, truncal and total body fat and DBP were reduced in compliant subjects during the almond intervention (Citation42). Most recently, an RCT assessing the effect of 12-week intake of 56 g/d (2 oz/d) almonds showed no differences in glycated hemoglobin, glycemic variability, body weight and composition, liver fat and aminotransferases, lipid metabolism, or inflammatory markers compared to 12-week intake of an isocaloric, higher CHO-containing muffin each day, in overweight or obese adults with T2D or at risk for T2D (Citation43). Last, a 2014 meta-analysis of RCT data found that tree nut intake at a median dose of 56 g/d (2 oz/d) was significantly inversely associated with glycated hemoglobin and fasting glucose levels when assessed collectively, i.e., all tree nuts; however, statistical significance was not reached when using data from studies assessing only almond intake (Citation20).
The Si and HOMA2-%S values were not markedly impaired in our sample compared with samples of healthy adults. For example, the HOMA2-%S value of 104.2 at baseline suggests essentially normal insulin sensitivity since a value of 100 reflects the average level in lean, 40-year-old men (Citation44). This suggests that the subjects studied had prediabetes that was mainly driven by impaired beta-cell function (HOMA2-%B ∼70% of normal). In a prior study, our group found that replacing 16% of energy with egg protein and UFA increased the Matsuda index of insulin sensitivity and produced favorable changes in several cardiometabolic health biomarkers (Citation13). In that trial, the baseline HOMA2-%S was lower by ∼19% (84.8%) than in the present sample. Thus, one potential explanation for the differing results from the two investigations is the higher relative level of baseline insulin sensitivity in the participants in the present trial. Although a post hoc analysis of Si and other CHO metabolism variables among subjects with baseline HOMA2-%S above and below the baseline median did not detect an effect in either subgroup, it is possible that a larger sample with lower baseline HOMA2-%S would have shown a different result. Consistent with this possibility, and with results in our prior trial, Hyde et al. recently showed that in obese subjects with metabolic syndrome, dietary carbohydrate restriction, exchanged isocalorically for fat in a weight-maintenance diet, improved metabolic syndrome risk factors, including TG, HDL-C, and small, dense LDL particle concentration, independent of weight loss (Citation45).
A 2009 meta-analysis on RCT data found a neutral effect of almond intake on serum lipid profiles (Citation46); several RCTs published since then have reported a potentially beneficial effect of almond intake on fasting lipoprotein lipids (Citation19,Citation47). For example, a study in healthy men and women showed that 20-week intake of 56 g/d (2 oz/d) almonds reduced total-C, LDL-C, and TG compared to intake of an isocaloric, high-CHO food (Citation47). Another study in healthy adults with elevated LDL-C demonstrated that intake of 1.5 oz/d almonds for 6 weeks reduced non-HDL-C and LDL-C compared to daily intake of an isocaloric, high-CHO muffin (Citation19). A study by Lee et al. demonstrated that 42.5 g/d almonds significantly reduced total-C, non-HDL-C, and LDL-C compared with an average American diet in overweight men and women (Citation48). The LDL-C reduction was attributed to a decrease cholesterol carried by larger LDL particles, which is similar to the result which our group observed previously with corn oil (Citation48,Citation49). Those results differ from the present trial, which did not show an effect of almond versus CHO intake on the major fasting lipoprotein lipid levels (Citation17,Citation19,Citation20). However, there was a significant increase in cholesterol carried by small, dense LDL3 + 4 particles during the CHO condition, which was not observed during the almond condition.
HDL-C increased numerically during both diet conditions, and the increase was significant compared with baseline during the CHO condition. Subfraction results showed that the increase was attributable to elevations in both HDL2-C and HDL3-C, although only the latter reached significance compared to baseline in both test conditions. Higher levels of HDL-C and its subfractions, HDL2-C and HDL3-C, have been associated with lower risk of CVD. However, the clinical relevance of changes in HDL-C and HDL subfraction cholesterol concentrations is uncertain because genetic variants that alter HDL-C have not been shown to alter CVD risk, in contrast to variants that alter LDL-C and very-low-density lipoprotein cholesterol (Citation50,Citation51). In addition, pharmacologic modification of HDL-C levels has not been associated with improvements in CVD event rates (Citation52).
No effect of almond intake was observed on markers of inflammation, which is consistent with the results of a 2017 meta-analysis assessing the effect of nut intake on endothelial function and inflammation (Citation53). While some studies have shown a modest effect of almond consumption to reduce inflammatory markers (Citation54–56), others have failed to show an effect (Citation22,Citation57). Last, in contrast to a previous RCT that found that 6 weeks of almond intake (10 g/d almonds soaked overnight prior to consumption) by subjects with coronary artery disease resulted in a significant reduction in serum uric acid levels (Citation24), there was no effect on uric acid level in the present trial.
Strengths of this study include the use of commonly consumed snack foods for both diet conditions and their incorporation into a habitual diet, thus mimicking snacking occasions in real life. However, 3.0 oz of almonds may be slightly higher than typical daily snacking quantities, and other forms of almonds (e.g., roasted and salted, nut butters) may be more commonly consumed than raw almonds. A limitation of the trial is the reliance on subject dietary reporting. Prior studies have shown that, on average, individuals underreport energy intake by 20% (Citation58), with even greater underreporting with increasing overweight/obese weight status (Citation59). Thus, we cannot rule out the possibility of systematic errors in dietary intake data provided by subjects, which could produce bias. However, subjects served as their own controls, and intakes of nutrients, including CHO and fat, differed between conditions to the degree expected based on the study product nutrient profiles. Another limitation is the relatively short intervention period of 6 weeks. It will be of interest to assess whether adaptation occurs over time with longer periods of intervention. An additional issue relates to the use of an IVGTT rather than a more physiologic method of delivering a CHO load, such as an oral glucose or meal tolerance test. However, the authors believe that it is unlikely that the findings would have been materially different because we and others have shown that the most commonly used index of insulin sensitivity from oral glucose or meal tolerance tests (the Matsuda index) correlates strongly with results from IVGTT-derived indices (Citation35,Citation60).
Conclusion
Consumption of almonds, compared to refined CHO-based foods, did not significantly affect insulin sensitivity and other aspects of CHO homeostasis. LDL3 + 4-C levels were significantly higher during CHO food consumption compared to the almond condition, indicating a shift toward smaller, denser circulating LDL. Based on results from this and other investigations, additional research is warranted to further investigate the effects of almond consumption on glucose homeostasis and lipid metabolism in a sample selected specifically for having insulin resistance, such as those with hypertriglyceridemia, metabolic syndrome, or abdominal obesity.
| Abbreviations | ||
| AIRg | = | acute insulin response to glucose |
| Apo | = | apolipoprotein |
| AUC | = | area under the curve |
| BMI | = | body mass index |
| CHO | = | carbohydrate |
| CVD | = | cardiovascular disease |
| DBP | = | diastolic blood pressure |
| DI | = | disposition index |
| HDL-C | = | high-density lipoprotein cholesterol |
| HOMA2-%B | = | homeostasis model assessment of beta-cell function |
| HOMA2-%S | = | homeostasis model assessment of insulin sensitivity |
| hs-CRP | = | high-sensitivity C-reactive protein |
| IL-6 | = | interleukin-6 |
| IQL | = | interquartile limits |
| IVGTT | = | intravenous glucose tolerance test |
| Kg | = | fractional glucose disappearance constant |
| LDL-C | = | low-density lipoprotein cholesterol |
| MUFA | = | monounsaturated fatty acids |
| PUFA | = | polyunsaturated fatty acids |
| RCT | = | randomized controlled trial |
| SBP | = | systolic blood pressure |
| SEM | = | standard error of the mean |
| SFA | = | saturated fatty acids |
| Si | = | insulin sensitivity index |
| T2D | = | type 2 diabetes mellitus |
| total-C | = | total cholesterol |
| TG | = | triglycerides |
| UFA | = | unsaturated fatty acids |
| VAP | = | vertical auto profile |
Supplemental Material
Download PDF (19.1 KB)Acknowledgements
We gratefully acknowledge Alexandra Becraft, MS, for her assistance with manuscript preparation.
Disclosure statement
KCM, OMP, MLW, MRD, and MK are employees of Midwest Biomedical Research/MB Clinical Research, which has received research funding from the Almond Board of California, American Egg Board/Egg Nutrition Center, Hass Avocado Board, National Cattlemen’s Beef Association, and the National Dairy Council. KCM has also received consulting fees from the American Egg Board/Egg Nutrition Center, National Cattlemen’s Beef Association, and the National Dairy Council. RT is an employee of Great Lakes Clinical Trials, Chicago, Illinois, which is a clinical research site that received funding from the Almond Board of California to conduct this trial. As employees of the Illinois Institute of Technology, IE, BB-F, and DX have received research grants from the Almond Board of California, California Strawberry Council, National Processed Raspberry Council, U.S. Food and Drug Administration, U.S. Department of Agriculture, Hass Avocado Board, National Watermelon Promotion Board, National Mango Board, PepsiCo Inc., Ingredion, Inc., Biofortis, Inc., and Midwest Center for Metabolic and Cardiovascular Research.
Additional information
Funding
References
- 3. Prevention or delay of type 2 diabetes: standards of medical care in diabetes – 2019. Diabetes Care. 2019;42(Suppl 1):S29–S33.
- Fox CS, Golden SH, Anderson C, Bray GA, Burke LE, De Boer IH, Deedwania P, Eckel RH, Ershow AG, Fradkin J. Update on prevention of cardiovascular disease in adults with type 2 diabetes mellitus in light of recent evidence: a scientific statement from the American Heart Association and the American Diabetes Association. Diabetes Care. 2015;38(9):1777–803. doi:10.2337/dci15-0012.
- Grundy SM. Metabolic syndrome: connecting and reconciling cardiovascular and diabetes worlds. J Am Coll Cardiol. 2006;47(6):1093–100. doi:10.1016/j.jacc.2005.11.046.
- Defronzo RA. Banting lecture. From the triumvirate to the ominous octet: a new paradigm for the treatment of type 2 diabetes mellitus. Diabetes. 2009;58(4):773–95. doi:10.2337/db09-9028.
- DeFronzo RA, Abdul-Ghani MA. Preservation of β-cell function: the key to diabetes prevention. J Clin Endocrinol Metab. 2011;96(8):2354–66. doi:10.1210/jc.2011-0246.
- Aune D, Norat T, Leitzmann M, Tonstad S, Vatten LJ. Physical activity and the risk of type 2 diabetes: a systematic review and dose-response meta-analysis. Eur J Epidemiol. 2015;30(7):529–42. doi:10.1007/s10654-015-0056-z.
- Jelleyman C, Yates T, O'Donovan G, Gray LJ, King JA, Khunti K, Davies MJ. The effects of high-intensity interval training on glucose regulation and insulin resistance: a meta-analysis. Obes Rev. 2015;16(11):942–61. doi:10.1111/obr.12317.
- Schreuder TH, Maessen MF, Tack CJ, Thijssen DH, Hopman MT. Life-long physical activity restores metabolic and cardiovascular function in type 2 diabetes. Eur J Appl Physiol. 2014;114(3):619–27. doi:10.1007/s00421-013-2794-5.
- Grams J, Garvey WT. Weight loss and the prevention and treatment of type 2 diabetes using lifestyle therapy, pharmacotherapy, and bariatric surgery: mechanisms of action. Curr Obes Rep. 2015;4(2):287–302. doi:10.1007/s13679-015-0155-x.
- Appel LJ, Sacks FM, Carey VJ, Obarzanek E, Swain JF, Miller ER, Conlin PR, Erlinger TP, Rosner BA, Laranjo NM, et al. Effects of protein, monounsaturated fat, and carbohydrate intake on blood pressure and serum lipids: results of the OmniHeart randomized trial. JAMA. 2005;294(19):2455–64. doi:10.1001/jama.294.19.2455.
- Parks EJ, Hellerstein MK. Carbohydrate-induced hypertriacylglycerolemia: historical perspective and review of biological mechanisms. Am J Clin Nutr. 2000;71(2):412–33. doi:10.1093/ajcn/71.2.412.
- Maki KC, Phillips AK. Dietary substitutions for refined carbohydrate that show promise for reducing risk of type 2 diabetes in men and women. J Nutr. 2015;145(1):159S–63S. doi:10.3945/jn.114.195149.
- Maki KC, Palacios OM, Lindner E, Nieman KM, Bell M, Sorce J. Replacement of refined starches and added sugars with egg protein and unsaturated fats increases insulin sensitivity and lowers triglycerides in overweight or obese adults with elevated triglycerides. J Nutr. 2017;147(7):1267–74. doi:10.3945/jn.117.248641.
- Matsuda M, DeFronzo RA. Insulin sensitivity indices obtained from oral glucose tolerance testing: comparison with the euglycemic insulin clamp. Diabetes Care. 1999;22(9):1462–70. doi:10.2337/diacare.22.9.1462.
- Estruch R, Ros E, Salas-Salvadó J, Covas MI, Corella D, Arós F, Gómez-Gracia E, Ruiz-Gutiérrez V, Fiol M, Lapetra J, et al. Primary prevention of cardiovascular disease with a Mediterranean diet supplemented with extra-virgin olive oil or nuts. N Engl J Med. 2018;378(25):e34doi:10.1056/NEJMoa1800389.
- Salas-Salvadó J, Bulló M, Babio N, Martínez-González MÁ, Ibarrola-Jurado N, Basora J, Estruch R, Covas MI, Corella D, Arós F, et al. Reduction in the incidence of type 2 diabetes with the Mediterranean diet: results of the PREDIMED-Reus nutrition intervention randomized trial. Diabetes Care. 2011;34(1):14–9. doi:10.2337/dc10-1288.
- Wien M, Bleich D, Raghuwanshi M, Gould-Forgerite S, Gomes J, Monahan-Couch L, Oda K. Almond consumption and cardiovascular risk factors in adults with prediabetes. J Am Coll Nutr. 2010;29(3):189–97. doi:10.1080/07315724.2010.10719833.
- Toledo E, Hu FB, Estruch R, Buil-Cosiales P, Corella D, Salas-Salvadó J, Covas MI, Arós F, Gómez-Gracia E, Fiol M, et al. Effect of the Mediterranean diet on blood pressure in the PREDIMED trial: results from a randomized controlled trial. BMC Med. 2013;11(1):207. doi:10.1186/1741-7015-11-207.
- Berryman CE, West SG, Fleming JA, Bordi PL, Kris-Etherton PM. Effects of daily almond consumption on cardiometabolic risk and abdominal adiposity in healthy adults with elevated LDL-cholesterol: a randomized controlled trial. J Am Heart Assoc. 2015;4(1):e000993. doi:10.1161/JAHA.114.000993.
- Viguiliouk E, Kendall CW, Blanco Mejia S, Cozma AI, Ha V, Mirrahimi A, Jayalath VH, Augustin LS, Chiavaroli L, Leiter LA, et al. Effect of tree nuts on glycemic control in diabetes: a systematic review and meta-analysis of randomized controlled dietary trials. PLoS One. 2014;9(7):e103376. doi:10.1371/journal.pone.0103376.
- Kim Y, Keogh J, Clifton PM. Nuts and cardio-metabolic disease: a review of meta-analyses. Nutrients. 2018;10(12):1935. doi:10.3390/nu10121935.
- Hou YY, Ojo O, Wang LL, Wang Q, Jiang Q, Shao XY, Wang XH. A randomized controlled trial to compare the effect of peanuts and almonds on the cardio-metabolic and inflammatory parameters in patients with type 2 diabetes mellitus. Nutrients. 2018;10(11):1565. doi:10.3390/nu10111565.
- Li SC, Liu YH, Liu JF, Chang WH, Chen CM, Chen CY. Almond consumption improved glycemic control and lipid profiles in patients with type 2 diabetes mellitus. Metabolism. 2011;60(4):474–79. doi:10.1016/j.metabol.2010.04.009.
- Jamshed H, Gilani AU, Sultan FA, Amin F, Arslan J, Ghani S, Masroor M. Almond supplementation reduces serum uric acid in coronary artery disease patients: a randomized controlled trial. Nutr J. 2015;15(1):77. doi:10.1186/s12937-016-0195-4.
- van der Schaft N, Brahimaj A, Wen KX, Franco OH, Dehghan A. The association between serum uric acid and the incidence of prediabetes and type 2 diabetes mellitus: the Rotterdam study. PLoS One. 2017;12(6):e0179482. doi:10.1371/journal.pone.0179482.
- Borghi C, Rosei EA, Bardin T, Dawson J, Dominiczak A, Kielstein JT, Manolis AJ, Perez-Ruiz F, Mancia G. Serum uric acid and the risk of cardiovascular and renal disease. J Hypertens. 2015;33(9):1729–41; discussion 41. doi:10.1097/HJH.0000000000000701.
- US Department of Agriculture (USDA), Agricultural Research Service, Nutrient Data Laboratory. USDA National Nutrient Database for Standard Reference, Legacy. Version Current: April 2018. http://www.ars.usda.gov/nutrientdata. (Accessed on 01 May 2019).
- Palacios OM, Kramer M, Maki KC. Diet and prevention of type 2 diabetes mellitus: beyond weight loss and exercise. Expert Rev Endocrinol Metab. 2019;14(1):1–12. doi:10.1080/17446651.2019.1554430.
- Hernandez-Alonso P, Camacho-Barcia L, Bullo M, Salas-Salvado J. Nuts and dried fruits: An update of their beneficial effects on type 2 diabetes. Nutrients. 2017;9(7):673. doi:10.3390/nu9070673.
- World Medical Association Declaration of Helsinki: ethical principles for medical research involving human subjects. JAMA. 2000;284(23):3043–45.
- Classification and Diagnosis of Diabetes: Standards of Medical Care in Diabetes-2019. Diabetes Care. 2019;42(Suppl 1):S13–S28.
- Blair SN, Haskell WL, Ho P, Paffenbarger RS, Jr., Vranizan KM, Farquhar JW, Wood PD. Assessment of habitual physical activity by a seven-day recall in a community survey and controlled experiments. Am J Epidemiol. 1985;122(5):794–804. doi:10.1093/oxfordjournals.aje.a114163.
- Cersosimo E, Solis-Herrera C, Trautmann ME, Malloy J, Triplitt CL. Assessment of pancreatic beta-cell function: review of methods and clinical applications. Curr Diabetes. 2014;10(1):2–42. doi:10.2174/1573399810666140214093600.
- Ortega JF, Hamouti N, Fernández-Elías VE, Mora-Rodriguez R. Comparison of glucose tolerance tests to detect the insulin sensitizing effects of a bout of continuous exercise. Appl Physiol Nutr Metab. 2014;39(7):787–92. doi:10.1139/apnm-2013-0507.
- Tura A, Sbrignadello S, Succurro E, Groop L, Sesti G, Pacini G. An empirical index of insulin sensitivity from short IVGTT: validation against the minimal model and glucose clamp indices in patients with different clinical characteristics. Diabetologia. 2010;53(1):144–52. doi:10.1007/s00125-009-1547-9.
- Hahn RG, Ljunggren S, Larsen F, Nystrom T. A simple intravenous glucose tolerance test for assessment of insulin sensitivity. Theor Biol Med Model. 2011;8(1):12. doi:10.1186/1742-4682-8-12.
- Kulkarni KR, Garber DW, Marcovina SM, Segrest JP. Quantification of cholesterol in all lipoprotein classes by the VAP-II method. J Lipid Res. 1994;35(1):159–68.
- Kulkarni KR, Garber DW, Schmidt CF, Marcovina SM, Ho MH, Wilhite BJ, Beaudrie KR, Segrest JP. Analysis of cholesterol in all lipoprotein classes by single vertical ultracentrifugation of fingerstick blood and controlled-dispersion flow analysis. Clin Chem. 1992;38(9):1898–905.
- Kulkarni KR, Stewart T, Maddox E. Low density lipoprotein particle concentration measurement by the verticle lipoprotein profile (VLP) method, Birmingham, AL. National Lipid Association. 2014;8(3):(Abstract 103).
- Maki KC, Dicklin MR, Davidson MH, Mize PD, Kulkarni KR. Indicators of the atherogenic lipoprotein phenotype measured with density gradient ultracentrifugation predict changes in carotid intima-media thickness in men and women. Vasc Health Risk Manag. 2012;8:31–8.
- Tan SY, Mattes RD. Appetitive, dietary and health effects of almonds consumed with meals or as snacks: a randomized, controlled trial. Eur J Clin Nutr. 2013;67(11):1205–14. doi:10.1038/ejcn.2013.184.
- Dhillon J, Tan SY, Mattes RD. Almond consumption during energy restriction lowers truncal fat and blood pressure in compliant overweight or obese adults. J Nutr. 2016;146(12):2513–19. doi:10.3945/jn.116.238444.
- Bowen J, Luscombe-Marsh ND, Stonehouse W, Tran C, Rogers GB, Johnson N, Thompson CH, Brinkworth GD. Effects of almond consumption on metabolic function and liver fat in overweight and obese adults with elevated fasting blood glucose: A randomised controlled trial. Clin Nutr ESPEN. 2019;30:10–8. doi:10.1016/j.clnesp.2018.12.088.
- Wallace TM, Levy JC, Matthews DR. Use and abuse of HOMA modeling. Diabetes Care. 2004;27(6):1487–95. doi:10.2337/diacare.27.6.1487.
- Hyde PN, Sapper TN, Crabtree CD, LaFountain RA, Bowling ML, Buga A, Fell B, McSwiney FT, Dickerson RM, Miller VJ, et al. Dietary carbohydrate restriction improves metabolic syndrome independent of weight loss. JCI Insight. 2019;4(12) doi:10.1172/jci.insight.128308.
- Phung OJ, Makanji SS, White CM, Coleman CI. Almonds have a neutral effect on serum lipid profiles: a meta-analysis of randomized trials. J Am Diet Assoc. 2009;109(5):865–73. doi:10.1016/j.jada.2009.02.014.
- Liu Y, Hwang HJ, Kim HS, Park H. Time and Intervention Effects of Daily Almond Intake on the Changes of Lipid Profile and Body Composition Among Free-Living Healthy Adults. J Med Food. 2018;21(4):340–7. doi:10.1089/jmf.2017.3976.
- Lee Y, Berryman CE, West SG, Chen CO, Blumberg JB, Lapsley KG, Preston AG, Fleming JA, Kris-Etherton PM. Effects of dark chocolate and almonds on cardiovascular risk factors in overweight and obese individuals: a randomized, controlled-feeding trial. J Am Heart Assoc. 2018;6(12) doi:10.1161/JAHA.116.005162.
- Maki KC, Lawless AL, Kelley KM, Kaden VN, Geiger CJ, Palacios OM, Dicklin MR. Corn oil intake favorably impacts lipoprotein cholesterol, apolipoprotein and lipoprotein particle levels compared with extra-virgin olive oil. Eur J Clin Nutr. 2017;71(1):33–8. doi:10.1038/ejcn.2016.169.
- Musunuru K, Kathiresan S. Surprises from genetic analyses of lipid risk factors for atherosclerosis. Circ Res. 2016;118(4):579–85. doi:10.1161/CIRCRESAHA.115.306398.
- Ference BA. Causal effect of lipids and lipoproteins on atherosclerosis: lessons from genomic studies. Cardiol Clin. 2018;36(2):203–11. doi:10.1016/j.ccl.2017.12.001.
- Estrada-Luna D, Ortiz-Rodriguez MA, Medina-Briseno L, Carreon-Torres E, Izquierdo-Vega JA, Sharma A, Cancino-Diaz JC, Perez-Mendez O, Belefant-Miller H, Betanzo-Cabrera G. Current therapies focused on high-density lipoproteins associated with cardiovascular disease. Molecules. 2018;23(11):2730. doi:10.3390/molecules23112730.
- Neale EP, Tapsell LC, Guan V, Batterham MJ. The effect of nut consumption on markers of inflammation and endothelial function: a systematic review and meta-analysis of randomised controlled trials. BMJ Open. 2017;7(11):e016863. doi:10.1136/bmjopen-2017-016863.
- Jung H, Chen CO, Blumberg JB, Kwak HK. The effect of almonds on vitamin E status and cardiovascular risk factors in Korean adults: a randomized clinical trial. Eur J Nutr. 2018;57(6):2069–79. doi:10.1007/s00394-017-1480-5.
- Rajaram S, Connell KM, Sabate J. Effect of almond-enriched high-monounsaturated fat diet on selected markers of inflammation: a randomised, controlled, crossover study. Br J Nutr. 2010;103(6):907–12. doi:10.1017/S0007114509992480.
- Liu JF, Liu YH, Chen CM, Chang WH, Chen CY. The effect of almonds on inflammation and oxidative stress in Chinese patients with type 2 diabetes mellitus: a randomized crossover controlled feeding trial. Eur J Nutr. 2013;52(3):927–35. doi:10.1007/s00394-012-0400-y.
- Chen CO, Holbrook M, Duess MA, Dohadwala MM, Hamburg NM, Asztalos BF, Milbury PE, Blumberg JB, Vita JA. Effect of almond consumption on vascular function in patients with coronary artery disease: a randomized, controlled, cross-over trial. Nutr J. 2015;14(1):61. doi:10.1186/s12937-015-0049-5.
- Trabulsi J, Schoeller DA. Evaluation of dietary assessment instruments against doubly labeled water, a biomarker of habitual energy intake. Am J Physiol Endocrinol Metab. 2001;281(5):E891–9. doi:10.1152/ajpendo.2001.281.5.E891.
- Murakami K, Livingstone MB. Prevalence and characteristics of misreporting of energy intake in US adults: NHANES 2003-2012. Br J Nutr. 2015;114(8):1294–303. doi:10.1017/S0007114515002706.
- Maki KC, Kelley KM, Lawless AL, Hubacher RL, Schild AL, Dicklin MR, Rains TM. Validation of insulin sensitivity and secretion indices derived from the liquid meal tolerance test. Diabetes Technol Ther. 2011;13(6):661–6. doi:10.1089/dia.2010.0240.