
Abstract
Background: Significant inverse correlations between circulating vitamin D3 and the presence and strength of common clinical entities influenced by insulin resistance (IR) have been reported. Among these entities are common maladies such as the metabolic syndrome (MS) and nonalcoholic fatty liver disease (NAFLD). Since hypovitaminosis D3 is considered a common worldwide health disturbance, the consequences emanating from such relationships once soundly established might reasonably be ameliorated by vitamin replacement. Accordingly, a need exists for definitive confirmatory support for the existence of these linkages particularly in ordinary, relatively healthy individuals.
Methodology: Many aspects of MS and NAFLD were examined in healthy females via linear regression analyses to determine significant correlations mainly using vitamin D3 and fasting blood glucose (FBG), the latter a surrogate for IR, as independent variables.
Results: A descending linear regression between vitamin D3 and FBG did not reach full statistical significance, but a negative correlation of vitamin D3 with HbA1C was statistically significant and that with circulating insulin concentrations showed a downward statistical trend. These findings are consistent with previous ones by others suggesting an ameliorating effect of vitamin D3 on IR. Body weight, body mass index (BMI), and body fat correlated statistically significantly with vitamin D3 levels, as did systolic blood pressure. Again, these correlations were negative instead of positive unlike the case when FBG was the independent variable. The significant negative correlation of ALT with vitamin D3 was also consistent with previous reports that higher circulating vitamin D3 favorably influences the extent and intensity of NAFLD.
Conclusions: Employing FBG as a surrogate for IR and ALT for status of NAFLD, linear correlations reasonably suggest that increasing circulating vitamin D3 can favorably influence the initial development of and/or strength of risk factors for MS including NAFLD in relatively fit females.
Introduction
It is generally recognized that certain chronic metabolic health disorders primarily connected to poor lifestyle choices in diet and/or exercise are associated with disturbed glucose-insulin metabolism – particularly insulin resistance (IR) [Citation1–6]. Unfortunately, these IR-linked perturbations appear to be gaining in frequency and intensity throughout the world. Hope still exists, however, to favorably modify these maladies by returning insulin sensitivity back toward optimal status. In this regard, numerous studies have made intriguing connections between the level of circulating vitamin D3 and the following IR-involved perturbations: type 2 diabetes mellitus (T2DM) [Citation7–13], the metabolic syndrome (MS) [Citation14–17], as well as obesity [Citation10–12, Citation18] and nonalcoholic fatty liver disease (NAFLD) [Citation19–25] – to be more exact, the higher the vitamin D3 levels, the healthier the situation regarding the occurrence and strength of the metabolic disturbances. The latter relationship now is particularly unfortunate; because along with the increasing chronic health maladies also mentioned above, hypovitaminosis D3 is prevalent worldwide [Citation7, Citation19]. Accordingly, definitively proving existence of links between these chronic disturbances and vitamin D3 lack could lead to preventing, ameliorating, and even curing them at least to some extent by simple replacement.
Recently, we examined linear correlations between a variety of surrogates for IR in non-diabetics and the various elements of MS including obesity, and NAFLD [Citation26, Citation27]. While FBG proved to be the most practical proxy for IR in our hands, we also found significant correlations when providing circulating insulin levels, HbA1C, and the ratio triglyceride/HDL-cholesterol as surrogates for IR in the plethora of correlations [Citation26, Citation27]. In addition, we employed ALT to determine presence and intensity of NAFLD [Citation24, Citation25]. In those cases, worsening risk factors for the various entities and their elements were discovered even with supposedly non-pathologic increases in IR and/or hepatic fat accumulation estimated by the use of their surrogates [Citation28, Citation29]. These happenings have been referred to as “continuum of risks” – a principle purporting that risks for medical perturbations can exist even in the so-called normal ranges of analytic values devoid of diagnostic implications [Citation28].
Hence, the not mutually exclusive aims in the present investigation were twofold: first, to further establish significant links between circulating vitamin D3 levels and the status of IR in relatively healthy females and second, to determine more specifically by comparing a variety of correlations made with vitamin D3 and FBG as the independent variables any potential beneficial effects that vitamin D3 replacement could have on IR-associated medical entities.
Material and methods
Study design
Data for this cross-sectional assessment were obtained from baseline materials gathered from a single earlier study that previously reported on 107 females. When entering the initial clinical investigation, all participants gave written informed consent that complied with the Helsinki Declaration as approved by the RCRC Institutional Review Board. Permission was given to use the obtained data for future research as long as the sources remained unidentified. Some data from this group were used originally in a report examining age-related blood pressure elevation [Citation30]. The intent of the initial study was to assess average female individuals. In doing so, many volunteers were overweight or obese with a group average body mass index (BMI) of 28.7 kg/m2 ±1.1 (SEM) (range 16.9 kg/m2 to 50.6 kg/m2).1 The average age was 56.1 years ± 1.2 (SEM)(range 29 years to 80 years). With one exception where a single reading of 132 mg/dl was found, the initial FBG level was below 125 mg/dl in every other case.
In the original enrollment, after reviewing the study with a research technician, volunteers were provided with a copy of the study’s informed consent and were asked to review it with their personal physicians to insure they had no medical conditions that would preclude their participation in the previous particular study. After fasting overnight, participants returned to the research facility and fulfilled much of the test battery described below. The 107 subjects completed a baseline test battery that in most cases included: total-body DEXA measures of body composition, blood pressure and resting heart-rate, blood chemistries, and a complete blood count (CBC) panel. Bloods were drawn at a Lab Corps Service Center of the subject’s choice (www.labcorp.com).
Specific testing
Body composition
In contrast to scale weight readings, which reflect how much not what kind of weight is lost, dual energy x ray absorptiometry (DEXA) measurements were used that provide for assessment of the kind of weight lost—fat mass (FM), fat-free mass (FFM) and bone mineral density (BMD) [Citation31]. Measurements were made using a constant potential energy source at 78 kVp and a K-edge filter (cerium) to achieve a congruent, stable, dual-energy beam with effective energies of 40 and 70 keV. The unit performs a series of transverse scans moving from head to toe at one mm intervals; the scan area was approximately 60 cm × 200 cm. Data were collected for about 120 pixel elements (5 × 10 mm) per transverse. Total body measurements were typically completed in ∼10 minutes with a scan speed of 16 cm/sec or in ∼20 minutes with a scan speed of eight cm/sec. The R-value (ratio of low to high-energy attenuation in soft tissue) ranged from 1.20 to 1.47.
Blood chemistries
After fasting overnight, subjects had venous blood samples drawn at a local drawing station of their choice. Blood samples were collected in EDTA (one mg per milliliter) and were centrifuged within four hours, the plasma was separated, and the plasma sample shipped at 4 °C to a central laboratory.
Analyses
All linear regression statistical analyses were carried out with KaleidaGraph graphing and data analysis, Version 4.1.3, Synergy Software, Reading PA. A p < 0.05 determined by using a table of correlation coefficients (p Value from Pearson (r) Calculator) was considered to be statistically significant.
Results
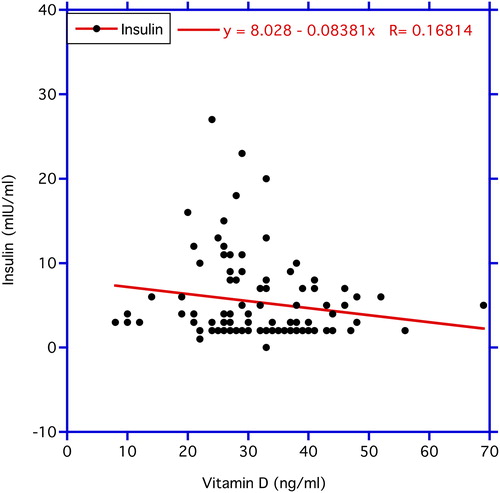
In , correlations between chronological age vs. circulating FBG and vitamin D3 levels are illustrated. FBG correlates significantly positive with age (p < 0.03). In contrast, no statistical significance is found in the correlation of age with vitamin D3 concentrations. In , the correlation between vitamin D3 and FBG was negative but not statistically significantly so (r = −0.118, n = 99, p = 0.24). In contrast, the negative correlation between vitamin D3 as the independent variable and ALT as the dependent variable depicted in the same figure proved significant (r = −0.219, n = 105, p < 0.05). reveals a significant negative correlation between vitamin D3 and HbA1C (r = −0.194, n = 105, p < 0.05), while the correlation between vitamin D3 and insulin levels in displays a trend (r = −0.168, n = 105, p < 0.10 > 0. 05).
Figure 1. Correlations between age (independent variable) and fasting glucose (FBG) and vitamin D3 levels (dependent variables). The rise in FBG levels with age is statistically significant at p < 0.03, whereas aging correlations are not significant for vitamin D3.
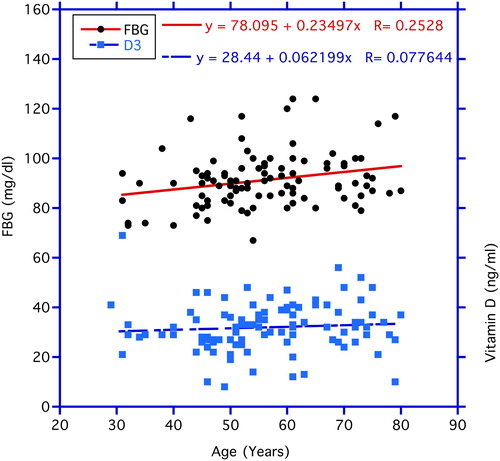
Figure 2. Correlations between vitamin D3 (independent variable) and fasting blood glucose (FBG) and ALT levels (dependent variables). The decrease in the ALT levels with increasing circulating vitamin D3 is statistically significant at p < 0.03, whereas, the correlation with FBG does not reach statistical significance.
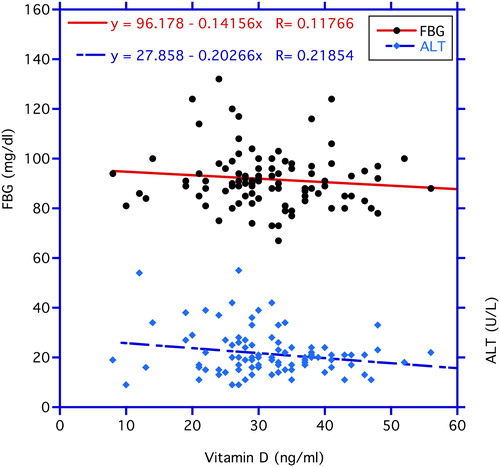
Figure 3. Correlation between vitamin D3 (independent variable) and HbA1C level (dependent variable). The decrease in the HbA1C levels with increasing circulating vitamin D3 is statistically significant at p < 0.05.
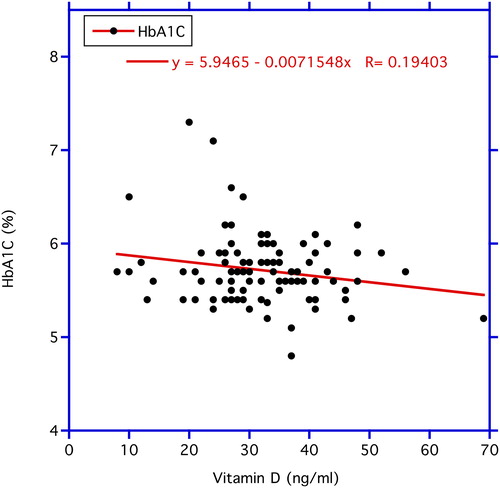
Figure 4. Correlation between vitamin D3 (independent variable) and circulating insulin level (dependent variable). The decrease in the HbA1C levels with increasing circulating vitamin D3 reveals a statistically significant trend at p < 0.10 > 0.05.
In , when vitamin D3 is the independent variable, linear slopes are predominantly negative whereas, the same slopes with FBG being the independent variable are positive. Accordingly, increases in circulating vitamin D3 concentrations appear to improve overall health by lessening various risk factors, while positive correlations in FBG represent increase in the strength of the risk factors. These divergent correlations occur in body composition (body weight, BMI, body fat, body fat percent); in cardiac dynamics (systolic blood pressure); and in blood chemistries (insulin concentration, HbA1C, and ALT).
Table 1. Vitamin D3 levels compared to circulating glucose levels as independent variables in female subjects. Average age: 56.1 years ± 1.2 (SEM) with a range of 29–80 years.
Discussion
Various chronic metabolic disorders are becoming more ubiquitous and severely harmful in the aging populations worldwide, and much of this is attributed to the development of a health issue referred to as “insulin resistance” (IR) [Citation5, Citation6, Citation32–34]. Approximately a century ago after the isolation and purification of insulin by Banting and colleagues, it was the general belief that diabetes, an abnormal increase in circulating glucose, was solely due to a shortage of available insulin [Citation35]. So, the general conviction was that diabetes is curable, because lack of insulin could now be dealt with. Very soon after time wise however, another form of diabetes was discovered when it was observed that an unexpected increase of insulin in the blood stream could be present even in the face of abnormally high circulating glucose concentrations [Citation36]. Ironically, this happening was more common than that described in the original diabetes with low circulating insulin (type 1). This newer, more abundant form attributed greatly to the aforementioned IR was referred to, of course, as type 2 diabetes mellitus (T2DM). Perhaps as important to the whole health scenario, IR is generally accepted to be a crucial driving force behind the linked components of the metabolic syndrome (MS) including nonalcoholic fatty liver disease (NAFLD) [Citation5, Citation6, Citation24, Citation25].
What exactly is IR? Similar to other endocrine systems such as those involving the thyroid and adrenals, the glucose-insulin system often has a distinctive response to any diminution in hormonal action. In the case of the latter endocrine schema, a tendency exists under certain conditions for peripheral target tissues such as liver, fat and muscle to experience a lessened, apparently sub-optimal response to insulin over time. To compensate, more insulin is produced and released from the pancreas as a “make-up.” While this comeback has some merit and returns circulating glucose more toward normal, the final response is characteristically slightly higher glucose and insulin levels than prior. Unfortunately, a harmful potential may still exist [Citation29].
Similar happenings health-wise sometimes attain a unique nomenclature, namely “trade off”, because they can bring on immediate benefits but may sooner or later cause future harms [Citation37]. As the organ resistance to insulin becomes greater after a while, the back and forth interaction between glucose and insulin can continue to build. Accordingly, both levels of circulating glucose and insulin may rise progressively and be associated with increasing severity of the risk factors involved in T2DM, as well as MS and NAFLD [Citation29, Citation34].
To state an old axiom, “an ounce of prevention is worth a pound of cure.” Taking this to heart, the concept of a “continuum or risks” mentioned in the introduction needs a more precise description in order to fully realize the meaningful potentials of an early preventative program [Citation28]. As is the case for blood pressure regulation, the earlier an “IR preventive program” begins, the more successful should be the outcome. For better or worse, our evidence indicates that IR perturbations initiate a blossoming variety of risk factors linked to MS, e.g., T2DM and obesity as well as NAFLD, even when circulating levels of glucose and insulin fall within the accepted normal ranges but at the higher levels in those ranges [Citation26–28]. Reasonably, the best option is to begin early to overcome IR in order to prevent eventual pathology arising from long-term exposure to any non-optimal phase of the resistance [Citation38, Citation39].
Besides aging, what else is behind IR that can be used to develop an ideal preventative regimen? Lifestyle choices are very important in this regard. Diets containing too many calories particularly from rapidly absorbed carbohydrates such as table sugars and poor exercise habits gravely influence IR status [Citation40]. However, the public has known about these unhealthful measures for eons, but the mainstream has not been able to effectively comply with the needed remedies. A call for drugs with “insulin sensitizing” capabilities has not come fully to fruition primarily because of ineffectiveness and concomitant adverse reactions – real and potential [Citation34, Citation41]. Leaving aside drugs, natural safe supplements exist that can afford some measure of insulin sensitization [Citation6]. Unfortunately, however, the potential of natural, safe dietary supplements to produce insulin sensitization has not been fully recognized, especially when it comes to the established medical community. Nevertheless, among the latter possibilities, utilization of vitamin D3 as a preventative may be coming into some well-deserved prominence [Citation7].
New avenues for usefulness of vitamin D3 supplementation are becoming apparent with the passage of time [Citation8]. More and more is being written concerning the healthful benefits of vitamin D3 other than in mineral metabolism. Still, some uncertainty about their useful role has been expressed. Even though the ability of vitamin D3 to positively influence the course of major health disorders such as T2DM, MS, and NAFLD has come under closer scrutiny of late, in the words of George et al., “There is currently insufficient evidence of beneficial effect to recommend vitamin D3 supplementation” [Citation8]. With the above settings in mind, we remembered a previous study where a goodly number of vitamin D3 assays had been carried out in the examination of age-related elevated blood pressure. To be exact, vitamin D3 levels were obtained from over 100 females [Citation30].
The material from this previous study was revisited focusing primarily on the vitamin D3 aspects [Citation30]. We, for the most part, relied upon the effects of vitamin D3 circulatory levels during the period of “continuum of risks” for major IR associated health entities [Citation29]. It has been proposed that many risk factors even of a mild nature may have the ability to take their toll over time and even be responsible for a shorter lifespan [Citation38, Citation39]. Similar to previous reports, data from and suggest that higher concentrations of vitamin D3 can lessen the strength of the IR and its associated maladies [Citation42]. Although the negative correlation between vitamin D3 and FBG in did not quite achieve statistical significance in this limited number of volunteers, the association with HbA1C and insulin in and proved respectively statistically significant and trending. So, along with the successful use of FBG in larger previous samples as a surrogate for IR, we believe this justifies its use as an appropriate stand-in for IR in [Citation26,Citation27]. In any case, the correlations showing that low levels of vitamin D3 associate with increases in body weight, general fat accumulation, higher systolic blood pressure values, and increasing ALT levels to go along with hepatic fat accumulation strengthen the hypothesis that vitamin D3 consumption may be helpful in ameliorating or even preventing many future chronic disabling aging perturbations [Citation14, Citation21–23]. Taking the last statement to heart, it is indeed unfortunate that we found in the current study that IR in the form of FBG levels tends to increase during aging but vitamin D3 does not do likewise to help compensate ().
Much confusion has been expressed over the effects of vitamin D3 on lifespan – pro and con [Citation43, Citation44]. Recent studies suggest that improvements of many elements composing the MS over time have the potential to improve lifespan [Citation29, Citation45]. The fact that vitamin D3 can benefit many aspects of MS favors the hypothesis that this vitamin has the potential to improve prospects for longevity [Citation43, Citation46]. Considering the entire above material, vitamin D3 can be added to a list of other safe natural dietary supplements that have ability to improve IR status and thus bring about improved overall health either alone or in conjunction with other components [Citation5, Citation6, Citation47–49]. Suffice it to say, advising the public to use a daily ‘insulin sensitizer” should be seriously considered by health practitioners.
Disclosure statement
The authors declare that they have no conflict of interest.
Notes
1 The BMI of the average woman in the U.S. is 29.6, which falls into the category of “overweight.”
References
- Smyth S, Heron A. Diabetes and obesity: the twin epidemics. Nat Med. 2006;12(1):75–80. doi:10.1038/nm0106-75.
- Ford ES, Giles WH, Dietz WH. Prevalence of the metabolic syndrome among US adults: findings from the third National Health and Nutrition Examination Survey. JAMA. 2002;287(3):356–9. doi:10.1001/jama.287.3.356.
- Emery N. The global diabetes epidemic brought to you by global development. The Atlantic, July 2, 2012. [accessed 2020 Feb 2]. www.theatlantic.com/health/…/07/…diabetes-epidemic…/259305/.
- Dreisbach AW, Batuman V. Epidemiology of hypertension (Updated Dec 29, 2014). [accessed 2020 Feb 2]. http://emedicine.medscape.com/article/1928048-overview#aw2aab6b3.
- Preuss HG, Clouatre D. Potential of diet and dietary supplementation to ameliorate the chronic clinical perturbations of the metabolic syndrome. In: Sinatra S, Houston M, editors. Nutritional and integrative strategies in cardiovascular medicine. (eds), Boca Raton, FL: CRC Press; 2015. p. 148–78..
- Preuss HG, Preuss JM. The global diabetes epidemic: focus on the role of dietary sugars and refined carbohydrates in strategizing prevention. In: Rothkopf MM, Nusbaum MJ, and Haverstick LP, editors. Metabolic medicine and surgery. Boca Raton FL: CRC Press; 2014. p. 183–206.
- George PS, Pearson ER, Witham MD. Effect of Vitamin D3 supplementation on glycemic control and insulin resistance: a systemic review and meta-analysis. Diabet Med. 2012;29:142–50.
- Pittas AG, Lau J, Hu FB, Dawson-Hughes B. The role of vitamin D and calcium in type 2 diabetes. A systematic review and meta-analysis. J Clin Endocrinol Metab. 2007;92(6):2017–29. doi:10.1210/jc.2007-0298.
- Forouhi NG, Luan J, Cooper A, Boucher BJ, Wareham NJ. Baseline serum 25-hydroxy vitamin d is predictive of future glycemic status and insulin resistance: the Medical Research Council Ely Prospective Study 1990-2000. Diabetes. 2008;57(10):2619–25. doi:10.2337/db08-0593.
- Chiu KC, Chu A, Go VL, Saad MF. Hypovitaminosis D is associated with insulin resistance and beta cell dysfunction. Am J Clin Nutr. 2004;79(5):820–5. doi:10.1093/ajcn/79.5.820.
- Zittermann A. Vitamin D in preventive medicine: are we ignoring the evidence? Br J Nutr. 2003;89(5):552–72. doi:10.1079/BJN2003837.
- Johnson JA, Grande JP, Roche PC, Kumar R. Immunohistochemical localization of the 1,25(OH)2D3 receptor and calbindin D28k in human and rat pancreas. Am J Physiol. 1994;267(3 Pt 1):E356–360. doi:10.1152/ajpendo.1994.267.3.E356.
- Gedik O, Akalin S. Effects of vitamin D deficiency and repletion on insulin and glucagon secretion in man. Diabetologia . 1986;29(3):142–5. doi:10.1007/BF02427083.
- Ju SY, Jeong HS, Kim DH. Blood vitamin D3 status and metabolic syndrome in the general adult population: a dose-response meta-analysis. J Clin Endocrinol Metab. 2014;99(3):1053–63. doi:10.1210/jc.2013-3577.
- Ford ES, Ajani UA, McGuire LC, Liu S. Concentrations of serum vitamin D and the metabolic syndrome among U.S. adults. Diabetes Care. 2005;28(5):1228–30. doi:10.2337/diacare.28.5.1228.
- Dimova R, Tankova T, Chakarova N. Vitamin D3 in the spectrum of prediabetes and cardiovascular autonomic dysfunction. J Nutr. 2017;147:1607–15.
- Kharb S, Goel K. Role of vitamin D3 in prediabetes. Annals of Diabetes Res. 2018;2(1):1008.
- Lagunova Z, Porojnicu AC, Lindberg FA, Aksnes L, Moan J. Vitamin D3 status in Norwegian children and adolescent with excess body weight. Pediatr Diabetes. 2011;12(2):120–6. doi:10.1111/j.1399-5448.2010.00672.x.
- Chen L-W, Chien C-H, Kuo S-F, Yu C-Y, Lin C-L, Chien R-N. Low Vit D level was associated with metabolic syndrome and high leptin level in subjects with nonalcoholic fatty live disease: a community-based study. BMC Gastroenterol. 2019;19(1):126. doi:10.1186/s12876-019-1040-y.
- Barchetta I, Angelico F, Ben DM, Baroni MG, Pozzilli P, Morini S, Cavallo MG. Strong association between non-alcoholic fatty liver disease (NAFLD) and low 25(OH) vitamin D3 levels in an adult population with normal serum liver enzymes. BMC Med. 2011;9(1):85. http://www.biomedcentral.com/1741-7015/9/85 doi:10.1186/1741-7015-9-85.
- Liangpunsakul S, Chalasani N. Serum vitamin D3 concentrations and unexplained elevation in ALT among US adults. Dig Dis Sci. 2011;56(7):2124–9. doi:10.1007/s10620-011-1707-x.
- Eliades M, Spyrou E, Agrawal N, Lazo M, Brancati FL, Potter JJ, Koteish AA, Clark JM, Guallar E, Hernaez R. Meta-analysis: Vitamin D and non-alcoholic fatty liver disease . Aliment Pharmacol Ther. 2013;38(3):246–54. doi:10.1111/apt.12377.
- Eliades M, Spyrou E. Vitamin D: a new player in non-alcoholic fatty liver disease? World J Gastroenterol. 2015;21(6):1718–27. doi:10.3748/wjg.v21.i6.1718.
- Preuss HG, Kaats GR, Mrvichin N, Swaroop A, Bagchi D, Clouatre D, Preuss JM. Examining the relationship between nonalcoholic fatty liver disease and the metabolic syndrome in nondiabetic subjects. J Am Coll Nutr. 2018;37(6):457–65. doi:10.1080/07315724.2018.1443292.
- Preuss HG, Kaats GR, Mrvichin N, Bagchi D, Preuss JM. Circulating ALT and AST levels in relatively healthy volunteers over lifespan: assessing aging paradox and nutritional implications. J Am Coll Nutr. 2019;38(8):661–9. doi:10.1080/07315724.2019.1580169.
- Preuss HG, Mrvichin N, Bagchi D, Preuss J, Perricone N, Kaats GR. Importance of fasting blood glucose in screening/tracking over-all health. The Original Internist. 2016;23:13–20.
- Preuss HG, Mrvichin N, Bagchi D, Preuss J, Perricone N, Kaats GR. Fasting circulating glucose levels in the non-diabetic range correlate appropriately with many components of the metabolic syndrome. Original Internist. 2016;23:78–89.
- Preuss HG. Insulin resistance syndrome: a crucial example where a physiological continuum of risks needs attention. In: Bagchi D, Nair S, editors. Nutritional and therapeutic interventions for diabetes and metabolic syndrome. 2nd edition. London, UK: Academic Press; 2018. p. 227–34.
- Preuss HG, Mrvichin N, Kaats GR, Bagchi D, Clouatre D. Reflecting on concepts relevant to contemplating the relationships between glucose-insulin perturbations, nutrition, and aging . J Am Coll Nutr. 2019;38(5):463–9. doi:10.1080/07315724.2018.1529640.
- Preuss HG, Kaats GR. Examining possible causes for age-related blood pressure elevation in 107 females volunteering for a weight loss study. Original Internist. 2011;18:92–5.
- Nugent SD, Kaats GR, Preuss HG. Discordance between body mass index (BMI) and novel body composition change index (BCCI) as outcome measures in weight change intervention. J Amer Coll Nutr. 2018;37:336–41.
- Ginsberg H, Kimmerling G, Olefsky JM, Reaven GM. Further evidence that insulin resistance exists in patients with chemical diabetes. Diabetes. 1974;23(8):674–8. doi:10.2337/diab.23.8.674.
- Reaven GM. Banting lecture 1988. Role of insulin resistance in human disease). Diabetes. 1988;37(12):1595–607. doi:10.2337/diab.37.12.1595.
- DeFronzo RA, Ferrannini E. Insulin resistance. A multifaceted syndrome responsible for NIDDM, obesity, hypertension, dyslipidemia, and atherosclerotic cardiovascular disease. Diabetes Care. 1991;14(3):173–94. doi:10.2337/diacare.14.3.173.
- Banting FG, Best CH, Collip JB, Campbell WR, Fletcher AA. Pancreatic extracts in the treatment of diabetes mellitus. Can Med Assoc J. 1922;12(3):141–6.
- Himsworth H. Diabetes mellitus: a differentiation into insulin-sensitive and insulin-insensitive types. Lancet. 1936;1:127–30.
- Bricker NS. On the pathogenesis of the uremic state. An exposition of off hypothesis"” trade-off. N Engl J Med. 1972;286(20):1093–9. doi:10.1056/NEJM197205182862009.
- Preuss HG. The insulin system in health and disease (Editorial). J Am Coll Nutr. 1997;16(5):393–4. doi:10.1080/07315724.1997.10718702.
- Preuss HG. Effects of glucose/insulin perturbations on aging and chronic disorders of aging: the evidence. J Am Coll Nutr. 1997;16(5):397–403. doi:10.1080/07315724.1997.10718704.
- Preuss HG. The bitter sweet. North Charleston, South Carolina: Marcell Publishing. p. 1–116. 2017.
- Ferrannini E, Haffner SM, Stern MP. Essential hypertension: an insulin resistant state. J Cardiovac Pharmacol. 1990;15(Suppl 3):S18–S25. doi:10.1097/00005344-199000005-00004.
- Mitri J, Muraru MD, Pittas AG. Pittas AG: Vitamin D3 and type 2 diabetes: a systematic review. Eur J Clin Nutr. 2011;65(9):1005–15. doi:10.1038/ejcn.2011.118.
- Mark KA, Dumas KJ, Bhaumik D, Schilling B, Davis S, Oron TR, Sorensen DJ, Lucanic M, Brem RB, Melov S, et al. Vitamin D promotes protein homeostasis and longevity via the stress response pathway genes skn-1, ire-1, and xbp-1. Cell Rep. 2016;17(5):1227–37., : doi:10.1016/j.celrep.2016.09.086.
- Noordam R, de Craen AJ, Pedram P Pedram P, Maier AB, Mooijaart SP, van Pelt J, Feskens EJ, Streppel MT, Slagboom PE, Westendorp RG, et al. Levels of 25-hyroxyvitamin D3 in familial longevity: the Leiden Longevity Study. Canadian Medical Asssoc J. 2012;184(18):E963–E968.: doi:10.1503/cmaj.120233.
- Preuss HG, Echard B, Clouatre D, Bagchi D, Perricone NV. Niacin-bound chromium increases life span in Zucker Fatty Rats. J Inorg Biochem. 2011;105(10):1344–9. doi:10.1016/j.jinorgbio.2011.01.005.
- Angellotti E, Pittas AG. The role of vitamin D in the prevention of type 2 diabetes: to D or not to D?. Endocrinology. 2017;158(7):2013–21. doi:10.1210/en.2017-00265.
- Imanparast F, Javaheri J, Kamankesh F, Rafiei F, Salehi A, Mollaaliakbari Z, Rezaei F, Rahimi A, Abbasi E. The effects of chromium and vitamin D3 co-supplementation on insulin resistance and tumor necrosis factor-alpha in type 2 diabetes: a randomized placebo controlled trial. Appl Physiol Nutr Metab. 2020;45(5):471–7. doi:10.1139/apnm-2019-0113.
- Wimalawansa SJ. Associations of vitamin D with insulin resistance, obesity, type 2 diabetes, and metabolic syndrome. J Steroid Biochem Mol Biol. 2018;175:177–89. doi:10.1016/j.jsbmb.2016.09.017.
- Wimalawansa SJ. Causes, benefits and consequences of vitamin D deficiency. Int J Endocrinol Diabetes. 2019;2(1):108.