
Abstract
Consumption of saturated fat causes deleterious effects on health, which could be minimized through physical activity and foods with functional characteristics consumption. The aim of the study was to evaluate the beverage rich in resveratrol consumption and physical exercise in gut microbiota, body composition, lipid peroxidation, interleukin-6 (IL6) concentration and systolic blood pressure (SBP) of rats to the high-fat diet. Wistar rats were fed with control diet, high-fat diet (HFD), HFD and 15 mL solution of resveratrol, HFD and 15 mL of grape juice, HFD and 10 mL of red wine. All animals performed the physical training protocol five days a week. Grape juice and red wine composition were analyzed, SBP, body mass, consumption, adiposity and body composition, gut microbiota, lipid peroxidation and inflammation were evaluated. The grape juice (114.8 ± 22.5 mmHG) and red wine (129 ± 15.8 mmHg) groups showed lower SBP when compared to HFD (216.8 ± 20.6 mmHg) (p < 0.0001). The grape juice group (GJG) (39.1 ± 7) had a higher number of microbiota bands DNA when compared to the other groups (p = 0.002). The GJG (33.7 ± 6.7 pg/mL) presented lower concentration IL6 when compared to high-fat group (47.3 ± 16 pg/mL) (p = 0.003). GJG (4.7 ± 1.2 nmol/L) presented a lower concentration of TBARS when compared to control group (6.1 ± 1.4 nmol/L) and resveratrol group (6.6 ± 0.9 nmol/L), and the red wine group (7.4 ± 1.2 nmol/L) had a higher concentration of TBARS when compared to control group and GJG (p = 0.0001). The consumption of these beverages, especially grape juice, together with physical exercise, was able to promote beneficial changes even in the presence of a HFD.
Introduction
In recent decades, changes in lifestyle have led to changes in western population dietary pattern, characterized by a diet with high energy density and rich in lipids. The diet consumed nowadays is rich in vegetable oils, such as soy and sunflower oil (rich in omega-6), and in processed foods are rich in saturated fatty acids (Citation1).
Omega-6 is a polyunsaturated fatty acid that, although it plays an essential role for many physiological functions. Its excessive consumption can trigger eicosanoids synthesis with pro-inflammatory characteristics, contributing to oxidative stress and lipid peroxidation (Citation2). In relation to saturated fatty acids, present in processed foods, it is elucidated in the literature their excessive consumption is considered harmful, since it has a pro-inflammatory and pro-oxidative effect. In addition, processed foods have trans fatty acids (created through industrial processes) which are associated with oxidative stress and inflammation (Citation3, Citation4).
Therefore, the exacerbated consumption of high saturated fat along a sedentary lifestyle leads to the development of several non-transmissible chronic diseases, mainly obesity, characterized by the excessive accumulation of white adipose tissue, associated with several comorbidities such as hypertension, diabetes and cardiovascular diseases (CVD), in addition contributing to increment in abdominal obesity, oxidative stress, intestinal dysbiosis and systemic inflammation (Citation5, Citation6).
The increase in visceral adiposity is associated with low-grade systemic inflammatory state and decreased insulin sensitivity. In addition, there is evidence that part of the inflammatory process associated with obesity originates from the gastrointestinal tract, since the diet rich in saturated fat causes dysbiosis and gut epithelial barrier integrity impairment, which could lead to the translocation of pro-inflammatory factors to blood circulation (Citation7, Citation8).
Therefore, there is a growing interest in non-pharmacological strategies that could affect or reverse the deleterious effects of dietary high-fat consumption and obesity, through changes in diet and lifestyle. Currently, food with functional properties consumption is widely used as a nutritional treatment due to its beneficial health effects, low cost and easy access to the population (Citation9, Citation10).
Grapes and their derivatives are rich in several polyphenols, among them catechin, epicatechin, quercetin, anthocyanins and procyanidins and its main bioactive compound, resveratrol. Resveratrol (RSV) is a polyphenol present in grape bark and abundant in grape juice and red wine. It has received considerable attention due to its antioxidant, anti-inflammatory and thermogenic effects (Citation11, Citation12). It has positive effects on obesity through decreased white adipose tissue mass and resistance to weight gain (Citation12). In addition, it has also been found resveratrol consumption modulating gut microbiota and its antioxidant properties reducing oxidative stress, as well as protecting tissues against oxidative lesions caused by numerous factors such as environmental aggression, stress and poor diet (Citation13).
Thus, the objective of this study was to evaluate the effects of consumption of beverages rich in resveratrol and physical exercise in the gut microbiota profile, body composition, lipid peroxidation, IL-6 concentration and blood pressure of Wistar rats to the high-fat diet.
Materials and methods
Animals
Rattus novergicus, albinus, Wistar, females, 90 days, initially weighting around 230 g, were used from UFF. The animals were kept in individual polypropylene cages, in a room with controlled temperature (23 ± 2 °C) and humidity-controlled (60 ± 10%) room, with artificial dark-light cycle (lights on at 07.00 am and lights off at 07.00 pm).
The biological assay was carried out in the Laboratório de Nutrição Experimental da Faculdade de Nutrição Emília de Jesus Ferreiro na Universidade Federal Fluminense (UFF). This study was approved by the Ethics Committee responsible for research in laboratory animals of the UFF and has been approved, protocol number 473/2013. All animals were handled in accordance with the ethical principles adopted by the Brazilian Society of Science in Laboratory Animals (SBCAL) and all efforts were made to minimize animal suffering.
Experimental protocol
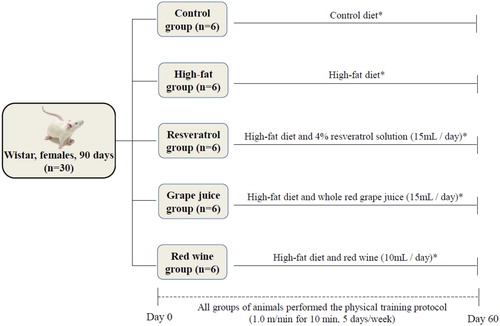
The animals were divided in 5 groups (n = 6/group), with diets based on casein and water offered ad libitum: Control Group (CG), receiving balanced diet; High-fat group (HFG), receiving High Fat Diet containing 42.6% of total energy value in fat (HFD); Resveratrol group (RG) receiving HFD and 4% resveratrol solution (15 mL/day); Grape juice group (GJG) receiving HFD and whole red grape juice (15 mL/day); Red wine group (RWG) receiving HFD and red wine (10 mL/day). Animals were subjected to 60 days of treatment and physical training. The experimental protocol is outlined in .
Figure 1. Experimental protocol. Diets and beverages were administered during a period of 60 days. Day 0: Division of groups and start of the experimental protocol; Day 60: Last day of the experimental protocol; *diets and water offered ad libitum.
Physical training
All animals groups were submitted to adaptation on a treadmill for small animals with 6 bays and activated by a 12 V motor, the adaptation period began two weeks before the beginning of the experiment. During the adaptation period, animals were placed on the treadmill three days a week on alternate days and each training day was increased one minute starting with three minutes and increasing one minute a day until reaching eight minutes, speeds varied: 0.3 m/min, 0.4 m/min, 0.6 m/min, 0.8 m/min and 0.9 m/min. In the beginning of the experiment, after animals completed 90 days of life, the five animals groups executed the running protocol at a speed of 1.0 m/min for the slip of the canvas and, consequently, induced movement of the animal under study. Training sessions lasted 10 minutes, performed for 60 days, five days a week until the end of the experiment (Citation14).
Experimental diets and beverages rich in polyphenols
Control and HFD diets formulations (Charts 1 and 2) were based on American Institute of Nutrition (AIN, 1993 M) recommendations for Rattus norvegicus and manipulated at Laboratório de Nutrição Experimental 12. The HFD presents has lard in its composition in substitution of soybean oil. Lard, juice and wine were purchased from local market and resveratrol purchased from a manipulation pharmacy. The grape juice used was Aurora® brand of red grapes, obtained from American grapes, Bordô and Jacquez, produced in Rio Grande do Sul – Brazil. The red wine came from the Goés® Winery, Goés Tempos Carbenet Sauvignon Demi-Sec line, obtained from 100% Cabernet Sauvignon grapes, produced in São Paulo – Brazil (Chart 3).
Chart 1. Control and high-fat diets composition used in the experiment.
Chart 2. Macronutrient composition of the diets used in the experimented.
Chart 3. Nutritional information on the resveratrol solution, the whole red grape juice and the red wine used in the experiment (in 100 mL).
Grape juice and red wine antioxidant capacity, total polyphenols and anthocyanin content concentrations
Samples of the first batch used for each drink were analyzed, from the same bottles offered to the animals. For the different analyzes, the samples were homogenized and separated in aliquots. The analyzes were performed in triplicate.
Antioxidant capacity
For this analysis it was used extractable and hydrolyzable extracts of investigated samples using, 2,2-diphenyl-1-picryl-hydrazil (DPPH), outlined by Brand-Williams (1995). From this procedure, the percentage of DPPH remaining in the reaction medium was determined were the antioxidant activity corresponds to the amount of DPPH consumed by the antioxidant.
In test tubes, a 100 µL aliquot of the sample was placed with 4.9 mL of DPPH. Then the tubes were vortexed and after 30 minutes of rest 300 µL were added to the plate for the test and the absorbance was measured on an Elisa reader at a wavelength of 515 nm (Citation15).
Total polyphenols concentration
The phenolic compounds was determined by the Folin-Ciocalteu method, where 100 µL of the sample was placed in a test tube with 500 µL of the extraction solution, vortexed for 30 seconds and taken to the water bath at 90 °C for 3 hours. Afterwards, the total volume was made up with methanol up to 1000 µL (addition of 400 µL) then the samples were centrifuged for 5 minutes at 6103 RCF. The supernatants were separated for the analysis of polyphenol concentrations by the Folin-Ciocalteau solution.
In a plate, 30 µL were pipetted, in triplicate, of each extract (the supernatants) together with 75 µL of the Folin-Ciocalteau solution. After 5 minutes, 120 µL of water and 75 µL of sodium carbonate solution (20%) were added to each well. After 30 minutes of adding the Folin-Ciocalteau solution, the plate was taken for reading on the spectrophotometer at 750 nm.
The phenolic compounds content in the sample was calculated and, based on the obtained concentration, the final polyphenol content was calculated Singleton (Citation16).
Total anthocyanins quantification
Anthocyanins concentration calculus was based on the molar extinction coefficient of cyanidin-3-glucoside 26,900 and a molecular mass of 449.2 g/mol. The results were expressed in milligrams of cyanidin-3-glucoside equivalents per 100 g of dry weight base (Citation17).
Consumption and body mass
Daily feed intake in grams and energy and body weight were measured weekly, twice a week, throughout the experimental period.
Blood pressure
Systolic blood pressure (SBP) was measured by tail plethysmography (Tail Plethysmograph 1.10 - Insight). The animals were packed in cylindrical tubes with tail opening for 5 consecutive days for 10 minutes for adaptation. After adaptation, the SBP protocol started, where the sensor cuff coupled to the tail of the animals captured the signals to be recorded on the computer by the manufacturer's software (Insight, São Paulo). The measurements were performed in the morning, with the animals awake, considering only the values obtained in the absence of spontaneous movement of the tail of the animal. SBP was measured at the beginning and at the end of the 60 day experiment (Citation18).
Body composition
At the end of 60 days of treatment, the animals were anesthetized with Thiopentax® (thiopental sodium, 0.1 mg/100g). The length (in cm, measured as the distance from the tip of the nose to the tip of the tail) was evaluated and the animals were then submitted to Dual-energy X-ray Absorptiometry (DXA) using a GE Lunar iDXA 200,368 instrument (Lunar, Wisconsin, USA), with specific software (Bis 2008 Version 12.20 GE Healthcare). The evaluation was carried out blindly, since the apparatus technician did not know the experimental protocol (Citation19).
Gut microbiota
Animals feces samples were collected and transferred to eppendorf microtubes and stored in a freezer (-80° C) for further analysis. DNA from fecal samples was extracted through the Xpedition ™ Soil/Fecal Kit. DNA MiniPrep (Zymo, Irvine, California, USA) according to the manufacturer's instructions. Extracted DNA integrity and quality were analyzed by gel electrophoresis in 0.8% agarose with 0.5 TBE buffer (45 mM Tris- borate, 1 mM EDTA, pH 8.0).
Denaturing gradient gel electrophoresis (DGGE) of the amplified extracted, DNA was performed using a DCode system universal mutation detection system Bio-Rad® (VA, USA). The products were analyzed to be applied directly to the gel containing 6% (w/v) polyacrylamide and 0.5 x TAE (20 mM Tris-acetate [pH 7.4], 10 mM sodium acetate, 0.5 mM EDTA). The gel contained 6% acrylamide with a gradient of 45–65% denaturant (urea and formamide). The electrophoresis time was 16 h at 60 °C and 75 V. After electrophoresis, the gel was stained for 40 min with SYBR Gold I (Molecular Probes, Inc., OR, USA) and scanned in image capture system STORM™ 860 Imaging System (GE Healthcare, USA). Results were presented as dendrograms constructed after image capture and analysis by Pearson correlation coefficients (r). Cluster analysis was performed by the unweighted pair group method with average linkages (UPGMA) using BioNumerics Software (Applied Math, Belgium) (Citation20).
Collection of blood and adipose tissue
For blood collection, the animals were fasted for 6 hours and after body composition analyzes, still anesthetized, were submitted to the meto-pubic incision with subsequent opening of the thoracic and abdominal cavities. After, the blood was collected by cardiac puncture until total exsanguination in tubes without anticoagulant and centrifuged at 1831 g for 20 minutes to obtain the serum, the centrifuge used was SIGMA® brand.
Adipose tissue: retroperitoneal, mesenteric and gonadal were excised and weighed (g) using an analytical balance Sartorius TE214S, Chicago, USA. The weight will be corrected per 100 g/body weight.
Interleukin 6 (IL-6)
Serum IL-6 concentration was performed by the Enzyme Linked Immuno Sorbent Assay (ELISA) method using the Rat IL-6 ELISA kit (Catalog number BMS625). In this methodology, 50 µL of Matrix C are added to each well containing the standard dilutions and 50 µL of the Test Buffer to each well containing samples. Afterwards, 50 µL of diluted serum samples were added to the wells containing the Assay Buffer. After incubation at room temperature for 2 hours while shaking at 1221 RCF, 100 µL of IL-6 rat detection antibody solution was added to each well. 100 µL of Avidin-HRP A solution was added to each well, then 100 µL of Substrate Solution F was added to each well and incubated for 10 minutes in the dark. The wells containing rat IL-6 were blue in color with an intensity proportional to their concentration. The reaction is stopped when adding 100 µL of Stop Solution to each well. Solution color changed from blue to yellow. At the end, the absorbance was read in a microplate reader (Synergy H1 Hybrid Reader - Biotek) at 450 nm within 30 minutes.
Lipid peroxidation
Malondialdehyde (MDA) analysis was performed by the thiobarbituric acid method (TBARS) measured according to the method described by Ohkawa et al., where 35 µL of 8.1% SDS, 385 µl of 1% phosphoric acid, 210 µL of TBARS 0.6% and 70 µl serum. The tubes were capped, vortexed and placed in a 95° C dry water bath for 1 hour. After this period, it was centrifuged for 15 minutes at 400 rpm. After the centrifugation, 200 µl of the supernatant was passed to one well of the plate (duplicate) and absorbance was measured on a microplate reader (Synergy H1 Hybrid Reader - Biotek) at wavelength of 532 nm. The standard curve was performed and the MDA quantification present in the sample was obtained by interpolation of the standard curve. The level of lipid peroxidation was expressed in nmol of MDA/ml of serum of the animals (Citation21).
Statistical analysis
The results were expressed through descriptive statistics as mean and standard deviation (SD). The data were evaluated for their normality using the Shapiro-Wilk test. For the analysis of the drinks used in the experiment, unpaired t test was used. For comparison among groups the Kruskal-Wallis test with Dunn's post test or ANOVA one-way with Tukey post test weres used when apropriate. The results presenting p < 0.05 were considered significant. GraphPadPrims version 5.0 software was used for these analyzes.
Results
From grape juice and red wine analysis used in the experiment, it was possible to observe grape juice with a higher antioxidant capacity (p = 0.001), as well as higher levels of total polyphenols (p = 0.0003) and (p = 0.004) when compared to red wine ().
Table 1. Grape juice and red wine antioxidant capacity, concentration, total polyphenols and anthocyanin content.
Concerning daily food intake, the groups receiving the HFD (HFG, RG, GJG and RWG) had the highest food intake when compared to control group (CG) (p = 0.0002) (). There were no body mass differences among groups before (p = 0.07) and after 60 days of experiment (p = 0.95) ().
Figure 2. Daily food intake in grams/day (A) and energy/day (B) of the animals followed by 60 days of experiment (n = 6/group). Control Group, fed diet control (CG); high-fat group fed with high-fat diet (HFG); resveratrol group, fed with high-fat diet and receiving 15mL/day of resveratrol solution 4% (RG); grape juice group , fed with high-fat diet and receiving 15mL / day of red grape juice (GJG); group, fed with high-fat diet and receiving 10mL / day of red wine (RWG). Considered significant when p ≤ 0.05. (*) when compared to the CG. ANOVA one-way, Tukey as post-test.
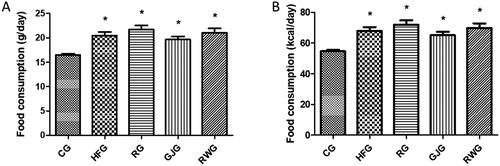
Table 2. Animals initial and final body mass before and after 60 days of experiment.
There was no significant difference in SBP obtained at the beginning of the experiment. According to SBP values measured at the end of the 60 days, the GJG and RWG groups had the lowest when compared to the HFG ().
Table 3. Animals SBP values before and after 60 days of experiment.
These results demonstrate no significant difference in animals body composition analyzed by DXA after 60 days of experiment (). shows animals abdominal fat mass after 60 days of experiment. No significant differences were observed in these results.
Table 4. Animal body composition after 60 days of experiment.
Table 5. Animals abdominal fat mass (corrected per 100 g/body weight) after 60 days of experiment.
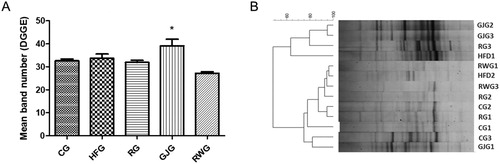
The mean number of bands (), indicative of bacterial profile, was different only in the GJG when compared to the other groups (p = 0.002). According the coefficient of similarity, it was observed no gut microbiota similarity profile ().
Figure 3. Animals mean band number evaluated from the DGGE (A) and Dendrogram per DGGE (B) after 60 days of experiment (n = 6/group).
Control Group, fed diet control (CG); high-fat group fed with high-fat diet (HFG); resveratrol group, fed with high-fat diet and receiving 15mL/day of resveratrol solution 4% (RG); grape juice group, fed with high-fat diet and receiving 15mL/day of grape juice (GJG); red wine group, fed with high-fat diet and receiving 10mL/day of red wine (RWG). Considered significant when p ≤ 0.05. (*) when compared to the other groups. ANOVA one-way, Tukey as post-test.
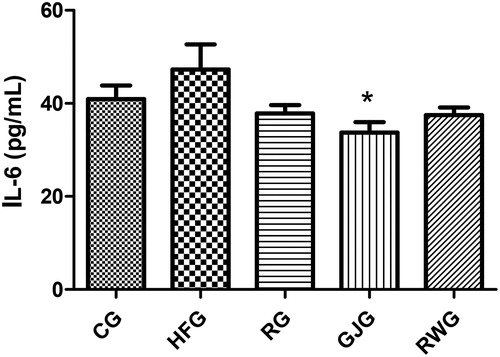
Regarding IL-6, the GJG presented lower concentration when compared to the HFG (p = 0.003) ().
Figure 4. Animals interleukin-6 concentration after 60 days of experiment (n = 6/group). Control Group, fed diet control (CG); high-fat group fed with high-fat diet (HFG); resveratrol group, fed with high-fat diet and receiving 15mL/day of resveratrol solution 4% (RG); grape juice group, fed with high-fat diet and receiving 15mL/day of grape juice (GJG); red wine group, fed with high-fat diet and receiving 10mL/day of red wine (RWG). Considered significant when p ≤ 0.05. (*) when compared to the HFG. ANOVA one-way, Tukey as post-test.
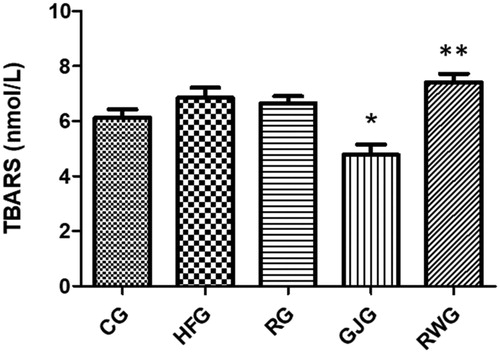
When evaluating lipid peroxidation, it was observed GJG had a lower TBARS concentration compared to the HFG and the RWG had a higher concentration when compared to the CG, RG and GJG (p = 0.0001) ().
Figure 5. Animals TBARS concentration after 60 days of experiment (n = 6/group).
Control Group, fed diet control (CG); high-fat group fed with high-fat diet (HFG); resveratrol group, fed with high-fat diet and receiving 15mL/day of resveratrol solution 4% (RG); grape juice group, fed with high-fat diet and receiving 15mL/day of grape juice (GJG); red wine group, fed with high-fat diet and receiving 10mL/day of red wine (RWG). Considered significant when p ≤ 0.05. (*) when compared to the HFG; (**)when compared to the CG, RG and GJG. Kruskal-Wallis, Dunn’s as post-test.
Discussion
The present study indicates the exposure of Wistar rats to a high-fat diet causes increased blood pressure, inflammation and lipid peroxidation. However, the intervention with grape juice and physical exercise was able to improve this condition and also indicating beneficial effects on gut microbiota.
Grapes polyphenol content is susceptible to factors such as grape variety used in the drink manufacture, vine location, soil, growing conditions, climatic conditions and food production process. The content of resveratrol in grape juice is less than the content found in red wine and in the resveratrol solution, however, it is in accordance with the concentration found in grape juices produced in Brazil (Citation22).
It was possible to observe a higher antioxidant capacity, total polyphenols and anthocyanins concentration the grape juice used when compared to red wine. The juice and wine samples studied were produced in different regions of Brazil and come from different grape species, thus, one can attribute the differences found between antioxidant capacity and polyphenol content to this factor.
In Brazil, grape juices are produced with Vitis labrusca L.grapes species, among them the varieties Isabel, Concord and Bordô (Citation11). Rockenbach et al. (2011) analyzed anthocyanins and polyphenol content concentrations in grapes from different winemakers in Brazil and found a greater amount of anthocyanins in the burgundy variety, although the grapes of the cabernet sauvignon variety showed greater antioxidant capacity (Citation23). The juice used in the present study came from Bordeaux and Jacques variety, thus, the higher concentration of anthocyanins in this drink can be attributed to this fact, since the red wine comes from a different grape variety, the cabernet sauvignon (Citation23).
According to these results, it was observed a higher food intake on groups receiving HFD when compared to the animals receiving control diet. However, animals body mass at the end of the experiment remained similar, in addition to not influencing body mass, HFD intake was not able to change body composition and adipose tissue mass. Cardoso et al. (2018) observed physical exercise contributing to body mass maintenance, even in a HFD intake situation. This finding corroborates the results found in the present study, since all animals started the study with similar body mass and performed a treadmill running protocol, and even the groups consuming HFD did not present a greater body mass when compared to the group consuming control diet (Citation14).
In the present study, the intervention period was not enough to induce the condition in animals, but it is possible to observe saturated fat intake inducing metabolic changes preceding obesity.
In this study, SBP results showed animals that consumed grape juice and red wine had lower blood pressure when compared to HFD. Oishi et al. (2018) observed Wistar rats feeding a high- fat diet after 12, 18 and 24 weeks with significant increase in systolic blood pressure (SBP) when compared to those feeding a control diet, corroborating to the present findings (Citation24). In humans, Schüler et al. (2017) demonstrated that a diet rich in saturated fat (45% of total energy value lipids) consumption for 6 weeks in healthy adults, increased circulating concentrations of angiotensin converting enzyme (ACE) regardless of body weight gain. ACE is related to vasoconstriction and the consequent increase in blood pressure (Citation25).
Grapes and their derivatives are able to reverse this negative effect of HFD on blood pressure, demonstrating antihypertensive activities due to its ACE inhibitory effect (Citation26). Bedê et al. (2015) evaluated liquids rich in polyphenols intake in the blood pressure of rats fed a high-fat diet and observed the grape juice consumption was able to reduce blood pressure when compared to the other groups, similar to the result found in the present study (Citation18).
Regarding red wine effect, Del Pino-Garcia et al. (2017) observed that the short-term polyphenol-rich powdered red wine pomace supplementation over four weeks, progressively decreased the blood pressure of spontaneously hypertensive rats (SHR) when compared to normotensive rats (Citation19). Another study demonstrated that another benefit of the grape is its ability to act on the endothelium, which is captured by nitric oxide and preserving an endothelium-dependent vasodilation due to its antioxidant role (Citation27).
A diet rich in saturated fat consumption is directly related to risk factors for obesity and CVD, as it increases plasma lipid levels, oxidative stress, blood pressure, endothelial dysfunction and inflammation (Citation24, Citation28). Inflammation is mainly caused by oxidative stress, resulting in proinflammatory cytokines increased production such as TNF-α and IL-6. This increase occurs, since reactive oxygen species (ROS) activate some transcription factors participating in inflammatory response and increase oxidative stress (Citation24).
Resveratrol and polyphenols of grapes antioxidant properties could reduce oxidative stress by activating body's antioxidant system, preventing free radicals action and consequently reducing inflammatory cytokines expression. It was observed grape juice consumption associated to reduced inflammatory profile as well as lipid peroxidation, reducing IL-6 and TBARS levels.
A study carried out with lactating rats observed that grape juice consumption increased antioxidant capacity and reduced blood level of IL-6 due to its high content of polyphenols and bioactive compounds conferring anti-inflammatory protection to grape juice (Citation22). In relation to lipid peroxidation, Lacerda et al. (2018) divided male rats into four groups to receive a standard diet or HFD and/or conventional or organic grape juice for three months. The authors observed that HFD increased the lipid peroxidation in the rats serum and grape juice, both conventional and organic, prevented this increase (Citation28).
Already the consumption of red wine led to the increase in TBARS concentration, and it could be explained from Vinson et al. (2001) findings, where Hamsters receiving a diet rich in saturated fat associated with red wine, nonalcoholic red wine and grape juice presented significant benefit mostly in the group consuming grape juice in a lower dose of polyphenols than wine. In another finding, the red wine consumption led to an increase in lipid peroxidation when compared to red wine without alcohol, due to alcohol effects in ROS elevation during its metabolization (Citation29). In addition, the wine used in the present study has added sugar during its manufacture which may have contributed to the increase in TBARS concentration, since sucrose stimulates ROS production and leading to lipid peroxidation (Citation30).
The present findings regarding wine may be related to the presence of alcohol, which even containing polyphenols with good availability, were not able to reduce TBARS as observed in the GJG, showing wine inability to prevent inflammation caused by saturated fat excess consumption. Differently GJG, under the same conditions, induced TBARS decrease suggesting the juice polyphenols could reduce the inflammatory effect caused by the excessive saturated fat consumption. In addition, no changes were observed in this parameter in the RG, showing inability of the bioactive compound alone in reduction or prevention of the inflammatory process and ROS production.
It is found in the literature that diet rich in saturated fat consumption induces changes in gut microbiota and inflammation development associated with hyperphagia and obese phenotype. HFD is association to local lipopolysaccharide (LPS) production by gram-negative bacteria residing in intestine lumen, causing intestinal permeability, with the occurrence of extravasation of LPS into circulation, causing systemic inflammation through cytokines production such as tumor necrosis alpha (TNF-α) and IL-6 (Citation31). In the present study, similarities were not identified in gut microbiota profile considering the use of the DGGE technique, however, the average number of bands in the group consuming the grape juice was significantly higher when compared to the other groups, suggesting juice consumption ability to beneficially modulate these animals gut microbiota.
According to Zhao et al. (2017), the consumption of resveratrol and quercetin in male Wistar rats using a diet consisting of lard, led to a reduction in Firmicutes and increases in bacterioids, that act in a beneficial manner in the body, through modulation in body fat and the induced intestinal microbiota disorder by high fat diet (Citation32). In the study of Van Hul et al. (2017), to evaluate the effects of consumption of extracts containing cinnamon bark polyphenol and grape marc in C57BL/6J mice fed a high-fat diet for 8 weeks observed that grape marc extract was able to decrease fat mass gain, adipose tissue and inflammation in rats fed with an HFD without reducing food intake, also observed a beneficial effect on glucose homeostasis (Citation33). These improvements were related to a significant impact on microbiota composition, on intestinal mucosa recovery and colon barrier integrity (Citation33).
In another study by Colins et al. (2015), it was observed that consuming an extractable or nonextractable fraction of table grapes reduced the metabolic consequences of high-fat consumption, American-type diet in C57BL/6J mice for 16 weeks. The animals that consumed the extracts containing grape powder showed lower percentages of body fat and amounts of white adipose tissue, improved glucose tolerance and reduced expression of inflammatory genes. Several of these treatment effects have been associated with beneficial changes in intestinal bacterial community structure (Citation34).
In the present study, the juice and wine were produced in different regions of Brazil and came from different grape species. Rockenbach et al. (2011) analyzed the anthocyanins and polyphenol concentrations in grapes from different wine-growing regions of Brazil and found a greater amount of anthocyanins in grapes of the bresta variety, although the grapes of the cabernet sauvignon variety had a higher antioxidant capacity (Citation23). The juice used in the present study was derived from grapes of the variety Bordô and Jacques, thus, the effects of juice when compared to wine can be attributed to this fact, since red wine comes from a different grape variety, cabernet sauvignon .
According to the present study results, the beneficial effects to the organism promoted by grape juice consumption are superior compared to red wine and resveratrol. In addition to resveratrol, grape juice and red wine have anthocyanins and other polyphenols contributing to its beneficial effects.
In the present study, beverages composition influenced the physiological responses to the high-fat diet. Although the resveratrol solution has a higher trans-resveratrol content than grape juice and red wine, the GR did not show better physiological results when compared to the other groups. It can be explained by the presence of other phenolic compounds as well as resveratrol bioavailability.
Resveratrol is metabolized and rapidly eliminated and, therefore, shows a low bioavailability. After oral administration, resveratrol is absorbed at the intestinal level where it undergoes a pre-systemic metabolism, after, or resveratrol and its metabolites are metabolized in the liver (Citation35). The hepatic and duodenal sulfations that occur during the metabolism of resveratrol decrease its bioavailability, however, a quercetin is able to inhibit these sulfations. Thus, if a quercetin and resveratrol are the main consumed together, such as grape juice and red wine, quercetin is able to increase the bioavailability of resveratrol (Citation36).
In addition, Gomes et al. (2019) observed the majority of phenolic compounds in grapes reaching the intestinal phase and became available for systemic absorption from the food matrix, where grapes constituent and variety are the main factors influencing this food bioactive properties, as well as well as its beneficial health effects after food intake (Citation37).
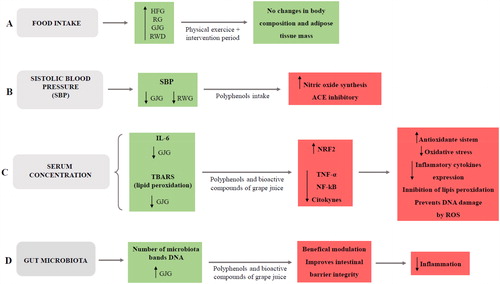
Hence the consumption of polyphenols in its natural matrix of whole foods, such as grape juice, is a promising prospect for health promotion and its nutraceutical application. Below is a schematic representation of the possible implicit biochemical effects that were observed in the present study ().
Figure 6. Schematic representation of the possible implicit biochemical mechanisms effects observed in the present study.
Schematic representation where the green boxes represent results found in the study and the red boxes represent possible implicit biochemical mechanisms. A: Food intake was higher in all groups receiving the high-fat diet, however, due to physical training and the intervention period, there were no changes in body composition and adiposity; B: Systolic blood pressure was lower in the groups receiving grape juice and red wine. Thus, it is suggested that polyphenols present in these drinks are able to increase nitric oxide synthesis and inhibit the angiotensin-converting enzyme; C: The serum concentrations of IL-6 and TBARS were lower in the group receiving grape juice. Thus, it is suggested that polyphenols and bioactive compounds present in grape juice promote an increase in NRF2 and reduce NF-kB and inflammatory cytokines, promoting an increase in antioxidant system, reducing oxidative stress, inhibiting lipid peroxidation and preventing oxidative damage to DNA; D: DNA bands number in gut microbiota was higher in group receiving grape juice. Thus, it is suggested that grape juice polyphenols and bioactive content present in beneficially modulate the gut microbiota, promoting of intestinal barrier integrity and inhibiting the inflammatory process.
HFG: high-fat group; RG: resveratrol group; GJG: grape juice group; RWG: red wine group; IL-6: interleukin-6; TBARS: thiobarbituric acid; ACE: angiotensin converting enzyme; NRF2: nuclear factor erythroid 2–related factor 2; TNF-α: tumor necrosis fator alfa; NF-kB: Nuclear factor-κB; ROS: oxigen reactive species.
There are some limitations to this study that deserve consideration. Although it was showed that drinking beverages rich in resveratrol and engaging in physical activity are capable of promoting metabolic improvements in association with gut microbiota modulation, it would be necessary to assess gut microbiota composition and other inflammatory markers and oxidative stress
Conclusion
Although there were no significant differences in body composition, it can be concluded polyphenol-rich beverages consumption, especially whole red grape juice, together with physical exercise, has the ability to reduce blood pressure, lipid peroxidation and concentration of IL-6, and promotes changes in the microbiota, even in the presence of HFD.
This study was financed in part by the Coordenação de Aperfeiçoamento de Pessoal de Nível Superior - Brasil (CAPES) - Finance Code 001.
Acknowledgments
We are thankful to Laboratório de Nutrição Experimental (LabNE) – Universidade Federal Fluminense for technical assistance and use of animal house, Laboratório de Avaliação Nutricional e Funcional (LANUFF) - Universidade Federal Fluminense for technical assistance and use of DXA equipment, Unidade de Pesquisa Clínica (UPC)- Hospital Universitário Antônio Pedro for technical assistance, Prof.a Flavia Lima do Carmo - Universidade Federal do Rio de Janeiro for assistance with analysis, Prof.a Manuela Dolinsky for assistance with analysis.
Disclosure statement
No potential conflict of interest was reported by the authors.
Additional information
Funding
References
- Précoma DB, Oliveira GMMD, Simão AF, Dutra OP, Coelho OR, Izar MCDO, Póvoa RMDS, Giuliano IDCB, Alencar Filho ACD, Machado CA, et al. Updated cardiovascular prevention guideline of the Brazilian Society of Cardiology - 2019. Arq Bras Cardiol. 2019;113(4):787–891. doi:10.5935/abc.20190204.
- Maki KC, Eren F, Cassens ME, Dicklin MR, Davidson MH. Omega-6 polyunsaturated fatty acids and cardiometabolic health: current evidence, controversies, and research gaps. Adv Nutr. 2018;9(6):688–700.
- Nakamura H, Tsujiguchi H, Kambayashi Y, Hara A, Miyagi S, Yamada Y, Nguyen TTT, Shimizu Y, Hori D, Nakamura H, et al. Relationship between saturated fatty acid intake and hypertension and oxidative stress. Nutrition. 2019;61:8–15. doi:10.1016/j.nut.2018.10.020.
- Wilczek MM, Olszewski R, Krupienicz A. Trans-fatty acids and cardiovascular disease: urgent need for legislation. Cardiology. 2017;138(4):254–8. doi:10.1159/000479956.
- von Frankenberg AD, Marina A, Song X, Callahan HS, Kratz M, Utzschneider KM. A high-fat, high-saturated fat diet decreases insulin sensitivity without changing intra-abdominal fat in weight-stable overweight and obese adults. Eur J Nutr. 2017;56(1):431–43. doi:10.1007/s00394-015-1108-6.
- Barstad LH, Júlíusson PB, Johnson LK, Hertel JK, Lekhal S, Hjelmesaeth J. Gender-related differences in cardiometabolic risk factors and lifestyle behaviors in treatment-seeking adolescents with severe obesity. BMC Pediatr. 2018;18(1):61. doi:10.1186/s12887-018-1057-3.
- Lee S, Keirsey KI, Kirkland R, Grunewald ZI, Fischer JG, de La Serre CB. Blueberry supplementation influences the gut microbiota, inflammation, and insulin resistance in high-fat-diet-fed rats. J Nutr. 2018;148(2):209–19. doi:10.1093/jn/nxx027.
- Hamilton MK, Boudry G, Lemay DG, Raybould HE. Changes in intestinal barrier function and gut microbiota in high-fat diet-fed rats are dynamic and region dependent. Am J Physiol Gastrointest Liver Physiol. 2015;308(10):G840–51. doi:10.1152/ajpgi.00029.2015.
- Serafini M, Peluso I. Functional foods for health: the interrelated antioxidant and anti-inflammatory role of fruits, vegetables, herbs, spices and cocoa in humans. Curr Pharm Des. 2016;22(44):6701–15. doi:10.2174/1381612823666161123094235.
- Alkhatib A, Tsang C, Tiss A, Bahorun T, Arefanian H, Barake R, Khadir A, Tuomilehto J. Functional foods and lifestyle approaches for diabetes prevention and management. Nutrients. 2017;9(12):1310. doi:10.3390/nu9121310.
- Gonçalves LKS, Dutra SV, Caroline DANI. Suco de uva e néctar de uva: parâmetros físico-químicos, composição fenólica e atividade antioxidante. Revista Brasileira de Viticultura e Enologia. 2017;9:74–81.
- Wang S, Zhu MJ, Du M. Prevention of obesity by dietary resveratrol: how strong is the evidence? Expert Rev Endocrinol Metab. 2015;10(6):561–4. doi:10.1586/17446651.2015.1096771.
- Chaplin A, Carpene C, Mercader J. Resveratrol, metabolic syndrome, and gut microbiota. Nutrients. 2018;10(11):1651. doi:10.3390/nu10111651.
- Da Fonseca Cardoso LM, Da Matta Alvarez Pimenta N, Da Silva Ferreira Fiochi R, Bruna Mota BFM, Arruda de Souza Monnerat J, Correia Teixeira C, Da Rocha Ramalho RB, Maldronato IW, Dolisnky M, Teles Boaventura G, et al. Effects of red wine, grape juice and resveratrol consumption on bone parameters of Wistar rats submitted to high-fat diet and physical training. Nutr Hosp. 2017:35(2):416–20. doi:10.20960/nh.765.
- Brand-Williams W, Cuvelier ME, Berset C. Use of a free radical method to evaluate antioxidant activity. LWT-Food Sci Technol. 1995;28(1):25–30. doi:10.1016/S0023-6438(95)80008-5.
- Singleton VL, Orthofer R, Lamuela-Raventós RM, editors. Analysis of total phenols and other oxidation substrates and antioxidants by means of folin-ciocalteu reagent. Methods Enzymol. 1999;299:152–78.
- Giusti M, Wrolstad R. Characterization and measurement of anthocyanins by UV‐Visible spectroscopy. Curr Protoc Food Anal Chem. 2001(1):F1.2.1–F1.2.13.
- Palmisciano Bede T, Pascoal AC, Hauaji Faco L, de Salvo Castro E, Mattoso V, Furtado Dias J, et al. Effect of the intake of liquids rich in polyphenols on blood pressure and fat liver deposition in rats submitted to high-fat diet. Nutr Hosp. 2015;31(6):2539–45.
- Ferolla da Camara Boueri B, Ribeiro Pessanha C, Rodrigues da Costa L, Ferreira MR, Saldanha Melo H, Duque Coutinho de Abreu M, Rozeno Pessoa L, Alves da Silva PC, Pereira AD, Cavalcante Ribeiro D, et al. Body composition in male rats subjected to early weaning and treated with diet containing flour or flaxseed oil after 21 days until 60 days. J Dev Orig Health Dis. 2015;6(6):553–7. doi:10.1017/S2040174415007163.
- Borges NA, Carmo FL, Stockler-Pinto MB, de Brito JS, Dolenga CJ, Ferreira DC, Nakao LS, Rosado A, Fouque D, Mafra D, et al. Probiotic supplementation in chronic kidney disease: a double-blind, randomized, placebo-controlled trial. J Ren Nutr. 2018;28(1):28–36. doi:10.1053/j.jrn.2017.06.010.
- Ohkawa H, Ohishi N, Yagi K. Assay for lipid peroxides in animal tissues by thiobarbituric acid reaction. Anal Biochem. 1979;95(2):351–8. doi:10.1016/0003-2697(79)90738-3.
- Sartor S, Caliari V, Malinovski LI, Toaldo IM, Bordignon-Luiz MT. Bioactive profiling of polyphenolics and oenological properties of red wines from Italian grapes (Vitis vinifera L.) cultivated in a selected subtropical region. Int J Food Prop. 2017;20(Suppl. 2):1–10. doi:10.1080/10942912.2017.1344992.
- Rockenbach II, Rodrigues E, Gonzaga LV, Caliari V, Genovese MI, Gonçalves AEDSS, Fett R. Phenolic compounds content and antioxidant activity in pomace from selected red grapes (Vitis vinifera L. and Vitis labrusca L.) widely produced in Brazil. Food Chem. 2011;127(1):174–9. doi:10.1016/j.foodchem.2010.12.137.
- Oishi JC, Castro CA, Silva KA, Fabricio V, Carnio EC, Phillips SA, et al. Endothelial dysfunction and inflammation precedes elevations in blood pressure induced by a high-fat diet. Arq Bras Cardiol. 2018;110(6):558–67.
- Schuler R, Osterhoff MA, Frahnow T, Seltmann AC, Busjahn A, Kabisch S, et al. High-saturated-fat diet increases circulating angiotensin-converting enzyme, which is enhanced by the rs4343 polymorphism defining persons at risk of nutrient-dependent increases of blood pressure. J Am Heart Assoc. 2017;6(1):e004465.
- Kamrani Rad SZ, Javadi B, Hayes AW, Karim IG. Potential angiotensin converting enzyme (ACE) inhibitors from Iranian traditional plants described by Avicenna's Canon of Medicine. Avicenna J Phytomed. 2019;9(4):291–309.
- Albertoni G, Schor N. Resveratrol plays important role in protective mechanisms in renal disease-mini-review. J Bras Nefrol. 2015;37(1):106–14. doi:10.5935/0101-2800.20150015.
- dos Santos Lacerda D, Garbin de Almeida M, Teixeira C, de Jesus A, da Silva Pereira Júnior É, Martins Bock P, Pegas Henriques J, Gomez R, Dani C, Funchal C, et al. Biochemical and physiological parameters in rats fed with high-fat diet: the protective effect of chronic treatment with purple grape juice (bordo variety). Beverages. 2018;4(4):100. doi:10.3390/beverages4040100.
- Vinson JA, Teufel K, Wu N. Red wine, dealcoholized red wine, and especially grape juice, inhibit atherosclerosis in a hamster model. Atherosclerosis. 2001;156(1):67–72. doi:10.1016/S0021-9150(00)00625-0.
- Masek T, Filipovic N, Vuica A, Starcevic K. Effects of treatment with sucrose in drinking water on liver histology, lipogenesis and lipogenic gene expression in rats fed high-fiber diet. Prostaglandins Leukot Essent Fatty Acids. 2017;116:1–8. doi:10.1016/j.plefa.2016.11.001.
- Cândido FG, Valente FX, Grześkowiak ŁM, Moreira APB, Rocha DMUP, Alfenas RDCG. Impact of dietary fat on gut microbiota and low-grade systemic inflammation: mechanisms and clinical implications on obesity. Int J Food Sci Nutr. 2018;69(2):125–43. doi:10.1080/09637486.2017.1343286.
- Zhao L, Zhang Q, Ma W, Tian F, Shen H, Zhou M. A combination of quercetin and resveratrol reduces obesity in high-fat diet-fed rats by modulation of gut microbiota. Food Funct. 2017;8(12):4644–56. doi:10.1039/C7FO01383C.
- Van Hul M, Geurts L, Plovier H, Druart C, Everard A, Ståhlman M, Rhimi M, Chira K, Teissedre P-L, Delzenne NM, et al. Reduced obesity, diabetes, and steatosis upon cinnamon and grape pomace are associated with changes in gut microbiota and markers of gut barrier. Am J Physiol Endocrinol Metab. 2018;314(4):E334–E52. doi:10.1152/ajpendo.00107.2017.
- Collins B, Hoffman J, Martinez K, Grace M, Lila MA, Cockrell C, Nadimpalli A, Chang E, Chuang C-C, Zhong W, et al. A polyphenol-rich fraction obtained from table grapes decreases adiposity, insulin resistance and markers of inflammation and impacts gut microbiota in high-fat-fed mice. J Nutr Biochem. 2016;31:150–65. doi:10.1016/j.jnutbio.2015.12.021.
- Chimento A, De Amicis F, Sirianni R, Sinicropi MS, Puoci F, Casaburi I, et al. Progress to improve oral bioavailability and beneficial effects of resveratrol. Int J Mol Sci. 2019;20(6):1381.
- Singh CK, Liu X, Ahmad N. Resveratrol, in its natural combination in whole grape, for health promotion and disease management. Ann NY Acad Sci. 2015;1348(1):150–60. doi:10.1111/nyas.12798.
- Gomes TM, Toaldo IM, da Silva Haas IC, Burin VM, Caliari V, Luna AS, de Gois JS, Bordignon-Luiz MT. Differential contribution of grape peel, pulp, and seed to bioaccessibility of micronutrients and major polyphenolic compounds of red and white grapes through simulated human digestion. J Funct Foods. 2019;52:699–708. doi:10.1016/j.jff.2018.11.051.