
Abstract
Objective:
The aim of this prospective study was to investigate the potential influence of the fat mass and obesity-associated gene (FTO), SNP rs9939609, on body mass index (BMI) and body composition in women with anorexia nervosa (AN) undergoing intensive nutrition therapy.
Method:
Twenty-five female patients with AN (20.1 ± 2.3 years; BMI, 15.5 ± 0.9 kg/m2) were included for 12 weeks of treatment with a high-energy diet. FTO was genotyped and body composition parameters were assessed by dual-energy X-ray absorptiometry and peripheral quantitative computed tomography at baseline and after 12 weeks.
Results:
The distribution of the different FTO genotypes were as follows: AA, 24%; TA, 48%; and TT, 28%. Patients gained a median of 9.8 kg (range, 5.5–17.0 kg) and BMI increased to 19.0 ± 0.9 kg/m2. The increase in BMI, fat mass, and the quotient fat/muscle area was significant for the TT and TA genotype groups. Total lean mass was stable in all genotype groups. We could not demonstrate any difference among the 3 FTO genotypes related to the increases in BMI during nutrition therapy when the additive, dominant, and recessive models of inheritance were applied.
Conclusions:
Irrespective of the FTO genotype, there was no difference in weight response during nutrition therapy. Hence, in this small study there was limited support for individualized nutrition therapy for AN based on FTO genotype.
Introduction
The serious psychiatric illness anorexia nervosa (AN) is primarily found in teenage girls and young women. The condition is related to several long-term morbidities and mortality (Citation1). In the majority of cases, however, there is a gradual recovery from the disorder. In hospitalized patients with AN, intensive nutrition therapy, including an initial period of high caloric intake, has shown positive results (Citation2, Citation3).
Frayling et al. (Citation4) identified an association between the fat mass and obesity-associated (FTO) gene, single nucleotide polymorphism (SNP) rs9939609, and increased body weight and body mass index (body mass index [BMI]). The rs9939609 A allele is strongly associated with higher body weight and a higher risk for obesity compared with individuals lacking this risk allele (Citation4).
Homozygous carriers of the A allele (AA) had a higher body weight and a higher risk of obesity in comparison with persons homozygous for the T allele (TT). FTO is highly expressed in brain regions controlling feeding and energy expenditure, such as the hypothalamus, and plays a key role in regulating energy homeostasis (Citation5).
An association between the rs9939609 A allele and impaired satiety responsiveness and thus a direct effect on appetite has also been described (Citation6), and some studies indicate that FTO gene variants are associated with food intake and total energy intake (Citation5, Citation7–9). Carriers of the FTO rs9939609 AA allele have been shown to have a different brain response to food and ghrelin expression than TT carriers (Citation10), and children with the A allele seem to have a preference for energy-dense food (Citation11). Contrastingly, Hakanen et al. (Citation12) could not demonstrate any associations between the FTO genotype and energy intake or physical activity.
Müller et al. (Citation13) found an association between the A allele and both AN and bulimia nervosa (BN). In contrast, Jonassaint et al. (Citation14) could not find any significant association with AN; however, their study pointed at other FTO SNPs than rs9939609. The rs9939609 A allele does not appear to have an association with binge eating disorder (Citation15). Celis-Morales et al. (Citation16) demonstrated that physical activity attenuates the effect of FTO on BMI and waist circumference, while West et al. (Citation17) described that individuals with the A allele had higher physical activity levels than individuals with TT alleles despite similar adiposity-related measures. Apparently, the results are inconsistent about the role of FTO in individuals with eating disorders.
We hypothesized that polymorphism of the FTO gene could explain the spectrum of individual weight gain during nutrition therapy and thereby provide a basis for individualized therapy. Hence, this prospective study aimed to investigate the potential influence of the FTO gene SNP rs9939609 on BMI and body composition during 12 weeks of intensive nutrition therapy with a high-energy diet in Swedish women with AN.
Materials and methods
Study population and design
Participants included in this study were young women with AN admitted to the Queen Silvia Children’s Hospital, Gothenburg, Sweden, from 2012 to 2014 for a planned intensive 12-week inpatient therapy with a structured behavioral program aimed at normalizing eating behavior and restoring body weight. Inclusion criteria were age between 16 and 24 years and a diagnosis of AN according to the Diagnostic and Statistical Manual of Mental Disorders, 4th edition (Citation18). The duration of AN was median 27 months (minimum–maximum, 3–120 months) before inclusion in the study. Exclusion criteria were inflammatory bowel disease or diabetes. All eligible participants, and if younger than 18 years their parents, were approached for assent and written informed consent was obtained prior to their inclusion in the study. Two out of 27 eligible patients declined to participate, giving 25 patients at inclusion. Three patients did not complete the inpatient therapy; for 1 patient the diagnosis of AN was reconsidered and the other 2 participants declined to complete the full 12-week therapy. Hence, 22 patients fulfilled the therapy. Patients underwent intensive nutritional rehabilitation for 12 weeks, with 24-hour surveillance 7 days a week, as described by Pettersson et al. (Citation2), with an extra-high-energy diet, starting at median 3351 kcal/d (2757–3463 kcal/d), that is 75 kcal/kg/d (55–91 kcal/kg/d) during week 1. The energy content declined step by step to 2518 kcal/d (2162–3461 kcal/d), that is, 46 kcal/kg/d (40–79 kcal/kg/d) during week 12. The energy content exceeded the recommended daily intake for healthy young women during the whole study period and the nutrient intake was the recommended daily intake according to Nordic Nutrition Recommendations (Citation19). The menu was planned by a dietician, and all patients were served 6 meals every day: breakfast, snack, lunch, snack, dinner, and night meal. In addition, from day 2, the patients were served 3 × 200 mL of high-energy liquid nutritional supplements (1.5 kcal/mL). These liquid supplements were removed from the menu when patients gained weight. Patients were not allowed to engage in physical activities. The study was approved by the Regional Research Ethics Committee of Gothenburg, Sweden (no. 720-11).
Genotyping
Genomic DNA was extracted from whole blood by the EZ1 BioRobot (Qiagen, Hilden, Germany) with the MagAttract DNA Blood Mini Kit (Qiagen). The FTO SNP rs9939609 (in intron 1 of FTO) was genotyped by polymerase chain reaction (PCR) and subsequent pyrosequencing. Each PCR reaction was run in 20 µL volume reactions on a Mastercycler® ep gradient S PCR cycler (Eppendorf AG), using the forward primer 5′-TCAAAACTGGCTCTTGAATGA-3′ and a biotinylated reverse primer 5′-TGCTCTCCCACTCCATTTCT-3′ (Biomers.net). Each PCR reaction contained 10 pmol of each primer, 1 × PCR buffer (Qiagen), 2 mM MgCl2 (Qiagen), nuclease-free water (Sigma), 0.2 mM deoxyribonucleoside triphosphate (ABgene), and 0.5 units Hot Star Taq® DNA Polymerase (Qiagen). The following PCR program was used: 94 °C 15 minutes, 45×(94 °C 30 s, 53 °C 45 s, 72 °C 60 s), 72 °C 7 minutes, 4 °C. Pyrosequencing of the PCR products was performed using the PyroMark Q24 instrument (Qiagen) with the sequencing primer 5′-TGCGACTGCTGTGAATTT-3′ (Biomers.net) following standard procedures as reported elsewhere (Citation20).
There are three available genotypes: AA, homozygous for the risk allele; TA, heterozygous; and TT, homozygous for the non-risk allele.
Assessment of body composition
Body weight was measured without shoes and heavy clothes on a calibrated weight scale to the nearest 0.1 kg at baseline and then weekly. Height was measured without shoes using a wall-mounted ruler to the nearest 0.5 cm at admission. Fat mass and lean body mass were measured by dual-energy X-ray absorptiometry (DXA) (Lunar Prodigy, GE Lunar Corp.). In total, 20 healthy persons (age 6–37 years) were scanned twice by the same examiner in order to assess the in vivo precision for Lunar Prodigy. The coefficients of variation for body fat mass and lean mass are reported elsewhere (Citation21). All DXA measurements were performed by the same trained nurse.
Peripheral quantitative computed tomography (pQCT) was used to assess body composition by measurements on the left tibia at 4% and 66% of the tibia length using an XCT 2000 (Stratec Medizintechnik GmbH) with software version 6.00. The performance of the device is reported elsewhere (Citation22).
Statistical analyses
Dichotomous variables were described by number and percentage and continuous variables by mean; standard deviation (SD); and median, minimum, and maximum. The Fisher’s nonparametric permutation test was used for tests of changes of continuous variables over time within a group. Associations between continuous variables and ordered categorical variables (e.g., FTO genotypes AA, TA and TT) were examined by Fisher’s nonparametric permutation test for pairwise comparisons. The Fisher’s nonparametric permutation test was also used to test for differences between the groups. All tests were 2-tailed and conducted at the 0.05 significance level. All analyses were performed by using IBM SPSS Statistics version 26 (IBM Corp.) and SAS Software version 9.4 (SAS Institute Inc.).
Results
Some results from the 12-week intensive nutrition therapy are reported elsewhere but have not previously been studied in relation to the FTO genotype (Citation2, Citation3). At inclusion, the mean age of the participants was 20.1 ± 2.3 years. The initial weight of the patients in this study was 44.0 ± 3.8 kg, which increased to 54.0 ± 3.7 kg at week 12 (p < 0.001). Individuals gained a median of 9.8 kg during the study period (22% of initial weight), and BMI increased from 15.5 ± 0.9 kg/m2 to 19.0 ± 0.9 kg/m2 (p < 0.001). There was no difference in energy intake between the genotype groups.
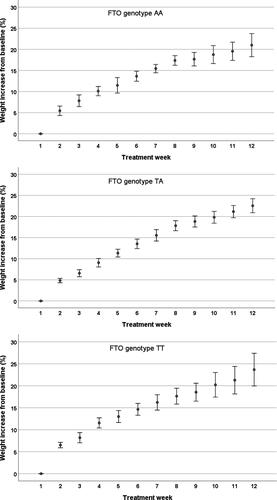
The largest weight gain occurred during the first week of nutrition therapy: a median of 5.7% of initial weight for TT, 4.8% for TA, and 5.0% for AA. The weight gain, from baseline to treatment week 6, was 13.8% for TT, 14.1% for TA, and 14.0% for AA. All 3 groups gained in weight every week; however, no differences in weight gain were found among the FTO genotype groups ().
Figure 1. Weight gain for each FTO genotype during nutrition therapy. Weight increase per week from baseline (%), expressed as standard error of the mean. There were no significant differences in the weight gain for each week of treatment among the FTO genotype groups when the additive, dominant, and recessive models of inheritance were applied.
The distribution of the different FTO genotypes were as follows: AA, n = 6 (24%); TA, n = 12 (48%); and TT, n = 7 (28%). The observed genotype frequency was in accordance with the Hardy-Weinberg equilibrium (Chi-square value = 0.85) using a significance level at 0.05. Weight and BMI increased in all 3 groups during the intensive nutrition therapy; however, it was statistically significant only for the TA and TT groups. We could not demonstrate any difference among patients with the 3 different genotypes when the additive, dominant, and recessive models of inheritance were applied ( and , and ).
Figure 2. Body mass index (BMI) week 1 and 12 categorized by FTO genotype. The solid horizontal line represents the mean BMI value and the dashed line represents the median BMI value for each FTO genotype. TT = homozygous for the non-risk allele T; TA = heterozygous; AA = homozygous for the risk allele A; W1 = week 1 (start of nutrition therapy); W12 = week 12 (end of nutrition therapy).
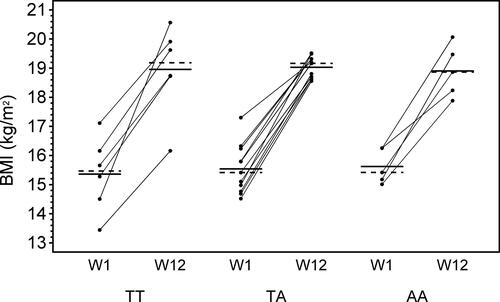
Table 1. Weight and body composition data for FTO genotypes
Table 2. Differences between the fto genotype groups: aa, ta, tt, for the change in weight and body composition parameters from start to 12 weeks
During the intensive nutrition therapy, total fat mass, fat mass of the trunk, fat mass of the left leg, and left leg fat/muscle area increased from baseline to 12 weeks for the TT and TA groups, while total lean mass and left leg lean mass were stable in all 3 genotype groups (). For the TT group, trunk lean mass decreased, left leg muscle area increased, and muscle density decreased. These parameters were stable in the AA and TA groups.
Discussion
This prospective interventional study, investigating the potential influence of the FTO gene on BMI and body composition in women with AN, demonstrated that treatment with a strictly controlled high-energy diet was effective in all patients, irrespective of the FTO genotype.
The weight increase was most pronounced during the first week of treatment, but it continued throughout the treatment period and did not differ among the genotype groups. During the 12-week nutrition therapy, fat mass increased and muscle density decreased, demonstrating that the BMI increase was mainly due to an increase in fat mass and not muscle mass. Previous studies have revealed that carriers of the rs9939609 A allele present a significantly higher BMI and adiposity, as well as consuming a higher percentage of energy from fat (Citation23, Citation24). Labayen et al. (Citation25) showed, however, that consumption of low-fat diets may attenuate the predisposition to obesity in A allele carriers, while the effects of the FTO rs9939609 on obesity was exacerbated in adolescents consuming high-fat diets. In the current study, all patients were served the same menu for 12 weeks, which turned out to remove the effect of the FTO genotypes.
In this study, the prevalence for either AA or AT was 72%. Similarly, Castellini et al. (Citation26) found that the AA or AT genotypes were present in 73% of patients with eating disorders but only in 53% of controls. They also found that the presence the A allele of the FTO rs9939609 was associated with a higher vulnerability to eating disorders, binge eating behavior, and emotional eating (Citation26).
To our knowledge, this is the first study evaluating the effect of the FTO genotype on weight gain and body composition in a cohort of patients undergoing a well-controlled, in-hospital, intensive nutrition treatment with the purpose to gain weight. The strengths of this study are its prospective design, the small number of dropouts, and the use of the pQCT method, which contributes to the reliability of body composition data. The nutrition therapy was well controlled; all patients were served the same menu and with the same energy content. The small number of included patients in the study may be considered as a major limitation; however, this treatment is very staff-intensive and inclusion of a larger number of patients was not possible in our setting. In addition, the local anorexia ward changed the treatment protocol after 2014 to a more personalized treatment regime. The lack of a control group is another limitation that should be recognized. A control group was not included because we found it unethical to recruit normal-weight young women who would agree to a restricted diet with the objective of gaining fat mass and weight in a hospitalized environment (with 24-hour surveillance) for 12 weeks.
Conclusions
The hypothesis that the FTO genotype could affect the accumulation of fat and be a predictive factor for increased weight during intensive nutrition therapy in hospitalized patients with AN could not be verified. Nutrition therapy was effective in all patients, irrespective of the FTO genotype. Hence, there is limited support for individualized nutrition therapy for patients with AN based on the FTO genotype according to these findings. However, future studies are needed to investigate the role of the FTO genotype in patients with AN for the ability to maintain normal BMI in a long-term perspective.
Acknowledgements
We thank the participating individuals for their enthusiasm and patience and all of the staff, and especially Cecilia Pettersson, at the anorexia ward, Queen Silvia Children’s Hospital, Sahlgrenska University Hospital. We acknowledge the expert assistance of Anne Dohsé and Ewa Lönn Karlsson, and thank Nils-Gunnar Pehrsson, Christopher Backström, and Aldina Pivodic for their expert statistical advice.
Disclosure statement
All authors declare that there are no relevant financial or nonfinancial competing interests to report.
References
- Wentz E, Gillberg IC, Anckarsäter H, Gillberg C, Råstam M. Adolescent-onset anorexia nervosa: 18-year outcome. Br J Psychiatry. 2009;194(2):168–74. doi:10.1192/bjp.bp.107.048686.
- Pettersson C, Tubic B, Svedlund A, Magnusson P, Ellegård L, Swolin-Eide D, Forslund HB. Description of an intensive nutrition therapy in hospitalized adolescents with anorexia nervosa. Eat Behav. 2016;21:172–8. doi:10.1016/j.eatbeh.2016.03.014.
- Tubić B, Pettersson C, Svedlund A, Forslund HB, Magnusson P, Swolin-Eide D. Increased bone mineral content during rapid weight gain therapy in anorexia nervosa. Horm Metab Res. 2016;48(10):664–72. doi:10.1055/s-0042-115304.
- Frayling TM, Timpson NJ, Weedon MN, Zeggini E, Freathy RM, Lindgren CM, Perry JRB, Elliott KS, Lango H, Rayner NW, et al. A common variant in the FTO gene is associated with body mass index and predisposes to childhood and adult obesity. Science. 2007;316(5826):889–94. doi:10.1126/science.1141634.
- Fredriksson R, Hägglund M, Olszewski PK, Stephansson O, Jacobsson JA, Olszewska AM, Levine AS, Lindblom J, Schiöth HB. The obesity gene, FTO, is of ancient origin, up-regulated during food deprivation and expressed in neurons of feeding-related nuclei of the brain. Endocrinology. 2008;149(5):2062–71. doi:10.1210/en.2007-1457.
- Wardle J, Carnell S, Haworth CM, Farooqi IS, O’Rahilly S, Plomin R. Obesity associated genetic variation in FTO is associated with diminished satiety. J Clin Endocrinol Metab. 2008;93(9):3640–3. doi:10.1210/jc.2008-0472.
- Livingstone KM, Celis-Morales C, Lara J, Ashor AW, Lovegrove JA, Martinez JA, Saris WH, Gibney M, Manios Y, Traczyk I, et al. Associations between FTO genotype and total energy and macronutrient intake in adults: a systematic review and meta-analysis. Obes Rev. 2015;16(8):666–78. doi:10.1111/obr.12290.
- Speakman JR, Rance KA, Johnstone AM. Polymorphisms of the FTO gene are associated with variation in energy intake, but not energy expenditure. Obesity (Silver Spring). 2008;16(8):1961–5. doi:10.1038/oby.2008.318.
- Qi Q, Downer MK, Kilpeläinen TO, Taal HR, Barton SJ, Ntalla I, Standl M, Boraska V, Huikari V, Kiefte-de Jong JC, et al. Dietary intake, FTO genetic variants, and adiposity: a combined analysis of over 16,000 children and adolescents. Diabetes. 2015;64(7):2467–76. doi:10.2337/db14-1629.
- Karra E, O’Daly OG, Choudhury AI, Yousseif A, Millership S, Neary MT, Scott WR, Chandarana K, Manning S, Hess ME, et al. A link between FTO, ghrelin, and impaired brain food-cue responsivity. J Clin Invest. 2013;123(8):3539–51. doi:10.1172/JCI44403.
- Cecil JE, Tavendale R, Watt P, Hetherington MM, Palmer CN. An obesity-associated FTO gene variant and increased energy intake in children. N Engl J Med. 2008;359(24):2558–66. doi:10.1056/NEJMoa0803839.
- Hakanen M, Raitakari OT, Lehtimäki T, Peltonen N, Pahkala K, Sillanmäki L, Lagström H, Viikari J, Simell O, Rönnemaa T, et al. FTO genotype is associated with body mass index after the age of seven years but not with energy intake or leisure-time physical activity. J Clin Endocrinol Metab. 2009;94(4):1281–7. doi:10.1210/jc.2008-1199.
- Müller TD, Greene BH, Bellodi L, Cavallini MC, Cellini E, Di Bella D, Ehrlich S, Erzegovesi S, Estivill X, Fernández-Aranda F, et al. Fat mass and obesity-associated gene (FTO) in eating disorders: evidence for association of the rs9939609 obesity risk allele with bulimia nervosa and anorexia nervosa. Obes Facts. 2012;5(3):408–19. doi:10.1159/000340057.
- Jonassaint CR, Szatkiewicz JP, Bulik CM, Thornton LM, Bloss C, Berrettini WH, Kaye WH, Bergen AW, Magistretti P, Strober M, et al. Absence of association between specific common variants of the obesity-related FTO gene and psychological and behavioral eating disorder phenotypes. Am J Med Genet B Neuropsychiatr Genet. 2011;156B(4):454–61. doi:10.1002/ajmg.b.31182.
- Palmeira L, Cunha M, Padez C, Alvarez M, Pinto-Gouveia J, Manco L. Association study of variants in genes FTO, SLC6A4, DRD2, BDNF and GHRL with binge eating disorder (BED) in Portuguese women. Psychiatry Res. 2019;273:309–11. doi:10.1016/j.psychres.2019.01.047.
- Celis-Morales C, Marsaux CFM, Livingstone KM, Navas-Carretero S, San-Cristobal R, O’donovan CB, Forster H, Woolhead C, Fallaize R, Macready AL, et al. Physical activity attenuates the effect of the FTO genotype on obesity traits in European adults: the Food4Me study. Obesity. 2016;24(4):962–9. doi:10.1002/oby.21422.
- West NR, Dorling J, Thackray AE, Hanson NC, Decombel SE, Stensel DJ, Grice SJ. Effect of obesity-linked FTO rs9939609 variant on physical activity and dietary patterns in physically active men and women. J Obes. 2018;2018:7560707. doi:10.1155/2018/7560707.
- American Psychiatric Association. Diagnostic and Statistical Manual of Mental Disorders: DSM-IV-TR. Washington, DC, 2000.
- Nordic Council of Ministers. Nordic Nutrition Recommendations 2012: Integrating nutrition and physical activity. 5th ed. Copenhagen, Denmark: Narayana Press; 2014, 627 pp.
- Ronaghi M, Elahi E. Discovery of single nucleotide polymorphisms and mutations by pyrosequencing. Comp Funct Genomics. 2002;3(1):51–6. doi:10.1002/cfg.132.
- Söderpalm A-C, Magnusson P, Ahlander A-C, Karlsson J, Kroksmark A-K, Tulinius M, Swolin-Eide D. Low bone mineral density and decreased bone turnover in Duchenne muscular dystrophy. Neuromuscul Disord. 2007;17(11-12):919–28. doi:10.1016/j.nmd.2007.05.008.
- Neu CM, Manz F, Rauch F, Merkel A, Schoenau E. Bone densities and bone size at the distal radius in healthy children and adolescents: a study using peripheral quantitative computed tomography. Bone. 2001;28(2):227–32. doi:10.1016/S8756-3282(00)00429-4.
- Peng S, Zhu Y, Xu F, Ren X, Li X, Lai M. FTO gene polymorphisms and obesity risk: a meta-analysis. BMC Med. 2011;9:71. doi:10.1186/1741-7015-9-71.
- Tanofsky-Kraff M, Han JC, Anandalingam K, Shomaker LB, Columbo KM, Wolkoff LE, Kozlosky M, Elliott C, Ranzenhofer LM, Roza CA, et al. The FTO gene rs9939609 obesity-risk allele and loss of control over eating. Am J Clin Nutr. 2009;90(6):1483–8. doi:10.3945/ajcn.2009.28439.
- Labayen I, Ruiz JR, Huybrechts I, Ortega FB, Arenaza L, González-Gross M, Widhalm K, Molnar D, Manios Y, DeHenauw S, et al. Dietary fat intake modifies the influence of the FTO rs9939609 polymorphism on adiposity in adolescents: the HELENA cross-sectional study. Nutr Metab Cardiovasc Dis. 2016;26(10):937–43. doi:10.1016/j.numecd.2016.07.010.
- Castellini G, Franzago M, Bagnoli S, Lelli L, Balsamo M, Mancini M, Nacmias B, Ricca V, Sorbi S, Antonucci I, et al. Fat mass and obesity-associated gene (FTO) is associated to eating disorders susceptibility and moderates the expression of psychopathological traits. PLoS One. 2017;12(3):e0173560. doi:10.1371/journal.pone.0173560.