
ABSTRACT
Objectives: Over the lifespan cumulative changes to the brain lead to cognitive decline and eventually to dementia in 20–25% of adults 85 years and older. A commonly used screening tool for cognitive function is the Standard 30 point Mini-Mental State Examination (MMSE). Though the MMSE is used to screen for dementia, little is known about the changes in scores over the lifespan in general populations.
Method: A systematic search was conducted using Cochrane, EMBASE, MEDLINE and PsycINFO for articles published from January 1, 2007 to May 25, 2017. Articles were included if they had a longitudinal design reporting at least two MMSE scores. A mixed-effect meta-regression analysis was conducted to examine the influence of age on MMSE score followed by a change-point regression analysis determining the age at which MMSE declines.
Results: 45 articles including 58,939 individuals (age range 18–108 years, 61.2% female) summarized 222 MMSE point estimates from 35 cohorts. The meta-regression demonstrated a significant decrease in MMSE scores with higher age (regression coefficient of age: −0.10 (Confidence Interval (CI) −0.15, −0.05)). The average annual decline in MMSE scores identified by the change-point analysis at the age of 41 years and 84 years were −0.04 (95% CI: −0.05, −0.03) and −0.53 (95% CI: −0.55, −0.50), respectively.
Conclusions: Between the age of 29 and 105 years MMSE scores decline, with the highest decline between age 84 and 105 years.
Clinical Implementations: The use of MMSE should be restricted to higher age categories in aging general populations.
Introduction
The majority of older adults have adequate cognitive function to manage their daily activities of living. However, the aging process causes numerous morphological changes to the brain that vary in severity among individuals (Messe´, Rudrauf, Benali, & Marrelec, Citation2014), which places older adults at higher risk to develop dementia and other neurological diseases (He et al., Citation2010). In 2015, 46.8 million individuals worldwide were estimated to be living with dementia. This is expected to almost double by 2030 due to the increase in life expectancy (Ali, Guerchet, Wu, Prince, & Prina, Citation2015).
A variety of neuropsychological tests have been used to determine cognitive function including the 30 point Mini-Mental State Examination (MMSE), Rowland Universal Dementia Assessment Scale (RUDAS) (Naqvi, Haider, Tomlinson, & Alibhai, Citation2015) and Montreal Cognitive Assessment (MoCA) (Davis et al., Citation2015). Since 1975 the MMSE is the best known and most often used screening test for dementia (Arevalo-Rodriguez et al., Citation2015; Folstein, Folstein, & McHugh, Citation1975; Tsoi, Chan, Hirai, Wong, & Kwok, Citation2015), which has been proven a valid tool in different populations such as Hispanics (Arévalo, Kress, & Rodriguez, Citation2019) and Asians (Rosli, Tan, Gray, Subramanian, & Chin, Citation2016). The MMSE tests orientation to time, and place, repetition, verbal recall, attention and calculation, language, and visual construction (Folstein et al., Citation1975). The MMSE is well regarded for its translatability to other languages, high reliability, and easy use for comparative analysis and administration across populations (Nieuwenhuis-Mark, Citation2010). The MMSE cutoff score of 24 points for normal cognition has high validity, with 87% for sensitivity and 82% for specificity (M. F. Folstein et al., Citation1975; Nieuwenhuis-Mark, Citation2010). The MMSE is, however, found to be sensitive for confounders such as age and education that account for 12% variance in MMSE scores (Gluhm et al., Citation2013; Nieuwenhuis-Mark, Citation2010). The 100 point Modified Mini-Mental State Examination (3 MSE), with a cutoff score of 78 points or higher for normal cognition, is an alternative to the standard test and has an additional four sections that test word fluency, similarity recognition, delayed recall of words, and memory of date and place of birth (Teng & Chui, Citation1987; Tombaugh, McDowell, Kristjansson, & Hubley, Citation1996). Though a higher reliability coefficient (0.82 and 0.88 vs. 0.62 and 0.81) has been obtained with the 3 MSE than MMSE, both the standard and modified versions of the test screen for similar cognitive domains, and scales are relatively proportional (Tombaugh et al., Citation1996). The changes in MMSE scores in individuals with dementia against age have been reported in many studies (Arevalo-Rodriguez et al., Citation2015).
Little is known about the trajectory of cognition during lifetime measured using the MMSE in general populations. Therefore, we systematically reviewed the literature to map MMSE score trajectories over individual’s lifespan in general populations.
Methods
Search strategy and study selection
The protocol of the systematic review was performed according to PRISMA standards (Moher, Liberati, Tetzlaff, & Altman, Citation2009). The search for the literature was conducted using four electronic databases MEDLINE, EMBASE, Cochrane, and PsycINFO via Ovid, for articles published from January 1, 2007 to May 25, 2017 (Appendix Table I). This period was chosen to include more recent data to account for possible cohort effects (Matthews, Marioni, & Brayne, Citation2012). Key search terms for the study selection included “aging,” “MMSE”, and “cohort.”
Conference abstracts and duplicates were removed before title and abstract screening by independent investigators (JMN, AD). A third reviewer (SS) resolved any disagreements between the investigators. Articles were included if they met the following criteria: human articles, published in English, non-patient population or participants without neuropsychological diseases, longitudinal study design with a follow up time greater than or equal to 5 years for cohort studies with a mean age of participants less than 90 years at the baseline. Cohort studies including participants 90 years or older often have limited follow-up periods; therefore, these studies were included if at least one MMSE data point was reported (including a cross-sectional study design). Cohort data published multiple times were included once, presenting data with the longest follow-up period.
Data extraction and quality assessment
Two investigators (JMN, AD) independently extracted the following information: author, year of publication, study design, country of population, study population, sample size, age, sex, baseline, and follow-up MMSE scores, and follow-up time. Discrepancies were discussed with two other investigators where necessary (SS, ABM).
The risk of bias and study quality was accessed independently by two investigators (JMN, AD) using the Newcastle-Ottawa scale (NOS), consisting of three sections; selection, comparability, and exposure. A high score is indicative of low study bias and good study quality (Lo, Mertz, & Loeb, Citation2014).
Data synthesis
Age in years was extracted in the following formats: mean (SD); median (IQR); mean (SE); mean (range); median (range); and values as integer when no summary statistics were reported. Age presented as median (IQR) and median (range) were converted to mean (SD) values (Hozo, Djulbegovic, & Hozo, Citation2005). Standard Error of Mean (SE) was also converted to Standard Deviation (SD) (Barde & Barde, Citation2012). Integer values representing the overall age of the cohort were used as a mean age. MMSE scores were extracted in the following formats: mean (SD); median (IQR); mean (SE); mean (range); median (range) and 95% Confidence Intervals (CI). MMSE scores presented as mean (SD) or mean (SE) were converted to median (IQR) due to non-normality observed in the data (Barde & Barde, Citation2012; Hozo et al., Citation2005). Articles presenting MMSE scores as point estimates and 95% CI values were also converted to median (IQR) values (Krzywinski & Altman, Citation2013).
A meta-regression analysis was conducted to identify the trend in MMSE scores over chronological age. The mean (SD) age and median MMSE scores were used with IQR values of MMSE scores converted to median absolute deviation (MAD) (Pham-Gia & Hung, Citation2001) for calculation of variance for the meta-regression model. Articles that did not report any measure of dispersion for the estimated MMSE score were excluded from the meta-regression analysis. Three mixed-effect models (Model 1: age, Model 2: age + age2, Model 3: age + age2 + age3) were developed. A meta-analysis model without age was also developed to identify if age has any influence on MMSE scores and how much of the heterogeneity can be explained by age. A change-point analysis was conducted to identify the age values with changes in MMSE scores.
The descriptive statistics were calculated using the IBM SPSS Statistics version 24 program (IBM, Armonk, New York, USA). Mapping of trajectories was conducted using GraphPad (GraphPad Prism 5 for Windows, Version 5.01, La Jolla, CA, GraphPad Software Inc.). The R (R Foundation for Statistical Computing, version 3.3.3, Vienna, Austria, R Core Team) package “Metafor” (Muggeo, Citation2003; Viechtbauer, Citation2010) and “Segmented” (Muggeo, Citation2003) were used for performing meta-regression and change-point analysis.
Results
shows the PRISMA flowchart of study selection. A total of 4196 articles were found, of which 947 were duplicates and 566 conference abstracts, giving 2683 articles for title and abstract screening. Two hundred and eighty-seven articles were accepted for full-text screening. Data of 45 articles were included, consisting of 37 articles using the standard MMSE and 8 articles using the 3MSE.
Figure 1. Flow diagram of article selection process.
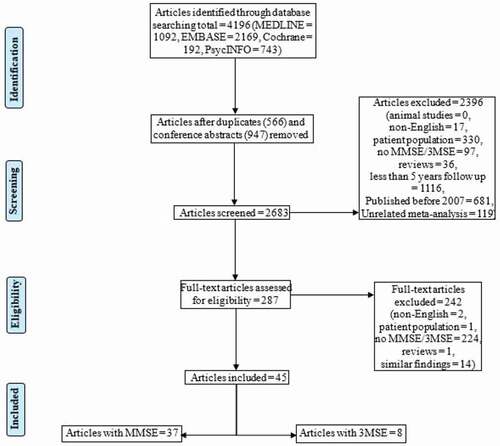
Appendix Table II displays the descriptive characteristics of the included articles. Thirty-two cohorts had a longitudinal design and three cohorts were cross-sectional, with a mean (SD) baseline age of the 58,939 participants of 75.1 (12.8) years with 61.2% females and median follow-up period of 8 years (range 0.5–22). A total of 222 MMSE point estimates were extracted from cohorts of 14 countries. Nearly half of the cohorts were located in the USA (44%) and participants were predominantly Caucasian (89%), followed by a predominantly Hispanic (7%) and Asian (4%) origin.
Appendix Table III presents the MMSE/3MSE values for the cohorts at baseline and follow-up. presents the trajectory of standard MMSE scores expressed as median IQR () and fitted values from the meta-regression model () against mean (SD) chronological age. Of the three mixed-effect models, the model with age and a second and third-degree polynomial of age provided the best fit (Akaike Information Criteria (AIC): Model 1 (634.47), Model 2 (614.85), Model 3 (602.26)). A low AIC value is indicative of the best trade-off between the model fit and complexity of the model. When compared with the model without the age variable, an increase in AIC (672.8481) was observed. The meta-regression model demonstrated a significant decrease in MMSE score with each year increase in age (regression coefficient of age: −0.10 (−0.15, −0.05)). The change-point analysis identified the first decline in MMSE score at the age of 41 years followed by another decline at age of 84 years. The rate of decline below age 41 years is −0.17 (95% CI: −0.35, 0.004), −0.04 (95% CI: −0.05, −0.03) from 41 years to younger than 84 years, and −0.53 (95% CI: −0.55, −0.50) from 84 years and onwards.
Figure 2. Trajectory of cognition measured by MMSE over chronological age in general populations depicted as median, IQR (A) and meta-regression fitted values (estimate and 95% CI) (B).
presents the trajectories of 3MSE (median; IQR) scores against mean age. The majority (72%) of 3MSE score estimates were obtained from individuals aged 70–80 years. None of the articles reported 3MSE scores in participants aged below 65 years and above 95 years. Due to the limited age range and number of score estimates, further statistics was omitted.
Figure 3. Trajectory of cognition measured by 3MSE over chronological age in general populations depicted as median, IQR.
displays the NOS scores for the included articles. The median (Bruce et al.) score was 7 points (range 6–9). Two articles obtained full scores for all three sections.
Table 1. Newcastle-Ottawa Scale (NOS) scores of included articles
Discussion
The trajectory of standard MMSE scores over a lifespan of general populations showed a gradual decline of the MMSE score with chronological age. The change-point analysis estimated a minimal decline in MMSE scores up to the age of 84 years followed by a significant decline of half a point per year at higher ages.
At higher chronological ages (range 84–105 years), the decline in MMSE scores was more pronounced compared to younger ages reaching abnormal scores, defined as cutoff score of 24 points (Folstein et al., Citation1975; Tombaugh & McIntyre, Citation1992). A review of cognitive functioning of individuals aged 90 years and older without dementia revealed a MMSE cutoff score of 23.3 points as abnormal (Legdeur et al., Citation2017). Applying these cutoff scores to the cohorts of our systematic review demonstrates the high prevalence of cognitive impairment at older age, which is in line with previously published prevalence data of dementia (Kochhann, Varela, Lisboa, & Chaves, Citation2010; Lin et al., Citation2013).
Similar rates of cognitive decline have been reported in a previous review, with a greatest rate of cognitive decline occurring 3–15 years before death (Karr, Graham, Hofer, & Muniz-Terrera, Citation2018). This accelerated cognitive decline is not only explained by the onset of age-related diseases such as Alzheimer’s disease and vascular dementia (Ravona-Springer et al., Citation2011), but also by non-brain-related changes, such as sensory impairment (Bathini, Brai, & Auber, Citation2019; Ray, Dening, & Crosbie, Citation2019). Age, apolipoprotein E ε4 allele, and diabetes have been shown to be associated with faster cognitive decline (Lipnicki et al., Citation2019). However, risk factors for cognitive decline differ between age groups; vascular disorders are a prominent risk factor for dementia at younger ages, but it is not at high age (Legdeur et al., Citation2018, Citation2019), suggesting differences in the pathophysiology (Denver & McClean, Citation2018; Rizzi, Rosset, & Roriz-Cruz, Citation2014). Furthermore, cognitive decline is often accompanied by a decline of other organ systems, such as the musculoskeletal system resulting in physical impairment (van Dam et al., Citation2018). This suggests common pathophysiological pathways related to aging, but the time dependency of the decline of different organ systems has yet to be established (Legdeur et al., Citation2019; Stijntjes et al., Citation2017).
The MMSE values between the seventh and ninth decade were much more heterogeneous than at younger or extreme ages. This is likely due to the heterogeneity of included cohorts, being different in country of inclusion, ethnicity, socioeconomic status, lifestyle, and medical conditions. Ethnicity, cultural differences, and education, as well as language, may affect the accuracy of the MMSE test results (Dong et al., Citation2010; Ibrahim et al., Citation2009; Mathuranath et al., Citation2007; Sosa et al., Citation2012). The MMSE results may, therefore, be underestimated in populations with low literacy. In an analysis of individual data of 20 cohorts including individuals aged 72.7 years (mean), the apolipoprotein E ε4 allele, lower levels of education, current smoking, lower physical activity, and medical conditions such as depression, diabetes, and stroke were associated with poorer cognitive performance (Lipnicki et al., Citation2019).
The MMSE is one of the most used screening tools for cognitive function in clinical practice, therefore mapping the trajectory of the MMSE was deliberately chosen (Tombaugh, Citation2005), even if other tools like the RUDAS and MoCA are also often clinically used. However, the MMSE has a well-known ceiling effect (Houx et al., Citation2002) and may not detect subtle changes in cognitive decline (Kim et al., Citation2014). Young and clinically cognitively healthy individuals obtain close to the highest possible score. Individuals may begin accelerated cognitive decline years before a change in MMSE is observed. Therefore, the decline in MMSE is representing an end of the ceiling effect rather than the true onset of cognitive decline. Therefore, even minimal decline in MMSE scores at younger ages might be indicative for cognitive decline.
This review is not without limitations. Articles published from 2007 onwards were included in this systematic review, which has limited the number of cohorts being included. This strategy made it more likely to include data of more recently performed cognitive testings and therewith inclusion of more recent birth cohorts, minimizing cohort effects (Glenn, Citation1976). The results might not be generalizable to all ethnicities as the majority of cohorts consisted of White people. A more balanced diversity of ethnicities would be highly warranted (Jüni, Witschi, Bloch, & Egger, Citation1999). Furthermore, the prevalence of Alzheimer’s disease is higher in females than males (Hebert, Scherr, McCann, Beckett, & Evans, Citation2001). It was not possible to stratify the trajectories by sex, but the impact on the analyzes are estimated to be small as the incidence of mild cognitive impairment has been reported to be independent of sex (Au, Dale-McGrath, & Tierney, Citation2017).
Furthermore, the included articles described longitudinal cohorts with varying follow-up durations (range 0.5–22 years), number of completed measurements (range: 20–65970), and intervals between measurements (range 0.21–12 years). Attrition is common in longitudinal cohorts, especially among older individuals who experience cognitive decline or die during follow-up. Cohorts with long intervals between measurement waves may not detect the onset of cognitive impairment due to attrition, but include data of previous measurements. Including cohorts with varying measurement intervals may increase the heterogeneity of results being the consequence of discrepant cohort designs. Only cohorts of the general population were included, excluding cohorts focusing on cognitive function in disease-specific cohorts. Therefore, this review gives a comprehensive overview of the cognitive function of general populations.
Conclusion
In general populations, the MMSE score declines minimally in young and middle-aged cohorts and declines significantly (half a point of the score per year) between 84 and 105 years.
Clinical implications
The Standard 30 point Mini-Mental State Examination (MMSE) is a commonly used screening tool for cognitive function.
Between the age of 29 and 105 years, MMSE scores decline in general populations.
From the age 84 years onwards the cognitive decline amounts to half a MMSE point per year.
Supplemental Material
Download Zip (86 KB)Acknowledgments
This work was supported by the European Union’s Horizon 2020 research and innovation program (No. 689238 and No. 675003). The funders had no role in the study design, data collection, data analysis, decision to publish, or preparation of the manuscript.
Disclosure statement
Julius M. Nagaratnam, Sifat Sharmin, Aaron Diker, Wen Kwang Lim, Andrea B. Maier declare that they have no conflict of interest.
Supplementary materials
Supplemental data for this article can be accessed on the publisher’s website.
Additional information
Funding
References
- Ali, G.-C., Guerchet, D. M., Wu, D. Y.-T., Prince, P. M., & Prina, D. M. (2015). The global prevalence of dementia. Alzheimer’s Disease International: World Alzheimer Report 2015, Chapter 2, 10–29.
- Arévalo, S. P., Kress, J., & Rodriguez, F. S. (2019). Validity of cognitive assessment tools for older adult hispanics: A systematic review. Journal of the American Geriatrics Society. Epub ahead of print. doi: https://doi.org/10.1111/jgs.16300.
- Arevalo-Rodriguez, I., Smailagic, N., Roque I Figuls, M., Ciapponi, A., Sanchez-Perez, E., Giannakou, A., & Cullum, S. (2015). Mini-Mental State Examination (MMSE) for the detection of Alzheimer’s disease and other dementias in people with mild cognitive impairment (MCI). Cochrane Database of Systematic Reviews, 5(3), CD010783. doi:https://doi.org/10.1002/14651858
- Au, B., Dale-McGrath, S., & Tierney, M. C. (2017). Sex differences in the prevalence and incidence of mild cognitive impairment: A meta-analysis. Ageing Research Reviews, 35, 176–199. doi:https://doi.org/10.1016/j.arr.2016.09.005
- Barde, M. P., & Barde, P. J. (2012). What to use to express the variability of data: Standard deviation or standard error of mean? Perspectives in Clinical Research, 3(3), 113–116. doi:https://doi.org/10.4103/2229-3485.100662
- Bathini, P., Brai, E., & Auber, L. A. (2019). Olfactory dysfunction in the pathophysiological continuum of dementia. Ageing Research Reviews, 55, 100956. doi:https://doi.org/10.1016/j.arr.2019.100956
- Davis, D. H., Creavin, S. T., Yip, J. L., Noel-Storr, A. H., Brayne, C., & Cullum, S. (2015). Montreal Cognitive Assessment for the diagnosis of Alzheimer’s disease and other dementias. Cochrane Database of Systematic Reviews (Online), 29(10), CD010775. doi:https://doi.org/10.1002/14651858.CD010775.pub2
- Denver, P., & McClean, P. L. (2018). Distinguishing normal brain aging from the development of Alzheimer’s disease: Inflammation, insulin signaling and cognition. Neural Regeneration Research, 13(10), 1719–1730. doi:https://doi.org/10.4103/1673-5374.238608
- Dong, Y., Sharma, V. K., Chan, B. P., Venketasubramanian, N., Teoh, H. L., Seet, R. C., … Chen, C. (2010). The Montreal Cognitive Assessment (MoCA) is superior to the Mini-Mental State Examination (MMSE) for the detection of vascular cognitive impairment after acute stroke. Journal of Neurological Sciences, 299, 15–18. doi:https://doi.org/10.1016/j.jns.2010.08.051
- Folstein, M. F., Folstein, S. E., & McHugh, P. R. (1975). “Mini-mental state”: A practical method for grading the cognitive state of patients for the clinician. Journal of Psychiatric Research, 12(3), 189–198. doi:https://doi.org/10.1016/0022-3956(75)90026-6
- Glenn, N. D. (1976). Cohort Analysts’ Futile Quest: Statistical Attempts to Separate Age, Period and Cohort Effects. American Sociological Review, 41(5), 900–904. doi:https://doi.org/10.2307/2094738
- Gluhm, S., Goldstein, J., Loc, K., Colt, A., Van Liew, C., & Corey-Bloom, J. (2013). Cognitive Performance on the Mini-Mental State Examination and the Montreal Cognitive Assessment Across the Healthy Adult Lifespan. Cognitive and Behavioral Neurology: Official Journal of the Society for Behavioral and Cognitive Neurology, 26(1), 1–5. doi:https://doi.org/10.1097/WNN.0b013e31828b7d26
- He, J., Iosif, A. M., Lee, D. Y., Martinez, O., Ding, D., Carmichael, O., … & Galasko, D. (2010). Brain morphology and cerebrovascular risk in mild cognitive impairment and dementia: SCOBHI-P study. Archive of Neurology, 67(10), 1231–1237. doi:https://doi.org/10.1001/archneurol.2010.230
- Hebert, L. E., Scherr, P. A., McCann, J. J., Beckett, L. A., & Evans, D. A. (2001). Is the risk of developing Alzheimer’s disease greater for women than for men? American Journal of Epidemiology, 153, 132–136. doi:https://doi.org/10.1093/aje/153.2.132
- Houx, P. J., Shepherd, J., Blauw, G. J., Murphy, M. B., Ford, I., & Bollen, E. L. (2002). Testing cognitive function in elderly populations: The PROSPER study. PROspective Study of Pravastatin in the Elderly at Risk. Journal of Neurology, Neurosurgery, and Psychiatry, 73(4), 385–389. doi:https://doi.org/10.1136/jnnp.73.4.385
- Hozo, S. P., Djulbegovic, B., & Hozo, I. (2005). Estimating the mean and variance from the median, range, and the size of a sample. BMC Medical Research Methodology, 5(1), 13. doi:https://doi.org/10.1186/1471-2288-5-13
- Ibrahim, N. M., Shohaimi, S., Chong, H. T., Rahman, A. H., Razali, R., Esther, E., & Basri, H. B. (2009). Validation study of the Mini-Mental State Examination in a Malay-speaking elderly population in Malaysia. Dementia and GeriatricCognitive Disorders, 27, 247–253. doi:https://doi.org/10.1159/000203888
- Jüni, P., Witschi, A., Bloch, R., & Egger, M. (1999). The hazards of scoring the quality of clinical trials for meta-analysis. The Journal of the American Medical Association, 282(11), 1054–1060. doi:https://doi.org/10.1001/jama.282.11.1054
- Karr, J. E., Graham, R. B., Hofer, S. M., & Muniz-Terrera, G. (2018). When does cognitive decline begin? A systematic review of change point studies on accelerated decline in cognitive and neurological outcomes preceding mild cognitive impairment, dementia, and death. Psychology and Aging, 33(2), 195–218. doi:https://doi.org/10.1037/pag0000236
- Kim, J. W., Lee, D. Y., Seo, E. H., Sohn, B. K., Choe, Y. M., Kim, S. G. … & Kim, K. W. (2014). Improvement of screening accuracy of mini-mental state examination for mild cognitive impairment and non-alzheimer’s disease dementia by supplementation of verbal fluency performance. Psychiatry Investigation, 11(1), 44–51. doi:https://doi.org/10.4306/pi.2014.11.1.44
- Kochhann, R., Varela, J. S., Lisboa, C. S. D. M., & Chaves, M. L. F. (2010). The mini mental state examination: Review of cutoff points adjusted for schooling in a large Southern Brazilian sample. Dementia & Neuropsychologia, 4(1), 35–41. doi:https://doi.org/10.1590/S1980-57642010DN40100006
- Krzywinski, M., & Altman, N. (2013). Points of significance: Error bars. Nature Methods, 10(10), 921–922. doi:https://doi.org/10.1038/nmeth.2659
- Legdeur, N., Binnekade, T. T., Otten, R. H., Badissi, M., Scheltens, P., Visser, P. J., & Maier, A. B. (2017). Cognitive functioning of individuals aged 90 years and older without dementia: A systematic review. Ageing Research Reviews, 36, 42–49. doi:https://doi.org/10.1016/j.arr.2017.02.006
- Legdeur, N., Heymans, M. W., Comijs, H. C., Huisman, M., Maier, A. B., & Visser, P. J. (2018). Age dependency of risk factors for cognitive decline. BMC Geriatrics, 18(1), 187. doi:https://doi.org/10.1186/s12877-018-0876-2
- Legdeur, N., Tijms, B. M., Konijnenberg, E., den Braber, A., Ten Kate, M., Sudre, C. H., … Le Couteur, D. (2019). Associations of brain pathology cognitive and physical markers with age in cognitively normal individuals aged 60–102 years. The Journals of Gerontology: Series A, Biological Science and Medical Science. doi:https://doi.org/10.1093/gerona/glz180
- Legdeur, N., van der Lee, S. J., de Wilde, M., van der Lei, J., Muller, M., Maier, A. B., & Visser, P. J. (2019). The association of vascular disorders with incident dementia in different age groups. Alzheimer’s Research & Therapy, 11(1), 47. doi:https://doi.org/10.1186/s13195-019-0496-x
- Lin, J. S., O’Connor, E., Rossom, R. C., Perdue, L. A., Burda, B. U., Thompson, M., & Eckstrom, E. (2013). U.S. Preventive Services Task Force Evidence Syntheses, formerly Systematic Evidence Reviews Screening for Cognitive Impairment in Older Adults: An Evidence Update for the U.S. Preventive Services Task Force. Rockville (MD): Agency for Healthcare Research and Quality (US).
- Lipnicki, D. M., Makkar, S. R., Crawford, J. D., Thalamuthu, A., Kochan, N. A., & Lima-Costa, M. F. (2019). Determinants of cognitive performance and decline in 20 diverse ethno-regional groups: A COSMIC collaboration cohort study. PLoS Medicine, 16(7), e1002853. doi:https://doi.org/10.1371/journal.pmed.1002853
- Lo, C. K. L., Mertz, D., & Loeb, M. (2014). Newcastle-Ottawa Scale: Comparing reviewers’ to authors’ assessments. BMC Medical Research Methodology, 14(1), 45. doi:https://doi.org/10.1186/1471-2288-14-45
- Mathuranath, P. S., Cherian, J. P., Mathew, R., George, A., Alexander, A., & Sarma, S. P. (2007). Mini-mental state examination and the addenbrooke’s cognitive examination: Effect of education and norms for a multicultural population. Neurology India, 55, 106–110. doi:https://doi.org/10.4103/0028-3886.32779
- Matthews, F., Marioni, R., & Brayne, C. (2012). Examining the influence of gender, education, social class and birth cohort on MMSE tracking over time: A population-based prospective cohort study. BMC Geriatrics, 12(1), 45. doi:https://doi.org/10.1186/1471-2318-12-45
- Messe´, A., Rudrauf, D., Benali, H., & Marrelec, G. (2014). Relating structure and function in the human brain: Relative contributions of anatomy, stationary dynamics, and non-stationarities. PLoS Computational Biology, 10(3), 1–9. doi:https://doi.org/10.1371/journal.pcbi.1003530
- Moher, D., Liberati, A., Tetzlaff, J., & Altman, D. G. (2009). Preferred Reporting Items for Systematic Reviews and Meta-Analyses: The PRISMA Statement. PLoS Medicine, 6(7), e1000097. doi:https://doi.org/10.1371/journal.pmed.1000097
- Muggeo, V. M. (2003). Estimating regression models with unknown break-points. Statistics in Medicine, 22(19), 3055–3071. doi:https://doi.org/10.1002/sim.1545
- Naqvi, R. M., Haider, S., Tomlinson, G., & Alibhai, S. (2015). Cognitive assessments in multicultural populations using the Rowland Universal Dementia Assessment Scale: A systematic review and meta-analysis. Canadian Medical Association Journal, 187(5), E169–75. doi:https://doi.org/10.1503/cmaj.140802
- Nieuwenhuis-Mark, R. E. (2010). The death knoll for the MMSE: Has it outlived its purpose? Journal of Geriatric Psychiatry and Neurology, 23(3), 151–157. doi:https://doi.org/10.1177/0891988710363714
- Pham-Gia, T., & Hung, T. L. (2001). The mean and median absolute deviations. Mathematical and Computer Modelling, 34(7), 921–936. doi:https://doi.org/10.1016/S0895-7177(01)00109-1
- Ravona-Springer, R., Luo, X., Schmeidler, J., Wysocki, M., Lesser, G. T., Rapp, M. A., & Beeri, M. S. (2011). The association of age with rate of cognitive decline in elderly individuals residing in supporting care facilities. Alzheimer Disease and Associated Disorders, 25(4), 312–316. doi:https://doi.org/10.1097/WAD.0b013e31820d880e
- Ray, M., Dening, T., & Crosbie, B. (2019). Dementia and hearing loss: A narrative review. Maturitas, 128, 64–69. doi:https://doi.org/10.1016/j.maturitas.2019.08.001
- Rizzi, L., Rosset, I., & Roriz-Cruz, M. (2014). Global epidemiology of dementia: Alzheimer’s and vascular types. BioMed Research International, 2014, 908915. doi:https://doi.org/10.1155/2014/908915
- Rosli, R., Tan, M. P., Gray, W. K., Subramanian, P., & Chin, A. V. (2016). Cognitive assessment tools in Asia: A systematic review. International Psychogeriatrics, 28(2), 189–210. doi:https://doi.org/10.1017/S1041610215001635
- Sosa, A. L., Albanese, E., Stephan, B. C., Dewey, M., Acosta, D., Ferri, C. P., … Stewart, R. (2012). Prevalence, distribution, and impact of mild cognitive impairment in Latin America, China, and India: A 10/66 population-based study. PLoS Medicine, 9(2), e1001170–e1001170. doi:https://doi.org/10.1371/journal.pmed.1001170
- Stijntjes, M., Aartsen, M. J., Taekema, D. G., Gussekloo, J., Huisman, M., Meskers, C. G. M., … & Maier, A. B. (2017). Temporal relationship between cognitive and physical performance in middle-aged to oldest old People. The Journals of Gerontology: Series A, Biological Science and Medical Science, 72(5), 662–668. doi:https://doi.org/10.1093/gerona/glw133
- Teng, E. L., & Chui, H. C. (1987). The modified mini-mental state (3MS) examination. Journal of Clinical Psychiatry, 48(8), 314–318.
- Tombaugh, T. N. (2005). Test-retest reliable coefficients and 5-year change scores for the MMSE and 3MS. Archives of Clinical Neuropsychology, 20(4), 485–503. doi:https://doi.org/10.1016/j.acn.2004.11.004
- Tombaugh, T. N., McDowell, I., Kristjansson, B., & Hubley, A. (1996). Mini-Mental State Examination (MMSE) and the Modified MMSE (3MS): A psychometric comparison and normative data. American Psychological Association, 8(1), 48–59. doi:https://doi.org/10.1037/1040-3590.8.1.48
- Tombaugh, T. N., & McIntyre, N. J. (1992). The mini-mental state examination: A comprehensive review. Journal of the American Geriatrics Society, 40(9), 922–935. doi:https://doi.org/10.1111/j.1532-5415.1992.tb01992.x
- Tsoi, K. F., Chan, J. C., Hirai, H. W., Wong, S. S., & Kwok, T. Y. (2015). Cognitive tests to detect dementia: A systematic review and meta-analysis. JAMA Internal Medicine, 175(9), 1450–1458. doi:https://doi.org/10.1001/jamainternmed.2015.2152
- van Dam, R., Van Ancum, J. M., Verlaan, S., Scheerman, K., Meskers, C. G. M., & Maier, A. B. (2018). Lower cognitive function in older patients with lower muscle strength and muscle mass. Dementia and Geriatric Cognitive Disorders, 45(3–4), 243–250. doi:https://doi.org/10.1159/000486711
- Viechtbauer, W. (2010). Conducting meta-analyses in R with the metafor package. Journal of statistical software, 36(3), 48. doi:https://doi.org/10.18637/jss.v036.i03