

Abstract
Much of the public debate over Supreme Court nominees focuses on assessments of each nominee’s qualifications, experience, and legal opinions, and how senators’ votes on these nominees seem to be driven largely by partisan politics. We propose and estimate a statistical model that emphasizes the dynamic nature of partisanship while also accounting for factors specific to nominees, the president, and senators respectively. We then examine how the scandal that erupted in the middle of Brett Kavanaugh’s confirmation process influenced senators’ votes. Utilizing forecasting methods, we show that few senators in either party were inclined to defect, no matter how much perceptions of Kavanaugh changed after the allegations against him were publicized. We conclude that, with average party loyalty at record levels, partisan prejudice crowds out consideration of other relevant attributes of Supreme Court nominees.
Appendix
In the text, we claimed that a statistical model based on five variables – whether an individual senator shares a party affiliation with the president, whether the president’s party holds a majority of seats in the Senate, whether the president is in the last year of his term, whether the nominee is perceived as highly qualified, and whether the nominee and an individual senator occupy similar positions on the ideological spectrum – would have predicted that 39 of 41 Republican senators would vote for Sonia Sotomayor and Elena Kagan, and all 48 Democratic senators would vote for Neil Gorsuch.
The probit regression estimates we used to make these forecasts are shown in . We used all nominations from Hugo Black in 1937 to Samuel Alito in 2006 to generate the model parameters. The Traditional Model’s in-sample correct classification rate is about 90% on all senators’ votes from 2007 to 2006, representing a 23.9% reduction of error compared to a null model that predicts every senator voting ‘yea’ on every nominee. To generate an out-of-sample forecast of each senator’s votes on the Sotomayor, Kagan, and Gorsuch nominations, we plugged in appropriate values of each of the five variables listed above, multiplied each by its respective probit coefficient, and then translated the linear combination into a predicted probability of a ‘yea’ vote using the Standard Normal Distribution.
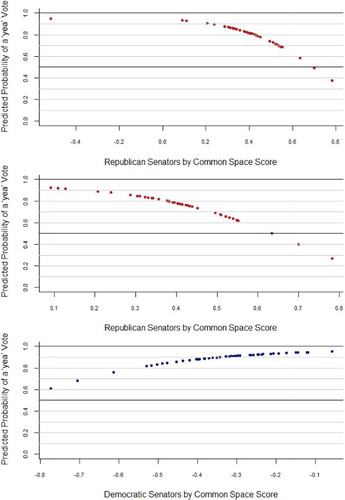
The Traditional Model’s out-of-sample forecasts for senators who belong to the president’s party predict that every senator would vote to confirm. The sole incorrect prediction is Senator Ben Nelson, who voted against Elena Kagan’s confirmation. The Traditional Model’s out-of-sample forecasts for senators who belong to the opposition party predict that most but not all would vote to confirm. displays predicted probabilities of a ‘yea’ vote for all opposition-party senators for these same three nominations.
For Sonia Sotomayor’s nomination, the Traditional Model predicted 39 votes in favor of confirmation and 2 votes against. Both of the predicted ‘nay’ votes were correct: Tom Coburn, who was one of the most conservative senators, had a predicted probability of voting to confirm of about 37.3%, while Jim DeMint had a predicted probability of about 49.5%, which is practically a virtual coin toss. The final vote tally included 9 Republican senators voting in favor and 32 against, meaning that the model predicted 11 of 41 Republican votes correctly.
Elena Kagan’s nomination presents a similar story. Senators Coburn and DeMint again were the only two opposition-party senators predicted to oppose the nominee, with predicted probabilities of a ‘yea’ vote of 27.1% and 39.9%, respectively. The other 39 Republicans were predicted to vote for Kagan’s confirmation. The final vote tally was 5 Republican senators voting in favor and 36 against, meaning the model predicted just 7 of 41 Republican senators’ votes correctly.
Finally, the Traditional Model predicted unanimous support for Neil Gorsuch’s nomination. The opposing-party senator with the lowest probability of support was Elizabeth Warren, at 60.9%, while one opposing party senator and one independent had probabilities of support as high as 94.2%. Only three Democrat senators – Heitkamp, Donnelly, and Manchin – voted to confirm, so the model predicts just 3 of 48 Democratic senators’ votes correctly.
Figure A1. Out-of-Sample Forecasts of Opposition Party Senators’ Votes.
Notes
1 Scalia passed away in February 2016. President Obama nominated Judge Merrick Garland of the D.C. Court of Appeals on March 16, 2016, but the nomination expired on January 3, 2017.
2 Alito’s nomination advanced following a successful 72–25 cloture vote.
3 Senator Johnny Isakson of Georgia was absent while recovering from surgery. The chamber’s partisan division was 52 Republicans, 46 Democrats, and 2 Independents.
4 Kennedy announced his impending retirement from the Supreme Court on June 27, 2018.
5 See Schor and Everett (Citation2018), Politico, July 20, 2018.
6 Blasey Ford made the allegation in a letter sent to Senator Dianne Feinstein on July 30, 2018. Feinstein referred the allegation to the FBI on September 14.
7 Senator Steve Daines of Montana was attending his daughter’s wedding. He “paired” votes with Senator Lisa Murkowski of Alaska. We treat Daines’s vote as ‘yea’ and Murkowski’s as ‘nay’.
8 A roll call vote is a “party unity” vote if majorities of the two parties take opposing sides.
9 A senator’s party loyalty score is the percent of party unity votes on which the senator joins his or her party’s majority.
10 Shipan (2008) also noticed the gap between parties widening over time. Cameron, Kastellec, and Park (2013) examined the same data but identified greater ideological polarization, more extreme nominees, and more mobilized interest groups as causes of more divisiveness.
11 Kastellec et al. (2015) updated this argument, showing that when the state’s median voter adopts a different position from the median of a senator’s party, senators will weigh their fellow partisans’ opinions more heavily in deciding whether to support or oppose a nominee.
12 Trump defeated Clinton 57% to 38% in Indiana, 63% to 27% in North Dakota, and 68% to 26% in West Virginia.
13 Two Democratic senators voted against Gorsuch despite Trump faring as well in their states as in Indiana, and both have higher loyalty levels than Donnelly. Claire McCaskill of Missouri, where Trump defeated Clinton 57% to 38%, had an 82% party loyalty score in 2017. Jon Tester of Montana, where Trump defeated Clinton 56% to 36%, had an 87% party loyalty score.
14 In our sample, Lack of Qualifications has a mean of 0.227 and a standard deviation of 0.254.
15 Segal-Cover ideology scores range from 0 for the most conservative nominee to 1 for the most liberal nominees, while Common Space scores theoretically range from –1 at the liberal pole to +1 at the conservative pole.
16 We use the following equation for bridging:
Common Space score = 0.4296 – .0.8998 × Segal-Cover score.
President Trump’s Common Space score has not been estimated, therefore the bridging equation uses nominations made under unified government from Hugo Black through Elena Kagan.
17 We obtained senators’ party loyalty scores from VoteView for each Congress up to the 112th. CQ Weekly provided party loyalty scores for the 113th to 115th Congresses. We computed the mean level of party loyalty in each Congress, then we subtracted 78.9. Average Party Loyalty has a mean of 0 and standard deviation of 6.35.
18 We compute Relative Party Loyalty for each senator by subtracting Average Party Loyalty in the contemporaneous Congress from the senator’s raw party loyalty score. Relative Party Loyalty has a mean of –.091 with a standard deviation of 16.796.
19 Because the Opposing Party variable is included in interactions, statements about statistical significance or insignificance only applies to its effect when terms it is interacted with equal 0. We examined conditional coefficients, and found that as President’s Vote Share rises from 0 to 1, for example, the marginal effect stays insignificant in the column 2 model and stays significant in the column 3 model.
20 The standard error of the sum of coefficients in column 2 equals 0.008 which yields z = –18.6 and p <0.001. The standard error of the sum of coefficients in column 3 equals 0.008 which yields z = –19.6 and p <0.001.
21 The standard error of the sum of coefficients in column 2 equals 0.003, which yields z = –3.36 and p <0.001. The standard error of the sum of coefficients in column 3 equals 0.003 which yields z = –3.16 and p <0.002.
22 Between 1937 and 2018, a period covering 45 nominations to the Supreme Court, and 4,207 unique votes, 84.6% of senators’ votes were to confirm a nominee. The Contemporary Model reduces errors from 648 to 282; the Traditional Model without the President’s Vote Share or either Party Loyalty variable reduces errors from 649 to 489.
23 In the area of civil liberties, for example, a nominee that supports individual rights against government intrusion would be treated as liberal. No editorials identified Kavanaugh as a liberal or associated him with liberal positions, but several mentioned moderate positions or uncertainty. For example, the St. Louis Post-Dispatch wrote: “It remains unclear how Kavanaugh, 53, would decide on the divisive issue of abortion. The outlook isn't quite as gloomy as some analysts predicted.”
24 Most editorials make explicit statements regarding the nominee’s fitness to serve on the nation’s highest court. Mentions that list the nominee’s credentials, standing with peers, previous experience, service, or achievements were treated as positive, qualified statements. For example, the Wall Street Journal consistently mentions the more than 300 opinions authored by Judge Kavanaugh.