
ABSTRACT
Interest in recovery capital has been growing and there have been increased attempts to quantify this concept. The current paper uses the REC-CAP, a standardized assessment of recovery capital, to predict retention across multiple recovery residence settings and quantify changes in recovery capital and barriers to recovery over the initial period of residence. The REC-CAP was administered by peer navigators at admission and at 90-day intervals thereafter in recovery residences in Virginia, US. Strong effects predicting retention, changes in barriers and recovery capital growth were reported based on risk-taking and addressing acute housing concerns. The strongest effects predicting retention in recovery residences were for people not using substances and not being Black or African American. Reducing barriers to recovery and to improving recovery capital focused on avoiding ongoing substance use, lack of support needs around accommodation, higher psychological wellbeing and measures associated with social support and quality of life. There is a need to develop a holistic, tailored package of support for people in recovery residents to address these core concerns.
Introduction
While the definition of recovery remains highly contested with multiple definitions (Betty Ford Institute Consensus Panel, Citation2007; UK Drug Policy Commission, Citation2008; White, Citation2012), with the Substance Abuse and Mental Health Services Administration (SAMHSA) having a working definition of “A process of change through which individuals improve their health and wellness, live a selfdirected life, and strive to reach their full potential” (Substance Abuse and Mental Health Services Administration, Citation2012, p. 3). More recently, Ashford et al. (Citation2019) have defined recovery as “an individualized, intentional, dynamic, and relational process involving sustained efforts to improve wellness.” The definitions have moved beyond abstinence (to include controlled substance use and ongoing use of prescription medications) and there is some consensus that activities of citizenship and global health are included as equally important components and is about a process that takes place over time, with the Betty Ford definition suggesting that stable recovery (of at least 5 years) is associated with significant gains in control over substance use (or abstinence), improved global health and wellbeing, and active citizenship or participation. Dennis et al. (Citation2014) have argued that recovery is “self-sustaining” around this time as individuals will typically need external support by this point.
In generating a metric of when people reach various milestones along this journey, the concept of recovery capital has evolved from that of social capital (e.g., Bourdieu, Citation1986; Coleman, Citation1988) to characterize resources that are not financial which has generated the possibility of operationalizing recovery capital and affording consistency in measurement (Best & Hennessy, Citation2021). The original definition of recovery capital is “the sum total of one’s resources that can be brought to bear on the initiation and maintenance of substance misuse cessation” (Cloud & Granfield, Citation2008, 1972). In a 2017 systematic review of recovery capital literature and evidence, Hennessy (Citation2017) identified 38 papers from 35 studies but found that there were inconsistencies in the measurement and operationalization of recovery capital and that there had been limited success in both capturing key aspects of community capital and in working with specific populations.
More recently, Best and Hennessy (Citation2021) reviewed 20 years of recovery capital research and considered future directions and requirements for recovery capital research and concluded that “despite burgeoning empirical work on RC [Recovery Capital], its application and translation has been unsystematic” (2021; p.1). The authors further argued that there is a need for systematic and empirical development in recovery capital research and that this should include assessment in specific recovery contexts and with a diverse range of cultural groups and populations.
Attempts at the measurement of recovery capital have led to the development of a small number of research measures including the Recovery Capital Questionnaire (Burns & Marks, Citation2013) which has 28 questions covering the four subdomains measuring social, human, physical, and community recovery capital; the Recovery Capital Index® (Whitesock et al., Citation2018) which was also developed for use in clinical settings, and measures recovery capital across three domains – personal, family/social, and cultural. The third recovery capital measure is the Assessment of Recovery Capital (ARC; Groshkova, Best and W. White, Citation2012) which is a 50-item scale measuring personal and social recovery capital. This was then shortened to the Brief Assessment of Recovery Capital (Vilsaint et al., Citation2017), a ten-item scale developed for utilization in research batteries. However, the ARC in particular has been criticized for not attending sufficiently to structural predictors of recovery or addressing the needs of diverse populations (Bowen et al., Citation2020).
Partially in response to this, the REC-CAP (Cano et al., Citation2017) was published to create a compendium measure of recovery capital that attempted to incorporate both barriers to recovery (addressing the concept of “negative recovery capital” raised by Cloud and Granfield (Citation2008)) and to increase the focus on community aspects of recovery capital. Further, the REC-CAP was designed to be used in a range of applied clinical settings and incorporated a link to recovery care planning and actions around community engagement to ensure that there were active benefits to participants in engaging with this instrument, which was designed to be administered on a 90-day completion and review cycle in a range of applied recovery settings.
One of the key recovery settings that the REC-CAP has been piloted in is recovery residences (Härd et al., Citation2022). Recovery residences were identified in a review by Humphreys and Lembke (Citation2013) as one of three evidenced areas of recovery intervention (along with peer-based recovery support and 12-step mutual aid). Recovery residences focus on reintegration and community engagement, through employment and a safe and stable living situation (Polcin et al., Citation2016), and typically work with a highly marginalized client group (see, e.g., Skogens & Greiff, Citation2014). The National Alliance of Recovery Residences (NARR) has outlined four levels of recovery residence, recognizing the variety of provisions available. Common to all levels is a commitment to abstinence and recovery support, and the provision of communal living arrangements (Polcin et al., Citation2016). Longitudinal studies on recovery residences (Jason et al., Citation2006; Reif et al., Citation2014) have shown that increased rates of employment and lower involvement in offending are associated with a long-term stay in recovery residences. More recently, Jason et al. (Citation2021) studied the effects of social capital on relapse risks in residents departing one of 42 Oxford Houses in the United States. They found that relapse was more likely in individuals who were younger, had left the houses involuntarily and had lower scores on their recovery measure (based on a composite including social support, sense of community, and quality of life). Previously, Jason et al. (Citation2020) had argued that recovery homes can increase social capital through relationships that provide financial support, advice, and friendship.
The study addresses three main research questions:
What are the factors (based on demographics, recovery barriers and unmet needs, and recovery capital) that predict retention in recovery residences in Virginia?
What are the factors (based on demographics, recovery barriers and unmet needs, and recovery capital) that predict positive growth in personal and social recovery capital (as measured by the ARC) over time in recovery residences?
What is the overall trajectory of recovery capital (including barriers and unmet needs) over time in recovery residences, including analysis of change of a single measure for overall recovery capital?
Methods
Design and procedure
The REC-CAP was introduced as part of routine data collecting accessible to all recovery residences certified by the Virginia Association of Recovery Residences (VARR) in Virginia in 2021, and at the time of initial recruitment there were around 50 providers of recovery residences offering a total of around 1,000 recovery residence beds in the state. All of the residences were classified as either Level 2 or Level 3 in the NARR standards.Footnote1 NARR Standards range from Level 1 (which is minimal support) to Level 4 (which is clinically supported). Residents completed their baseline REC-CAP form (based on online data completion) as close to admission to the residence as possible, and then 45 days later, 90 days after admission, at 135 days and then on a 90-day cycle for the remainder of their period of residency. All new residents were provided with written information and gave written consent for their completed REC-CAP forms to be used (in an anonymized fashion) for research purposes.
Settings – recovery residences
Recovery residences certified through the Virginia Association of Recovery Residences (VARR) that operate at Level 2 and Level 3 as defined by NARR 3.0 Standards. These standards (National Alliance of Recovery Residences, Citation2012) outline four levels of recovery residence, based on how they are administered and the level of staffing. Common to all levels is the attitude to abstinence and recovery support, and the provision of communal living arrangements (Polcin et al., Citation2016). Each house will have a House Manager who is likely to be a peer in recovery and will require residents to attend mutual aid meetings and to abide by the rules of the house. While there is no upper limit to the length of stay, it is regarded that between 1 year and 18 months may be the optimal duration of stay (e.g., Polcin et al., Citation2010) and then participants would be expected to move on to more independent forms of living.
Instrument
The REC-CAP (Cano et al., Citation2017) was reported to have acceptable psychometrics in an initial pilot study with a group of eight recovery residences (also certified through a NARR affiliate, the Florida Association of Recovery Residences).
The REC-CAP consists of the following established validated research tools: The Assessment of Recovery Capital [ARC] (Groshkova, Best and W. White, Citation2012); The Recovery Group Participation Scale [RGPS] (Groshkova et al., Citation2013); The Commitment to Sobriety Scale [CSS] (Kelly and Greene, Citation2014); The wellbeing measures from the Treatment Outcome Profile (Delgadillo et al., Citation2013) and Barriers to recovery scale adapted from the Treatment Outcome Profile (Delgadillo et al., Citation2013). The scores for each scale are collated to create a total ranging from between −100 and 0 for negative recovery capital (barriers + unmet needs) and from between 0 and 100 for positive recovery capital (personal recovery capital + social recovery capital + community recovery capital + commitment to sobriety).
A unique component of this study is that we are able to calculate a composite score (referred to as the Overall Recovery Capital Score [ORCS]) where the total score for positive capital is calculated out of 100 (0–100) based on the scores from overall wellbeing, commitment to sobriety, personal, social, and community capital. Additionally, a total score of “negative recovery capital” is calculated by combining barriers to recovery to unmet needs to give a score ranging from 0 to −100). This allows a total Overall Recovery Capital Score to be calculated for each participant with a possible range of scores from −100 to 100).
Participants
The data presented comprises 3,681 records from 2,182 individuals engaged with recovery residences in Virginia and coordinated through VARR of whom 1,469 (67%) have been assessed only once (“Not Retained”) and 713 providing provided more than one assessment (“Retained”). The data were routine data collected, with permission for research use, by providers through the Advanced Recovery Management System (ARMS), the online platform used for the collection of REC-CAP data in recovery residences in Virginia.
Analysis
Measuring non-retention - logistic regression modeling
To explore the REC-CAP factors associated with retention, a binary regression model was conducted. However, while the binary outcome totals were fully completed, some prognostics were missing, especially subject “age” which had about 350 people with no reported age (16%). This level of missing data results in a notable number of people whose records would be discarded when a standard binary regression model is conducted. With the aim of not dropping any subjects, we address the issue of missing data by applying Multivariate Imputation by Chained Equations or MICE (Azur et al., Citation2011) that simulates missing values multiple times to create multiple completed datasets. Such replacements (“imputations”) are based on models which are conditional on the observed data as predictors and are applied sequentially. Finally, MICE requires that standard modeling techniques be modified to account for the extra variability in the dataset induced by the multiply simulated missing data.
The initial database contained over 500 variables which were recoded into their component parts of REC-CAP to mirror the assessment sections (socio-demographics, quality of life and satisfaction, barriers to recovery, service involvement and needs, ARC measures including the personal and social recovery capital domains, involvement in recovery groups, support and commitment to recovery). As a result of this recoding, a final set of 33 explanatory variables was created. Moreover, the prognostic ARC is the sum of the two prognostics, Social Recovery Capital (SRC) and Personal Recovery Capital (PRC), with these domains providing five sub-domains each. Hence, it is not possible to include all ARC scores, as three of these will be omitted by the modeling routine because of their linear dependency or complete determination, as these are sums of other individual scores. The analysis proceeded by including the 10 individual components comprising the SRC and PRC, reducing the set of explanatory variables to 30.
In addition to missing cases for age, small numbers of missing cases were noted across 10 other variables. In total, there were 369 people with at least one missing value within their record, representing 17% of all cases. Following recommendations by Sterne et al. (Citation2009) and White et al. (Citation2010, p. 20) imputations for reducing the sampling variability of the imputation process were generated, with a starting seed of one for the reproduction of imputations. Two different imputation models were used: a logistic model to impute three binary prognostics of risk-taking (barriers), substance use (barriers), and family relationships (unmet needs); and a predictive mean matching model (pmm) to impute two continuous variables (Client age, Commitment Scale [0–30]) when the distribution cannot be assumed to be normal; the same model was used for six variables on an integer scale from 0 to 5. The number of nearest neighbors from which to impute was 1. For this study, it was assumed that the missing data mechanism is Missing at Random, or MAR (Van Buuren, Citation2018). As part of the recommended process, the appropriateness of the imputation models formulated above using diagnostic plots was assessed by examining how the distribution of imputed value compare with that of the observed values (Marchenko & Eddings, Citation2012). The density estimation of the distribution of 20 imputations was compared to observed data for “Age” (350 missing values) and “Barriers to Risk Taking” (16 missing values), which concluded that the distributions of all 20 sets of imputed data resembled the observed data. The contributed package called -mim- (Royston et al., Citation2009) was used for conducting stepwise backward selection on the imputed dataset.
Measuring changes in recovery capital - linear mixed models
A series of linear mixed models were used with repeated measures data to accommodate both the effect of time and the covariation between records on the same subject at different times (Brown & Prescott, Citation2006).
Findings
Population description
A description of the population (number of individuals) at the first assessment is shown in . Just under two-thirds of the dataset, 63.7% (n = 1,389), of those assessed were recorded as male, with an average age of 37.2 years (range 18–75 years, SD = 10.5). Over two-thirds (67.2%, n = 1,467) of those assessed were reported to be Caucasian with 22.6% (n = 493) recorded as “Black or African American.” A smaller number and proportion of clients were reported as “Missing” (6.8%, n = 149) with low numbers recorded as “Hispanic” (1.6%, n = 36), “Other” (1.6%, n = 34) and “Asian” (0.1%, n = 3).
Table 1. Summary socio-demographi.c characteristics, n = 2,182.
Non-retention
The analysis identified eight explanatory variables as statistically significant (see ). In terms of effect size, whether a service user was Black or African American (OR 1.868, 95% CI 1.466, 2.238) and barriers to recovery such as the use of substances (OR 1.815, 95% 1.502, 2.193) were the main reasons for not being retained. In addition, unmet needs around housing support (OR 1.380, 95% CI 1.08, 1.77), being female (OR 1.248, 95% CI 1.014, 1.511) and measures of recovery capital for Physical Health (Personal Recovery Capital) were also associated with not being retained (1.093, 95% CI 1.009–1.184) such that those reporting better physical health were less likely to be retained. Negative associations for not being retained included the need for primary care services where an increased need for general practitioner services reduced the odds of not being retained (OR 0.777, 95% CI 0.621–0.972) and for Housing and Safety (a measure of Social Recovery Capital) such that the higher the score, the lower the odds of not being retained (OR 0.879, 95% CI 0.793–0.975). The importance of the social recovery domain within ARC was also a key factor with the Citizenship/Community Involvement showing that the higher the score, the lower the odds of not being retained (OR 0.880, 95% CI 0.793, 0.976)
Table 2. Logistic regression model (“Not-retained” as outcome measure).
Changes in recovery: improvements to recovery capital
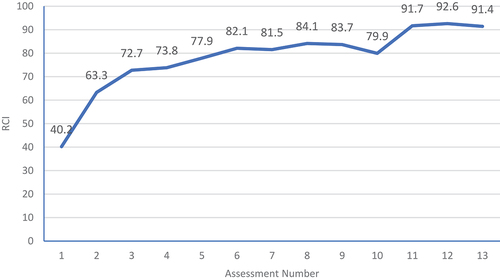
The ORCS was calculated across the assessments from baseline across the multiple assessments. As shown in , the overall change in recovery capital (as measured by the ORCS) is encouraging with marked growth from baseline to first follow-up (from a mean of 40.2 to 63.3) and a further increase from first to second follow-up of a further mean increase of 9.4 points on the total ORCS). The rate of increase diminishes beyond this point but gains are largely sustained across the period of retention in the recovery residences for those retained in the residences and completing follow-up assessments.
Figure 1. Changes in Overall Recovery Capital Score (ORCS) over Assessments.
The outcome measure used to measure changes in recovery capital is the total score on the Assessment of Recovery Capital (ARC; Groshkova et al., Citation2013), with a total range from 0 to 50. The interpretation of the effect sizes shows that nine measures were considered statistically significantly associated with changes in the ARC score. Substance Use (Barrier) was shown to have the largest effect on changes in recovery capital such that the mean ARC score of clients who used substances was 2.19 points lower than those who did not use substances (see ). Those who exhibited Risk-Taking (Barrier) behaviors had a 1.86 lower ARC score than non-risk takers. Mental Health (Unmet Need) was also shown to be significant with people who stated they needed further help for their mental health issues was 1.48 points lower than those with no mental health needs. Accommodation (Barrier) as a barrier to recovery was also highlighted such that the average (mean) ARC score of clients who had housing problems was 1.39 points lower than those with no issues. Family and Relationships (Unmet Need) show that the mean ARC score of clients who required family support was 1.24 points lower than those with no need. In other words, the presence of both barriers and unmet needs were strongly associated with lower recovery capital total scores.
Table 3. Regression coefficients of the fitted marginal model, ARC.
Table 4. Regression coefficients of the fitted marginal model, barriers to recovery.
In addition, there were four weaker, positive relationships with improvements in recovery capital over time including Recovery Group Participation (on the RGPS) leading to a higher average ARC score (0.62), Commitment to Sobriety with higher scores increasing the mean ARC score (0.46), Social Support with higher scores associated with a higher mean ARC (0.38) and Quality of Life (QoL) where a higher QoL measure was associated with a higher mean ARC score (0.13).
Changes in recovery: relationship with barriers to recovery
This negative recovery capital outcome is derived as the sum of the five individual components (accommodation, risk-taking, substance misuse, involvement with the criminal justice system and lack of engagement with work, training, and volunteering), each on a binary scale (see ). The interpretation of the effect sizes shows that 11 measures were considered statistically significantly associated with changes in the Total Barriers to Recovery score. The largest effect associated with barriers to recovery was unmet health need (0.33 higher than those with no need) and an unmet housing need (0.26 higher than those with no need). Surprisingly, greater Citizenship and Community Involvement increased the higher the average total barriers (0.15), as did higher scores for Psychological Health (higher mean barriers score of 0.07) and the higher the Commitment to Sobriety, the higher the level of barriers (0.03).
Six measures indicated a negative association with barriers to recovery. The higher the Substance Use and Sobriety score the lower the mean barriers score (0.31), clients who had an unmet need for alcohol treatment (0.26) and an unmet need for employment services (0.13) had a lower level of reported Barriers than those with no need. Age was a factor such that the older the person the lower the total Barriers score (0.01) such that a 10-year increase in age is associated with a 0.1 unit decrease in total Barrier score. The higher the Coping and Life Functioning was reported lower the mean Barrier score (0.08) and finally also significant was the higher the QoL reported, the lower the total Barrier score (0.004).
Discussion
This paper adds to a growing literature showing the potential of measuring recovery capital as a method of monitoring progress in recovery services. The REC-CAP total score, as with one of its constituent parts, the Assessment of Recovery Capital, not only shows change over time but also shows significant improvements and the capacity to predict retention in recovery residences. This is based on a combination of demographics, recovery resources (in particular recovery group participation) but also barriers to recovery. As has previously been reported by Sanchez, Sahker and Arndt (Citation2020), engagement with recovery resources is associated with improvements in recovery capital supporting the evidence base around the benefits of recovery housing (Humphreys & Lembke, Citation2013; Polcin et al., Citation2016).
This paper builds on the recent findings of a study using the REC-CAP with a single recovery residence in Florida (Härd et al., Citation2022) and shows similar findings in relation to retention with key demographics extended in the current study in showing that Black ethnicity may also be a barrier to retention in recovery residences. This study also extended the findings by charting changes in the Overall Recovery Capital Score (ORCS) showing that there are gradual improvements over time, but that these primarily derive from reductions in barriers and unmet needs as well as increases in recovery group participation. This shows the importance of active community engagement and recovery engagement in both improved retention and in the growth of recovery capital over time. The current findings are consistent with the findings of Jason et al. (Citation2020, Citation2021) that social integration in recovery residences is a key aspect of their success, building social capital, and those who struggle with the necessary social skills and social integration may both be at greater risk of early departure and less likely to show enhanced social (and overall recovery) capital during their stay. This paper would suggest, in contrast to the Hard et al. findings, that recovery services may need to focus on reducing barriers in the first instance, before sustainable strengths can be built.
To explore some of these findings in more depth, this paper examined three critical components associated with people accessing recovery housing: (a) what drives non-retention; (b) what are the perceived barriers to recovery; and (c) what factors are associated with changes in recovery as measured by the ARC. Overall, the analysis provides a multifactorial model involving a combination of demographics, economic needs (housing, employment), engagement with key ancillary services, and recovery resources (in particular recovery group participation). Strong effects were noted across the three domains, showing the importance of addressing sobriety and risk-taking and addressing acute accommodation concerns. These findings are consistent with other research showing relapse in recovery housing to be associated with severity of substance use and psychiatric problems (Harvey et al., Citation2016). In addition, to enhance recovery capital and reduce barriers to recovery, the importance of understanding the nature of a person’s mental health needs and the factors associated with perceptions of quality of life were identified. The interactions between quality-of-life and psychological needs among abstinent opiate users in recovery have also been shown in the UK (Sondhi et al., Citation2020).
Furthermore, our focus on understanding retention in recovery residences has demonstrated a high overall attrition rate with a strong effect noted for disengaging among Black or African American residents and for those currently using substances. The finding in this section highlights a major limitation around recovery research – that most of it has been conducted in English-language countries and with primarily white, male, and middle-aged samples of heroin and alcohol users. There is a critical gap in the literature around culture, gender, and ethnicity that urgently requires additional investigation including, but not restricted to, recovery residence research. The analysis was also able to identify the additional risk of early drop-out associated with women and those who reported greater unmet needs around housing, physical health needs, and those reporting less active participation in the community. We have made a conservative assumption that all those not participating in follow-ups have dropped out for negative reasons, although some may have transferred to other residences or have left for positive reasons. Nonetheless, the attrition issue suggests that the opportunity may exist to target interventions for people at elevated risk of drop-out based in part on boosting active participation in the recovery and the wider community, as suggested by Best and Hennessy (Citation2021).
There are important practice implications resulting from the current findings, including the capacity of the REC-CAP to identify both individuals (based on their levels of community engagement and involvement with recovery services; as well as their unmet needs and ongoing substance use and risk-taking) and groups (based on ethnicity and gender) who may be at risk of non-retention in the recovery residence sector. Furthermore, both baseline recovery capital scores and changes in these scores may also be important in decision-making around community engagement and involvement in education and training. However, as Best and Hennessy (Citation2021) have argued, we are still in the early days of measurement and outcome monitoring using recovery capital measurement tools.
There are several significant limitations that we need to be aware of that partly result from data challenges (such as the missing data for age) and the decreasing number of retained cases beyond the first completion of the survey. The high attrition rate means that this cannot be regarded in any way as outcome data and is a measure of effective engagement, and this is compounded with the large number of cases where age data were missing. Future work in this area will attempt to examine more closely discharge reasons and we will attempt to create personalized links so that we can track movement between residences and compare first-time and repeat admissions to residences and build on the effects on ethnicity and gender reported in this paper.
We also do not have data on the reasons for discharge or indeed where people are discharged, and this is one of the limitations of using routine service data, even where the tools have established psychometric properties as with the REC-CAP (Cano et al., Citation2017). One of our key research priorities is now to replicate this study using an Intention To Treat (ITT) design that would allow us to follow up with those who leave the recovery residences and compare their outcomes to those who are retained. We also have no “objective” methods of validating the self-report provided, and there may have been demand characteristic biases resulting from both self-report and the levels of input from peer navigators who were tasked in the existing study with supporting the completion of the REC-CAP tool.
Conclusion
Nonetheless, the study has demonstrated the feasibility of collecting large amounts of REC-CAP data with no specialist researcher involvement in data collection, suggesting that this is an acceptable measure for residents and staff in this setting, and also showing both predictors of retention and predictable patterns of change in strengths and barriers to recovery. We suggest that there is a need for Recovery Housing providers to use the REC-CAP to focus on the immediate and acute needs of their residents, with a focus on managing ongoing substance use, and to develop bespoke support (for example, strengthening ties with housing departments). Furthermore, once clients are retained in recovery housing, there is a need to facilitate improvements in recovery capital and to reduce the barriers to recovery through a focus on psychological well-being and understanding the correlates to an individual’s quality of life.
Acknowledgments
The authors would like to thank all of the staff at participating residences in Virginia and all of the residents who volunteered their time to complete these forms.
Disclosure statement
No potential conflict of interest was reported by the author(s).
Additional information
Funding
Notes
1. According to the National Association of Recovery Residences (Citation2012) a Level 2 residence (described as Monitored Recovery Residences) offers a minimal level of support and structure (including a house manager who is often compensated for their role) with limited access to external resources, and peer run groups and a clear set of policies and procedures for the running of the house. Level 3 (Supervised Recovery Residences) affords a higher degree of structure typically for people transitioning for treatment with the emphasis on life skills development.
References
- Ashford, R. D., Brown, A., Brown, T., Callis, J., Cleveland, H. H., Eisenhart, E., Groover, H., Hayes, N., Johnston, T., Kimball, T., Manteuffel, B., McDaniel, J., Montgomery, L., Phillips, S., Polacek, M., Statman, M., & Whitney, J. (2019). Defining and operationalizing the phenomena of recovery: A working definition from the recovery science research collaborative. Addiction Research & Theory, 27(3), 179–188. https://doi.org/10.1080/16066359.2018.1515352
- Azur, M., Stuart, E., & Leaf, P. (2011). Multiple imputation by chained equations: What is it and how does it work? International Journal of Methods in Psychiatric Research, 20(1), 40–49. https://doi.org/10.1002/mpr.329
- Best, D., & Hennessy, E. A. (2021). The science of recovery capital: Where do we go from here? Addiction, 117(4), 1139–1145. https://doi.org/10.1111/add.15732
- Betty Ford Institute Consensus Panel. (2007). What is recovery? A working definition from the Betty Ford Institute. Journal of Substance Abuse Treatment, 33(3), 221–228. https://doi.org/10.1016/j.jsat.2007.06.001
- Bourdieu, P. (1986). The forms of capital. In J. Richardson (Ed.), Handbook of theory and research for the sociology of education (pp. 241–258). Westport, CT: Greenwood.
- Bowen, E. A., Scott, C. F., Irish, A., & Nochajski, T. H. (2020). Psychometric properties of the Assessment of Recovery Capital (ARC) instrument in a diverse low-income sample. Substance Use & Misuse, 55(1), 108–118. https://doi.org/10.1080/10826084.2019.1657148
- Brown, H., & Prescott, R. (2006). Applied mixed models in medicine (2nd ed.). Wiley.
- Burns, J., & Marks, D. (2013). Can recovery capital predict addiction problem severity? Alcoholism Treatment Quarterly, 31(3), 303–320. https://doi.org/10.1080/07347324.2013.800430
- Cano, I., Best, D., Edwards, M., & Lehman, J. (2017). Recovery capital pathways: Modelling the components of recovery wellbeing. Drug and Alcohol Dependence, 181, 11–19. https://doi.org/10.1016/j.drugalcdep.2017.09.002
- Cloud, W., & Granfield, R. (2008). Conceptualizing recovery capital: Expansion of a theoretical construct. Substance Use & Misuse, 43(12–13), 1971–1986. https://doi.org/10.1080/10826080802289762
- Coleman, J. S. (1988). Social capital in the creation of human capital. The American Journal of Sociology, 94, S95–120. https://doi.org/10.1086/228943
- Delgadillo, J., Payne, S., Gilbody, S., & Godfrey, C. (2013). Psychometric properties of the Treatment Outcomes Profile (TOP) psychological health scale. Mental Health and Substance Use, 6(2), 140–149.
- Dennis, M. L., Scott, C. K., & Laudet, A. (2014). Beyond bricks and mortar: Recent research on substance use disorder recovery management. Current Psychiatry Reports, 16(4), 1–7. https://doi.org/10.1007/s11920-014-0442-3
- Groshkova, T., Best, D., & White, W. (2013). The a ssessment of Recovery C apital: Properties and psychometrics of a measure of addiction recovery strengths. Drug and Alcohol Review, 32(2), 187–194. https://doi.org/10.1111/j.1465-3362.2012.00489.x
- Härd, S., Best, D., Sondhi, A., Lehman, J., & Riccardi, R. (2022). The growth of recovery capital in clients of recovery residences in Florida, USA: A quantitative pilot study of changes in REC-CAP profile scores. Substance Abuse Treatment, Prevention, and Policy, 17, 58. https://doi.org/10.1186/s13011-022-00488-w
- Harvey, R., Jason, L. A., & Ferrari, J. R. (2016). Substance abuse relapse in Oxford House recovery homes: A survival analysis evaluation. Substance Abuse, 37(2), 281–285. https://doi.org/10.1080/08897077.2015.1080786
- Hennessy, E. A. (2017). Recovery capital: A systematic review of the literature. Addiction Research & Theory, 25(5), 349–360. https://doi.org/10.1080/16066359.2017.1297990
- Humphreys, K., & Lembke, A. (2013). Recovery-oriented policy and care systems in the UK and USA. Drug and Alcohol Review, 33(10), 8–13. https://doi.org/10.1111/dar.12092
- Jason, L., Guerrero, M., Stoolmiller, M., Light, M., & Stoolmiller, M. (2021). Personal and environmental social capital predictors of relapse following departure from recovery homes. Drugs, 28(5), 504–510. https://doi.org/10.1080/09687637.2020.1856787
- Jason, L. A., Olson, B. D., Ferrari, J. R., & Lo Sasso, A. T. (2006). Communal housing settings enhance substance abuse recovery. American Journal of Public Health, 96(10), 1727–1729. https://doi.org/10.2105/AJPH.2005.070839
- Jason, L., Stevens, E., Doogan, N., & Light, J. (2020). An empirically based theory of the relationships between social embeddedness, economic viability, learned recovery skills and perceived quality of life. Alcoholism Treatment Quarterly, 38(1), 126–142. https://doi.org/10.1080/07347324.2019.1633977
- Kelly, J., & Greene, M. (2014). Beyond motivation: Initial validation of the commitment to sobriety scale. Journal of Substance Abuse Treatment, Epub 2013 Aug 15. PMID: 23953168; PMCID: PMC3840075. 46(2), 257–263. https://doi.org/10.1016/j.jsat.2013.06.010
- Marchenko, Y., & Eddings, W. (2012). Diagnostics for multiple imputation in Stata. The Stata Journal, 12(3), 353–367. https://doi.org/10.1177/1536867X1201200301
- National Association of Recovery Residences. (2012) A primer on recovery residences, national association of recovery residences. www.narronline.com.
- Polcin, D. L., Korcha, R. A., Bond, J., & Galloway, G. (2010). Sober living houses for alcohol and drug dependence: 18-month outcomes. Journal of Substance Abuse Treatment, 38(4), 356–365. https://doi.org/10.1016/j.jsat.2010.02.003
- Polcin, D. L., Mericle, A. A., Callahan, S., Harvey, R., & Jason, L. A. (2016). Challenges and rewards of conducting research on recovery residences for alcohol and drug disorders. Journal of Drug Issues, 46(1), 51–63. https://doi.org/10.1177/0022042615616432
- Reif, S., George, P., Braude, L., Dougherty, R. H., Daniels, A. S., Ghose, S. S., & Delphin-Rittmon, M. E. (2014). Recovery housing: Assessing the evidence. Psychiatric Services, 65(3), 295–300. https://doi.org/10.1176/appi.ps.201300243
- Royston, P., Carlin, J., & White, I. (2009). Multiple imputation of missing values: New features for mim. The Stata Journal, 9(2), 252–264. https://doi.org/10.1177/1536867X0900900205
- Sánchez, J, Sahker, E., & Arndt, S. (2020). The Assessment of Recovery Capital (ARC) predicts substance abuse treatment completion, Addictive Behaviors, 106189. Epub 2019 Oct 23. PMID: 31778848. https://doi.org/10.1016/j.addbeh.2019.106189
- Skogens, L., & Greiff, N. V. (2014). Recovery capital in the process of change: Differences and similarities between groups of clients treated for alcohol or drug problems. European Journal of Social Work, 17(1), 58–73. https://doi.org/10.1080/13691457.2012.739559
- Sondhi, A., Pointon, L., Kawalek, A., Leidi, A., & Best, D. (2020). Factors associated with concurrent illicit use of opiates and crack/cocaine among opiate-users in treatment: Implications for treatment services in England. Addiction Research & Theory, 28(4), 298–304. https://doi.org/10.1080/16066359.2019.1647176
- Sterne, J. A., White, I. R., Carlin, J. B., Spratt, M., Royston, P., Kenward, M. G., Wood, A. M., & Carpenter, J. R. (2009). Multiple imputation for missing data in epidemiological and clinical research: Potential and pitfalls. British Medical Journal, 338.
- Substance Abuse and Mental Health Services Administration. (2012) . Samhsa’s working definition of recovery: 10 guiding principles of recovery. SAMHSA’s Working Definition of Recovery.
- UK Drug Policy Commission. (2008). The UK drug policy commission recovery consensus group: A vision of recovery. UK Drug Policy Commission. HM Government.
- Van Buuren, S. (2018). Flexible imputation of missing data. CRC press.
- Vilsaint, C. L., Kelly, J. F., Bergman, B. G., Groshkova, T., Best, D., & White, W. (2017). Development and validation of a Brief Assessment of Recovery Capital (BARC-10) for alcohol and drug use disorder. Drug and Alcohol Dependence, 177, 71–76. https://doi.org/10.1016/j.drugalcdep.2017.03.022
- White, W. (2012). Recovery carriers. (accessed 1 6. 2021) www.williamwhitepapers.com
- White, I., Royston, P., & Wood, A. (2010). Multiple imputation using chained equations: Issues and guidance for practice. Statistics in Medicine, 30(4), 377–399. https://doi.org/10.1002/sim.4067
- Whitesock, D., Zhao, J., Goettsch, K., & Hanson, J. (2018). Validating a survey for addiction wellness: The recovery capital Index. South Dakota Medicine: The Journal of the South Dakota State Medical Association, 71(5), 202. https://doi.org/10.1146/annurev.soc.24.1.1/