
 ?Mathematical formulae have been encoded as MathML and are displayed in this HTML version using MathJax in order to improve their display. Uncheck the box to turn MathJax off. This feature requires Javascript. Click on a formula to zoom.
Abstract
We use extreme value theory methods to infer conventionally unobservable connections between financial institutions from joint extreme movements in credit default swap spreads and equity returns. Estimated pairwise co-crash probabilities identify significant connections among up to 186 financial institutions prior to the crisis of 2007/2008. Financial institutions that were very central prior to the crisis were more likely to be bailed out during the crisis or receive the status of systemically important institutions. This result remains intact also after controlling for indicators of too-big-to-fail concerns, systemic, systematic, and idiosyncratic risks. Both credit default swap (CDS)-based and equity-based connections are significant predictors of bailouts. Supplementary materials for this article are available online.
1. INTRODUCTION
Since the Global Financial Crisis of 2007/2008, regulators and academics agree that systemically important financial institutions (SIFIs) deserve additional supervisory scrutiny given their pivotal role in the functioning of the financial system. Freixas and Rochet (Citation2013) called for a centralized prudential regulator, instead of national authorities, with a far-reaching mandate to tax banks for contributing to systemic risks and discipline SIFI management. Contemporary regulation does not follow these suggestions literally. But the introduction of the Single Supervisory Mechanism in Europe and systemic capital charges under Basel III (Citation2013) underscore the objective to account for systemic risk in future regulation.
Which financial institutions qualify as systemically relevant and why? Besides the sheer size of financial institutions, Eisenberg and Noe (Citation2001) emphasized the importance of network connections to assess the systemic risk of financial institutions and systems. The Bank for International Settlements (Citation2013) listed accordingly the interconnectedness of financial institutions as an important (co-)determinant of an SIFI. But in practice, connections between financial institutions are often unobservable (see Upper Citation2011; Cerutti, Claessens, and McGuire Citation2014).
We suggest to infer interconnectedness from the joint likelihood of extreme credit risk and equity price movements between global financial institutions from various sectors prior to the crisis. To validate our inferred measures of interconnectedness, we argue that observed bailouts in response to the financial crisis of 2007/2008 reveal which financial institutions were considered SIFIs by policy makers and pursue a three-step procedure.
First, we use extreme value theory (EVT) to present a method to estimate the so-called co-crash probability (CCP, Hartmann et al. Citation2004). CCPs measure the probability of an extreme joint increase in credit default swap (CDS) spreads or a substantial deterioration of equity prices for pairs of financial institutions. CDS spreads gauge credit risk links in the network of global financial institutions to the extent that they reflect market participants’ expectations of credit defaults (see Duffie Citation2010). Extreme co-movements of equity prices capture the argument in Acharya (Citation2009) and Wagner (Citation2011) that shocks to a common exposure lead to a joint deterioration of market value of equity for all financial institutions (see, e.g., Ibragimov, Jaffee, and Walden Citation2011, for empirical evidence).
Second, we identify significant connections between financial institutions from CCPs based on data from before the Global Financial Crisis with two alternative methods. Based on these significant CCPs, we then measure network centrality and identify very connected institutions, that is, SIFIs. We curb thereby the notorious unobservability of network ties among financial firms by both regulators and market participants alike.
Third, we test if these inferred interconnectedness indicators correlate with observable policy choices. We use connectivity indicators to predict observed bailouts during the crisis of 2007/2008 and thereafter. Bailouts are defined as capital injections and/or asset support measures issued by governments to rescue distressed banks that have been collected in Stolz and Wedow (Citation2010). Additionally, we explain the classification of Global Systemically Important Banks constructed by the Financial Stability Board (FSB Citation2013) with past measures of connectivity. We argue that these observed policy actions reveal the systemic importance assigned by regulators to these banks.
We are neither the first to use EVT to measure extreme joint movement of equity returns (see Longines and Solnik Citation2001; Hartmann et al. Citation2004) nor are we the first to use CDS spreads to measure contagion as one dimension of systemic importance (see Jorion and Zhang Citation2007, Citation2009; Duffie Citation2010). But we are the first to suggest a practical indicator of financial institutions’ interconnectedness that we relate to observed policy choices, which reveal the assessment of an institutions’ systemic (perceived) importance by regulators.
Connectivity rankings based on network centrality measures feature a number of arguably important banks as central according to both equity- and CDS-implied network interconnectedness (e.g., Lehman Brothers, Bear Stearns, or Commerzbank). However, rank-order correlations across different types of network centrality and CDS- versus equity-based rankings are relatively low at around 28%. Network importance of potential SIFIs should therefore be assessed according to both implied credit and equity connections. Logit regressions confirm that higher precrisis network centrality of financial firms based on CDS spreads increase the likelihood of a government bailout after controlling for size, systemic, idiosyncratic, and market risk of the firm. Importantly, the sheer number of connections in both CDS and equity markets bears little explanatory power for bailouts during the crisis. Especially financial firms that are important gatekeepers in connecting not many, but other central players in financial markets with another were more likely to receive bailouts.
2. DATA ON CDS SPREADS AND STOCK PRICE RETURNS
We gauge the role of connectivity for systemic risk by estimating the probability of a simultaneous and drastic deterioration of the financial condition for a pair of financial firms. A relatively high CCP can be the result of direct counter-party risk when an obligor fails to meet its obligations to the creditor, or through joint asset exposures to common risk factors that wipe out equity. Therefore, we use both data on the joint occurrence of extremely negative equity returns as in Hartmann et al. (Citation2004) and de Jonghe (Citation2010) and extremely positive changes in CDS spreads (Jorion and Zhang Citation2007, Citation2009).
Our motivation to base connectivity on market prices for CDS and stocks rather than, for example, interbank asset and liability exposures is driven by the ability of institutions to hedge financial risks associated with these positions through a third-party insurer. In this light, Arora et al. (Citation2012) found that counterparty credit risk associated with dealer firms in CDS contracts is priced in the spreads of the contracts. Besides notorious unobservability, exposures to credit-risk via the interbank market therefore only provide a partial view on connectivity, since the de facto tie may actually be between the bank and the insurer.
Note that we remain deliberately agnostic as to the reasons for drastic joint deterioration of financial firm value. We argue that neither market participants nor regulators usually observe all potential contagion channels. Instead, we propose a method how to estimate CCPs from either equity return or CDS spread series.
We obtain CDS spread data from the Markit Group and use only the precrisis period data (January 1, 2004–August 8, 2007). The latter date marks the day when the first concerted liquidity provision by central banks around the globe took place. We focus on this time period since our objective is to test whether precrisis indicators of interconnectedness pertain significantly to revealed future policy actions during the crisis. Evidence of a positive relationship aids the validation of our inferred indicators, which would then coincide with regulators assessment of financial firms’ importance for the entire system.
The sample comprises quotes of more than 30 dealers for all trading days during the period. Markit screens these quotes and removes outliers and stale observations. Markit calculates a daily composite spread only if at least two quotes remain. CDS spread quotes are the most widely used source of CDS data in the literature (Mayordomo et al. Citation2013). We use CDS spreads of contracts with a maturity of 5 years, which are most liquid. Where needed, we choose the most liquid currency, usually U.S. dollars or Euros. We select the CDS spreads based on the ex-restructuring clause for institutions from North America, modified-modified restructuring for Western Europe, and old restructuring for Asia. After culling the data, we end up with CDS spreads for 186 financial firms. We obtain stock price data for 164 institutions from Bloomberg, which are adjusted for stock splits.
shows descriptive statistics on CDS spreads and stock price returns by financial sector and region. Most financial institutions are banks, followed by insurance companies, trusts, and intermediaries from other sectors of the financial industry.
Table 1. Descriptive statistics: CDS spreads and stock price returns
Table 2. Countries within regions
Banks exhibit the lowest mean (and median) CDS spreads during this precrisis period. Insurance companies and financial firms from other sectors are significantly more risky as reflected by higher mean (and median) CDS spreads. The standard deviation of stock price returns is not statistically different across financial sectors. The credit risk measured by CDS spreads therefore gauges a different aspect compared to the risk reflected by equity returns. CDS spreads and stock price returns of financial firms from Europe and the US account for about 80% of firms. The remainder is from other developed (O.D.) and emerging market (E.M.) economies.
3. CO-CRASH PROBABILITIES
3.1 Extreme Value Theory and Tail Dependence
We choose the EVT method to infer credit-risk connectivity because of the nature of risk buildup at financial institutions, which reflects the ability to service financial obligations. The sensitivity of credit risk to changes in the underlying asset value is very low if the firm is solvent, but increases nonlinearly as asset values approach the notional value of debt outstanding (Merton Citation1977). This convex relationship explains increased volatility or sudden spikes in CDS spreads even for small asset value changes (Duffie and Singleton Citation2003), which therefore gauge detrimental credit risk events. The EVT-based method is particularly suited to investigate such risk events since it allows for a flexible and general distribution of movements in the CDS spreads of two financial institutions beyond extremal thresholds. Related, also asset value deteriorations for solvent firms, and hence stable CDS spreads, can reflect detrimental events for the market value financial firms. Therefore, we also consider extreme movements in the price of equity (as in Hartmann et al. Citation2004; de Jonghe Citation2010). For brevity, we refer to CDS in describing the method.
We measure the joint probability of extreme positive CDS spread percentage changes or substantial joint negative stock price returns between possible pairs of financial institutions with data. Denoting negative stock price returns or percentage CDS spread increases interchangeably by Xit and Xjt for institution i, j ∈ {1, …, N} at day t ∈ {1, …, T}, we write the co-crash probability (CCP) as a probability of the type:
(1)
(1) CCPs denote the probability that the underlying processes Xit and Xjt of institutions i and j exceed jointly the critical thresholds xi and xj and are as such extreme. Joint exceedance of market participants’ expectations about credit events in the case of CDS or extreme equity value deterioration are rare by definition. Therefore, we employ multivariate extreme value theory to estimate the probability of the joint event. We follow Draisma et al. (Citation2004) and define F as the common distribution of (Xit, Xjt) with marginal distributions Fi and Fj. We assume that there exist normalizing constants aT, cT > 0 and
such that we can define the CCP between firm i and j formally as
(2)
(2)
The semiparametric approach of Ledford and Tawn (Citation1996) to estimate (Equation2(2)
(2) ) allows to infer whether the CCP is likely to be positive or zero (see also Poon et al. Citation2004; Hartmann et al. Citation2007; Straetmans et al. Citation2008). Ledford and Tawn (Citation1996) used the tail index coefficient η ∈ (0, 1] to evaluate whether (Equation2
(2)
(2) ) exhibits asymptotic (in)dependence. In case of asymptotic dependence, η = 1, the CCP is positive, and for asymptotic independence, η < 1, this CCP measure equals zero. Formally, asymptotic dependence is achieved if the term limu → 1Prob[Fi(X) > u|Fj(X) > u] > 0 where u ∈ [0, 1], and asymptotic independence is achieved if this term equals zero (Ledford and Tawn Citation1996).
Draisma et al. (Citation2004) provided both an estimator for (Equation2(2)
(2) ) and established the asymptotic properties of the estimator for η. Both the tail index estimator and its asymptotic properties assist in drawing inferences from extremal movements in CDS spread percentage changes and stock price returns. In Section 3.2, we present the methodology to estimate the tail index η, which we require in Section 3.3 to estimate the CCP in (Equation2
(2)
(2) ). The CCP estimate provides an intensity measure as a probability estimate of the event that both series exhibit extremal movements jointly. The two-step procedure may not be the most efficient way to estimate the CCP (Murphy and Topel Citation2002), but it is consistent (Draisma et al. Citation2004). In Section 3.4, we describe the steps for a bootstrap approach to test whether asymptotic independence can be rejected for any two of these series. If two institutions’ CDS spread returns series are likely to exhibit asymptotic dependence in their maxima of the observations, the CCP is likely to take on a positive value. The test for asymptotic dependence along with the CCP estimate provides the tools to gauge connections in terms of shared risks between institutions without having to observe structural debt or equity ties between two institutions.
3.2 A Gauge of Dependence Between Extremes: The Tail Index
To extract information on the dependence between the maximum values of the two series, one needs to address the biasing impact of the marginal densities on the joint probability estimate. We follow the two-step semiparametric approach of Draisma et al. (Citation2004) and Drees et al. (Citation2004) and estimate the tail index η of a univariate Pareto marginal distribution to infer dependence of the extreme values of two series.
First, we transform the underlying processes Xit and Xjt to unit Pareto marginals. This ensures that the marginal distributions of the series have no impact on the estimated dependence between the two series’ maxima (Draisma et al. Citation2004). Differences in the estimated tail index are only attributed to differences in the dependency of extreme percentage changes in the underlying processes. We denote the unit Pareto marginal transformation of the series by , where ni is the number of observations of institution i and R() returns the rank of the argument in ascending order. Between any two institutions, the transformed series
and
have the same density. Therefore, the critical threshold values q are the same across institutions and the probability type (Equation1
(1)
(1) ) can be rewritten as
(3)
(3)
The unit Pareto marginal transformation therefore changes our multivariate problem into a univariate problem for the minimized series:
(4)
(4) For notational convenience, the subscripts i and j are dropped for Zt. Suppose that two institutions exhibit a perfect risk connection and as a result their transformed underlying processes
and
rank daily observed changes identically. Then Zt equals the transformed variable
and its density exhibits a unit tail index by construction. If such co-movement does not exist, the minimized series Zt exhibits a minimal fat tail and the tail index of its density is smaller than one. We use this feature below to test for whether there exists a risk connection between two institutions. A risk connection would be reflected by a tail index estimate close to one and indicates that two institutions experience the largest movements in the underlying processes on similar days. A tail index estimate smaller than one shows that the two institutions do not share such a risk connection.
The extent to whichinstitutions are credit- or equity-risk connected is represented by the estimated value of the tail index of the generalized Pareto density of the minimized series Zt. We use the Hill (Citation1975) estimator for the tail index η:
(5)
(5) A typical problem in calculating the Hill estimator in Equation (Equation5
(5)
(5) ) is the nontrivial choice of k: the sample of “large” values in the joint underlying series that proxy for the arrival of credit or equity risk events, that is, large positive movements in the underlying processes. If k is too small, too few observations enter the estimation of the tail index to ensure consistent estimation of the index. In contrast, too high levels of k result in a biased tail index estimate because more observations enter the estimation that do not represent tail events. Choosing the optimal number of observations, k*, thus involves a trade-off between a too high variance of the estimator for low values of k versus a lower variance for large values of k but at the expense of introducing bias.
We follow Huisman et al. (Citation2001) to determine k* and approximate the bias in estimating the tail index to be linear in k. The bias is a linear relationship between the estimated tail index and the number of observations included for estimation:
(6)
(6) where ϵk denotes a random noise term and the coefficient parameters γ0 and γ1 represent the bias relationship between the tail index estimate in Equation (Equation5
(5)
(5) ) and the number of observations included for its computation. We estimate Equation (Equation6
(6)
(6) ) with weighted least squares using weights proportional to
to obtain unbiased and consistent estimates of
and
. This procedure weighs tail index estimates in the region where they are least consistent, which is likely for low values of k, less. The unbiased estimate of the tail index is obtained from
, and the value of
is substituted in Equation (Equation5
(5)
(5) ) to determine k*.
Subsequently, we find k* by minimizing . The k that minimizes this sequence in a stable area is denoted as k*. We perform a grid search to choose k* in an area where neighboring k values also yield squared prediction errors sufficiently close to zero to avoid obtaining an accidental k* in an area where
is inconsistent. Alternatively, Danielsson et al. (Citation2001) proposed a double-bootstrap procedure to determine k*, which we also pursue in the online appendix. Substitution of k* in Equation (Equation5
(5)
(5) ) yields the tail dependence index of the two series of percentage changes in CDS spreads.
summarizes the percentage changes of CDS spreads for 186 financial institutions in the top panel and stock price returns in the bottom panel for 164 financial institutions. The data cover the period before August 9, 2007, which is when the first major public interventions by central banks due to the Global Financial Crisis were launched. To alleviate market concerns about widespread exposures of financial institutions to U.S. subprime mortgage lending markets, the ECB provided low-interest credit lines of USD 130 billions. The Federal Reserve followed suit with USD 12 billions in temporary reserves. Hence, we use precrisis data to infer interconnectedness from significant CCPs. The according summary statistics of the percentage changes in CDS spreads and negative stock price returns that are used to estimate the CCPs are reported, too.
Table 3. Descriptive statistics: Extreme percentage changes in CDS spreads and stock prices
To estimate the tail index for the joint CDS change series and for negative stock price returns, we use on average only observations that are above the 87th and 86th percentile, respectively. It is important not to confuse these percentiles with those in Value-a-Risk approaches to calculate “extreme” events. Critical cutoff values to denote extrema are not imposed, but follow from the optimal sample size to calculate CCPs given the variance-bias tradeoff faced when estimating the tail index (Huisman et al. Citation2001).
3.3 Co-Crash Probability Estimation
Draisma et al. (Citation2004) extended Ledford and Tawn (Citation1996) and developed an estimator for the probability of an extreme event as denoted by (Equation2(2)
(2) ) that allows for both asymptotic dependence and independence between two series. This semiparametric estimator requires no distributional assumptions about the joint density of the underlying processes Xit. Nonetheless, a conditional marginal density must be defined for the exceedances over a particular threshold level. Let the values of Xit that exceed a threshold level ui follow the generalized Pareto distribution with shape ξi, scaling ai, and location parameter bi, such that the cumulative density of Xit is denoted by
(7)
(7)
The parameters are estimated with ML techniques and calculated for each institution separately. Thus, heterogeneity with respect to idiosyncratic failure probabilities is preserved. Parameter estimates are denoted by ,
, and
. Let
be specified as in (Equation7
(7)
(7) ) with parameters replaced by estimates. Let
, a two-dimensional vector with elements reflecting the idiosyncratic probabilities of nonextreme events for both institutions, such as percentage changes in CDS spreads that are smaller than the critical levels of institutions i and j. Similarly,
. This term identifies the cutoff values of the underlying process for which larger values are extreme according to the Huisman et al. (Citation2001) method. Last, let
a row vector with probabilities of the event in which both institutions’ CDS spread percentage changes exceed their critical thresholds. The estimator of CCP as in (Equation2
(2)
(2) ) is denoted by
(8)
(8) The operator
returns a 1 if the condition in braces is fulfilled and a zero if not. A 1 indicates the occurrence where both institutions face an extreme event, and 0 that they do not. The operand
identifies the joint set of CDS spread percentage changes that are larger than the critical values returned by
. Hence, the summation over the sampled days, nij, yields the number of observations for which both institutions experience contemporaneously a detrimental credit or equity event.
The constant cij ∈ (0, 1] inflates the set of critical exceedance values. Note that for smaller values of cij, the critical levels in are larger, that is, more extreme. Smaller values of cij essentially imply a reduction in the number of observations for which both institutions experience simultaneously a detrimental credit event. Because the domain of
is [0, 1] × [0, 1], the choice of cij is limited to
. We determine cij by evaluating
as a function of cij, and choose the minimal value of cij for which
is sufficiently stable (Draisma et al. Citation2004). We adopt the same grid search to determine the optimal number of observations k* as for the tail index estimation.
3.4 Inferring Extreme Risk Connections from the Tail Index
Draisma et al. (Citation2004) investigated the asymptotic properties of the tail index estimate as defined by the Hill estimator (Equation5
(5)
(5) ). The estimate exhibits asymptotic normality as the number of observations becomes large. Therefore, we use a bootstrap procedure to obtain a standard error of
to develop a statistical test to infer dependence between extreme CDS spread or equity return changes. We employ the stationary bootstrap procedure of Politis and Romano (Citation1994) to allow for weakly dependent observations in the underlying to calculate the standard error of the tail index estimate in Equation (Equation5
(5)
(5) ). The bootstrap procedure consists of the following steps:
| 1. | Estimate a tail index | ||||
| 2. | Resample for each of the B bootstrap replications the underlying processes Xit and Xjt in blocks of consecutive observations of random block length. Bootstrap samples Xbit and Xbjt are as large as the original sample, where b indexes the bth replication. Starting value and length of each block are chosen uniformly at random across the number of observations. Generate tail index estimates | ||||
| 3. | The bootstrap standard error of | ||||
| 4. | Let η0 be the hypothesized true value of ηij under the null. Compute the test statistic | ||||
Dependence of extreme CDS spread percentage changes or equity returns between two institutions is then determined by testing the null of dependence against the alternative of independence using a one-sided t-test. Following the intuition of asymptotic dependence in Section 3.1, the maxima of observed CDS spread percentage changes are asymptotically dependent if η0 = 1. If the alternative η0 < 1 is not rejected, no asymptotic dependence between the maxima of the observed series can be established. If the test procedure fails to provide evidence to reject the null of asymptotic dependence, we assume the two institutions share a risk connection. In this case, the two institutions share a sufficient number of rare spikes in either CDS spread percentage changes or negative stock price returns to suggest such a connection. Throughout, the number of bootstrap replications is 10,000 and the significance level is 1%.
reports descriptive statistics of the estimated CCPs. Note that we distinguish between all CCPs and those for which dependence in credit events could not be rejected. Since 186 institutions are sampled for which we have sufficient observations on CDS spreads, a maximum of 17,205 potential credit risk links can exist (186 × 185/2 = 17,205). For the stock-price-based CCPs, we sampled 164 institutions and thus have 13,366 connections.
Table 4. Descriptive statistics: Co-crash probabilities
CCPs are right-skewed for both stock price-based and CDS spread-based CCPs. Those for which we fail to reject asymptotic dependence, the estimated size of the CCP is larger across percentiles relative to the full sample of estimated CCP. Institutions for which we find evidence of a credit risk connection, the probability of experiencing both a spike in the underlying process is higher. CDS spread-based CCPs are generally larger than stock price-based CCPs. This trait might reflect that CDS contracts are typically short term (5 years for our data) and relate solely to the likelihood of a credit risk event. Stock prices, in turn, relate both to short as well as long-term profitability prospects and movement in prices do not necessarily only concern credit events.
The standard error proposed by Draisma et al. (Citation2004) and our proposed bootstrap standard error both rely on asymptotic theory and are only exact in infinitely large samples. Therefore, we also describe and compute the standard error estimate proposed by Draisma et al. as a robustness test in Section A.4 of the online appendix.
4. CONNECTIVITY
Next, we define and identify central financial firms based on significant CCP links.
4.1 SIFI Identification Based on Network Centrality
Jorion and Zhang (Citation2007) defined credit risk contagion as a directional phenomenon. A credit event at one institution directly impacts the credit position of highly correlated institutions in terms of CDS spread percentage changes. Here, direct credit contagion between two institutions is reflected by those CCPs for which we fail to reject the null that both of the underlying processes are asymptotically dependent. However, we remain agnostic regarding the direction of effects. This feature of the CCP measure is important because ultimately neither market participants nor regulators observe existing credit ties and shocks. We thus rely on the observable yet very rare occurrence of joint extreme movements.
Credit risk shocks can be propagated when one institution’s credit event negatively affects the credit position of another institution via a third institution. Arora et al. (Citation2012) found that counter-party credit risk of dealer firms is priced in CDS spreads of other institutions, which supports the notion of indirect credit risk effects. The failure and rescue of AIG, a major seller of CDS protection, further illustrates the importance of indirect connections via a protection seller to policy makers. AIG was not central in terms of many credit links with other institutions in the financial system. But it connected large clusters of other agents that were not directly linked. illustrates the two considered types of centrality: direct degree and “gatekeeper” betweenness centrality.
Figure 1. Differences in centrality. Figure displays 14 hypothetical financial institutions as nodes, which share significant credit links. Significant credit links are displayed as edges. Degree centrality denotes the proportion of institutions with which the subject institution shares a significant credit link. Betweenness centrality represents the number of times an institution acts as key link that connects two institutions along the shortest path (Bonacich Citation1972). The betweenness centrality measure is rescaled to a percentage of the total number of times an institution connects two other institutions along the shortest path.
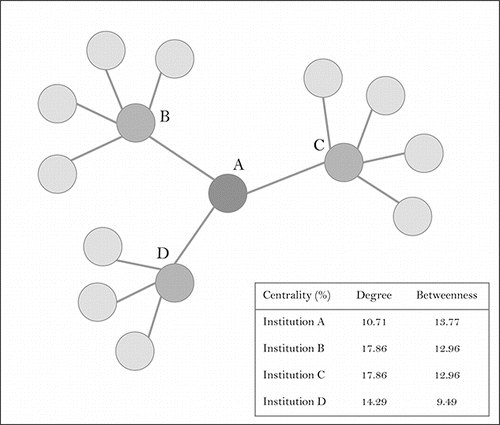
The direct degree centrality of institution A in is low relative to the centrality of B and C, because A has significant credit links only with three institutions out of 14 possibilities. Institutions B and C appear most connected based on degree centrality. But from a “betweenness” centrality perspective, institution A connects the large hubs with institutions B and C at their respective centers, while B and C are not connected themselves. This feature renders institution A central in the gatekeeper sense.
We measure the connectivity of financial institutions in the network represented by significant credit and equity risk links. First, we assess how the institutions are connected in the overall financial system. CCPs for which we do not reject the null of a tail index equal to one indicate the strength with which two institutions are linked. A simple measure for the network centrality of an institution is the ratio of the number of CCPs for which tail dependence could not be rejected and the number of institutions in the sample except for the institution in question. Let lij denote a credit link variable that takes a value of 1 if dependence is found between the institutions’ percentage changes in CDS spreads or negative stock price returns. Let I denote the total number of institutions present in the sample. Following Jackson (Citation2010), degree centrality is denoted by
(9)
(9) and ranges from zero (no links) to 100% (connected to all).
In contrast, the notion of the betweenness centrality measure is to assign high centrality to an institution that may have only significant CCPs with a few, yet important peers. This measure denotes the number of times an institution acts as a key link that connects two institutions along the shortest path of credit (or equity) links. Bonacich (Citation1972) proposed to take the centrality of an institution to be proportional to that of its neighbors. Let Ci denote such a measure for institution i and λ an arbitrary scaling value, then . Note that the centrality measures of the neighbors are weighted with the corresponding CCP. We solve a system of linear equations to calculate the Ci values, namely, one equation for each of the sampled institution. This approach amounts to retrieving the eigenvectors of the square symmetric matrix that has diagonal elements equal to zero and the CCP as off-diagonal elements. Financial firms index the rows and columns. We denote this matrix by
and gather all centrality measures Ci in the column vector
. The system can then be stated as
(10)
(10) The solution to
denotes the eigenvector of
that corresponds to the eigenvalue λ. This type of centrality is often denoted as eigenvector centrality. We take the largest eigenvalue of
to ensure that the eigenvector centrality scores can be positive. The centrality measure Ci for each institution is then retrieved from the ith element of the considered eigenvector. Bonacich centrality represents the number of times an institution acts as key link that connects two institutions along the shortest path (Bonacich Citation1972). This betweenness centrality measure is rescaled to a percentage of the total number of times an institution connects two other institutions along the shortest path.
Tables A1 and A2 in the online appendix show the ranking of the top 40 connected financial firms according to degree centrality and Bonacich centrality based on CCPs for both CDS spread-based and stock price-based CCPs, where we also describe these rankings in somewhat more detail.
4.2 Implied Network Centrality and Revealed SIFI Assessment
Do implied measures of network centrality properly identify SIFIs? Whereas we cannot validate CCP-based connectivity measures, for example, with observed interbank credit data, we suggest here some alternatives.
4.2.1 Bailouts, Centrality, and Other SIFI Determinants During the Crisis
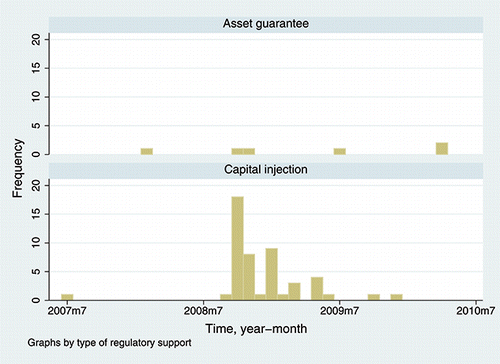
Any bailout reveals the regulators perception of that financial institution’s systemic relevance. During the 2007/2008 crisis, central banks and governments around the world bailed out many banks, many of which being SIFIs according to our network centrality measures. Timing and terms of actual bailouts under the auspices of the various national schemes have been collected systematically by Stolz and Wedow (Citation2010) and we show these data in Table A3 in Section A.2 of the online appendix. Globally, more than 50 financial institutions, mostly banks, were affected in the post-crisis period and shows the frequency distribution of both asset guarantees and equity injections.
Figure 2. Capital injections and asset guarantee schemes. Figure represents a graphical depiction of the first time capital injections and asset guarantee have been implemented for the support of sampled financial institutions. The figure is based on the data presented in Table A3 in the online appendix. Contributions to the bar are derived from the first date in the period 2007–2011 that a financial institutions received one of the two respective support measures.
We estimate a logit model where the dependent variable equals one if a financial firm was bailed out and zero otherwise. The first announcement of a rescue measure constitutes the event. Successive rescue measures during the sample period are considered one event. To avoid endogeneity by construction, we predict bailouts during the crisis with indicators of connectivity based on CCPs pertaining to the precrisis period. If inferred connectivity is informative, bailouts should be more likely for financial institutions considered connected already prior to the crisis, that is, those identified as SIFI. Connectivity measures are direct degree centrality and Bonacich centrality based on equity return and CDS spread change series. The descriptive statistics for these variables, either with bootstrapped (see Section 3.4, baseline) or parametric (see Appendix A.4, robustness) standard errors or the CCP estimate (see Section 3.3) itself, are shown in .
Table 5. Descriptive statistics of bailout determinants: Centrality indicators and firm-specific factors
The network in terms of direct credit risk connections is more complete compared to equity ties. For the average financial institution, we could not reject the dependence assumption in terms of extreme co-movements of CDS spread change series for 69% of all possible connections. For equity return co-movements, this share is only 20% on average.
Mean values for the gatekeeper type of centrality, the Bonacich indicator, are scaled such that larger percentages indicate a more central role in the network in terms of connecting more clusters of other financial institutions in the network. This indicator yields virtually identical averaged “gatekeeper” importance for both CDS and equity-based connectivity.
As noted by the Bank for International Settlements (Citation2013), the SIFI status of financial institutions should also reflect additional factors other than connectivity. Among the most important ones are too-big-to-fail concerns. To this end, we augment our analysis with a set of control variables that pertain to the period before the Global Financial Crisis period. Specifically, control variables cover the period from January 2004, through August 2007 unless stated otherwise.
We specify the log of total assets using total assets from the fiscal year of 2006. Additionally, bailout choices may have been driven by concerns of systemic importance that a specific failure would lead the entire system to collapse. We use the contribution to system-wide expected capital shortfall, , proposed by Acharya et al. (Citation2016) to control for an institution’s systemic importance. The estimation procedure of this capital shortfall measure is reserved for the appendix and presented in Section A.3. We specify here also an EVT-based measure, namely, the co-crash probability of each institution with the market as in de Jonghe (Citation2010). The variable CCP market thus estimates for each financial firm the probability that its stock price crashes jointly with the entire financial market index. We employ the method outlined above in Section 3 to estimate this variable. We only specify an equity market CCP because for CDS no reliable index is available
Finally, we control for the idiosyncratic risk-return traits of each financial firm, which co-determine bailout choices of regulators as well. For example, Duchin and Sosyura (Citation2014) discussed that equity capital support to U.S. banks was granted on the basis of an assessment of the future viability of the bank, for example, based on profitability and liquidity forecasts. Specifically, we specify CAPM Betas, solvency ratios, and return on assets (RoA), which we obtain from Datastream. The solvency ratios and RoA are obtained from the fiscal year of 2006 only.
4.2.2 Too-Connected-to-Fail: Equity or Credit Risk Connections?
shows the marginal effects from logit estimations to test the too-connected-to-fail notion based on degree centrality for equity (columns 2–5) and CDS ties (columns 6–9), respectively. Results in columns (2) through (5) show that connections inferred from extreme joint equity return spikes are not informative to predict bailouts during the crisis whereas connections inferred from CDS-spread changes are.
Table 6. Rescue measures explained by precrisis degree centrality
An increase of 1% in the proportion of significant CDS-implied connections over all possible ties that a financial firm has with its sampled peers leads to an increase in the probability of receiving bailout support during the crisis by approximately 5.4%. More central financial institutions in terms of sharing significant extreme CDS spread return co-movements with peers are thus more likely to be considered worthy of a bailout. The information value-added of implied connectivity gauged by CDS-based degree centrality is corroborated by the ROC curve, or the coefficient of concordance. In column (6), it is significantly larger than the benchmark value obtained for the baseline logit regression without connectivity variables, reported in column (1). Hence, the discriminatory power of the model increases significantly when CDS-spread-based connectivity measures have been included.
In columns (3)–(5) and (7)–(9), we show results for degree centrality calculated for three different sub-samples. Contrary to the baseline, intraindustry degree centrality relates the significant co-crash probabilities per financial institution not to all possible ties. Only those possible connections within the firm’s own financial sector are considered. For example, we relate bank connections only to all possible connections with other banks, but exclude insurances, investment funds, and so forth. Likewise, intracountry connectivity confines the set of possible connections only to financial firms within a country. The last and smallest possible connectivity set is the one confined by both industry and country. For example, we consider only banks in the U.S. as possible connections.
These alternatives gauge whether the role of connectivity to predict policy makers’ choices to bailout banks is affected by narrowing down the definition of potential peers. That approach is reasonable because rescue schemes were mostly orchestrated and targeted at a specific sector of the financial industry in a single country, such as the equity support of banks under the Capital Purchase Program in the U.S.
suggests that direct equity- and CDS-based connectivity measures for increasingly narrow definitions of peer groups yield qualitatively similar results compared to columns (2) and (6). Higher CDS-based centrality prior to the crisis increased the likelihood of a bailout during the crisis whereas equity ties remain insignificant. The magnitude of the effect declines in increasingly narrowly defined networks and only the discriminatory power in column (7) is significantly better relative to the benchmark model with no centrality measures specified though. We conclude that in particular direct credit-risk connectivity as measured across national borders and different sectors of the financial industry add information, which financial firms were considered important enough to rescue.
To put the importance of too-connected-to-fail into perspective, consider the effects of controls. These indicate that too-big-to-fail considerations were major bailout drivers. An increase in financial firm size, as measured by the log-level of total assets, by 1% increased the bailout probability by 9%–10%. This result corroborates the approach to identify SIFIs in particular in terms of size. This result may also explain the absence of a significant effect associated with the measure of Acharya et al. (Citation2016). The
measure relies on the expected capital shortfall of an institution (see Appendix A.3), which comprises the value at risk and the marginal expected shortfall. Since we control for size and the institution’s CCP with the market index, which are similar to the capital shortfall’s value at risk and the marginal expected shortfall, the effect of
on the likelihood of receiving bailout support diminishes.
Our findings are not sensitive to the methodological choice how to obtain standard error estimate in the test for asymptotic dependence. Table A4 in the appendix replicates with a centrality measure derived from the test of asymptotic dependence that relies on the parametric standard error of the tail index estimate described in Section A.4 in the appendix. The effects are qualitatively very similar.
4.2.3 Gatekeepers: Bonacich Centrality
In , we specify equity-based Bonacich centrality measures in columns (2)–(5) and CDS-based measures in columns (6)–(9). Contrary to direct degree centrality both precrisis Bonacich centrality measures are statistically significant and positive. Financial firms that were gatekeepers prior to the crisis were more likely to receive bailouts during the crisis.
Table 7. Rescue measures explained by precrisis Bonacich centrality
Column (6) indicates that if the number of times an institution acts as a key link that connects two institutions along the shortest path increases by 1%, a bailout is around 10% more likely to occur. Columns (3)–(5) and (7)–(9) consider network ties within industries, within countries, and within both industries and countries as in . For instance, for the intraindustry equity-based Bonacich centrality measure, we restrict ties that are interindustry to zero, such that the possible shortest paths along which firms are connected can only be of an intraindustry nature. Throughout we find positive and statistically significant results except for columns (8). The significance of the area under the ROC curve indicates that Bonacich centrality marks an economically relevant addition to the baseline specification especially if the peer group is confined to financial firms from the same sector, see columns (3) and (7).
A potential shortcoming of the CCP estimate is that the researcher is required to specify the threshold beyond which rates of change in stock prices or CDS spreads are considered extreme. As a robustness test, we therefore also constructed a Bonacich centrality measure in which links between institutions reflect whether we fail to reject asymptotic dependence in the underlying series. We follow here the same definition of a link as in the case for degree centrality. The results are reported in using bootstrapped standard error estimates.
Table 8. Rescue measures explained by tail-based Bonacich centrality
The result in is almost identical to the findings presented in . As a robustness test we also replicate results based on parametric standard error estimates as in Draisma et al. (Citation2004) in Table A5 in the appendix, which are likewise very similar.
In sum, the relationship between bailout choice and betweenness centrality as measured by Bonacich centrality is both robust to the choice of threshold values used in the computation of the CCP estimate and the choice of standard errors for the tail-index estimate in a finite sample context.
A final caveat pertains to a general critique to use EVT estimation techniques for financial data. EVT methods require observations to be independent and identically distributed, but financial time series often exhibit serial correlation and/or volatility clustering. And indeed, both returns on CDS spreads and stock prices feature for some series in our sample weak forms of serial dependence. However, main findings of studies conducted by Hsing (Citation1991), Drees (Citation2000), Einmahl et al. (Citation2014), and de Haan et al. (Citation2016) suggest the validity of EVT methods under weakly serial dependence, although the asymptotic variance of estimators may differ from the iid case. The standard error estimates we use in the test on asymptotic dependence may therefore be subject to some bias. Fortunately, we have some indications that this bias is not a major concern in our sample because the potential bias should manifest itself differently in the values obtained for the three betweenness centrality measures in our finite sample. Any substantial differences would then also lead to substantial differences in the centrality measures due to over- or under-rejection of the null of asymptotic dependence. Such differences would therefore reflect likely different relationships between centrality and future bailout support across the two standard error estimation methods. Since we find nearly identical estimated relations, we expect the bias to be of limited influence on the standard error estimates.
4.2.4 Joint Specification: Equity- and CDS-Based Connectivity
So far, especially credit-risk connections are both individually significant and improve the discriminatory power to predict bailouts during the crisis. Marginal effects of gatekeeper centrality are around twice as large compared to direct degree centrality. Next, we specify all main measures of centrality jointly: equity- and CDS- based as well as degree and Bonacich centrality. In addition to the logit regression results in column (1) on whether an institution received bailout or guarantee, presents three additional findings. Results presented in column (2) are based on a logit regression of an indicator as dependent variable that presents a 1 if the institution is denoted as SIFI by FSB and 0 otherwise. In columns (3) and (4) of , we replace the dependent dichotomous dependent variable of a bailout with the monetary volume of bailouts. Specifically, we specify two Tobit regressions of whether and to what extend centrality contributed to the intensity of the bailout support extended by central regulators during the Global Financial Crisis.
Table 9. Centrality and the nature of ties
Equity-based Bonacich centrality significantly explains rescue measures during the crisis. Based on column (1), we find that a 1% increase in CDS-based Bonacich centrality increases the probability of receiving financial support from central regulators by approximately 50%. The coefficient of concordance for column (1) illustrates that the specification of Bonacich centrality measures improves the discriminatory power of the model.
The second column in contains a dummy indicator as dependent variable that presents a 1 if the institution is denoted as SIFI by FSB and 0 otherwise. We follow the classification as displayed in Table A3 following the G-SIB and denote an institution as SIFI if the institution was required to retain a common equity loss absorbency by FSB (Citation2013). Results corroborate the finding in the preceding column, which indicates that the centrality measure pertain as well to regulatory SIFI classification schemes.
Policies to support ailing financial firms during the crisis were mostly national and differed widely, ranging from asset guarantees to outright share purchases (see Stolz and Wedow Citation2010). Besides different instruments to support financial firms, the sheer volume of each bailout differs also considerably across institutions. Therefore, we replace in columns (3) and (4) the dependent dichotomous dependent variable of a bailout with the monetary volume of bailouts. Specifically, we present the results of the two Tobit regressions here. For those firms that received support, we observe the amount they received, or the asset value guaranteed. We left censor the values for institutions that did not receive bailout support at zero.
Overall findings suggest that centrality measures demonstrate a limited capacity in the considered joint specification to explain the intensity of the bailout measures taken during the crisis period. With respect to the capital injections the effect of the equity based Bonacich centrality is the dominant factor in terms of size, but lacks sufficient statistical significance to be classified as a determinate factor. We do not find this result for the case in which the regulator extended asset guarantees. We find that both capital injections and guarantees are primarily driven by the institution’s size in the form of total assets.
Clearly, we cannot infer that capital injections were indeed effective in preventing institutions from collapsing, because we lack the counterfactual. However, since these results are obtained while controlling for size, it indicates that central regulators were not solely concerned with the institutions’ “sizes” but also incorporated connectivity in their decision to extend bailout support. We interpret these results as indication that implied connectivity measures in general contain useful information about the too-connected-to-fail component of financial firms’ SIFI status. Regulators seem to have paid in particular attention to those institutions that are central in the gatekeeper sense of connecting highly connected hubs of financial institutions.
5. CONCLUSION
Besides size, the Basel committee argues that the position of financial firms in the international financial network is a key determinant of so-called systematically important financial institutions (SIFIs). Alas, structural connections, such as interbank credit links or payment system ties, are notoriously hard to observe.
This article suggests how to infer connectivity among financial firms based on extreme value theory. We suggest to gauge connections from extreme joint movements in equity returns and CDS spreads. Based on a comprehensive sample of daily CDS spreads for 186 financial firms and daily stock prices for 164 institutions, we calculate a so-called co-crash probability (CCP) for all possible pairs of these financial firms. We use return rates on credit default swap quotes and stock prices between January 2004 and August 2007 to derive an indicator of connectivity prior to the crisis. We bootstrap standard errors of potential CCP ties and calculate direct and indirect network centrality measures based on significant connections.
We test the validity of implied connectivity measures by predicting observed bailouts during the Global Financial Crisis with financial firm centrality prior to the crisis. We conjecture that these rescue measures reveal too-connected-to-fail concerns of regulators. Controlling for the size, idiosyncratic, and market risk of financial firms, we find that in particular connectivity based on CDS-spread implied co-crash probabilities before the crisis is an important determinant of bailout decisions during the crisis.
Especially so-called indirect Bonacich centrality is economically important to explain both the likelihood of bailouts as well as the magnitude of capital injections. Bonacich centrality measures the total number of times an institution connects two other institutions along the shortest path. As such, it captures the extent to which financial firms act as gatekeepers in CDS and equity markets. These results indicate that especially those firms identified as potential propagators of credit risk were considered as SIFIs by the regulator during the crisis.
SUPPLEMENTARY MATERIALS
The online appendix consists of four sections. First, the appendix contains the ranking of sampled financial institutions in terms of the centrality measures presented in the main text. Second, a more detailed exposition of the bailout data is provided in terms of specific execution dates of support measures for the sampled institutions. Three, the methodology employed for the expected capital shortfall estimation is described in detail. Four, the methodology for estimating the parametric standard error of the tail index estimate presented in the main text. In addition, the online appendix contains the results of the robustness checks. In these checks we benchmark our main findings against the centrality estimates obtained with the parametric standard error of the tail index estimate.
Supplementary Materials
Download PDF (101.1 KB)Acknowledgments
The authors are grateful for the input received at seminars at Sveriges Riksbank, Deutsche Bundesbank, the University of Groningen, the Frankfurt School of Finance and Management, the CEPR/BIS/JFI conference, the Financial Risk and EVT workshop at Erasmus University, and the FMA Asia meetings. The authors thank three anonymous referees, our discussants Paolo Cox and Winnie Poon, as well as Ferre DeGraeve, John Duca, Iftekhar Hasan, Roman Inderst, Ruud Koning, Christoph Memmel, Kyle Moore, Natalie Packham, Rafael Repullo, Kasper Roszbach, Stefan Straetmans, and Casper de Vries for their input. Jakob Bosma holds an additional affiliation with ING Bank. Michael Koetter acknowledges financial support by the Netherlands Organization for Scientific Research NWO [VENI 016.075.164] and holds affiliations with Deutsche Bundesbank and Frankfurt School of Finance and Management. The article represents the authors’ personal opinions and not necessarily those of the European Central Bank, Deutsche Bundesbank, or ING Bank. All errors are of authors.
Related Research Data
References
- Acharya, V. V. (2009), “A Theory of Systemic Risk and Design of Prudent Bank Regulation,” Journal of Financial Stability, 5, 224–255.
- Acharya, V. V., Pedersen, L. H., Philippon, T., and Richardson, M. (2017), “Measuring Systemic Risk,” The Review of Financial Studies, 30, 2–47.
- Arora, N., Gandhi, P., and Longstaff, A. (2012), “Counterparty Credit Risk and the Credit Default Swap Market,” Journal of Financial Economics, 103, 280–293.
- Bank for International Settlements (2013), Global Systemically Important Banks: Updated Assessment Methodology and the Higher Loss Absorbency Requirement, Basel, Switzerland: Basel Committee on Banking Supervision.
- Bonacich, P. (1972), “Factoring and Weighting Approaches to Status Scores and Clique Identification,” Journal of Mathematical Sociology, 2, 113–120.
- Cerutti, E., Claessens, S., and McGuire, P. (2014), “Systemic Risk in Global Banking: What can Available Data Tell us and What more Data are Needed” in Systemic Risk and Macro Modeling, eds. M. K. Brunnermeier and A. Krishnamurthy, Chicago: NBER/University of Chicago Press, pp. 235–260.
- Danielsson, J., deHaan, L., Peng, L., and deVries, C. G. (2001), “Using a Bootstrap Method to Choose the Sample Fraction in Tail Index Estimation,” Journal of Multivariate Analysis, 76, 226–248.
- de Haan, L., Mercadier, C., and Chen, Z. (2016), “Adapting Extreme Value Statistics to Financial Time Series: Dealing with Bias and Serial Dependence,” Finance and Stochastics, 20, 321–354.
- de Jonghe, O. (2010), “Back to the Basics in Banking? A Micro-analysis of Banking System Stability,” Journal of Financial Intermediation, 19, 387–417.
- Draisma, G., Drees, H., Ferreira, A., and de Haan, L. (2004), “Bivariate Tail Estimation: Dependence in Asymptotic Independence,” Bernoulli, 10, 251–280.
- Drees, H. (2000), “Weighted Approximations of Tail Processes for β-mixing Random Variables,” Annals of Applied Probability, 10, 1274–1301.
- Drees, H., Ferreira, A., and de Haan, L. (2004), “On Maximum Likelihood Estimation of the Extreme Value Index,” The Annals of Applied Probability, 14, 1179–1201.
- Duchin, R., and Sosyura, D. (2014), “Safer Ratios, Riskier Portfolios: Banks’ Response to Government Aid,” Journal of Financial Economics, 113, 1–28.
- Duffie, D. (2010), “The Failure Mechanics of Dealer Banks,” Journal of Economic Perspectives, 24, 51–72.
- Duffie, D., and Singleton, K. J. (2003), Credit Risk: Pricing, Measurement, and Management, Princeton, NJ: Princeton University Press.
- Einmahl, J. H. J., de Haan, L., and Zhou, C. (2014), “Statistics for Heterocedastic Extremes,” Journal of the Royal Statistical Society, Series B,78, 31–51.
- Eisenberg, L., and Noe, T. H. (2001), “Systemic Risk in Financial Systems,” Management Science, 47, 236–249.
- Freixas, X., and Rochet, J.-C. (2013), “Taming SIFIS,” Journal of Money, Credit, and Banking, 45, 37–58.
- FSB (2013), “2013 Update of Group of Global Systemically Important Banks,” Technical Report, November 11, 2013, Financial Stability Board.
- Hartmann, P., Straetmans, S., and de Vries, C. (2004), “Asset Market Linkages in Crisis Periods,” Review of Economics and Statistics, 86, 313–326.
- Hartmann, P., Straetmans, S. T. M., and de Vries, C. G. (2007), “Banking System Stability. A Cross-Atlantic Perspective,” in The Risks of Financial Institutions, eds. M. Carey and R. Stulz, Chicago: National Bureau of Economic Research, Inc., pp. 133–192.
- Hill, B. M. (1975), “A Simple General Approach to Inference About the Tail of a Distribution,” The Annals of Mathematical Statistics, 3, 1163–1174.
- Hsing, T. (1991), “On Tail Index Estimation using Dependent Data,” Annals of Statistics, 19, 1547–1569.
- Huisman, R., Koedijk, K. G., Kool, C. J. M., and Palm, F. (2001), “Tail-Index Estimates in Small Samples,” American Statistical Association, 19, 208–216.
- Ibragimov, R., Jaffee, D., and Walden, J. (2011), “Diversification Disasters,” Journal of Financial Economics, 99, 333–348.
- Jackson, M. O. (2010), Social and Economic Networks, Princeton, NJ: Princeton University Press.
- Jorion, P., and Zhang, G. (2007), “Good and Bad Credit Contagion: Evidence from Credit Default Swaps,” Journal of Financial Economics, 84, 860–883.
- ——— (2009), “Credit Contagion from Counterparty Risk,” Journal of Finance, 64, 2053–2087.
- Ledford, A. W., and Tawn, J. A. (1996), “Statistics for Near Independence in Multivariate Extreme Values,” Biometrika, 83, 169–187.
- Longines, F., and Solnik, B. (2001), “Extreme Correlation of International Equity Markets,” Journal of Finance, 56, 649–676.
- Mayordomo, S., Peña, J. I., and Schwartz, E. S. (2013), “Are all Credit Default Swap Databases Equal.” European Financial Management, 20, 677–713.
- Merton, R. C. (1977), “An Analytical Derivation of the Cost of Deposit Insurance and Loan Guarantees,” Journal of Banking and Finance, 1, 3–11.
- Murphy, K. M., and Topel, R. H. (2002), “Estimation and Inference in Two-Step Econometric Models,” Journal of Business & Economic Statistics, 20, 88–97.
- Politis, D. N., and Romano, J. P. (1994), “The Stationary Bootstrap,” Journal of American Statistical Association, 89, 1303–1313.
- Poon, S.-H., Rockinger, M., and Tawn, J. A. (2004), “Extreme Value Dependence in Financial Markets: Diagnostics, Models, and Financial Implications,” The Review of Financial Studies, 17, 581–610.
- Stolz, S. M., and Wedow, M. (2010), “Extraordinary Measures in Extraordinary Times—Public Measures in Support of the Financial Sector in the EU and the United States,” European Central Bank Occasional Paper 117.
- Straetmans, S. T. M., Verschoor, W. F. C., and Wolff, C. C. P. (2008), “Extreme US Stock Market Fluctuations in the Wake of 9-11,” Journal of Applied Econometrics, 23, 17–42.
- Upper, C. (2011), “Simulation Methods to Assess the Danger of Contagion in Interbank Markets,” Journal of Financial Stability, 7, 111–125.
- Wagner, W. (2011), “Systemic Liquidation Risk and the Diversity-Diversification Tradeoff.” Journal of Finance, 66, 1141–1175.