
ABSTRACT
This study contributes to the debate on the impact of international shocks on the integration of national systems of cities into global economic networks. We examine how the crisis in Ukraine and the following economic sanctions of 2014 imposed on Russia affected the positions of Russian cities in global economic networks. To do so, we used worldwide data on the corporate networks of the largest multinational firms and their subsidiaries from 2010 to 2019 to create intercity linkages at both the global and national levels to show how Russian cities’ positions evolved during the period. The study shows that although the Russian cities’ position in the global network shrank (with a general decrease in Russian cities’ linkages), their internationalization increased despite the economic sanctions. The decrease in connectedness mostly concerned the intranational firm linkages between Russian cities, which could explain the increasing interregional inequalities in Russia observed by numerous scholars. In addition, contrary to the main arguments of the global cities approach, among the cities that were most resistant to crises were not only the largest and most diversified cities, as we would expect during such times of uncertainty, but also some highly specialized small towns.
Introduction
Within the last 15 years, Russian cities have faced at least two significant crises: the world financial crisis of 2008–2009 and the economic crisis of 2014–2016 related to the international sanctions imposed on Russia following the Ukrainian crisis. The crisis of 2014–2016 was not global and cyclical like that in 2008 but rather national and structural (Klepach, Citation2015; Lyakin, Citation2018) thus, it had quite different consequences on the integration of Russian cities into global economic networks.
Cities react unevenly to different economic crises, and depending on the type of crisis, different groups of cities are more affected than others. We thus wonder how much the evolution of Russian cities’ economic linkages (intra-Russian linkages and linkages between Russia and the world) reveals the reaction of their economies based on their complementarity in terms of activity specialization. In addition, we seek to explore the properties of individual cities that enable them to better resist the crisis not alone but integrated into the Russian national economy and global economic sectors.
By its empirical approach, this study extends the knowledge on corporate networks in Russian cities, which remains quite limited in terms of its scale (Kuznetsova & Mikhailov, Citation2018) and its sector-specific approach (Ledyaeva et al., Citation2015; Loginova et al., Citation2020). The study of the global connectedness of Russian cities over 2010–2020 is based on data on the 3,000 largest corporate groups in the world for 2010, 2013, 2016, and 2019. These networks develop both between Russian cities (national scale) and between Russian cities and foreign cities (global scale). We evaluate the evolution of the integration of Russian cities into these two scales of economic networks before (2010–2013), during (2013–2016) and after the crisis (2016–2019). The population size and activity specialization of Russian cities help interpret the typology of cities’ trajectories to regroup cities whose positions in these networks evolve similarly.
Thus, the aims of this paper are twofold: first, it reveals the main internal changes in the Russian network of cities facing the shocks of 2014; second, it outlines the city properties that favor their capabilities to maintain or to intensify their integration inside the global economy, despite this deep national crisis. Applying systems of cities theory (Pumain, Citation2006; Rozenblat, Citation2010; Rozenblat et al., Citation2017), we seek to determine how much the network of Russian cities has transformed within the last 10 years regarding these new economic conditions.
Background: Urban dimensions of the economic crisis of 2014–2016
Since most of the population in Russia lives in cities (the urbanization rate was 75% in 2020; Rosstat, Citation2020), most investments, production of goods and services, and economic flows are attributable to cities, making cities the principal beneficiaries of economic growth but also the most vulnerable to economic shocks. Since most of the headquarters of multinational firms are located in cities, whether Russian or foreign, the decrease in international activities would weaken these headquarters and consequently the cities where they are located. Cities will suffer in two ways: on the one hand, loosing international firms, cities will become less integrated into global economic networks, and thus less attractive for new foreign firms that tend to go to the most internationalized cities (successful in attracting FDI). On the other hand, whether controlling other firms or being controlled by others, firms create local (intraurban) networks by subcontracting, cooperating, competing, or forging alliances (Rozenblat, Citation2021) that stimulate urban economies to grow and attract new resources.
The crisis of 2014–2016
Following the incorporation of Crimea in March 2014, international economic sanctions, the decline of prices of Russian principal export goods and the devaluation of the national currency (the ruble lost half of its value in 2014), economic stagnation in Russia turned into a deep economic crisis lasting approximately 2 years (Lyakin & Rogov, Citation2017a, Citation2017b; Zubarevich, Citation2019). The crisis was twofold. First, it had top-down triggers, such as international economic sanctions imposed on Russia and the decline in key Russian export goods, which resulted in the drastic devaluation of the national currency. Second, structural problems of the Russian economy, such as its low efficiency, institutional barriers, and technological gaps, represent bottom-up local processes leading to an urban economic decline (Mau, Citation2018; Zubarevich, Citation2016). However, although there are many studies analyzing the effects of these trade and financial restrictions on national and regional economies (e.g., Dreger et al., Citation2016; Ivanter, Citation2016; Lyakin, Citation2018; Mau, Citation2016), at the city level, there is a substantial research gap. Cities are the skeleton of Russian economic globalization; thus, the reactions of Russian urban economies and their different evolutionary trajectories before, during and after the crisis are crucial for the resilience of the whole Russian network of cities.
In addition, the crisis of 2014–2016 did not evenly affect all the economic sectors (Lyakin, Citation2018; Rogov, Citation2021); thus, Russian cities reacted differently according to the specialization of their economies. There were two consequences of the crisis for cities: first, changes in the intranational exchanges between cities, transforming their complementarities, which mitigated inequalities between them, and second, a decrease in foreign investments and global cities’ connectedness.
The Russian urban system and its main hierarchical characteristics
The Russian urban system is characterized by several features that are important for understanding the uneven integration of Russian cities into global economic networks. Western Russia or European Russia (west of the Ural Mountains) is home to 72% of all cities and towns (Cottineau & Frost, Citation2018) but only 23% of the country’s area. This European part concentrates the largest industrial and economic centers, innovation clusters and research institutions, while the eastern part hosts only a few large urban regions and many small towns highly specialized in natural resource extraction.
Another specificity of the Russian urban system is the presence of small but economically important towns that are highly specialized in the extraction of natural resources, such as mining cities in Siberia and the Far East (Mirniy, Nefteyugansk, Nizhnevartovsk and many others). Despite being located far away from large industrial cities, these cities contribute greatly to the Russian global economy. However, over 90% of these small and medium-sized (SMS) cities are shrinking (Batunova & Gunko, Citation2018; Cottineau, Citation2016), and the largest cities continue to grow.
Moscow specifically concentrates most of the country’s institutional, financial, and human resources. The “vertical” management system supports the dominance of large companies and banks headquartered in Moscow in Russia’s economy. Consequently, Moscow has accounted for approximately 20% of the national gross regional product (GRP) for almost two decades and received 23% of national public investments in 2018 (Zubarevich, Citation2019). Thus, within this inherited hierarchical urban system and the east-west unbalanced development, interregional inequalities tend to increase.
Successive periods of growth and the mitigation of interregional inequalities
Since the collapse of the Soviet Union (USSR), the internationalization of Russia started with Moscow along with the largest and most developed cities (Makaryčev, Citation2000). Moscow experienced a specific metropolization process (Gritsai, Citation1997) characterized by a growing international orientation and the following increasing separation from the national urban network, although it took the role of intermediary between the Russian regions and developed Western countries (Brade & Rudolph, Citation2004; Rozenblat et al., Citation2017).
However, in the 2000s, a new trend of the mitigation of interregional inequalities appeared. Combined with the increase in regional budgets, the global recession of 2008–2009 did not contribute to the growth of interregional inequalities. On another scale, intraregional inequalities continued to grow due to persistent local center-periphery inequality and inefficient municipal redistributive policies (Zubarevich, Citation2019).
The economic crisis of 2014–2016 created a new trend of a weak increase in inequalities between regions in terms of the per capita income of the population, average wage and poverty rate (Zubarevich, Citation2019). Simultaneously, intraregional income inequality began to decrease during the crisis (Zubarevich, Citation2015, Citation2019) because of the shrinkage and weakness of some main and secondary urban poles. Crises have mainly impact these dynamic urban and regional centers.
Locational strategies of foreign firms in Russia: Hierarchical wave diffusion of foreign enterprises
The two mentioned crises of 2008 and 2014 seriously affected the evolution of FDI to Russia, as shown in .
Figure 1. Total FDI in Russia 2008–2019 in millions of U.S. dollars (Rogov & Rozenblat, Citation2022). Source: Russian Central Bank (Citation2021).
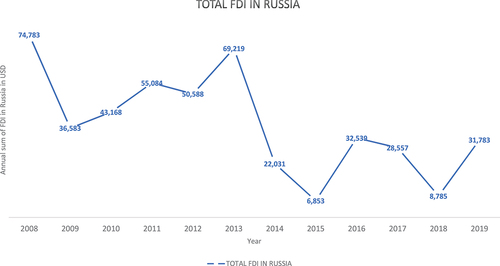
After 2008, FDI dropped by half, and only in 2013 did it approach the level of 2008. However, following the geopolitical events of 2014, FDI fell tenfold, and despite a mild recovery, it had not bounced back to the level of 2013 by 2019. Gurkov (Citation2020) explored the dynamics of the opening of new manufacturing facilities by foreign corporations in Russian cities in 2012–2018. The greatest number of new enterprises opened in 2015, but they were part of projects that started before the crisis (2012–2013). After 2015, the number of new foreign firms decreased, and only in 2018 did it return to the level of 2012 (Gurkov, Citation2020; Gurkov et al., Citation2020), which parallels the results regarding the total FDI.
While foreign firms had presented a preference for spatial diffusion in the 2000s, after the 2008 crisis, they changed to present a higher concentration in the leading regions (Moscow and the west), with developed infrastructure, industrial parks, and supportive local government (Gurkov et al., Citation2020). This means that during times of economic decline and uncertainty, foreign firms tended to invest in secure territories with explicit institutional frameworks. This behavior corresponds to the typical diffusion waves of new economic cycles (or processes developing in new conditions), where in the first stages, activities are concentrated in large urban areas (Hägerstrand, Citation1952). Analyzing the expansion of Japanese firms in West Germany, Schlunze (Citation1992) showed that the most attractive places for new foreign firms are locations with a highly skilled labor market, with the accessibility of production-oriented services (trade, transport, etc.), as well as with centrality and agglomeration advantages. Thus, Schlunze (Citation1992) demonstrated that the spatial expansion of Japanese firms in West Germany is characterized in the initial stage by a hierarchical location and further by a hierarchical wavelike diffusion process.
The stage in a such diffusion cycle process can be evaluated by the elasticity (hierarchy) of the ß parameter of a log-linear regression including a phenomenon and the city size: this is called scaling law (Bettencourt, Citation2013; Pumain et al., Citation2015; West, Citation2017). When ß is significantly above 1, the phenomenon is very concentrated in large cities, which offer better conditions for multiplier effects. When ß is below 1, small and medium cities benefit more from the phenomenon than their size would suggest.
For Russia the hierarchic-wave diffusion was first demonstrated by Kuznetsov (Citation2002) based on the distribution of FDI in Russian cities. In addition to the hierarchical-wave diffusion, he identified the neighborhood effect in FDI toward Russian territories: for example, Finnish firms invest more to the Leningrad oblast, St. Petersburg, Republic of Karelia and Murmansk oblast (regions that have a border with Finland), whereas Bryansk and Smolensk oblasts are more attractive for the investors from Belarus than other Russian regions due to the neighborhood effect. Analyzing intranational corporate networks of the 50 largest foreign firms operating in Russia, Kuznetsova and Mikhailov (Citation2018) partially confirm the compliance of foreign companies’ territorial strategies with hierarchical wave diffusion, city size and neighborhood effect. However, this study covering only 2017 does not show the evolution of the territorial strategies of foreign firms in Russia following the international sanctions of 2014 and does not formally evaluate the scaling parameter ß. In addition, the lack of relational data makes it impossible to construct a network of Russian regions or cities as a part of global economic networks. Therefore, we propose to fill this gap by studying the evolution of Russian cities’ global economic networks during the period 2010–2019 based on strong assumptions and hypotheses.
Russian firms’ strategies abroad
At the same time, Russian firms having subsidiaries abroad create international city networks. Russian FDI abroad can be classified into three different capital flows that are almost comparable in scale (Kuznetsov, Citation2021):
1. Real investments by companies and investment funds abroad;
2. “Round-tripping” FDI through offshore and other transshipment bases;
3. Capital investment by Russians in foreign real estate.
As we show later, offshores play a huge role for Russian multinationals, and their share in total FDI increased in the last years that could be a consequence both of multidirectional impact of Russian foreign policy changes, and contradictory state policy of deoffshorization (Kheyfets, Citation2018). Cities remain the main recipients of FDI as they offer high-level services supporting control functions of subsidiaries abroad.
Intra-national cities’ networks
In addition, it is important to remember that multinational firms can also compose city networks at the intra-national scale. These firms are either domestic internationalized firms, or foreign firms developing their networks between different national cities. This national network is totally inter-related with the international one and can be also affected by the international shock.
Locational strategies of domestic firms in Russia vary a lot depending on the industry to which they belong. One of the most affected industries by the crisis of 2014–2016 was retail, first of all because of the devaluation of the national currency and the following decrease in purchasing power of consumers. The decline in retail space among major food retailers in Russia in 2016 was the strongest since the crisis of 2008 (Ishchenko, Citation2017) both because of the closure of local retailers and regional subsidiaries of the largest retail groups (such as X5 Retail Group, Magnit, Lenta).However, the following years demonstrated recovery of all the largest retail groups in terms of both revenue growth and opening new retail outlets.
It is in this multi-scale (international and national) perspective that we wonder in this study how far the crisis affected each Russian city and the whole system of cities regarding their inwards and outwards multinational firms’ networks.
Assumptions and hypotheses: Russian cities in global networks
The key role of corporate ownership linkages in the integration of cities into the world economy has been widely recognized (Rozenblat, Citation2010; Rozenblat et al., Citation2017; Taylor, Citation2004). Thus, we consider multinational companies to be the principal actors contributing to the global direct or indirect connectivity of cities that increasingly drive local and national economies (McCann & Acs, Citation2011). Multinational firms (either domestic or foreign) leverage the globalization of cities, transforming them into crucial economic nodes for both private and public interests.
Cities’ corporate ownership networks
Globalization supporting the flows between cities does not only concern global cities (Friedmann, Citation1986; Sassen, Citation1991). The GaWC (Citation2020), studying the locations of 175 leading firms providing advanced producer services across 707 cities worldwide, ranked only four Russian cities: Moscow as “Alpha,” Saint-Petersburg as “Beta-,” and Kazan and Novosibirsk as “sufficiency.” However, every city is directly or indirectly concerned with relational power: a city has such power to the extent it functions as a command/execution point and thus participates in networks with other cities operating in the world economy (A. S. Alderson & Beckfield, Citation2004). Thus, the integration of different Russian cities in global networks cannot be studied independently because cities are deeply integrated inside their own national and regional urban networks (Pred, Citation1977; Rozenblat, Citation2018, Citation2021). Both the way cities are integrated inside their national urban system and the integration of the national system in the world matter for cities’ integration into global networks.
Cities’ power and attractiveness in global economic networks
When integrated into global networks, cities become more influenced by international economic or political disruptions, such as new innovations, world financial crises, wars, or sanctions. Several subsidiaries controlled from outside reveal dependence on external networks (outside of the country where the city is located). Real power is concentrated in the headquarters of multinational firms, which are most often located in cities at the top of the urban hierarchy (Cohen, Citation1981; Friedmann, Citation1986; Rozenblat & Pumain, Citation1993), revealing a location preference of firms to keep their main decision centers close to the places of political and financial power (Allen, Citation1999). In addition, A. Alderson and Beckfield et al. (Citation2007) found a strong correlation between the positions of cities in global networks and the position of their respective countries using a core-periphery model defined by Wallerstein (Citation1974). In their study of 3,692 cities of the world, Moscow is listed twice among the top 50 cities: it ranks 45th for the index of closeness (meaning that it forms a star with other cities), and it ranks 46th for the index of betweenness centrality (meaning that it is a necessary link in the path to reach other cities). For the year 2013, Rozenblat et al. (Citation2017) confirmed the existence of a very cohesive subcluster of Russian cities centered around Moscow, which represented their gatekeeper to and from other cities of the world.
Cities’ integration in specialized positions or sectoral networks
Despite Moscow’s role as gatekeeper, numerous Russian cities are currently home to many multinational corporations with specialized activities. According to their different specializations, cities have diverse trajectories, contributing to the so-called “multiple globalizations” (Krätke, Citation2014): different groups of cities with intense interactions with each other depend on their activity specializations and level of capabilities (Rozenblat et al., Citation2017). In addition, as central nodes in different sectoral global economic networks, cities can reach a certain degree of globalization, accumulate economic power, and drive globalization both around the world and inside their home country.
Focusing on these specializations, we explore how much Russian cities’ positions in corporate ownership networks has changed their position in corporate ownership networks over the last 10 years (2010–2019). In addition to studying the way the Russian cities declined individually, we consider the changes in the whole urban network and in specific cities’ trajectories following the shocks of 2014–2016.
Change in Russian cities’ positions in the context of their declining global networks
Most of the dynamic models of cities’ networks concern growing processes, considering Chinese cities (Pan et al., Citation2017) or global cities (Derudder & Taylor, Citation2020; Rozenblat, Citation2021; Sigler & Martinus, Citation2017). In contrast, considering the crisis in the Russian case, we expect to observe a shrinking process at the level of the whole network of Russian cities, and the consequences for each city’s global and national connectedness are not straightforward.
A global or national economic crisis usually affects both the positions of individual cities in the network and the whole city network. Some cities can maintain or even enhance their relative positions in networks despite economic shocks, which can be explained by cities’ internal inherited socioeconomic structures (at the meso level) and by their external global economic linkages (at the macro level; Rogov & Rozenblat, Citation2018).
In this paper, we consider the macro level: how do Russian cities maintain or improve their position relative to other cities during and after an economic shock. The answer to this question can reveal the adaptation of the quantitative and qualitative structure of the city networks, such as the diversity of cities’ connections, their national vs. international scope and their specialization.
As indicators to evaluate the changing position of cities’ globalization, numerous networking characteristics have been proposed in the literature (Neal, Citation2017). The kind of relations that are considered suggest the use of certain metrics over others, but overall, the question we aim to address must guide this choice. While we seek to compare the Russian cities’ network shrinkage in relation to their population weights and economic specialization, we adopt absolute measures rather than relative indices through two characteristics:
- City strength: the cities’ total number of in-flows and out-flows of multinational firms’ linkages, revealing the weight of the city;
- City diversity: the number of cities to which a city is related through multinational firms’ linkages, revealing the diversity of connections.
In addition, as we aim to understand cities’ changing positions in terms of the power or subsidiarity of their firms, we need oriented data from headquarters to subsidiaries (A. S. Alderson & Beckfield, Citation2004) that enable us to differentiate their power from their attractiveness:
- City power: the number of outflows of multinational firms’ linkages by city, meaning how many firms are controlled outside the city by the headquarters located in the city. This reveals the power of the local economy vis-à-vis other cities;
- City attractiveness (called “prestige” by A. S. Alderson & Beckfield, Citation2004): the number of in-flows of multinational firms’ linkages, meaning how many firms located in the city are controlled by the headquarters located outside the city. It reveals the dependence of the local economy on power located in other cities.
Furthermore, to explain the evolution of these intercity networks, the combination of the activities of each city’s firms can reveal specializations by their relative sectoral overrepresentations (compared to the average rate of the system of cities).
- City specialization: The techniques to measure specialization are numerous, using either specific indices (Isard, Herfindhal, Chi2, etc.) or implementing multivariate analyses to specify these specializations and their transformations (Henderson, Citation1997; Isard, Citation1966; Pumain & Saint-Julien, Citation2001).
All these network characteristics (specified in methodological Section 4.3) support the tests of hypotheses regarding the changing position of Russian cities in this context of a general decline in their global networks.
Hypotheses
Considering that the internal economic crisis in Russia was partially triggered by international economic sanctions, we expect that foreign firms reduced their presence in Russian cities, while Russian multinational companies expanded more in Russia:
H1: During the economic crisis of 2014–2016, cities’ international economic linkages decreased, while their intranational linkages increased.
Being less powered by foreign firms, Russian cities are expected to have lost strength, which implies a loss of the diversity of connections among Russian cities and between Russian cities and foreign cities:
H2: During the economic crisis of 2014–2016, the Russian cities’ diversity of connections decreased.
Given the decrease in consumer purchasing power during the crisis, we expect that cities lost subsidiaries rather than experiencing a reduction in the power of headquarters toward other cities, thus becoming less attractive for new foreign firms that tend to go to the most internationalized cities:
H3: During the economic crisis of 2014–2016, the power of Russian cities decreased less than their attractiveness.
Generally, we expect that firms in all sectors concentrate in large cities during economic decline and uncertainty and resist crises better in large markets than in small markets.
H4: During the economic crisis of 2014–2016, the distribution of multinational firms concentrated in the largest cities and decreased in the small- and medium-sized cities.
In general, specialization leads to more vulnerability of urban economies if cities are specialized in an industry with downward demand. However, in the case of the 2014–2016 crisis, as the ruble lost half of its value, other accompanying activities were even more affected because of the decrease of the local demand. Thus, we expect that principal firms in Russian industry operating in highly specialized cities/towns (for example, mining towns) resisted the crisis better than firms in less specialized economic sectors, which could not function well under the crisis conditions.
H5: During the economic crisis of 2014–2016, specialized cities enhanced their relative specialization.
According to these five hypotheses, for both the whole Russian network of cities and the individual cities’ trajectories, we can describe the way they reacted to the crisis in terms of maintaining (or reducing) their national and international economic networks and their specialization in these networks.
Data and methods: Building networks of cities using multinational firm linkages
To test these hypotheses, we constructed a network of cities based on multinational firm networks. To this end, we built the networks of companies that we situated in large urban regions (LURs), which are an extended conception of city regions, to build a city-city matrix of Russian cities comprising their domestic links and their links with other LURs across the world.
Building global networks of firms
The ORBIS database from Bureau van Dijk (BvD; 2010, 2013, 2016, 2019) focuses on corporate long-term investment relations based on parent–subsidiary ownership links in every economic sector. It is distinct from the interlocking world city network model (IWCNM; Taylor, Citation2001) and the interorganizational project approach (IOPA; Pažitka et al., Citation2021), which focus on advanced producer services (APSs) and banks, respectively, and use a bipartite networks approach. In contrast, in the ORBIS-BvD, linkages between cities are built directly according to the ownership linkages between the owner and the subsidiary firms located in different cities. In this way, cities are considered nodes in networks constituted by oriented links of the relations between headquarters and subsidiaries, forming global groups of firms that are mostly totally interconnected (Vitali et al., Citation2011). These BvD-ORBIS data are currently considered among the best sources of company information by numerous scholars who use them either alone (Vitali et al., Citation2011; Sigler et al., Citation2020) or along with data from other databases (Pažitka et al., Citation2021; Stolbova et al., Citation2017).
The sample that we used comprises all the direct and indirect subsidiaries of the 3,000 largest firms of the world according to their turnover each year (representing 660,000 firms worldwide and 1,000,000 linkages in 2010 and 1,300,000 firms and 1,730,000 linkages in 2019). We did not consider secondary establishments (which are not independent companies but only multiple firms of the same company) because the linkages from main to secondary establishments of firms are very different from the ownership linkages from headquarters to subsidiaries. For Russia, our sample covers approximately 40,000 enterprises in 2010 and 37,200 enterprises in 2019 (firms are connected respectively by 46,000 and 21,600 ownership linkages).
Building Russian cities’ global networks
To shift from firm networks to city networks, we aggregated the groups’ networks by pairs of cities based on the address of each headquarters or subsidiary provided by the ORBIS-BvD database. This necessitated many additional corrections and complements (Rogov, Citation2020; Rozenblat et al., Citation2017). The cities are considered as LURs, which are based on the concept of conurbation (Geddes, Citation1915; Gottmann, Citation1961, Citation1989) and more precisely on mega city regions (Hall & Pain, Citation2006), that encompass the regional functional systems around cities (Rozenblat, Citation2020a). LURs correspond, for example, to the combined statistical areas (CSA) used in the U.S. since 2000. This concept has extended to all the main cities (or economic concentrations) of the world, and several versions of their detailed municipal composition (OKTMO code for Russia) are published for criticism and improvements for Russia (Rogov, Citation2020) and for all cities of the world (Rozenblat, Citation2020b). In total, we delineated 120 LURs in Russia (Rogov & Rozenblat, Citation2020) among the 1,700 LURs of the world. It should be noted that among the 120 Russian LURs, some are several small towns (settlements in Siberia or the Far East that are highly specialized in mining), which however play an important role in the economy. The importance of these places is confirmed by the presence of an airport and multiple multinational firms. More than 85% of all the firms in Russia are located in LURs ().
Table 1. Representativeness of multinational firms in Russia.
In summary, Russian intercity relationships (intranational and international) are evaluated by these inter-LUR linkages, which are oriented from headquarters to subsidiaries and weighted by aggregating firms’ links by pairs of cities. Intraurban (intra-LUR) linkages are counted separately, revealing the embeddedness of firms that develop numerous local linkages inside cities.
In addition, the ORBIS-BvD informs on the main and secondary activities of each establishment (with a four-digit NACE European code). Using the aggregated one-digit (“letters”) nomenclature comprising 21 categories, we were able to address the last hypothesis on cities’ specialization. The population of the LURs was reconstructed at each date according to the aggregation of the municipalities constituting the LURs and using the population census (Rosstat, Citation2010, 2013, 2016, 2019).
Methods for network analyses and trajectory classifications
The data exploration is based on network analysis, including the calculation of strength (weighted in- and out-degree), diversity (unweighted in- and out-degree), attractiveness (weighted in-degree), and power (weighted out-degree). The hierarchical evolution of the distribution of firms in the Russian urban system is revealed by the application of scaling laws on strength (number of interurban firms’ linkages) and diversity (number of cities’ connections) related to the population size of the LURs. Correspondence analysis (CA; Benzécri, Citation1973; Pumain et al., Citation2015) permitted the classification of cities according to their relative trajectory of strength and diversity. The advantage of CA, based on Chi2 distances, is to standardize all cities (that have the same weight) and all years (also having the same weight), permitting the production of “relative trajectories.” To underline the specialization of cities, rather than using specialization indices, we also applied CA to understand the evolution of cities’ relative specialization and specify these specializations.
Empirical analysis of the evolution of Russian cities in global networks
The hypotheses are tested through by exploring the transformation of intercity relations both among Russian cities and between Russian cities and other cities across the world during the period 2010–2019, with specific attention to the trends before, during and after the economic crisis of 2014–2016, which is permitted by the four dates of study: 2010, 2013, 2016 and 2019.
Evolution of the position of Russian cities in global multinational firm networks 2010–2019
The comparison of Russia’s multinational linkages with the other countries of the world considering intraurban and interurban linkages shows the specificity of the Russian case. In fact, Russia was the only emerging economy among the BRICS (Brazil, Russia, India, China and South Africa) to present a constant decrease in linkages during the period 2010–2019 ().
Figure 2. Evolution of multinational firm linkages in the world from 2010 to 2019.
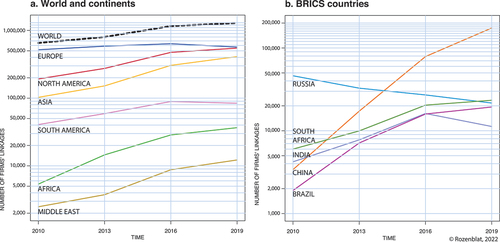
There were no special effects of the events of 2014 for multinational firms in Russia. In fact, the slope of the trend (decline) is even less steep than that in 2010–2013. To obtain a clearer picture of what was happening in the links between Russian cities, the intraurban linkages were removed, and two types of interurban links were distinguished: intranational and international ().
Figure 3. Evolution of the Russian city interurban linkages from 2010 to 2019.
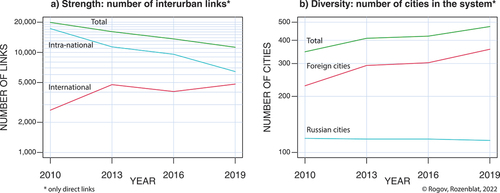
Surprisingly, the number of intranational linkages (links in which both headquarters and subsidiary are located in Russia) constantly declined during the 2010–2019 period (). In contrast, international linkages continued to increase throughout the period, except between 2013 and 2016. The size of the global network in terms of the number of cities increased, as many more cities joined the network, from 347 LURs in 2010 to 472 in 2019 (). This growth occurred specifically due to connections with foreign cities: from 228 in 2010, the number of foreign cities grew to 358 in 2019, while the number of Russian cities involved in these networks slightly decreased from 119 in 2010 to 116 in 2019. The decrease in intranational linkages might be explained by the closure of obsolete firms or the relocation of subsidiaries abroad (rather than establishing domestic subsidiaries), specifically for finance, as we will see later with the Cyprus offshores.
Thus, H1 is not supported by our data since intranational linkages decreased even faster than international linkages. In addition, H2 is not supported by our data: Russian cities indeed lost strength, but they unexpectedly gained in terms of the diversity of the cities with which they had linkages (specifically foreign cities).
The separation of inward (weighted in-degree) and outward (weighted out-degree) international linkages shows that the share of incoming foreign linkages in the total number of international links continuously decreased from 93.5% in 2010 to 79.5% in 2019. This means that on the opposite side, Russian firms expanded their headquarters’ networks in the world from 6.5% to 20.5%.
For inward international linkages, the share of European-based firms remained dominant, although it slightly decreased from 83.5% in 2010 to 80.8% in 2019. However, linkages toward European cities dramatically decreased to the benefit of Asian cities (4.7% in 2010 to 10.2% in 2019) and the Middle East which represented 11.5% of all Russian investments abroad (Bureau van Dijk, Citation2010, 2013, 2016, 2019).
Overall, the Russian cities’ networks with foreign cities show that economic sanctions and crises in Russia changed the global spatial strategies of Russian firms but did not fundamentally affect foreign business in Russia. The growth of international intercity connections means that Russian cities became more embedded in global economic networks during the 2010s and less closely linked among themselves; however, they remained very closely connected and represented a cluster in the world network (Rozenblat, Citation2021).
To illustrate this integration of Russian cities into global networks, we presented the network of multinational firms going to, from and between Russian LURs for 2010 and 2019 (). In these figures, the positions of cities are not geographic but topologic according to their proximities in the network. To better identify the Russian and foreign cities, we colored them by their continental zone, keeping Russian cities a specific color.
Figure 4. Russian cities in economic globalization in 2010.
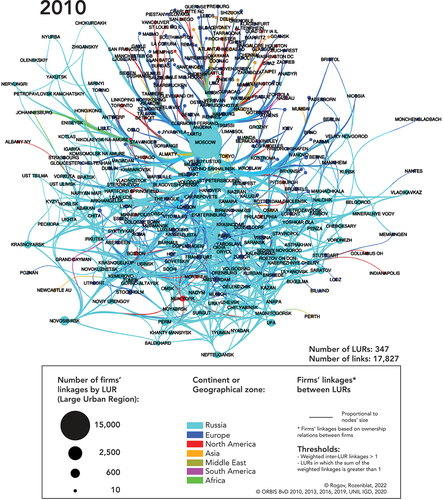
Figure 5. Russian cities in economic globalization in 2019.
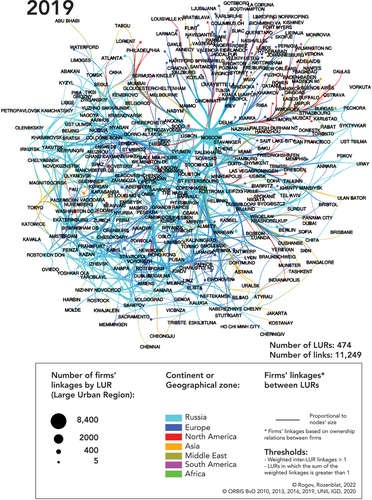
For 2010 and 2019, Moscow, due to its special position in the national urban hierarchy, concentrated most of the national and international linkages in this network (76% in 2010 and 74% in 2019). Despite its slight decline, it maintained its position as the principal economic gateway to and from Russia. The share of St. Petersburg in the total linkages increased from 12% in 2010 to 17% in 2019; however, it was still very far from Moscow. Thus, the share of the two largest Russian cities in the total slightly increased from 88% to 91% over the last 10 years.
Numerous other Russian cities became directly connected with foreign cities. The number of Asian cities connected to Russian cities moderately increased; however, most of the foreign cities in this network were European and North American, such as Amsterdam, London, Paris, Rotterdam, Rome, New York, Washington, and Chicago. They enhanced their positions and became more numerous, as shown above in . While a majority of Western European cities had direct links with many Russian cities, most of the cities of Eastern Europe and former republics of the USSR were linked only to Moscow. Other cities, such as the Cyprus offshores Limassol and Nicosia, emerged, becoming deeply linked to many Russian cities over the last 10 years.
In both years 2010 and 2019, we identify clusters of cities with close regional relations. Cities specializing in the extraction of hydrocarbons and raw materials tended to form the most stable clusters. These cities are very connected in the network because they specialize in the same economic activities; they host companies that belong to the same groups or are indirectly connected with each other. For example, Siberian cities located in Khanty-Mansi Autonomous Okrug, whose economies are based on oil extraction (Khanty Mansiysk, Surgut and Nefteyugansk), are closely linked to each other in the network. Cities in the republic of Sakha (Yakutia), such as Yakutsk, Neryungri, Olenekskiy (Olenek), Zhiganskiy (Zhigansk) and Mirniy, also create a stable cluster specializing in the extraction of natural resources (in Mirniy, “ALROSA” is the largest Russian company for diamond mining). Another closely connected cluster is formed by the specialization in mining of the Komi Republic, such as Vorkuta, Syktyvkar, Ukhta, Pechora, and Ust Tsilma.
In addition, neighboring cities of federal subjects (the constituent regional entities of Russia, its top-level political divisions) tend to have closer economic relations, especially in 2019. For example, cities situated along the Volga River, such as Volgograd, Saratov, Samara, Nizhniy Novgorod, Kazan, and Yaroslavl, were closely connected in 2019. The same is observed for other cities, such as Irkutsk, Bratsk and Ust Ilimsk; Chelyabnsk and Magnitogorsk, and illustrates that cities located close to each other tend to have denser economic cooperation, following a gravitation model (Rozenblat, Citation2015).
Additionally, cities with similar economic specializations tend to present stronger cooperation. For example, Samara (including Togliatti), Kaluga and Naberezhnye Chelny, which are large cities specializing in automobile production, became more closely linked to each other in 2019 than they were in 2010, although they are neighboring cities not in terms of geographical space but rather in terms of economic space.
Power and attractiveness
To compare the evolution of cities’ power and attractiveness, for each Russian city, we indicated the numbers of OUTWARD connections (on the X axis), meaning the city power, and INWARD connections (on the Y axis), revealing city attractiveness (). Of course, cities can be places of both headquarters and subsidiaries, and these figures inform the balance between the two positions.
Figure 6. Power and attractiveness of cities in the Russian urban network.
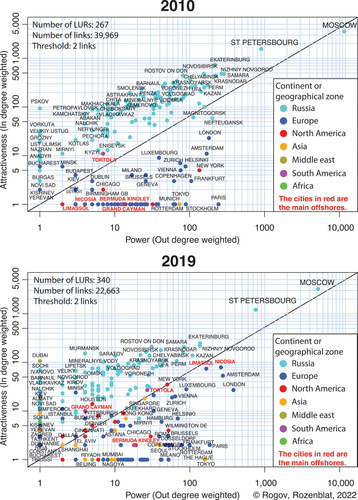
Between 2010 and 2019, Russian cities reduced their general strength, remaining more attractive than powerful compared to the foreign cities that were part of their network (however, for foreign cities, power and attractiveness are determined only with respect to their links with Russian cities). Western European and Northern American cities continued to be the main sources of foreign investments, and some of them increased their attractiveness for Russian-based multinationals despite the general decrease referred to above. Conversely, numerous Asian cities gained importance as sources of investments in Russian cities, specifically Seoul, Singapore, Hong Kong, Nur-Sultan, Nagoya, Shanghai and Beijing. In contrast, Russian-based firms extended their networks preferentially to Singapore and Hong Kong.
In 2019, Dubai appeared in a special position with a high in-degree, indicating the expansion of subsidiaries owned by companies with headquarters in Russian cities. Most of these operate in the shipping sector and own and rent oil tankers; for example, SOVCOMFLOT is the largest Russian shipping company and one of the global leaders in the maritime transportation of hydrocarbons, as well as the servicing and support of offshore exploration and oil and gas production. Other cities with very high attractiveness and low power were in Eastern European countries and former Soviet republics. This means that Russian companies continued investing in former socialist countries, but their presence remained much lower in these cities than the firms from Western European cities (Di Lello & Rozenblat, Citation2014; Zdanowska et al., Citation2020).
Despite the conflict with Ukraine, Russian firms had resumed the expansion of their networks in Kiev by 2019, but the presence of Ukrainian firms in Russia decreased. Three principal kinds of Russian firms still had assets in Ukraine in 2019: financial corporations (SBERBANK, VTB Bank, VEB RF), large industrial corporations (URALMASHPLANT, KAMAZ and URALMASH-IZHORA GROUP) and companies specializing in gas and oil extraction and transportation (GAZPROM and LUKOIL). All the subsidiaries of GAZPROM and LUKOIL in Ukraine specialize in the transit of gas from Russia to Europe through Ukraine. They are located in Kiev but also in the conflict zone of Donetsk (note that we consider Crimea to be a distinguished territory belonging to neither Ukraine nor Russia). Following the sanction regime since 2014, foreign firms could not work in this zone, and only Russian firms were present. One of the largest Ukrainian banks, PROMINVESTBANK, is fully owned by the Russian state development corporation VEB RF. Thus, despite the political conflict between Russia and Ukraine, Russian assets did not leave the Ukrainian cities.
In addition, a visible trend of the last 10 years is the reinforcement of offshores, especially the Cyprus offshores Limassol and Nicosia, which have a balanced position of power and attractiveness. Both Cyprian cities host many subsidiaries of the largest Russian banks, such as SBERBANK and VTB. LUKOIL also has affiliated companies registered in Nicosia and Limassol. From Cyprus, most of these companies are listed on the London stock exchange market (Di Lello & Rozenblat, Citation2014).
The analysis of the weighted in-/out-degrees of Russian cities reveals that many of them became more attractive than powerful, which apparently contradicts H3, proposing that during the economic crisis, the power of Russian cities decreased less than their attractiveness. However, while numerous small cities lost power, H3 is verified overall thanks to the few Russian cities concentrating the increasing power of the total Russian linkages. Cities that retained more power, in addition to Moscow and St. Petersburg, were either large industrial cities in the Volga and Ural districts or small cities in the north hosting headquarters of oil and gas extraction.
Strength and diversity of Russian cities’ linkages
Overall, the city size effect plays a role in economic globalization: the larger a city is, the greater its embeddedness in international global networks (Rozenblat, Citation2018). The scaling law in reveals the log-linear relations between population and strength and diversity. However, the ß parameter (estimated coefficient of the log-linear regression) remains below 1 for the whole period, which reveals a low effect of population size for Russian cities. Thus, on average, large cities do not have so many multinational firms compared to smaller cities, which host many firms considering their size. The stable ß parameter over the period 2010–2019 means that the number of interurban linkages remained, on average, at the same proportion in relation to population. This is true both for strength and for diversity and consequently did not introduce any significant increase in inequality between Russian cities.
Figure 7. Strength (number of linkages) and diversity (number of city connections) of cities according to their population in 2010 and 2019.
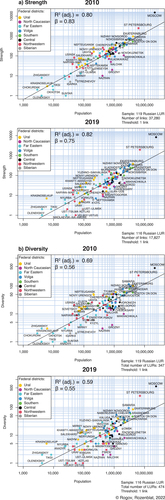
Thus, H4 is not verified, while Moscow and St. Petersburg remain high above the general line (the most connected and diversified relative to their size), and, small- and medium-sized cities are, on average, highly connected. The medium-sized cities with populations up to 0.5 million inhabitants are also significantly above the average line. Most of these cities in the northwestern, Ural and Far Eastern districts specialize in oil and gas extraction or in mining and thus host multinational companies, such as LUKOIL, GASPROM, ROSNEFT, SURGUTNEFTEGAS, TRANSNEFT, ALROSA, and RUSAL.
An interesting change concerns Mirnyi, which gained both diversity and strength by 2019. ALROSA, its principal headquartered company, is the largest Russian firm specializing in diamond exploration, mining, manufacture, and sale. While in 2010, Mirnyi had direct linkages with only three Russian cities (Moscow, Yakutsk and Barnaul), by 2019, it was more directly connected to its subsidiaries, which were previously controlled from an intermediary Moscow headquarters. It is currently connected with 18 cities, half of which are foreign, such as New York, Hong Kong, Tel Aviv, Antwerp, Geneva, Luanda and Dubai.
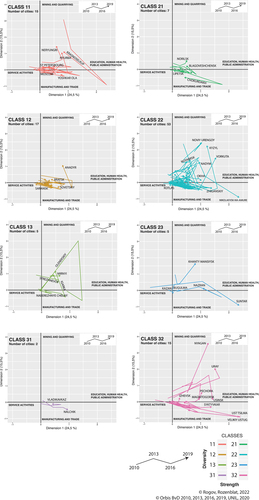
Although Russian cities did not evolve at the same speed and with the same magnitude, we seek to define groups of cities with similar relative dynamics of strength and diversity evolution. To identify these groups of cities, we applied a chi2 correspondence analysis to classify city trajectories using TrajPopFootnote1 (Pumain et al., Citation2015). Independent classifications were implemented for strength and diversity, and three clusters of cities were identified for each, yielding 8 classes in total (because no city belongs to one cross-class). The resulting classes are concatenated from the two classifications for diversity and strength (if a city is in class 1 for diversity and in class 2 for strength, its resulting class is 12).
In , classes represent groups of cities with similar changes in diversity and strength over the period 2010–2019. Class 11 is of particular interest because the cities in this class lost strength in absolute numbers but to a lesser degree than other cities, and thus, they gained relatively in proportion to other Russian cities. In addition, these cities in class 11 gained diversity in both absolute and relative terms, thus becoming more connected to other cities. This group of cities includes large cities, such as Moscow, St. Petersburg, Vladivostok, Yuzhno-Sakhalinsk, Tomsk, Krasnoyarsk, Yoshkar Ola, Astrakhan and Grozny. This group also includes small Siberian settlements, such as Eniseysk and Krasnoselkup, and those of the Republic of Yakutia (Sakha), such as Yakutsk, Nyurba, Tiksi and Neryungri, all specialized in mining and mineral extraction.
Figure 8. Classes of Russian cities evolution according to Strength/Diversity; trajectories of classes in % of the total values for all Russian cities (2010–2019).
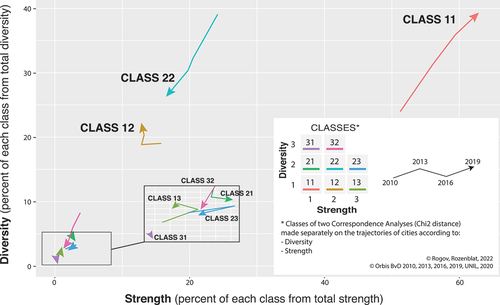
The trajectory of the largest class 22, which contains 53 cities, in opposite to that of class 11: cities in this class lost in strength and even more in diversity, thus reducing their connections to other cities. This class includes middle and large cities and two other specific groups of cities, such as large industrial cities inherited from the USSR era (for instance, Chelyabinsk, Novosibirsk, Irkutsk, Kemerovo, Novokuznetsk, Yaroslavl, Perm, Ufa, and Omsk) and cities specialized in mining and oil and gas extraction (such as Nefteyugansk, Novy Urengoy, Surgut, Salekhard, Ukhta, Neftekamsk, Naryan Mar, and Vorkuta).
Cities in class 12 experienced intermediate trajectories, and their direction changed after the crisis: while they lost strength during the first period of 2010–2013, after 2013, they started gaining diversity and stopped losing strength (however, in absolute terms, strength continued to decline). There are 17 cities in this class, and most of them are the largest Russian industrial centers, such as Samara, Ekaterinburg, Nizhniy Novgorod, Krasnodar, Rostov-on-Don, Tyumen, Kaluga, Khabarovsk, Ulyanovsk, Voronezh, and Penza.
Other classes contain a few cities with a small number of firms; these are either small and specialized cities located in northern Russia or large and medium industrial cities. Unlike the classes previously discussed, these classes do not show a trend but rather chaotic changes for both strength and diversity following the crisis of 2014–2016. Their slight connections are strongly impacted by single firms’ movements or changes in financial linkages.
The constructed trajectories generally illustrate that the group of cities including Moscow and St. Petersburg (class 11) shows more resistance during the turbulent time of the economic crisis, accumulating more strength and diversity relative to other classes. While city size is not the only property explaining this resistance (because this class also includes a large variety of city sizes), we wonder whether some specific sectoral specializations can describe these resistant cities.
Evolution of city specialization, strength, and diversity
We explored these city groups’ trajectories in combination with the evolution of firms’ activities with another correspondence analysis (CA) of the economic activities profile (2010 to 2019) of cities’ firms (). The two first axes of this CA (applied to the 120 LURs according to the 21 activities of their firms) summarize 40% of all the information. The first axis (24.5%) opposes, on the one hand, services, and on the other hand, education, public health and administration. The second axis (15.5%) opposes mining and quarrying to higher technological manufacturing and trade. We present individual cities’ trajectories in , distinguishing them in different graphs corresponding to the classes derived from the previous classification based on strength and diversity (). We provide the names of the cities with the strongest evolutions.
Figure 9. Evolution of the economic activities of cities by classes of strength and diversity trajectories (2010–2019).
These trajectories of cities’ relative economic specialization in global networks for the period of 2010–2019 provide several important insights:
a. Trend toward service activities
In all the graphs, most Russian cities present a trend toward a more service-oriented economy (especially cities of classes 11 (the group of the most resistant cities), 12, 21 and 22).
b. Size effect
The classes encompassing the largest cities (11 and 12) show quite small trajectories because they host many firms in each sector (the largest cities are usually in the center of the graph, which is the average of all cities), while small towns sometimes show dramatic changes in their trajectories because for these towns, the loss of even one firm can drastically change their trajectories.
c. Further specialization of highly specialized cities
The most specialized cities seem to reinforce their specialization, partly supporting H5. For example, mining cities, represented in almost every class, became even more specialized in mining, meaning that the firms of other sectors decreased (for example, class 11: Neryungri; class 12: Anadyr; class 13: Mirnyi; class 22: Novy Urengoy, Vorkuta, Noyabrsk; class 23: Khanty-Mansiysk; class 32: Nyagan, Uray). In most of the cities specializing in oil and gas extraction, the number of mining firms also decreased, but not so drastically as the number of firms in other economic sectors. Thus, in general, this shows a certain resistance of the mining industry to the economic sanctions that prohibited the import of equipment for natural recourse extraction from the U.S. and Europe. However, as these cities belong to different classes of strength and diversity trajectories, there is no straightforward correspondence between their specialization and their resistance.
Discussion
The combination of the national and international approaches permitted us to confirm how closely all Russian cities are directly or indirectly integrated into global economic networks. By direct integration we mean that a city hosts subsidiaries of foreign firms thus creating an international economic link, whereas indirect integration implies a mediator between a headquarter and a subsidiary: for example, a foreign firm opens a new enterprise in Moscow, which in turn opens its subsidiary in another Russian city. It is not only four Russian cities that are integrated into global economic networks (GaWC, Citation2020), but the entire Russian system of cities is concerned. The interaction between Russian cities particularly matters for specialized cities, which are very closely interconnected in specific clusters in the national network. The analysis at the city level shows numerous counterintuitive results that we can discuss in terms of the following five aspects:
Toward less national connectedness?
Over the whole period, we observed an increase in the international linkages of cities and a decrease in the intranational linkages, thus contradicting H1. The decrease in connectedness mostly concerned intranational firms’ linkages, which could explain the increasing interregional inequalities observed by numerous scholars (Zubarevich, Citation2019). The fact that the share of outward linkages was steadily growing and the number of intranational linkages was reduced, shows that Russian firms reduced their corporate networks in Russia but increased their presence abroad. This is an indication that Russian companies tried to save their assets as the national economy and ruble declined by externalizing their activities, specifically toward new Asian markets.
In addition, Cyprus remains very attractive to Russian businessmen because those who invest a certain amount of money in Cyprus can obtain EU citizenship. Moreover, Cyprus offshores are well-known for capital round-tipping (Ledyaeva et al., Citation2015), and despite the 2012 crisis, when Cyprus was accused of money laundering, the flow of Russian investments continued (). However, in 2021, the Russian taxes on Russian investments in Cyprus are to increase to 15% (from 5% or 10% depending on the type of firm revenues). Therefore, the expansion of Russian capital in Cyprus may begin to change soon. A similar increase in taxes for Russian companies, reaching up to 15%, was also implemented in the Netherlands, Malta and Luxembourg, which will probably lead to the return of Russian capital from these countries or their move to more advantageous tax havens.
Geographical diversification of the Russian network of cities
Cities’ strength decreased, while cities’ diversity increased to a large extent due to the expansion of Russian firms to new foreign cities, thus not supporting H2. Visualizing the evolving network of cities ( & ), we demonstrated the increasing role of Western European and Northern American cities in the network and the emergence of Asian and Middle Eastern cities. Ths means that the globalization process continues to expand in the Russian urban system and that the diversity of cities’ linkages could contribute to their resistance in these times of crisis. This could offer a policy implication for the local authorities of small and medium-sized Russian cities to diversify their attractiveness to firms from diverse national and foreign origins. This important implication should be considered to take advantage of the diversity of intercity connections, specifically in the special economic zones and industrial parks underlined by Gurkov (Citation2016) and Gurkov et al. (Citation2020).
Power and attractiveness of Russian cities
Most of the Russian cities are more attractive than powerful (domination of in-degree), and they became even more attractive from 2010 to 2019. Thus, H3 is not generally supported by the city-level data analysis. This reflects that numerous cities lost their main headquartered companies, which left during the crisis. However, the attractiveness of the few large industrial centers or small mining cities hosting the headquarters of large mining companies, which had the most power, increased, thus supporting H3.
Diffusion wave and city size
City size matters to define a city’s position, but this effect remained weak during the period 2010–2019, meaning that population does not have a multiplier effect: in contrast, smaller cities have proportionally more firms than larger cities. The fact that the city size effect did not increase during the period reveals a stagnation of the concentration of firms, thus not supporting hypothesis H4. These findings lead us to discuss the results of Gurkov et al. (Citation2020) for foreign manufacturing firms. Gurkov et al. (Citation2020) first argue that during times of economic decline and uncertainty, firms tend to invest in territories located near the capital city, Moscow. The results reveal that the Moscow urban region lost some of its central role (although it remained very dominant before St. Petersburg), and small, specialized urban centers (such as mining production sites) close to resources retained firms.
Russian cities resisting the shrinkage of global networks
The largest cities with more diversified economic activities in global networks, as well as the largest specialized centers with the largest geographic diversity of connections, presented greater resistance to the decrease in global linkages (considering both strength and diversity). In contrast, cities of other classes suffered much more from a decrease in both indicators of global connections.
These results suggest that the increase in interregional inequalities observed by Zubarevich (Citation2019) could be explained by the decline in intranational linkages, which has reduced national cohesion, while Moscow and other places, such as St. Petersburg, Vladivostok, Yuzhno-Sakhalinsk, Tomsk, Krasnoyarsk, Yoshkar Ola, or Astrakhan, create Islands of internationalization. In fact, the largest cities of Moscow and St. Petersburg still concentrate most of the firm linkages (90%), while connections remain spread across smaller specialized Russian cities. This supports the findings of Gurkov (Citation2016, Citation2020) based only on foreign manufacturing firms, which showed that the efforts of local authorities along with a combination of various forms of special territories (special economic zones, industrial parks) permitted the location of new firms to other Russian cities than Moscow, but essentially toward the largest cities.
Relative increase in the specialization of Russian cities in global networks
Few cities of northern Russia, which are highly specialized in mining and mineral extraction, became more service oriented and diversified; thus, H5 is partially supported by the city-level data analysis. These cities better resisted the shock by keeping competitive firms’ networks. However, this was also the case for some (but not all) highly specialized cities in mining and energy, which remained a source of wealth and value for the Russian economy. This makes it difficult to propose straightforward conclusions on the general properties supporting resistance capabilities. Deeper analyses seem necessary to explain why some specialized centers resisted better than others, according to their regional institutions and corporate and local economic contexts.
Conclusion
This study proposed a new perspective of the globalization of Russian cities, focusing not on a few selected cities but on the entire Russian network of cities that interact with global economic networks. In the context of a general decrease in intercity linkages as a response to international sanctions, we demonstrate several counterintuitive processes at the level of the Russian network of cities: the shrinkage occurred mostly between Russian cities (intranational exchanges) and not internationally (Russian cities and foreign cities) and we do not observe a strong concentration of global economic networks in the largest Russian cities as expected but rather find diverse situations of very specialized cities.
Thus, despite international sanctions and the subsequent internal economic crisis, Russian cities continued their integration into world economic networks. The largest cities’ lower vulnerability and the continued presence of multinational firms in the most specialized cities, especially under the conditions of economic uncertainty, illustrate a mature stage of the globalization of Russian cities. To reinforce the integration of smaller cities into global networks, regional policies could restructure declining industrial areas and support highly specialized cities by diversifying their global connections. This would help mitigate the substantial economic, social and territorial disparities across Russian regions.
The proposed network approach to the globalization of Russian cities is, of course, limited in its representativeness of the whole Russian urban economic system. We should further collect data on cities’ economic performance and the evolution of population and employment from the Russian federal statistics service. Combining these two types of data—on the one hand, cities’ positions in global economic networks and, on the other hand, cities’ total employment dynamics—could better explain why some specialized Russian cities resisted better than others. In these approaches, it is important to remember that cities’ properties concern both their own compositions and their national and global connections; these two aspects form different levels of the systems of cities. These future multilevel approaches would open new research avenues on urban resilience to better understand the uneven resistance of cities facing such global crises, which could be extended to other kinds of crises that countries and the world have faced more recently.
Acknowledgments
The authors would like to thank Andrea Ferloni, Mehdi Bida and Shade Shutters for the numerous discussions and their constructive advice. Also, the authors are very thankful to Clémentine Cottineau, Martin Muller, Maria Gunko and all the anonymous reviewers for their valuable remarks.
Disclosure statement
No potential conflict of interest was reported by the author(s).
Correction Statement
This article has been corrected with minor changes. These changes do not impact the academic content of the article.
Additional information
Notes on contributors
Mikhail Rogov
Mikhail Rogov is a research fellow at the Faculty of Geography and Geoinformation Technology, HSE University in Moscow, Russia. He earned his PhD at the University of Lausanne (2021) researching urban resilience of Russian Metropolitan Areas facing the economic crisis of 2014-2016, where he studied urban resilience in a multilevel perspective. Currently, he works on the project devoted to the distribution of human capital in Russian cities, focusing on the factors of regional inequality in human capital attraction and reproduction.
Celine Rozenblat
Celine Rozenblat is professor of Urban Geography at the University of Lausanne, Director of the Institute of Geography and Sustainability (IGD), and vice-president of International Geographical Union (IGU). She is a member of the International Science Council (ISC) commission on Urban Health and Well Being: A System Approach for 4 years and a member of the Society of Complex Systems, and an active member of the Digital Campus of Complex Systems. She studies the evolution of power distributions inside and between cities that reshapes the world organization of central/peripheral cities and the complexity of the global urban system. The methodologies derived from complex systems sciences bring new forms of intelligibility to worldwide urban dynamics. For several years she has worked on the evolution of multi-level urban processes and dynamics in city-system networks. Diachronic and dynamic models and visualizations aim to offer different perspectives for cities’ policies.
Notes
1. Available online: https://analytics.huma-num.fr/Robin.Cura/trajpop/
References
- Alderson, A. S., & Beckfield, J. (2004). Power and position in the world city system. American Journal of Sociology, 109(4), 811–851. https://doi.org/10.1086/378930
- Alderson, A. S., & Beckfield, J. (2007). Globalization and the world city system: Preliminary results from a longitudinal data set. In P. J. Taylor, B. Derudder, P. Saey & F. Witlox (Eds.), Cities in globalization: Practices, policies and theories (pp. 21–36). Routledge.
- Allen, J. (1999). Cities of power and influence: Settled formations. In J. Allen, D. Massey, & M. Pryke (Eds.), Unsettling cities (pp. 182–227). Routledge.
- Batunova, E., & Gunko, M. (2018). Urban shrinkage: An unspoken challenge of spatial planning in Russian small and medium-sized cities. European Planning Studies, 26(8), 1580–1597. https://doi.org/10.1080/09654313.2018.1484891
- Benzécri, J. P. (1973). L’analyse des données [Data analysis] (Vol. 2). Dunod.
- Bettencourt, L. M. (2013). The origins of scaling in cities. Science, 340(6139), 1438–1441. https://doi.org/10.1126/science.1235823
- Brade, I., & Rudolph, R. (2004). Moscow, the global city? The position of the Russian capital within the European system of metropolitan areas. Area, 36(1), 69–80. https://doi.org/10.1111/j.0004-0894.2004.00306.x
- Bureau van Dijk (2010, 2013, 2016, 2019). Orbis database. https://www.bvdinfo.com/en-gb/
- Cohen, R. B. (1981). The new international division of labour, multinational corporations and urban hierarchy. In M. Dear, & A. Scott (Eds.), Urbanisation and urban planning in capitalist society (pp. 287–315). Methuen, London.
- Cottineau, C. (2016). A multilevel portrait of shrinking urban Russia. Espace populations /3-2016/1 | 2016, mis en ligne le 20 mars 2016, consulté le 11 mai 2016. http://eps.revues.org/6123
- Cottineau, C., & Frost, I., (2018) The Russian urban system: Evolution engaged with transition. In C. Rozenblat, D. Pumain, & E. Velasquez (Eds.), International and transnational perspectives on urban systems, UN-Habitat/Springer - Series: Advances in Geographical and Environmental Sciences (pp. 263–284). Springer. https://doi.org/10.1007/978-981-10-7799-9_12
- Derudder, B., & Taylor, P. (2020). Three globalizations shaping the twenty-first century: Understanding the new world geography through its cities. Annals of the American Association of Geographers, 110(6), 1831–1854. https://doi.org/10.1080/24694452.2020.1727308
- Di Lello, O., & Rozenblat, C. (2014). Les réseaux des firmes multinationales dans les villes d’Europe centre-orientale [The networks of multinational firms in the cities of Central Eastern Europe]. Cybergeo. European Journal of Geography, 678. https://doi.org/10.4000/cybergeo.26325
- Dreger, C., Kholodilin, K., Ulbricht, D., & Fidrmuc, J. (2016). Between the hammer and the anvil: The impact of economic sanctions and oil prices on Russia’s ruble. Journal of Comparative Economics, 44(2), 295–308. https://doi.org/10.1016/j.jce.2015.12.010
- Friedmann, J. (1986). The world city hypothesis. Development and Change, 17(1), 69–84. https://doi.org/10.1111/j.1467-7660.1986.tb00231.x
- GaWC. (2020) Database 2020. https://www.lboro.ac.uk/gawc/world2020t.html
- Geddes, P. (1915). Cities in evolution: An introduction to the town planning movement and to the study of civics. Norgate and Williams.
- Gottmann, J. (1961). Megalopolis: The urbanized Northeastern seaboard of the United States. Twentieth Century Fund.
- Gottmann, J. (1989). What are cities becoming centres of? Sorting out the possibilities. In R. V. Knight & G. Gappert (Eds.), Cities in a global society (pp. 58–67). Sage.
- Gritsai, O. (1997). Business services and restructuring of urban space in Moscow. GeoJournal, 42(4), 365–376. https://doi.org/10.1023/A:1006866100356
- Gurkov, I. (2016). Against the wind – New factories of Russian manufacturing subsidiaries of Western multinational corporations. Eurasian Geography and Economics, 57(2), 161–179. https://doi.org/10.1080/15387216.2016.1191366
- Gurkov, I. (2020). Location of Russian enterprises of foreign corporations opened in 2012–2018. Regional Research of Russia, 10(1), 29–37. https://doi.org/10.1134/S2079970520010049
- Gurkov, I., Kokorina, A., Saidov, Z., & Balaeva, O. (2020). Foreign direct investment in a stagnant economy: Recent experience of FDI in manufacturing facilities in Russia. Journal of East-West Business, 26(2), 109–130. https://doi.org/10.1080/10669868.2019.1689219
- Hägerstrand, T. (1952) The propagation of innovation waves. Lund Studies in Geography, Series B, Number 4, Lund, Sweden, Gleerup.
- Hall, P. G., & Pain, K. (Eds.). (2006). The polycentric metropolis: Learning from mega-city regions in Europe. Routledge.
- Henderson, V. (1997). Medium size cities. Regional Science Urban Economies, 27(6), 583–612. https://doi.org/10.1016/S0166-0462(96)02169-2
- Isard, W. (1966). Methods of regional analysis (Vol. 4). The M.I.T. Press.
- Ishchenko, N. (2017) Krupneyshiye roznichnyye seti postavili rekord po sokrashcheniyu torgovykh ploshchadey [The largest retail chains set a record for the reduction of retail space]. Vedomosti (In Russian). https://www.vedomosti.ru/business/articles/2017/02/27/679032-roznichnie-seti-rekord
- Ivanter, V. (2016). Strategy of transition to economic growth. Studies on Russian Economic Development, 27(1), 1–4. https://doi.org/10.1134/S1075700716010056
- Kheyfets, B. A. (2018). Vliyaniye antirossiyskih sanktsiy na protsess deofshorizatsii [Deoffshorization and anti-Russian sanctions]. Russian Foreign Economic Bulletin, 22(8), 15‒31. (In Russian) http://www.rfej.ru/rvv/id/40030BE2B
- Klepach, A. (2015). Lessons from modern crisis for economic development in Russia. Journal of the New Economic Association, 26(2), 210–218. http://journal.econorus.org/pdf/NEA-26.pdf
- Krätke, S. (2014). How manufacturing industries connect cities across the world: Extending research on ‘multiple globalizations.’ Global Networks, 14(2), 121–147. https://doi.org/10.1111/glob.12036
- Kuznetsov, A. (2002). Territorial development of firms as the cause of interregional differences in the intensity of foreign economic relations. In V. Mau, & O. Kuznetsova (Eds.), Investment attractiveness of regions: The causes of differences and the economic policy of the state (Collection of articles (pp. 8–44). Institute of Transition Economics, Moscow. In Russian.
- Kuznetsov, A. (2021). Direct investment from Russia abroad: Changes since 2018. Obshchestvennye nauki i sovremennost, 23(1), 5–16. (In Russian) https://doi.org/10.31857/S086904990013992-3
- Kuznetsova, O., & Mikhailov, A. (2018). Territorial strategies of major foreign companies in Russia. Federalism, 2(3), 74–89. https://federalizm.rea.ru/jour/article/view/66
- Ledyaeva, S., Karhunen, P., Kosonen, R., & Whalley, J. (2015). Offshore foreign direct investment, capital round-tripping, and corruption: Empirical analysis of Russian regions. Economic Geography, 91(3), 305–341. https://doi.org/10.1111/ecge.12093
- Loginova, J., Sigler, T., Martinus, K., & Tonts, M. (2020). Spatial differentiation of variegated capitalisms: A comparative analysis of Russian and Australian oil and gas corporate city networks. Economic Geography, 96(5), 422–448. https://doi.org/10.1080/00130095.2020.1833713
- Lyakin, А. (2018). Three crises in the Russian economy and one chain of events. St Petersburg University Journal of Economic Studies, 34(1), 004–025. https://doi.org/10.21638/11701/spbu05.2018.101
- Lyakin, A., & Rogov, M. (2017a). Sanctions and counter-sanctions: The use of political tools for economic purposes. National Interests: Priorities and Security, 13(8), 1396–1414. In Russian. https://doi.org/10.24891/ni.13.8.1396
- Lyakin, A., & Rogov, M. (2017b) The consequences of discriminatory measures for the national economy in the global market. Proceedings of 17th International Scientific Conference “Globalization and its Socio-Economic Consequences, University of Zilina, pp. 1380–1387.
- Makaryčev, A. S. (2000). Islands of globalization: Regional Russia and the outside world. Working paper/Regionalization of Russian foreign and security policy, 2.
- Mau, V. (2016). Between crises and sanctions: Economic policy of the Russian Federation. Post-Soviet Affairs, 32(4), 350–377. https://doi.org/10.1080/1060586X.2015.1053723
- Mau, V. (2018). At the final stage of the global crisis: Economic tasks in 2017-2019. Voprosy Ekonomiki, 3(3), 5–29. (In Russian) https://doi.org/10.32609/0042-8736-2018-3-5-29
- McCann, P., & Acs, Z. (2011). Globalization: Countries, cities and multinationals. Regional Studies, 45(1), 17–32. https://doi.org/10.1080/00343404.2010.505915
- Neal, Z. P. (2017). Well connected compared to what? Rethinking frames of reference in world city network research. Environment and Planning A: Economy and Space, 49(12), 2859–2877. https://doi.org/10.1177/0308518X16631339
- Pan, F., Bi, W., Lenzer, J., & Zhao, S. (2017). Mapping urban networks through inter-firm service relationships: The case of China. Urban Studies, 54(16), 3639–3654. https://doi.org/10.1177/0042098016685511
- Pažitka, V., Wójcik, D., & Knight, E. (2021). Critiquing construct validity in world city network research: Moving from office location networks to inter‐organizational projects in the modeling of intercity business flows. Geographical Analysis, 53(2), 355–376. https://doi.org/10.1111/gean.12226
- Pred, A. (1977). City-systems in advanced economies. Hutchinson University Library.
- Pumain, D. (2006). Alternative explanations of hierarchical differentiation in urban systems. In D. Pumain (Ed.), Hierarchy in natural and social science (pp. 169–222). Springer.
- Pumain, D., & Saint-Julien, T. (2001). Les Interactions Spatiales [Spatial interactions]. Armand Colin, Coll. Cursus.
- Pumain, D., Swerts, E., Cottineau, C., Vacchiani-Marcuzzo, C., Ignazzi, C. A., Bretagnolle, A., and Baffi, S. (2015). Multilevel comparison of large urban systems. Cybergeo: European Journal of Geography, 706. https://doi.org/10.4000/cybergeo.26730
- Rogov, M. (2020). Database: Russian large urban regions 2020 (Version 4) [Data set]. Zenodo. https://doi.org/10.5281/zenodo.3860862
- Rogov, M. (2021). Integration of Russian cities into global economic networks (2010–2020). Political Science (RU), 8(4), 161–184. https://doi.org/10.31249/poln/2021.04.07
- Rogov, M., & Rozenblat, C. (2018). Urban resilience discourse analysis: Towards a multi-level approach to cities. Sustainability, 10(12), 4431. https://doi.org/10.3390/su10124431
- Rogov, M., & Rozenblat, C. (2020). Delineating Russian cities in the perspective of corporate globalization: Towards large urban regions. Cybergeo, 949. https://doi.org/10.4000/cybergeo.35108
- Rosstat (Russian Federation Federal State Statistics Service) (2020). Data on urbanization rate for 2020 [Data set]. https://eng.gks.ru/
- Rosstat (Russian Federation Federal State Statistics Service) (2010, 2013, 2016, 2019). Population data for 2010, 2013, 2016 and 2019. [Data set]. https://eng.gks.ru/
- Rozenblat, C. (2010). Opening the black box of agglomeration economies for measuring cities’ competitiveness through international firm networks. Urban Studies, 47(13), 2841–2865. https://doi.org/10.1177/0042098010377369
- Rozenblat, C. (2015). Inter-cities’ multinational firm networks and gravitation model (international forum). Annals of the Association of Economic Geographers, 61(3), 219–237. https://www.jstage.jst.go.jp/article/jaeg/61/3/61_KJ00010136644/_pdf
- Rozenblat, C. (2018). Urban systems between national and global: Recent reconfiguration through transnational networks. In C. Rozenblat, D. Pumain, & E. Velasquez (Eds.), International and transnational perspectives on urban systems, UN-Habitat/Springer - Series: Advances in Geographical and Environmental Sciences (pp. 19–51). Springer. https://doi.org/10.1007/978-981-10-7799-9_2
- Rozenblat, C. (2020a). Extending the concept of city for delineating large urban regions (LUR) for the cities of the world. Cybergeo: European Journal of Geography, 954. https://doi.org/10.4000/cybergeo.35411
- Rozenblat, C. (2020b). Large urban regions of the world (Version 1.4) [Data set]. Zenodo. https://doi.org/10.5281/zenodo.3700052
- Rozenblat, C. (2021). Intra and inter-city networks of multinational firms (2010-2019). In Z. Neal, & C. Rozenblat (Eds.), Handbook on cities and networks (pp. 511–556). Edward Elgar Publishing.
- Rozenblat, C., & Pumain, D. (1993). The location of multinational firms in the European urban system. Urban Studies, 30(10), 1691–1709. https://doi.org/10.1080/00420989320081671
- Rozenblat, C., Zaidi, F., & Bellwald, A. (2017). The multipolar regionalization of cities in multinational firms’ networks. Global Networks, 17(2), 171–194. https://doi.org/10.1111/glob.12130
- Russian Central Bank. (2021). Foreign Direct Investments [Data set]. https://www.cbr.ru/eng/statistics/macro_itm/svs/
- Sassen, S. (1991). The global city: New York, London, Tokyo. Princeton University Press.
- Schlunze, R. D. (1992). Spatial diffusion of Japanese firms in West Germany and West Berlin from 1955 to 1989. Geographical Review of Japan, Series B, 65(1), 32–56. https://doi.org/10.4157/grj1984b.65.32
- Sigler, T., Martinus, K., Iacopini, I., & Derudder, B. (2020). The role of tax havens and offshore financial centres in shaping corporate geographies: An industry sector perspective. Regional Studies, 54(5), 621–633. https://doi.org/10.1080/00343404.2019.1602257
- Sigler, T. J., & Martinus, K. (2017). Extending beyond ‘world cities’ in World City Network (WCN) research: Urban positionality and economic linkages through the Australia-based corporate network. Environment and Planning A: Economy and Space, 49(12), 2916–2937. https://doi.org/10.1177/0308518X16659478
- Stolbova, V., Battiston, S., Napoletano, M., & Roventini, A. (2017). Financialization of Europe: A comparative perspective. Working paper.
- Taylor, P. J. (2001). Specification of the world city network. Geographical Analysis, 33(2), 181–194. https://doi.org/10.1111/j.1538-4632.2001.tb00443.x
- Taylor, P. J. (2004). Regionality in the world city network. International Social Science Journal, 56(181), 361–372. https://doi.org/10.1111/j.0020-8701.2004.00499.x
- Vitali, S., Glattfelder, J. B., & Battiston, S. (2011). The network of global corporate control. PloS one, 6(10), e25995. https://doi.org/10.1371/journal.pone.0025995
- Wallerstein, I. (1974). The modern world system. Academic Press.
- West, G. B. (2017). Scale: The universal laws of growth, innovation, sustainability, and the pace of life in organisms, cities, economies, and companies. Penguin.
- Zdanowska, N., Rozenblat, C., & Pumain, D. (2020). Evolution of urban hierarchies under globalization in Western and Eastern Europe. Regional Statistics, 10(2), 3–26. https://doi.org/10.15196/RS100202
- Zubarevich, N. (2015). Regional dimension of the new Russian crisis. Voprosy Ekonomiki, 48(4), 37–52. (In Russian) https://doi.org/10.32609/0042-8736-2015-4-37-52
- Zubarevich, N. V. (2016). Crises in post-Soviet Russia: Regional projection. Regional Research of Russia, 6, 95–104. https://doi.org/10.1134/S207997051602012X
- Zubarevich, N. (2019). Inequality of regions and large cities of Russia: What was changed in the 2010s? Social Sciences and Modernity, 21(4), 57–70. (In Russian) https://doi.org/10.31857/S086904990005814-7
Appendix
1. Power and attractiveness of Russian cities in 2010 and 2019
On the we illustrate the evolution of power and attractiveness of Russian cities using a balance index: cities in red are dominated by power (more out degree), and cities in blue are dominated by attractiveness (more in degree). Here national and international linkages are represented as they both matter in evaluating the evolution of the strength of cities.
Figure A1. Power and attractiveness of Russian cities in 2010 and 2019.
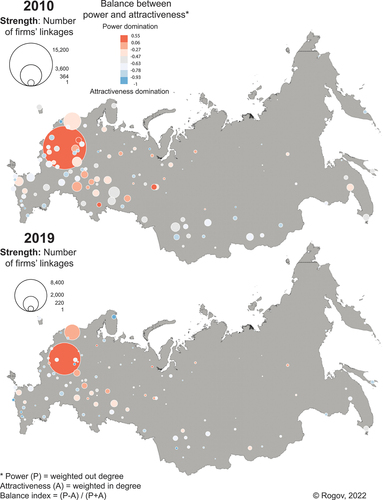
2. Geographical scope of cities’ linkages
If we examine the evolution of the scope of linkages of the largest Russian cities (with population more than 1 million inhabitants; ), they all reported an increase of the share of international linkages (both with Europe and inter-continental) during the period 2010-2019.
Figure A2. Geographical scope of multinational firms’ linkages in Russian cities from 2010 to 2019.
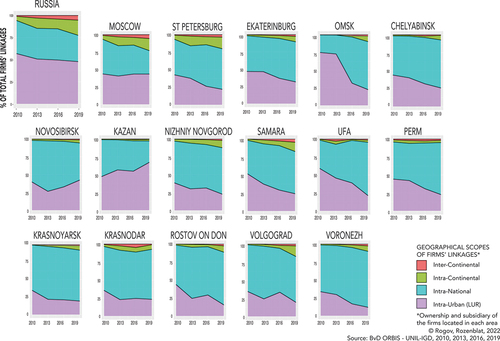
The largest cities such as Moscow and St. Petersburg internationalize faster than other cities, and thus they have a larger share of international linkages and a quite similar structure of linkages to Russia in general. Kazan represents a quite specific case: being the least internationalized, it is dominated by intra-urban linkages meaning that most of the multinational firms that are present invest in other subsidiaries in Kazan. It could reveal the fact that Kazan is a capital of the ethnic Islam republic of Tatarstan that concentrates local activities and plays a particular role in doing regional business, thus explaining the weakness of internationalization.
3. Relations between Strength and Diversity
Going further, we examine the relations between the number of cities connected to a city calculated as unweighted in and out degree (diversity) and the total number of linkages calculated as weighted in and out degree (strength; ). A ß parameter largely above 1 means that the strength index is more than proportional to the diversity index and thus that the diversity of the connected cities to Russian cities multiplies their number of firms’ connections.
Figure A3. Strength (number of linkages) of Russian cities according to their Diversity (number of connected cities) in 2010 and 2019.
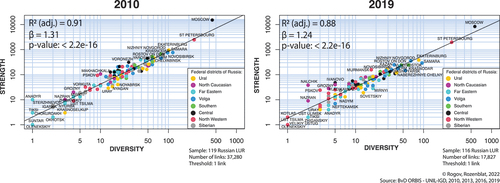
The stability of the ß parameter for the period 2010-2019 means that strength remains, on average, at the same proportion in relation to diversity, despite the general decrease of the strength and the increase of the diversity index. Actually, this can be explained by the uneven evolution of Russian cities according to these two indexes: unlike the general decrease of both in strength and diversity, the cities of the North Caucasian region (especially Nalchik, Nazran and Grozny) became highly above the line in 2019 meaning that they did not reduce or gain new firms (especially Nalchik). In terms of diversity this region is quite specific: most of the North Caucasian cities are linked only to the Russian cities (Moscow and St. Petersburg), and within the last 10 years Russian firms did not leave this market.
4. Russian investments to Cyprus and Cyprus direct investments to Russia
Table A1. Russian investments to Cyprus and Cyprus direct investments to Russia (million US$).