
ABSTRACT
Existing urban morphology trajectories influence how planning interventions shape future development. Here, we use six purposefully selected neighborhoods, encompassing 10,519 individual properties, to analyze parcel-specific land use, zoning, and property boundary change over seven decades, to better understand the transformation of Brisbane, Australia. Our findings demonstrate the difficulty of overcoming the path dependency of urban morphology when attempting to deliver a contemporary goal of densifying existing urban areas. We highlight the need to tailor land use policy to specific neighborhoods by considering the differences in their existing urban morphology. This is particularly relevant when seeking to achieve densification in both regular, gridded neighborhoods and post–World War II suburbs with motorway infrastructure, neighborhood units and internal, curvilinear streets.
Introduction
Building on the earlier traditions of greenbelts and other restrictions on peripheral urban expansion, many cities (particularly auto-centric, Anglo-American conurbations) introduced planning mechanisms in the 1980s to restrict outward growth (Johnson, Citation2010). Urban consolidation, urban containment, growth management, and urban intensification broadly refer to planning processes that seek to use existing urban land more efficiently, and to limit urban sprawl. Implementation mechanisms vary by jurisdiction with densification strategies achieving varying degrees of success (Searle & Filion, Citation2011). A critical bulwark to achieving increased density is the intransigence of the underlying layout of streets and parcels (Gallagher et al., Citation2020). Densification inherently requires changes to the urban structure and form of cities, including retrofitting the morphological structure of existing neighborhoods. However, once streets are laid out, property boundaries are delineated and land is sold to various owners, it is nearly impossible to retrofit the urban layout (Wheeler, Citation2015). Even disasters such as fire, earthquakes, and floods do not impact on the enduring nature of property boundaries, although destruction provides opportunity for redevelopment at higher density (Siodla, Citation2017). Despite the static nature of both street and land parcel boundaries, densification mechanisms often omit both the existing physical structure of the city (Birkhamshaw & Whitehand, Citation2012; Stell & Tait, Citation2016), and the path dependency of historical planning practices, particularly those that restrict, or confine land uses to specific areas of the city (Twinam, Citation2018). Zoning change that allows redevelopment at higher densities is the primary tool for implementing consolidation policy in Australia (Gallagher et al., Citation2020), but there is little literature exploring the connection between existing urban layout and how it influences the practical implementation of rezoning, particularly at a parcel-level (Talen et al., Citation2016; Twinam, Citation2018).
Given the difficulties of successful densification, this paper questions the efficacy of rezoning as a means by which to achieve urban consolidation at the parcel-scale in Brisbane, Australia. We explore how the implementation of consolidation policies is influenced by the underlying morphology of streets, parcels, buildings, and land use. To achieve this, we use street, parcel, building and land use data over a 70-year period to understand if and how urban morphology has evolved in neighborhoods targeted for redevelopment at higher densities. Based on this empirical analysis, we conclude that blanket rezoning policies are unlikely to achieve significant densification outcomes without an understanding of morphological processes over time.
Background
Urban consolidation in practice
Urban consolidation seeks to limit the peripheral expansion of urban growth, often through strategies that target specific neighborhoods or parcels for increase in urban density. Urban consolidation instruments vary according to jurisdiction but can be broadly categorized into at least three mechanisms: the first mechanism is an urban growth boundary, defined through statute or policy, covering an entire metropolitan area. This delineates where new growth can occur. Examples include Toronto, Canada, where the Greenbelt Act 2005 sets the urban growth boundary and the Places to Grow Act 2005 outlines density targets (Xu, Citation2017), and Brisbane, Australia, where the South East Queensland (SEQ) Regional Plan, a regional planning instrument under the state of Queensland’s planning legislation (Planning Act, 2016 [Qld]), sets both the urban footprint and new dwelling targets by local government area. The second mechanism is through infrastructure policies, which encourage new development in existing urban areas by providing utilities, transport, social services, and other infrastructure (cf., Department of Transport and Main Roads [DTMR], Citation2021). The third mechanism is local land use regulations, generally at a building or neighborhood scale, which increase the allowable density of a site and facilitate the practical implementation of densification goals (Gallagher et al., Citation2019). Examples include the inclusion of mixed-use zoning to allow for conversion to residential use or rezoning existing residential areas to higher density (Grodach & Martin, Citation2021). This study focuses on Brisbane, Australia, a jurisdiction that has adopted all three mechanisms to contain new growth by densifying existing urban areas, implemented through the rezoning of specific parcels for higher density.
Influence of urban morphology on redevelopment
Before proposing change to urban form, it is fundamental to understand what exists. Urban morphology provides a framework to analyze a city’s physical form. It creates a system for analyzing the fundamental elements of a city’s physical structure (Scheer, Citation2001), specifically concentrating on evolution of street layouts, parcel boundaries, and buildings (Scheer, Citation2018). Urban morphology is strongly influenced by land tenure systems, including systems that protect private property rights (cf. section 51 of the Australian Constitution which inherently protects private property) and favor market-orientated land development, limiting the ability to alter existing morphology due to the difficulty of acquiring land (cf., Gallagher et al., Citation2019). Similarly, existing planning regulations that constrain redevelopment through stipulating requirements such as street widths, parcel size, dwelling types, setbacks, and site constraints including the physical ease of redevelopment, influence the ability to alter existing morphology (cf., Mustafa et al., Citation2018).
Historical street and parcel layouts have a strong influence on urban form. Previous research demonstrates that city blocks (adjoining parcels enclosed by the street network) influence the shape of parcels within them (Dovey et al., Citation2017; Siksna, Citation1998), and parcel boundaries shape the individual buildings onsite (Stell & Tait, Citation2016). Generally, developers work within existing property boundaries, which leads to local architectural characteristics (cf., Stell & Tait, Citation2016 for Scottish buildings shaped by medieval parcel boundaries). City blocks and parcels do change shape and size for changing development requirements (Siksna, Citation1998), but the preexisting urban layout influences the ability to adapt. In a study of North American and Australian cities, small blocks (approximately 60 meters by 80 meters) were found to be more adaptable to change than larger blocks (Siksna, Citation1997). Most urban morphology research has focused on historic urban centers, which generally evolved incrementally over time on a regular gridded layout, where land was subdivided and developed by individual owners (Sanders & Schroder, Citation2008; Scheer, Citation2001). In contrast, the limited research on morphological change of post–World War II developments demonstrates that these neighborhoods tend to be more fragmented and produced through instant growth processes. Southworth and Owens’ (Citation1993) preeminent paper studies California suburbs established in the early 20th century to the 1990s, showing that street networks constructed from the 1960s to 1990s were characterized by cul-de-sac and loop street patterns. During this period, parcel sizes changed more than street networks, increasing in street frontage, with more uniformly sized parcels with little spatial variety (Southworth & Owens, Citation1993). Rashid (Citation2018) reviewed the same neighborhoods 30 years after the Southworth and Owens’ (Citation1993) study to re-test the findings of the original research and found only minor changes to the street and land use patterns, with some instances of small-scale densification creating additional complexity to the urban form.
Parcel shape is important as it has a determinative impact on real estate value, with Asami and Niwa’s (Citation2008) study of Tokyo demonstrating that developers prefer rectangular-shaped parcels and that parcels tended to be rectangular shapes even when the blocks containing them were irregular in shape. Few studies comprehensively describe parcel layouts, despite parcels forming the basic element of cities (Bobkova et al., Citation2021; Scheer, Citation2018). A wide range of parcel measurements, including size and frontage, have been developed in existing urban morphology studies (cf., Kropf, Citation2017). Research suggests that having more parcels within a block increases the diversity of owners and uses (Marcus, Citation2010). The ability of the urban layout to adapt to changing conditions, including different requirements for land use, is related to the ability of parcels to amalgamate into bigger parcels or divide into smaller ones (Bobkova et al., Citation2017; Siksna, Citation1998; Vialard, Citation2012). Research suggests that when the shape of a parcel is close to a rectangle it is allows for possible subdivision and amalgamation as required (Vialard, Citation2012), and that parcel size and shape influences redevelopment outcomes more than density constraints (Gao & Asami, Citation2007). Small parcels also increase the level of adaptability of the function of the site, which is linked to urban vitality (Marcus, Citation2010). However, small parcels also present a constraint on urban transformation as they can be difficult to amalgamate into larger sites (Dovey et al., Citation2017; Gallagher et al., Citation2019).
Applying urban morphology to urban planning
There are clear benefits of considering existing urban morphology when implementing planning policy that seeks to influence urban form, as a city’s underlying spatial structure can have a significant influence on subsequent redevelopment (Bobkova et al., Citation2017; Gu, Citation2014). The great variation between categorical typologies (e.g., ways of classifying existing land uses), scales of analysis, and levels at which policy is implemented, produces a limited range of universally applicable principles for planners to apply across contexts, particularly when seeking to increase density through relatively simple instruments such as rezoning. In the Australian context, for example, consolidation-oriented plans are most often conceived by the subnational state and implemented by local governments.
The detail, and trajectory, of urban morphology is increasingly relevant to planning instruments which seek to increase urban density, particularly as new urban forms (e.g., high-rise buildings) require different scalar and spatial considerations than the land uses they often replace (e.g., low-rise workers’ cottages). However, the divide that exists between morphological research and planning design and practice is significant (Birkhamshaw & Whitehand, Citation2012). While many contemporary planning schemes incorporate urban design principles to regulate the physical form of the city, rather than simply prescribing land use (Talen, Citation2009), urban morphology studies are not readily undertaken prior to the introduction of new planning initiatives (Scheer, Citation2018). Form-based codes, embedded within planning schemes, are inherently morphological as they go beyond land use and seek to control aspects such as building height and setback from the street (Gu, Citation2014). Gu (Citation2014) posits that morphological analysis can be used to define the character of the local urban environment, and this analysis can be translated into localized prescriptive codes within planning schemes to guide new development into preferable forms, tailored to the specific location (cf., Kropf, Citation2017).
Approach to urban consolidation in Brisbane, Australia
Australia is one of the most suburbanized countries on Earth (Walters, Citation2021). Two out of three Australians live in a state capital city, and 72.3% live in a detached house (Australian Bureau of Statistics [ABS], Citation2021). The spatial distribution of Australian cities has also created a less pronounced suburban-urban divide than observed in countries such as the United States (Walks, Citation2013), with blurred boundaries between low- and high-density residential areas. Australia is also unique in that, while urban consolidation policy initially sought to repopulate declining inner-city areas, by the early 2000s Australian states introduced densification targets which applied broadly to entire metropolitan regions. The implementation of these policies is largely delegated to local governments (cf., DLGIP, 2017 for SEQ, DTPLI, 2014 for Melbourne and Greater Sydney Commission, Citation2018 for Sydney). As a result, under various statutory instruments, most new dwellings in Australia’s major cities must be sourced from existing urban areas (cf., Department of Local Government, Infrastructure and Planning [DLGIP], Citation2017; Department of Transport, Planning and Local Infrastructure [DTPLI], Citation2014). The implementation of consolidation strategies ranges from reducing parcel sizes to enable more detached houses to be constructed on smaller sites (Gallagher et al., Citation2021) to concentrating on higher density development in specific precincts (Gallagher et al., Citation2020), or, more commonly, a combination of both (cf., Brisbane City Council [BCC], Citation2021).
Unlike other major Australian cities, Brisbane has a unified local government, making it the largest local government area (LGA) in Australia, covering 1,342.7 km2. Originally occupied by First Nations people, notably the Jagera, Turrbal, and Quandamooka peoples, for at least 20,000 years, European arrival began when the British Colony of New South Wales established a penal settlement (1824–1842). Like many sunbelt cities, Brisbane’s population grew rapidly from 120,650 inhabitants in 1901 to 502,320 in 1954 (Australian Bureau of Statistics [ABS], Citation2019) to 1.2 million in 2021 (ABS, Citation2021), forming part of a larger metropolitan population of 2.5 million. New dwelling supply has historically been sourced through the construction of low-density and auto-centric peripheral suburbs. This urban growth has expanded into neighboring local government areas, with Brisbane being the most populous city at the center of SEQ, a sprawling conurbation that stretches some 200 kilometers north to south. Identifying the need to plan SEQ as a region, the Queensland Government created a framework for regional planning in 1997. The SEQ Regional Plan is a statutory instrument to guide growth and development in the 11 local government areas which form SEQ. Its three iterations (2005, 2009 and the current version introduced in 2017) delineate where new development can occur through regional growth boundaries and consolidation targets. Targets are measured through both zoned capacity and the number of new dwellings approved for construction.
The state government projects that Brisbane requires an additional 18,000 new dwellings each year, with 94% to be sourced from within the existing urban area (DLGIP, Citation2017). Practical implementation of the regional plan is largely the responsibility of the local government, and Brisbane City Council’s planning scheme has had two major revisions since the introduction of regional planning (2000 and 2014). To encourage densification, amendments to the planning scheme have included reducing parcel sizes for detached houses and encouraging increased density in specific precincts, generally in central locations or in proximity to mass transit (BCC, Citation2021). Understanding whether these existing planning strategies can achieve densification goals will not only be beneficial to the successful management of this city, but also provides valuable reference to other cities seeking to densify their existing urban area, particularly if their settlement patterns have historically been characterized by peripheral expansion.
Study context, data, and methods
Although urban morphology research has a long and rich tradition, there is no standard method that holds the greatest currency in the literature. Our work is inspired by Conzen (Citation1960), who developed and refined theories on urban morphology through a series of studies on British towns, by analyzing how streets, parcels, and buildings change over time (Conzen, Citation1960). Conzen (Citation1960) divided the urban landscape into (1) the ground plan of blocks, streets, and parcels, (2) the building fabric, and (3) the building use. The morphological frame contains the building fabric and pattern of use, and the interrelated nature of streets, parcels, and buildings are said to influence subsequent phases of development (Whitehand, Citation1981). These core concepts have been adopted and applied in numerous contemporary studies, including analyzing the relationship between street networks and socio-economic activity (Griffiths et al., Citation2010), using morphological coding of the urban elements for conservation planning (Gu, Citation2014) and analyzing how the pre-urban road and parcel fabric influences subsequent suburban growth patterns (Scheer, Citation2001). In this case, we adopt the scales of analysis utilized by Conzen (Citation1960) to measure changes to three basic elements of the city: (1) streets, (2) parcels, and (3) building footprints over a 70-year period. To compare the application of densification policies on redevelopment patterns in neighborhoods of varying morphologies, we analyzed measurements of street connectivity, property boundary change, historical and contemporary parcel area, parcel coverage, and land use conversion, discussed further below.
Study areas
Densification presents a particular challenge for Brisbane. Detached single-family houses have experienced little change as a proportion of total dwellings over the last 20 years, from 74.7% of all dwellings in 2001 to 62.6% in 2021 (ABS, Citation2001, Citation2021). We purposefully selected six study areas across the Brisbane LGA (see ) through a process that identified approximately 1 km2 of contiguous parcels targeted for densification by Brisbane City Council.
Figure 1. Study areas within the Brisbane local government area.
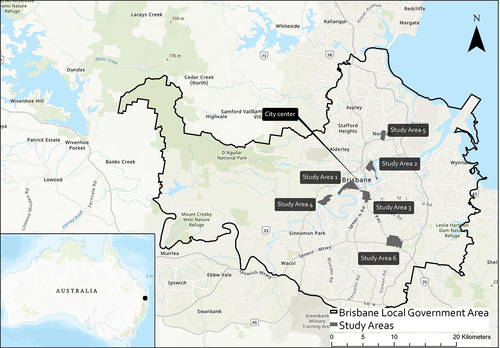
These parcels were rezoned between 1952 and 2021 to allow for redevelopment at higher density and were contemporaneously zoned (in 2021) for multiple dwelling use. Multiple dwelling is the term used by Brisbane City Council to describe premises that contain three or more dwellings (BCC, Citation2021), commonly referred to as multifamily housing in North America. Examples include apartments, flats, townhouses, and rowhouses. Zones that allow for multiple dwellings range from high-density residential (apartment buildings of up to 15 stories) to low-medium-density residential (dwellings of up to three stories including low-rise apartments and rowhouses). These zones have been overlaid onto different urban morphologies to encourage increases in urban density, including inner suburbs with a gridded street pattern (Study Areas 1 and 2), inner and middle suburbs that were initially laid out as grids but have been retrofitted for motorway and road widening projects and large drive-in shopping malls (Study Areas 3, 4, and 5), and suburbs built with motorways, curvilinear streets, and drive-in shopping malls at the outset (Study Area 6; see ).
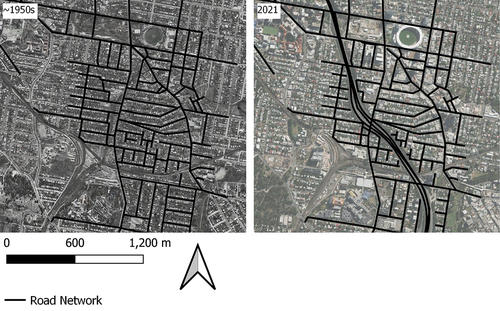
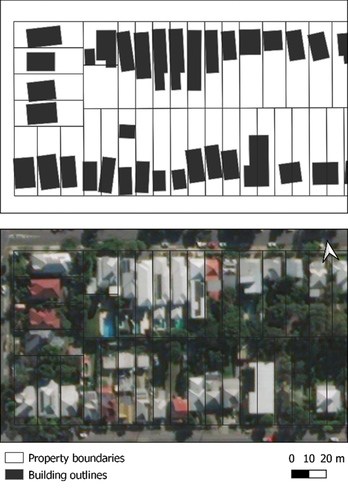
Figure 2. Example of street layout, parcels and building footprints in selected suburbs. (1) West End/South Brisbane, directly opposite the Brisbane city center, (2) Newstead/Teneriffe, adjacent to the Brisbane city center, (3) Woolloongabba, south of the Brisbane city center with a major motorway running through the center of the suburb, (4) Indooroopilly, retrofitted for a shopping center, (5) Nundah (Toombul), retrofitted for road widening and a shopping center, and (6) Upper Mount Gravatt, constructed post-WWII period for low density residential development around a preexisting motorway.
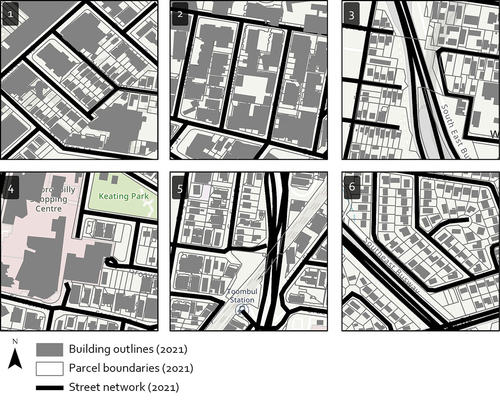
The selected study areas represent different street, parcel, and land use patterns due to their period of construction, but residential development was (initially) similarly characterized by the construction of single-family dwellings, representative of urban morphology more broadly across Brisbane.
Methods for analyzing urban transformation
Our methodology applies spatio-temporal analysis to better understand the impact of (re-)zoning on built form. To measure morphological change of three urban elements (street, parcel, and building footprints), we selected three time points in 1951, 1987, and 2021 for comparison. We analyze the impacts of changes to planning regulation, in the form of land use zoning, over these periods, and if (and how) urban morphology transformed. These dates were selected for numerous reasons. First, the 1950s provide the earliest zoning data (1952) for the city. Brisbane did not have a formal planning scheme until 1965 and instead relied on a zoning proposal periodically amended until 1952 for assessment of new development. Second, data from 1987 represents a mid-point between the earliest and latest datasets (2021) available at the time of writing. The late 1980s also provides a transitionary period for planning in Brisbane. The concepts of auto-centric and low-density suburban urban form had dominated Brisbane’s planning for at least 4 decades and the 1987 planning scheme contained densification around major transport and activity centers, as well as urban renewal programs aimed at the revitalization of inner-city areas. Finally, by 2021, consolidation policy had been in place for over 2 decades, providing time for development to respond to policy change.
To identify changes to urban morphology, we used a variety of historic cadastral (property boundary) maps, aerial imagery, and land use surveys, sourced from the Brisbane City Council and Queensland Government archives (Appendix 1). Three data sets were created for each timepoint in each study area: (1) centerlines of streets, (2) polygons of property parcels (including land use and zone attributes), and (3) polygons of building footprints. Street network data was created in ESRI ArcMap by generating centerlines through the polygons of streets in the 2021 cadastral dataset (the Queensland Government Digital Cadastral Database or DCDB). Digitized centerlines were overlaid on the 1946 and 1987 aerial photos and the 2021 imageries to create the street network data sets for the respective years. Property parcels in 2021 were sourced from the DCDB, and historical land parcel datasets for 1951 and 1987 were created by manually digitizing the 1951 Brisbane City Council Civic Survey maps, a cadastral map of land use, and the 1987 planning scheme, a cadastral map of applicable land use zoning (see ).
Figure 3. Creation of parcel and building footprint datasets, using Brisbane City Council’s 1951 civic survey and 1946 aerial image, and Brisbane City Council’s 1987 planning scheme and the Queensland Government’s 1987 aerial images.
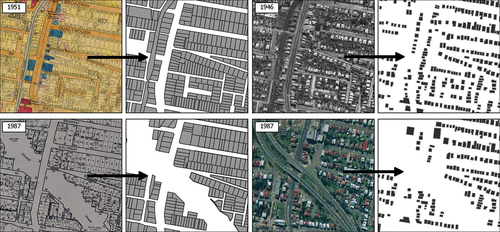
Using the land use classification in 1951 and 2021, and zoning in the relevant planning schemes in 1952, 1987, and 2021, we assigned a land use and zoning class to each parcel for the respective years. Land use was standardized across the timepoints to four types, including (1) house, (2) multiple dwelling (e.g., rowhouse, townhouse, or apartment building), (3) industrial or manufacturing (e.g., concrete batching plant, automotive repair, whitegoods repair), (4) commercial services (e.g., office buildings, retail), (5) special use (e.g., schools, hospitals, and other public services), and (6) conservation or recreation space (e.g., vegetation, sportsgrounds). This resulted in a dataset containing attributes of location, area (m2), land use and zoning for all parcels to the 2021 land parcel polygons, over the three timepoints. The building footprints data were digitized from 1946 and 1987 aerial photos and building footprints in 2021 were sourced from Bing Maps data (composite of multiple sources dated between 2013 and 2018) but manually edited using 2021 imagery to ensure the dataset was an accurate depiction of contemporary building footprints.
To analyze changes in urban morphology over time, we used a set of measures to quantify the three morphological elements—street network, parcel, and building footprints—at each timepoint (1951, 1987, and 2021). Street network measurements include street length, number of intersections, cul-de-sacs and external access points, and streets added or removed. These measurements collectively provide an understanding of how connected a neighborhood is. For instance, a higher ratio of intersections to cul-de-sacs within a study area indicates a higher level of connectivity. Parcel and building footprint measurements include parcel area and parcel site coverage (calculated by the percentage of a parcel covered by a building footprint). These measurements were calculated using the built-in tools in ESRI’s ArcGIS and were used to understand the influence of historical parcel area on development patterns, specifically, if there is a certain threshold size where parcels are more likely to experience a land use conversion to higher density development, whether parcels change shape to accommodate densification, and whether such changes are consistent with the applicable planning scheme, for example, where it seeks to limit building coverage to less than half of the parcel (e.g., BCC, Citation2021, table 9.3.14.3).
We also used a centroid alignment method developed by Frederickson et al. (Citation2016) and applied in Gallagher et al. (Citation2019) to analyze the property of boundary change of parcels. Using this method, we first converted the land parcels in 1951 to centroids and overlaid the centroids onto the parcel polygons in the later timepoints (1987 and 2021). If, for instance, a land parcel in 1987 contains only one parcel centroid in 1951, this would mean that there has been no property boundary change; if there are two or more 1951 centroids in a 1987 parcel polygon this would mean that the previous two land parcels have been amalgamated into one from 1951 to 1987; and if there is no 1951 centroid in a 1987 parcel polygon this would mean the adjacent parcel has been subdivided into two or more parcels in 1987, with only one of the subdivided parcels having a 1951 parcel centroid and the other newly created parcel/s having no 1951 parcel centroids. We also analyzed how parcels may have changed between 1987 and 2021 using this same process. Given that the centroid of a parcel changes if there is a change of its boundaries, it is possible to identify properties that have experienced a boundary change by checking if the centroid of the parcel has moved. Using this method, we can count the number of boundary change events, with each event representing one redevelopment, regardless of how many property parcels might be involved.
Our methods provide an understanding of how elements of street connectivity, parcel area, and building size, as well as historical land use and zoning, influence subsequent redevelopment. This includes whether certain land uses, or urban layouts, are more adaptable to a change that facilitates redevelopment. Examples include whether large, industrial parcels are more likely to experience parcel amalgamation for apartment-building construction when compared to houses on small parcel sizes (cf., Gallagher et al., Citation2019) or whether gridded streets are more adaptable to redevelopment than curvilinear street networks. By comparing study areas with different urban layouts (but the same contemporary high-density residential zoning), we can determine whether some urban morphologies are more amenable to densification compared to others, which, in turn, provides guidance to decision makers seeking to apply densification strategies to metropolitan areas with a varying internal morphology.
Results
Each of the six study areas experienced densification through rezoning, though the outcomes of this process were diverse and depended to a great extent on parcel size. Somewhat perversely, however, densification occurred despite a vast number of parcels being subdivided into smaller lots, indicating that densification was being delivered through further fragmentation of the cadaster and compressing single uses into smaller parcels. We find that, while the street network was generally stable over time and densification by 2021 was accompanied by a decrease in the number of buildings, building footprints were larger and covered a greater proportion of parcels.
Street network is stable, except for government-led motorway projects
Most study areas did not experience major change to their street networks over the seven decades. All study areas but one (Study Area 1) became less connected over time due to developments centered around cul-de-sacs and the removal or closure of streets. Connectivity was also influenced by the superimposition of new motorways or major roads over the preexisting gridded streets of one inner (Study Area 3) and one middle study area (Study Area 5; see ).
Figure 4. Ratio of intersection to cul-de-sac in each study area.
Study Area 1, directly across the river from Brisbane’s city center, was the most connected by 2021. It became more connected between 1951 and 2021 due to the addition of new streets as part of a government-led redevelopment of waterfront industrial land and wharves into residential, commercial, and recreation land.
The street network of Study Area 2 remained largely unchanged between 1951 and 2021, and Study Area 3 became less connected over time due to the construction of a major motorway, which separated the two sides of the suburb (see ).
Figure 5. Street network changes in Study Area 3 (1950s to 2021).
The same motorway runs through Study Area 6, the least connected and most distant study area. Study Area 6 was constructed between 1951 and 1987 around the motorway, rather than the urban morphology being retrofitted to accommodate it. The street network in the east of this study area is gridded and was laid out prior to WWII, whereas the western segments are postwar housing developments, with neighborhood units comprising internal cul-de-sacs bounded by arterial roads (see ). The street network length of Study Area 6 grew from 16.54 km in 1951 to 67.56 km in 2021.
Figure 6. Street network changes in Study Area 6 (1950s to 2021).
Subdivision for both residential and commercial development
We analyzed the property of boundary change between 1951 and 1987 and between 1987 and 2021. Across the study areas, 3,037 property boundary change events occurred between 1951 and 1987, and 4,979 property boundary changes between 1987 and 2021. Between 1951 and 2021, the number of individual property parcels grew from 8,916 in 1951 to 10,519 in 2021. Planning schemes in the immediate post–World War II period focused on low-density residential development and retrofitting existing gridded areas for the convenience of the car. Between 1951 and 1987, over 70.0% of the total number of property boundary changes occurred in the most distant study area from the city center (Study Area 6), with 2,122 subdivisions occurring in that study area alone. This result was due to large, undeveloped parcels being subdivided into parcels containing houses. Across all study areas, 70.4% of the subdivided parcels were zoned as Residential A in 1987, a zoning code that allows for the construction of a detached house. If the residential subdivision of Study Area 6 is excluded, the results show only 902 property boundary changes over the 36 years. With Study Area 6 excluded, the highest level of property boundary change was for properties zoned as Residential B (224 property boundary changes, with 154 subdivisions), followed by Warehouse and Transport (126 property boundary changes, with 102 being amalgamations) in 1987. In 1987, Residential B was the only zone that allowed for the construction of apartments and rowhouses. Nevertheless, across all study areas, most parcels were not affected by any property change between 1951 and 1987, with 55.8% of land parcels not having any change (rising to 67.1% if Study Area 6 is excluded).
The 1987 planning scheme introduced concepts of redeveloping declining inner-city areas, and, by 2021, the planning scheme across all study areas had permitted the construction of apartment buildings (with allowable building heights of four stories or more) for at least 20 years. A high number of subdivisions when compared to amalgamations continued in both 1951 to 1987 and 1987 to 2021 (see ), with most subdivisions occurring for residential use (66.1%), followed by commercial use (26.2%). Study Area 4 had the highest number of subdivisions during this period (1,169), with almost all subdivision occurring for residential use (1,098), followed by the inner study area of Study Area 1, where 563 out of 892 subdivisions (63.1%) were for commercial use. However, when considering land mass, subdivisions only affected 15.7% of the area, compared to 31.5% of land mass being affected by amalgamations. As such, a high level of subdivision affected a small amount of land mass.
Table 1. Property boundary change from 1987 to 2021.
Amalgamations between 1987 and 2021 occurred at similar levels for commercial (395 property boundary changes) and residential (432 property boundary changes) uses across all study areas. The highest levels of amalgamation occurred in the study areas immediately adjacent and opposite to Brisbane’s city center, with 139 out of 234 (59.4%) events for Study Area 1 and 134 out of 223 (60.1%) for Study Area 2 being amalgamations for commercial use. Most residential land that experienced a land use conversion was for the construction of multiple dwellings (64.7%), and this is further discussed below. Nevertheless, most land experienced no property boundary change (52.8% of land mass).
Reduction in mean parcel size for most uses except commercial services
The mean parcel size decreased over time across all study areas (see ). This was particularly evident in parcels containing industrial uses, with the mean size of an industrial parcel in three inner city study areas decreasing from 2,543.4 m2 in 1951 to 711.9 m2 in 2021. Parcels zoned for all residential uses generally increased in mean parcel size between 1952 and 1987, and this trend continued to 2021. This is largely due to the rezoning of former industrial sites with large parcel sizes for high-density residential development. All study areas except Study Area 6 had some properties zoned for apartment use in 1987, with the mean parcel size for parcels zoned for apartments ranging from 560.0 m2 (Study Area 1) to 4,978.2 m2 (Study Area 2). By 2021, the mean parcel size of a property zoned for apartment use grew significantly, with the large mean in Study Area 6 due to the rezoning of a site of over 35,000 m2, currently containing a retirement village (see ).
Table 2. Mean parcel sizes by year and by zoning.
Despite a general increase in residential parcel size, land zoned for house construction decreased in mean parcel size over this same period. There was an increase from 784.6 m2 in 1951 to 872.1 m2 in 1987, due to the low-density residential subdivision at Study Area 6, but the mean parcel size decreased to 732.7 m2 in 2021. Noting that by 2021, only the middle study areas contained parcels zoned for low-density residential use, as all inner-city study areas were zoned for higher density uses, except for parcels containing protected historical houses. Similarly, residential parcels containing a house decreased in area over time, with mean parcel sizes decreasing by an average of 217.9 m2 across all study areas, ranging from the highest mean parcel size of 656.5 m2 (Study Area 6), to the lowest of 372.8 m2 (Study Area 2). Parcels containing commercial services increased in size over time, with mean parcel sizes growing from a range of 352.3 m2 (Study Area 1) to 645.9 m2 (Study Area 4) in 1951, to 781.0 m2 (Study Area 2) to 5,507.0 m2 (Study Area 6) in 2021. This result is expected given that commercial services use in 1951 were largely limited to small parcels with shops and businesses, whereas contemporary commercial services range from office buildings to large suburban shopping malls.
Large number of parcels experiencing a land use conversion
Study Area 6, being the farthest from the city center, had the highest number of parcels that experienced a land use conversion between 1951 and 2021 (99.8% of parcels), as the study area was undeveloped in 1951. For this reason, we considered 1987 zoning as an indication of land use transitions following its development, and when comparing 1987 zoning to 2021 land use, 31.1% of parcels experienced a land use conversion. In Study Area 6, 2,408 parcels were in a 1987 zone that only allowed for low-density house construction (95.9% of the study area’s total number of parcels). This includes 526 of the 571 parcels (92.1%) that contained multiple dwellings in 2021. The conversion from houses to multiple dwellings was the most common land use conversion between 1987 and 2021 in this study area. However, when compared to other study areas, Study Area 6 had the most stable land use, retaining a high proportion of low-density residential parcels.
In comparison, most other study areas experienced a land use conversion ranging from 51.2% (Study Area 3) to 79.9% (Study Area 5) of parcels (see ).
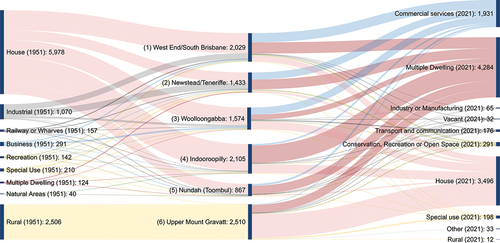
Figure 7. Land use transitions for individual parcels. These are conversions based on a count of parcels at 2021 property boundaries.
The most common land use conversions resulted in multiple dwellings or commercial services. In Study Area 1, the most common conversion was from houses to multiple dwellings (539 parcels), followed by conversion from houses to commercial services (422 parcels) and industrial use to multiple dwellings (202 parcels). Similarly, in Study Areas 4 and 5, the most common conversion was houses to multiple dwellings (1,152 and 526 parcels, respectively). In the study area adjacent to the city center (Study Area 2) the most common conversions were houses to commercial services (354 parcels), followed by houses to multiple dwellings (286 parcels) and industry (265 parcels), whereas in other remaining inner study area (Study Area 3) commercial services formed the highest number of conversions, most commonly from houses (273 parcels).
Parcels that did not experience a land use conversion commonly contained houses, even though they were zoned for higher density development. The most prevalent zoning for parcels containing houses across all study areas was medium density residential (20.9% of parcels), followed by low-density residential (12.1% of parcels). The low-density residential zoning applied to 1,271 parcels, almost all (1,193 parcels) located in Study Area 6. For parcels that contained a house in 1951 and a house in 2021, indicating no land use change, just 7.4% of parcels were in a zone that did not allow for some form of high-density or infill development. The most common zoning for these parcels was Character Residential (Infill Housing), which allows for multiple dwellings but must incorporate any house built before 1946 (47.6% of parcels containing houses), followed by low-medium density residential (23.0% of parcels containing houses), which also allows for multiple dwellings (see, BCC, Citation2021).
Fewer buildings, but larger building footprints
Between 1951 and 2021, in the inner-city study areas, the number of buildings decreased by 51.9% (Study Area 1), 49.3% (Study Area 2), and 42.8% (Study Area 3). These are all areas experiencing conversion from workers’ cottages and industry to higher density commercial and residential land uses, and the reduction in structures is due to the demolition of buildings constructed before 1946, mostly residential houses. The middle study area (Study Area 5) experienced very little change in the number of buildings, experiencing slight increases over time, whereas Study Area 6 had a substantial increase in buildings between 1946 and 1987, due to the development of suburban housing estates during this period, but the number of buildings remained relatively constant between 1987 and 2021 (see ).
Table 3. Number of building footprints, indicating number of buildings (1946, 1987, and 2021).
In terms of building footprints, however, the total area covered by buildings substantially increased over time. Building coverage grew from a total of 1.4 km2 in 1946, to 2.8 km2 in 1987 to 3.0 km2 in 2021. The largest increase between 1946 and 1987 was due to the construction of Study Area 6, which had previously had very little building coverage. The largest increases in building coverage between 1987 and 2021 were in the middle suburbs, with increases of 35.6% (Study Area 5), and 42.1% (Study Area 4). The inner study areas experienced building coverage increases ranging from 10.5% (Study Area 1) to 20.1% (Study Area 2). Increasing building coverage is a predictable result from densification, both because denser buildings (such as high-rise apartments) generally require larger footprints, as well as because an increase in dwellings through the subdivision of undeveloped sites (ranging from large rural properties to an individual backyard) for additional dwelling construction creates more coverage by buildings. The mean size of a building footprint of parcels containing houses also increased from 155.0 m2 in 1946 to 185.0 m2 in 2021, contributing to increases in site coverage (see ).
Figure 8. Building footprints in 1946, 1987, and 2021.
The mean site coverage for all parcels (across all study areas and land uses) increased from 15.9% in 1951, to 26.5% in 1987 and, finally, to 43.0% in 2021. For residential parcels, this increased from 24.2% in 1951, 27.0% in 1987 to 46.3% in 2021. In fact, for parcels in the high-density residential zone (up to 15 stories), the mean site coverage was 92.0% of the parcel, significantly higher than the other zones that allow for multiple dwellings, which includes a mean site coverage of 46.1% for medium density zones (up to five stories) and 55.2% in the other high-density zones (up to eight stories). The three inner city study areas had the highest mean site coverage for apartment buildings, being 65.4% (Study Area 1), 55.5% (Study Area 2), and 55.0% (Study Area 3). For parcels containing houses, the mean site coverage grew from 20.7% in 1951 to 48.2% of the parcel in 2021. This is particularly evident in study areas that contain a mix of older (built before 1946) and contemporary houses, as the site coverage of new-build houses is considerably higher than older houses (see ).
Figure 9. Character residential zone located five kilometers from Brisbane’s city center. New build houses can be seen to the north covering the entire parcel, and older houses to the south, covering 30–50% of the parcel.
Discussion
Less connectivity thwarts densification plans
The lowest rates of morphological change, measured by parcel boundary change and land use conversion, were in the study areas with the least connected street networks, being Study Area 3 (inner city) and Study Area 6 (farthest study area from the city center). In Study Area 3 the Southeast Freeway imposed over the existing grid, effectively separating the east and west of the suburb. Study Area 6 developed around the motorway. We contend that this piece of infrastructure makes densification of these neighborhoods less feasible. Street networks are extremely resistant to change, surviving for centuries, and require enormous social power to alter (Bosselmann, Citation2008). Large-scale disruption of street networks often requires acts of overt, top-down power and can fundamentally alter the urban fabric of a neighborhood (Scheer, Citation2020).
Despite Brisbane City Council’s 2000 planning scheme designating the study areas as centers for higher density and mixed uses, Study Area 6 has experienced comparatively lower levels of densification (Wilson, Citation1999). The results indicate that some neighborhoods are more amenable to redevelopment than others, particularly those with gridded street networks. Planners have sought to remedy the faults of the sprawling city by returning to the dense and diverse urbanity of traditional urban environments, yet the suburban conurbations of most cities in the developed world are much larger than the gridded pattern of their city centers (cf., Conzen, Citation2004). Our findings highlight the need to consider morphology when applying generalized consolidation targets. Zoning alone may not be enough to catalyze redevelopment of suburbs comprising disconnected and curvilinear street networks, and investment in replicating the integration of older neighborhoods may be required if these areas are to be both desirable and practical locations for increased urban density.
Unevenly distributed density leads to houses and high-rises, and little in-between
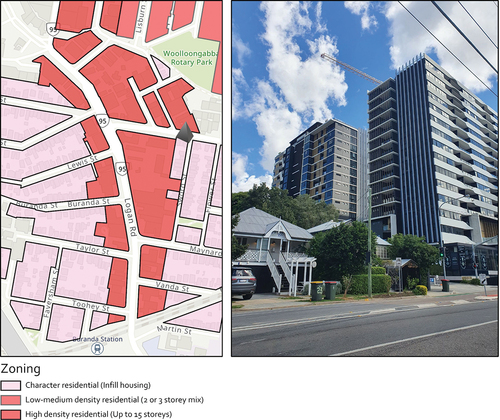
Protections on character homes, and successful community campaigns against rezoning for higher density, have meant that higher density buildings in Brisbane are highly concentrated in specific precincts, but often adjacent to low-density areas. A character house in Brisbane is defined as a dwelling constructed before 1946 and identified in the planning scheme (BCC, Citation2021). Many cities around the world have planning policies incorporating character protections of certain dwellings or precincts, with policymakers grappling with balancing the desire to retain these areas with the need to address housing pressures (and, in some cities, rising maintenance costs of older buildings) and accommodate new growth. A house constructed prior to 1946 cannot be demolished unless “structurally unsound” (BCC, Citation2021, para 8.2.21). Of the land mass zoned as Character Residential in 2021, most inner-city parcels allow the construction of multiple dwellings if the development retains the original single-family house and is of a similar scale. However, our results show that most parcels containing character houses contain only houses in 2021, potentially due to contemporary renovations significantly increasing the building footprints of these houses, leaving little space for additional dwellings. In some study areas, this means parcels requiring character protections are adjacent to parcels zoned for high-density residential, creating a streetscape where houses share fences with high-rises. This is particularly pronounced in Study Area 3, which had some of the lowest land use conversions (see ). These findings are bolstered by recent Australian Census results for the suburb of Woolloongabba (which includes Study Area 3), showing that the number of single-family houses has remained stable for the last 20 years, decreasing from 1062 in 2001 to 1023 in 2021. At the same time, the number of dwellings classified as apartments increased from 523 to 2382 (ABS, Citation2021).
Figure 10. 2021 zoning in Study Area 3, which allows 15-story buildings adjacent to character housing, and the resulting built form.
Policy which seeks to preserve neighborhood character ignores the very dramatic change of ever-increasing property prices (Monkkonen, Citation2019), linked to land values, and separates these areas from the rest of the city where change is encouraged (Gabbe, Citation2018). The fundamental goal of strict zoning controls is to restrict development to a certain type of dwelling (Glaeser & Ward, Citation2009; Mayer & Somerville, Citation2000) and this has successfully reduced home construction across multiple jurisdictions (Glaeser et al., Citation2006; Mayer & Somerville, Citation2000; Pendall, Citation2000). In sum, jurisdictions with more land use regulations construct less multifamily housing (Glaeser & Ward, Citation2009), and our results demonstrate that this also applies on a parcel-specific scale.
Increasing the supply of housing in proximity to existing employment and transport opportunities provides numerous benefits to a city, and the high-rise apartment building plays a crucial role in delivering new housing supply. However, poor design of private buildings has a direct impact on the quality of the surrounding public realm (Gehl, Citation2010). Previous research shows that site coverage in Australian high-rise developments is significantly higher than those allowed in other jurisdictions, including Hong Kong, New York, and Vancouver (Hodyl, Citation2015). Our results support these findings by demonstrating that new apartment buildings cover almost the entire parcel in some areas, even when planning controls seek to restrict site coverage to 40% (BCC, Citation2021, table 9.3.14.3).
Despite widespread reporting of a housing crisis in Australia, and huge housing supply demand (Halter, Citation2022), there is poor uptake of the opportunities presented by changes to land use zoning which facilitate higher density development. The Brisbane LGA has sufficient zoned supply to cater for projected housing demand for the next 15 years, but the city fails to meet the state government benchmark of 4 years of housing supply, measured by the number of new dwellings approved for construction (Queensland Government, Citation2021). Put simply, the city is zoning sufficient land for new housing, but this is not translating into new construction, despite huge demand in the Australian property market. A lack of housing typologies in between high-rises and houses is also reflective of the low levels of medium density development in Australia’s largest cities. In fact, the proportion of semi-detached dwellings decreased in the last 20 years, from 13.1% in 2001 to 12.6% in 2021 (ABS, Citation2001, Citation2021), due to urban transformation largely driven by private market forces (Limb & Grodach, Citation2020) and zoning (Newton et al., Citation2022). Medium density dwellings suit the needs of several household compositions, including families with children, aging residents, and single person households, and this is acknowledged by state governments emphasizing the need to increase the production of these housing typologies (cf., DLGIP, Citation2017). However, this position is often not reflected in local government zoning policies (Gallagher et al., Citation2020).
Instead of distributing density across all well-serviced neighborhoods, particularly medium density such as rowhouses and walk-up apartments, density is highly concentrated in specific, easily developed precincts, often surrounded by low-density residential areas. Previous research in Brisbane (Gallagher et al., Citation2019) highlights the difficulty of acquiring parcels of a sufficient size for higher density development. While planning instruments may encourage developers to acquire and amalgamate adjacent parcels (often through density bonuses for larger sites), the difficulty of acquisition presents a major barrier to densification. As a result, most high-density development occurs on former industrial properties, which are more easily developed as they are large sites under single ownership (Gallagher et al., Citation2019).
Conclusion
Through comparative analysis of morphological change of six case study sites, we find that conversion for new land uses was prevalent with commercial developments, but that residential developments most often followed a path-dependent trajectory in which parcels were subdivided for intensification rather than amalgamated for consolidation. To a large extent, this is guided by the morphology of street grids and parcel shapes. The findings highlight how some neighborhoods are more amenable to the morphological change required to absorb new dwelling growth when compared to others. In theory, plenty of land exists for medium- and high-density precinct development. However, in practice, a street network characterized by wide and poorly connected streets, along with local zoning conventions that protect certain low-density dwellings, is difficult to adapt without significant disruption to existing urban morphology. This is often encountered with opposition from community members and requires careful consideration in terms of how to transition away from in-built elements of suburbia such as density restrictions, setbacks, street frontage requirements, and infrastructures more appropriate for low-density environments (e.g., street parking). Our findings highlight the need for policymakers to investigate creative means of densification in cities whose development trajectories were primarily auto-centric and low-density. This potentially includes flexibility in parcel size, including micro-lot housing, and the use of accessory dwelling units.
The methods utilized in this study are limited to identifying large-scale parcel boundary changes (e.g., amalgamation or subdivision) and residential land use changes categorized as a house or multiple dwelling. Opportunities for further research include a more detailed investigation into the different densification outcomes of redevelopments resulting in multiple dwelling construction, as well as the influence of parcel shapes, noting that older neighborhoods generally have smaller street frontages and more rectangular parcel shapes when compared to newer developments. Developing an understanding of how parcel shape influences redevelopment outcomes will provide crucial information to guide governments when approving new subdivision schemes, to ensure new development is fit for both existing and future development.
Acknowledgments
We would like to thank the anonymous reviewers for their advice and feedback on this paper.
Disclosure statement
No potential conflict of interest was reported by the author(s).
Additional information
Notes on contributors
Rachel Gallagher
Rachel Gallagher is a PhD candidate at the University of Queensland. Her research interests include how cities adapt their urban form to changing conditions and how urban policy influences (or fails to influence) desired settlement patterns.
Thomas Sigler
Thomas Sigler is an urban and economic geographer at the University of Queensland. His primary research area is economic and social transformations and cities that have resulted from global processes.
Yan Liu
Yan Liu is a quantitative human geographer and spatial data scientist at the University of Queensland. Her work specializes in urban studies, GIS, spatial (big) data analytics and complex systems modeling.
References
- Asami, Y., & Niwa, Y. (2008). Typical lots for detached houses and lot shape analysis. Regional Science and Urban Economics, 38(5), 424–437. https://doi.org/10.1016/j.regsciurbeco.2008.05.007
- Australian Bureau of Statistics. (2001). Brisbane – 2001 census all persons quickStats. Australian Government. https://www.abs.gov.au/census/find-census-data/quickstats/2001/LGA31000
- Australian Bureau of Statistics. (2019). Historical population. Australian Government. https://www.abs.gov.au/statistics/people/population/historical-population/latest-release
- Australian Bureau of Statistics. (2021). Brisbane - 2021 census all persons quickstats. Australian Government. https://www.abs.gov.au/census/find-census-data/quickstats/2021/LGA31000
- Birkhamshaw, A., & Whitehand, J. (2012). Conzenian urban morphology and the character areas of planners and residents. Urban Design International, 17(1), 4–17. https://doi.org/10.1057/udi.2011.22
- Bobkova, E., Berghauser Pont, M., & Marcus, L. (2021). Towards analytical typologies of plot systems: Quantitative profile of five European cities. Environment and Planning B: Urban Analytics and City Science, 48(4), 604–620. https://doi.org/10.1177/2399808319880902
- Bobkova, E., Marcus, L., & Berghauser Pont, M. (2017). Multivariable measures of plot systems: Describing the potential link between urban diversity and spatial form based on the spatial capacity concept. In The proceedings of the 11th space syntax symposium (pp. 1–47). Instituto Superior Técnico.
- Bosselmann, P. (2008). Urban transformation: Understanding city design and form. Island Press.
- Brisbane City Council. (2021). City plan 2014. https://cityplan.brisbane.qld.gov.au/eplan/
- Conzen, M. R. G. (1960). Alnwick, Northumberland: A study in town-plan analysis (The Institute of British Geographers Publication No. 27). George Philip & Son Ltd.
- Conzen, M. R. G. (2004). Urban morphology: A geographical approach. In M. P. Conzen (Ed.), Thinking about urban form: Papers on urban morphology, 1932-1998 (pp. 47–59). Peter Lang.
- Department of Local Government, Infrastructure and Planning. (2017). ShapingSEQ: South East Queensland regional plan 2017. Queensland Government. https://dilgpprd.blob.core.windows.net/general/shapingseq.pdf
- Department of Transport and Main Roads. (2021). About transit orientated developments. Queensland Government. https://www.tmr.qld.gov.au/Community-and-environment/Planning-and-development/Transit-oriented-developments/About-transit-oriented-developments
- Department of Transport, Planning and Local Infrastructure. (2014). Plan Melbourne metropolitan strategy 2050. Victorian Government. http://www.planmelbourne.vic.gov.au/Plan-Melbourne
- Dovey, K., Pike, L., & Woodcock, I. (2017). Incremental urban intensification: Transit-oriented re-development of small-lot corridors. Urban Policy and Research, 35(3), 261–274. https://doi.org/10.1080/08111146.2016.1252324
- Frederickson, C., Fergusson, E., & Wildish, B. (2016). Residential property amalgamation and aggregation in Auckland 2004–2014. Auckland Council.
- Gabbe, C. J. (2018). Why are regulations changed? A parcel analysis of upzoning in Los Angeles. Journal of Planning Education and Research, 38(3), 289–300. https://doi.org/10.1177/0739456X17696034
- Gallagher, R., Liu, Y., & Sigler, T. (2019). Parcel amalgamation as a mechanism for achieving urban consolidation through densification: The fixity of property boundaries over time. Land Use Policy, 89, 104239–104250. https://doi.org/10.1016/j.landusepol.2019.104239
- Gallagher, R., Sigler, T., & Liu, Y. (2020). Targeted urban consolidation or ad hoc redevelopment? The influence of cadastral structure and change on the urban form of Brisbane, Australia. Urban Geography, 41(2), 183–204. https://doi.org/10.1080/02723638.2019.1663058
- Gallagher, R., Sigler, T., & Liu, Y. (2021). Protect the Brisbane backyard! (Except from subdivision for additional house construction). Australian Planner, 56(4), 278–289.
- Gao, X., & Asami, Y. (2007). Influence of lot size and shape on redevelopment projects. Land Use Policy, 24(1), 212–222. https://doi.org/10.1016/j.landusepol.2005.06.001
- Gehl, J. (2010). Cities for people. Island Press.
- Glaeser, E., Schuetz, J., & Ward, B. (2006). Regulation and the rise of housing prices in Greater Boston. Rappaport Institute for Greater Boston, Harvard University and Pioneer Institute for Public Policy Research.
- Glaeser, E., & Ward, B. (2009). The causes and consequences of land use regulation: Evidence from Greater Boston. Journal of Urban Economics, 65(3), 265–278. https://doi.org/10.1016/j.jue.2008.06.003
- Greater Sydney Commission. (2018). A metropolis of three cities. NSW Government. https://gsc-public-1.s3-ap-southeast-2.amazonaws.com/s3fs-public/greater-sydney-region-plan-0618_0.pdf?SsIsd8gyH4.nrDDg3eZ3PlOBWzWnC3CV
- Griffiths, S., Jones, C., Vaughan, L., & Haklay, M. (2010). The persistence of suburban centers in greater London: Combining Conzenian and space syntax approaches. Urban Morphology, 14(2), 85–99. https://doi.org/10.51347/jum.v14i2.3955
- Grodach, C., & Martin, D. (2021). Zoning in on urban manufacturing: Industry location and change among low-tech, high-touch industries in Melbourne, Australia. Urban Geography, 42(4), 458–480. https://doi.org/10.1080/02723638.2020.1723329
- Gu, K. (2014). From urban landscape units to morphological coding: Exploring an alternative approach to zoning in Auckland, New Zealand. Urban Design International, 19(2), 159–174. https://doi.org/10.1057/udi.2013.21
- Halter, A. (2022). Australia’s housing market faces major supply crunch. Canberra Weekly. https://canberraweekly.com.au/australias-housing-market-faces-major-supply-crunch/
- Hodyl, L. (2015). To investigate planning policies that deliver positive social outcomes in hyper-dense, high-rise residential environments (Report by 2014 Churchill Fellow). Winston Churchill Memorial Trust of Australia.
- Johnson, L. (2010). Master planned estates: Pariah or panacea? Urban Policy and Research, 28(4), 375–390. https://doi.org/10.1080/08111146.2010.532475
- Kropf, K. (2017). The handbook of urban morphology. Wiley.
- Limb, M., & Grodach, C. (2020). Compact city reset: Toward alternatives to market-driven density. Urban Policy and Research, 38(4), 287–290. https://doi.org/10.1080/08111146.2020.1827543
- Marcus, L. (2010). Spatial capital. Journal of Space Syntax, 1(1), 30–40.
- Mayer, C. J., & Somerville, C. T. (2000). Land use regulation and new construction. Regional and Urban Economics, 30(6), 639–662. https://doi.org/10.1016/S0166-0462(00)00055-7
- Monkkonen, P. (2019). The elephant in the zoning code: Single family zoning in the housing supply discussion. Housing Policy Debate, 29(1), 41–43. https://doi.org/10.1080/10511482.2018.1506392
- Mustafa, A., Van Rompaey, A., Cools, M., Saadi, I., & Teller, J. (2018). Addressing the determinants of built-up extension and densification processes at the regional scale. Urban Studies, 55(15), 3279–3298. https://doi.org/10.1177/0042098017749176
- Newton, P., Newman, P., Glackin, S., & Thomson, G. (2022). Greening the greyfields: New models for regenerating the middle suburbs of low-density cities. Springer.
- Pendall, R. (2000). Local land use regulation and the chain of exclusion. Journal of the American Planning Association, 66(2), 125–142. https://doi.org/10.1080/01944360008976094
- Queensland Government. (2021). ShapingSEQ: Land supply and development monitoring report: 2021 results. https://dsdmipprd.blob.core.windows.net/general/media/LSDM_2021_SEQ_LGA_SummaryResults.pdf
- Rashid, M. (2018). The evolving metropolis after three decades: A study of community, neighborhood and street form at the urban edge. Journal of Urban Design, 23(5), 624–653. https://doi.org/10.1080/13574809.2018.1429216
- Sanders, P., & Schroder, N. (2008). The genealogy of urban form: Brisbane case study. In R. Kennedy (Ed.), Conference Papers: Proceedings of The Subtropical Cities 2008, Brisbane - From fault-line to sight-line - subtropical urbanism in 20-20 (pp. 1–10). The Centre for Subtropical Design.
- Scheer, B. (2001). The anatomy of sprawl. Places, 14(2), 28–37. https://placesjournal.org/assets/legacy/pdfs/the-anatomy-of-sprawl.pdf
- Scheer, B. (2018). Towards a minimalist definition of the plot. Urban Morphology, 22, 162–163. http://www.urbanform.org/online_public/2018_2.shtml
- Scheer, B. (2020). Historic infrastructure left behind: Should urban planners protect streets and blocks? Journal of the American Planning Association, 86(1), 3–10.
- Searle, G., & Filion, P. (2011). Planning context and urban intensification outcomes: Sydney versus Toronto. Urban Studies, 48(7), 1419–1438. https://doi.org/10.1177/0042098010375995
- Siksna, A. (1997). The effects of block size and form in North American and Australian city centers. Urban Morphology, 1(1), 19–33. https://doi.org/10.51347/jum.v1i1.4048
- Siksna, A. (1998). City center blocks and their evolution: A comparative study of eight American and Australian CBDs. Journal of Urban Design, 3(3), 253–283. https://doi.org/10.1080/13574809808724429
- Siodla, J. (2017). Clean slate: Land-use changes in San Francisco after the 1906 disaster. Explorations in Economic History, 65, 1–16. https://doi.org/10.1016/j.eeh.2017.04.001
- Southworth, M., & Owens, P. M. (1993). The evolving metropolis: Studies of community, neighborhood, and street form at the urban edge. Journal of the American Planning Association, 59(3), 271–287. https://doi.org/10.1080/01944369308975880
- Stell, G., & Tait, R. (2016). Framework and form: Burgage plots, street lines and domestic architecture in early Scotland. Urban History, 43(1), 2–27. https://doi.org/10.1017/S0963926814000789
- Talen, E. (2009). Design by the rules: The historical underpinnings of form based codes. Journal of the American Planning Association, 75(2), 1–17. https://doi.org/10.1080/01944360802686662
- Talen, E., Anselin, L., Lee, S., & Koschinsky, J. (2016). Looking for logic: The zoning—land use mismatch. Landscape and Urban Planning, 152, 27–38. https://doi.org/10.1016/j.landurbplan.2016.04.002
- Twinam, T. (2018). The long-run impact of zoning: Institutional hysteresis and durable capital in Seattle, 1920–2015. Regional Science and Urban Economics, 73, 155–169. https://doi.org/10.1016/j.regsciurbeco.2018.08.004
- Vialard, A. (2012). Measures of the fit between street network, urban blocks and building footprints. Proceedings from the Eighth International Space Syntax Symposium, 8101:1–8101: 17. http://sss8.cl/8101.pdf
- Walks, A. (2013). Suburbanism as a way of life, slight return. Urban Studies, 50(8), 1471–1488. https://doi.org/10.1177/0042098012462610
- Walters, P. (2021). The vanishing suburban dream in Australia. The Planning Review, 57(3), 4–21. https://doi.org/10.1080/02513625.2021.2026646
- Wheeler, S. M. (2015). Built landscapes of metropolitan regions: An international typology. Journal of the American Planning Association, 81(3), 167–190. https://doi.org/10.1080/01944363.2015.1081567
- Whitehand, J. W. R. (Ed.). (1981). The urban landscape: Historical development and management – Papers by M. R. G. Conzen. Academic Press.
- Wilson, B. (1999, February 26). PCA helped develop new town plan. The Courier Mail.
- Xu, J. (2017). Is New Urbanism changing the suburban development pattern? A case study of the Toronto region. Journal of Urban Design, 22(6), 812–832. https://doi.org/10.1080/13574809.2017.1337494