
ABSTRACT
Why do urban development projects take a long time to complete? This question is of paramount importance, both practically and academically. Practically, understanding the reasons for delays in these projects can help improve project efficiency, reduce costs, and enhance stakeholder satisfaction. Academically, the study contributes to the field of urbanization by applying social network analysis (SNA) to explore the interactions and relationships among decision-makers in urban development projects. This study draws upon original data from a road extension project in Kristiansand to illustrate and explain why the implementation of large development projects suffers from convoluted and slow decision-making processes after an overall agreement on project aims and goals has been established. This study draws on a sample of 33 actors who participated in the decisions concerning the project. I collected the data through a combination of interviews and document reviews and subsequently analyzed them using social network structural metrics and visualization techniques. The results show that the actors are connected in less dense, more centralized, and clustered networks with subgroups and low reciprocity which have hampered efficient communication, resulting in delays. The findings imply that the pattern of relationships among decision-making actors can affect the amount of time taken to reach conclusions in urban development initiatives.
Introduction
Urban development projects are complex endeavors involving diverse stakeholders with varied interests and perspectives (H. Wang et al., Citation2021). In these projects, decision making processes are often time consuming and challenging, and the extended duration of these processes remains a prevalent research topic (Coffé & Geys, Citation2005; Hays, Citation2015; Rice, Citation2001). Nonetheless, the factors contributing to this prolonged duration are still poorly understood. A likely, yet difficult-to-measure factor is the complex structure of the relationships among the actors involved. To probe this “black box” of unexplained relationships, this study employs social network analysis (SNA). The choice of SNA as the methodological framework for this study is driven by its robust analytical capabilities in mapping and measuring the complexities of social relations (Borgatti et al., Citation2018; Wasserman & Faust, Citation1994). SNA offers a systematic approach to uncovering the patterns, structures, and impacts of these relations on the decision-making process, which are otherwise difficult to discern. This study proposes that an exploration of social networks and relationships among decision-makers in these projects can offer valuable insights into the underlying reasons for these delays.
Networks serve as conduits through which information flows, influences are exerted, and decisions are shaped. Although research has explored the connection between network characteristics and decision-making at the organizational level (Burt, Citation2000, Citation2005; Granovetter, Citation1973; Henttonen et al., Citation2013), very few studies have applied these methods to local decision-making processes (Henttonen et al., Citation2013; Neal et al., Citation2021; Schilke et al., Citation2021; Urena et al., Citation2019; Uzzi, Citation1997). The current study extends this conversation by presenting new empirical insights from the context of urban development projects using a case study of social networks among decision-makers in a Norwegian municipality. I used the Gartnerløkka road expansion project, a case based in the southern Norwegian city of Kristiansand, to show how interactions and formal and informal relations among policymakers shape the speed of local decision-making processes. The study also considers the real-world implications of extended decision-making processes in urban development projects. For instance, delays in decision-making can lead to significant economic costs, hinder timely project implementation, and potentially result in missed opportunities for community development (Anh et al., Citation2023; He et al., Citation2023; Jussila & Lähtinen, Citation2020). Understanding these practical implications is imperative for enhancing the efficiency and effectiveness of decision-making processes in urban development (Hannibal et al., Citation2022). Decision-makers in urban development projects are not isolated entities. Rather, they operate within networked environments where formal and informal ties can significantly impact the flow of information, collaboration, and ultimately, the pace at which decisions are made. This context calls for studies that can inform strategies for mitigating delays and improving the overall success of urban development initiatives.
By investigating the dynamics of social relations and their influence on decision-making processes, this study examines how networks contribute to delays, how the process is affected by informal ties among involved actors, and whether and how informal networks (clusters) influence information sharing in this context. To understand why this project (and perhaps other urban development projects) drag on so long, the study employs SNA to analyze two separate network structures (meeting network and information-sharing network) among the actors and ascertain the impact of these structures on the length of time taken to reach decisions during the project.
Literature review
Urban development projects are complex and often involve multiple stakeholders, including government agencies, private developers, community groups, and local residents (Anh et al., Citation2023; Rivera et al., Citation2020; H. Wang et al., Citation2021). Due to the involvement of these many actors, such projects often take a substantial amount of time and effort to reach agreements on important decisions (Parés et al., Citation2012). Consequently, decision-makers face challenges in determining the best course of action, which further delays implementation (Booher & Innes, Citation2002; He et al., Citation2023). Studies have found several reasons accounting for these delays: the complexity of the regulatory environment (Jussila & Lähtinen, Citation2020; Muller & Peres, Citation2019; Yamaki, Citation2017; Yanchenko & Sengupta, Citation2023), the involvement of multiple stakeholders with conflicting interests (Feinberg et al., Citation2023; Hays, Citation2015; Jackson, Citation2019; Rivera et al., Citation2020), and challenges associated with public engagement and consultations (Parés et al., Citation2012). Other studies have shown that insufficient funding (Zhu, Citation2022), political interference (Collins & Del Rey, Citation2022; Rivera et al., Citation2020; Van Eijk, Citation2014; Xu & Lin, Citation2019), and technical complexity (Hays, Citation2015; Rice, Citation2001; Steiniger et al., Citation2016) are associated with project delays. Although the literature has illuminated the factors that contribute to delays in decision-making in urban development projects, there is limited knowledge on how these processes are affected by the social relationships of the actors involved.
SNA involves a set of techniques for studying the patterns of relationships within a group. Network characteristics such as diameter, mean distance, density, reciprocity, centralization, transitivity, and clustering can help decipher flows of information, influence, and power (Burt, Citation2000, Citation2005; Granovetter, Citation1973). Previous studies have employed these measures to study decision-making processes. For instance, Parés et al. (Citation2012) examined the role of communication networks in decision-making during urban regeneration projects; they found that more centralized and dense networks are associated with more effective decision-making, while more modular networks are associated with less effective decision-making. Kim et al. (Citation2019) applied network analysis to investigate the factors influencing the success of urban regeneration projects in Jangwi, South Korea; their study revealed that higher levels of reciprocity in the communication network are associated with more successful outcomes.
On the one hand, networks with high density and high reciprocity may indicate a high level of collaboration and cooperation among the actors involved (Borgatti et al., Citation2009; Feinberg et al., Citation2023). Furthermore, networks with high density and high reciprocity contribute to more effective and efficient decision-making processes (Borgatti et al., Citation2009; Hays & Kogl, Citation2007; Steiniger et al., Citation2016). Nonetheless, while this high density and high reciprocity may be beneficial in some contexts, they may also lead to what is popularly known as groupthink, resulting in a lack of diverse perspectives in decision-making (see Janis, Citation1972). Networks with high centralization may indicate a lack of free flow of information and a lack of equal participation among the actors in the decision-making process (Borgatti et al., Citation2009). In addition, the strength of ties within networks can have important implications for information exchange and influence (Burt, Citation1992; Granovetter, Citation1973). Small network diameters and short mean distances have also been found to facilitate the rapid flow of information and influence, potentially leading to more efficient decision-making (Burt, Citation2005). However, low densities and high levels of centralization in a network may indicate that some stakeholders are more connected and influential than others, potentially leading to unequal participation and representation in the decision-making process (Granovetter, Citation1973).
Other studies have similarly highlighted the importance of network centralization in shaping the power dynamics of local decision-making processes (see Boersma et al., Citation2021; Smith et al., Citation2022). Similarly, while high transitivity may indicate strong ties and trust among actors, it may also result in the exclusion of outsiders and prevent the development of new ideas (Borgatti et al., Citation2009). Power is conceptualized as the capacity of actors to influence decision-making processes, facilitated by their strategic positions within the network. As Borgatti et al. (Citation2009) have articulated, an actor’s power in a network is derived from their ability to access and control valuable resources, information, and social capital, which, in turn, is significantly influenced by their contacts. Unlike traditional views of power, which often depict hierarchical and top-down structures, the network perspective presents a more “horizontal” view of power. In network terms, power is more distributed and contingent on the structure and dynamics of the network, with actors in central positions wielding greater influence not through authority but through their critical roles in the flow of resources (Boersma et al., Citation2021; Booher & Innes, Citation2002).
The theoretical significance of this study lies in recognizing that decision-making is not isolated, but deeply embedded in the social fabric of relationships (Uzzi, Citation1997). The structure of social relations influences the speed of decision-making. The study therefore focuses on the social capital of the actors, which can be understood as the network of relationships and the benefits that accrue from these relationships (Coleman, Citation1988; Putnam, Citation2000). Studies have shown that high levels of social capital can facilitate faster decision-making, as individuals can rely on strong relationships and trust to exchange information and work toward shared goals (Putnam, Citation2000). Trust is a crucial aspect of social capital and involves having confidence in the actions and intentions of others (Urena et al., Citation2019). Social capital can influence decision-making at both the individual and collective levels: at the individual level, high social capital encourages cooperation, information exchange, and diverse perspectives. At the group level, it leads to decisions being focused on shared gains and long-term benefits (Schilke et al., Citation2021). Conversely, low social capital results in inadequate information exchange and biased decisions as individuals become risk-averse and reluctant to cooperate.
It is essential to recognize that this study’s exploration of social relations and their impact on decision-making is not confined to traditional notions of social capital. This study investigates the potential influences of trust, shared norms, and access to information and resources, thereby allowing for a more comprehensive understanding of how social relations shape decision-making speed. Additionally, this study is exploratory in nature, with the aim of generating theoretical insights and not merely confirming existing hypotheses. While the study acknowledges the relevance of social capital, its exploration goes beyond established frameworks to uncover unique patterns and dynamics within the social networks of decision-makers by detailing the ways in which network characteristics (such as centralization, density, and reciprocity) affect the pace of decision-making in urban development projects.
Data and methods
The study’s sample consisted of actors who participated in decision-making processes in a road expansion project in Kristiansand with a population of 113,737 inhabitants in 2020 (https://www.ssb.no/). Kristiansand is the center of commerce, education, and healthcare in the Agder region and is connected to other cities through a network of roads and public transportation. In 2011, the municipality began planning to expand Gartnerløkka Road, which runs through downtown, from two to four lanes, aiming to improve traffic flow, resulting in greater efficiency. The proposed expansion project comprised a road spanning approximately 1.4 kilometers (or 0.871 miles). Nevertheless, construction only started in 2022, following a period of 12 years of deliberation, with an anticipated completion date of 2028. While the project is not necessarily an outlier in urban development decisions per se, it has garnered significant controversy in the municipality compared to other projects of similar magnitude because of the large number of people affected and thus taking longer for decision makers to come to consensus (Andersen & Røe, Citation2017; Andersen & Skrede, Citation2017). In the context of this study, the term being slow is not merely a reflection of the project’s temporal duration but encompasses a broader understanding of the complexities and challenges that delay decision-making and project execution. Nonetheless, this characterization depends on a multitude of factors, including (but not limited to) the project’s complexity, scope, funding availability, and prioritization among stakeholders. I argue that the Gartnerløkka project is an appropriate example to investigate the effects of social networks on delays in urban development projects.
I collected data for this study through conducting interviews and reviewing documents related to the project. To ensure a complete network of participants in the project, I obtained a list of participating actors by analyzing the documents found on the project’s website (https://www.vegvesen.no/en/road-projects/european-road/e39coastalhighwayroute/). Using these documents, I looked for evidence of connections and relations through the number of meetings that respondents attended together. Additionally, the documents provided detailed information on the project’s scope, cost, and timeline, as well as the potential impacts on the surrounding community. I also obtained the meeting minutes from the project’s website and used them to construct the meeting network. These minutes provided records of meetings held to discuss the project, including comments and feedback from community members and other stakeholders.
In addition to the data obtained from the documents and meeting minutes, I conducted interviews with key actors involved in the project, including government officials, politicians, city administrators, planners, researchers, and consultants. I conducted semi-structured interviews that focused on the actors’ involvement in the project, their communication and collaboration with other actors, and their perceptions of the decision-making process. To capture information-sharing within the network, I provided respondents with a list of actors. From this list, I asked them to indicate from whom they had obtained information that influenced their decisions during the project as well as their opinions about the project. I conducted a total of 28 in-person and telephone or Zoom interviews, with an average duration of 45 minutes. I coded and analyzed a total of 33 participants, including the interviewees and key actors mentioned by them (see Appendix A).
As a result of this coding process, I uncovered two networks representing meetings and information flows between the actors. On the one hand, the meeting network quantifies the frequency of actors’ co-attendance during meetings. I reconstructed the meeting network by examining meeting minutes during project discussions, thereby identifying instances in which actors appeared together in these gatherings. In this context, each node within the network represents a decision-maker, and each edge symbolizes the co-appearance of actors in meetings. The edges are undirected, as all actors took part in the same meeting. I further assigned weights to these edges to account for instances where actors attended multiple meetings together, ranging from one to three. For data collection, I gathered information from three meetings involving 33 actors interconnected through 55 links. On the other hand, the information network pertains to the sources from which actors obtain information that influences their decision-making regarding the project. To construct this network, I analyzed the data from interviews with respondents, who were prompted to indicate the individuals from whom they had received pertinent information about the project. In contrast to the meeting network, the edges in the information network are directed, signifying a one-way relationship between nodes and illustrating the flow of information-sharing from one actor to another. Within this network, 33 actors are linked through 189 connections, representing the channels through which information was disseminated and received among the participants.
For each network, I calculated the following measures using the igraph (https://igraph.org/r/) package in the R statistical software (https://www.r-project.org/): diameter, mean distance, density, centralization, reciprocity, clustering coefficient (transitivity), and modularity. I also displayed and analyzed the clusters in the networks and the core and periphery of the actors. I calculated and visualized network clustering using the walk-trap algorithm and calculated and plotted the core periphery using the k-core decomposition algorithm. I then analyzed the indices for the two networks simultaneously to allow for comparisons.
To safeguard respondents’ identities and preserve their confidentiality, I employed pseudonyms. These pseudonyms were generated based on the sector in which the respective actors were employed and accompanied by numerical identifiers within the network display. For instance, the designation “POL1” denotes an actor occupying the role of a politician, “ADMIN1” signifies an actor in the capacity of an administrator, “CONS1” refers to an actor who is a consultant, “RESE1” is a researcher, and “PLAN1” is a planner. The numerical values attached to these designations have no inherent significance and merely serve as a means of labeling and identifying various actors.
As indicated earlier, the study investigates how networks contribute to delays in decision-making in the context of urban development. I chose SNA because it allows for the mapping and examination of both the structure and the quality of the relationships among actors. SNA is particularly adept at uncovering the hidden dynamics within networks, such as the impact of informal ties and clusters, making it indispensable for this study.
Results and discussion
Social networks can be analyzed at two main levels (Wasserman & Faust, Citation1994): first, with indices that describe the overall structure of the network (treating the network as a single unit of analysis) and, second, with indices that focus on individual actors or nodes (where the individuals or nodes are the units of analysis). In this study, I analyzed the network data at the structural level, which comprised all 33 actors who participated in the Gartnerløkka road expansion project’s decision-making process. I present the findings in the following three subsections: structural network analysis (), cluster analysis of the networks (), and core and periphery analyses ().
Table 1. Network-level characteristics of the meeting and information networks.
Structural-level measures of the networks
In a situation where decision-making processes must be disseminated to the wider group, understanding the structural characteristics of networks plays a pivotal role in the sharing of information, which could have deleterious consequences if not appropriately handled. In this section, I analyze and present the essential network properties, including the diameter, mean distance, density, centralization, reciprocity, clustering coefficient, modularity, and mean degree. By examining these metrics, the study reveals the distinct patterns exhibited by the meeting and information networks under investigation and demonstrates how these properties contributed to delays in decision-making. presents an overview of the various measures, which provide insights into the intricate dynamics of these networks.
Diameter
The network diameter measures the shortest path between the two farthest actors in a network, thereby providing insights into the path that an actor must take to reach all parts of the network (Wasserman & Faust, Citation1994). I calculated the diameters of the two networks using the diameter function in the igraph software package, which employs the breadth-first search method (Csardi & Nepusz, Citation2006). With this method, the algorithm first explores all nodes one step away, then two steps away, and then three steps away; it follows this order until all available options have been explored.
The meeting network has a diameter of six, running from POL3 to POL4, then to PLAN10, to PLAN9, and finally to ADMIN8 before PLAN8. This implies that to reach PLAN8, POL3 must pass through all of these actors, potentially resulting in the loss of important resources and information. In the information sharing network, the diameter is seven, running from ADMIN8 to ADMIN9, then to POL8, PLAN3, POL1, and POL3, before finally reaching ADMIN1. This means that for information to travel from ADMIN8 to ADMIN1, it must pass through the five other actors. This extensive chain of communication is not merely a structural characteristic, as each actor within the network represents a specific department that is essential to the project’s execution. This segmentation necessitates the relay of information through various experts to ensure that decisions are informed by a comprehensive and multifaceted understanding of the project’s intricacies. For instance, ADMIN8 plays a specialized role in environmental compliance, whereas ADMIN1 is in project oversight.
The seemingly long path of information flow between these two actors, which necessitates passage through the five other nodes, initially suggests a potential bottleneck in communication. Given that the network consists of only 33 actors, the diameters of six and seven are moderately high for the meeting and information networks, respectively, compared to what has been reported in the literature (H. Wang et al., Citation2021). On average, it takes approximately six intermediaries (the “small world” phenomenon) for any two individuals in the world to connect (Milgram, Citation1967; Travers & Milgram, Citation1969). Nonetheless, upon closer examination, this pathway reflects the multidisciplinary nature of urban development projects, where information must be vetted and augmented by various departments (such as legal, financial, and engineering departments) before reaching top management. The vetting process ensures that decisions are made based on comprehensive and cross-checked information that aligns with best practices and regulatory compliance. In this context, rather than signifying inefficiency, the distance between ADMIN8 and ADMIN1 underscores the project’s commitment to thoroughness and multidisciplinary collaboration.
The high diameters discovered in the networks can lead to delays in decision-making processes in two main ways. First, when the diameter is high, the actors are dispersed, making it more time-consuming for information and ideas to travel between them, thereby leading to slower decision-making processes. Second, a high diameter indicates less cohesion among decision-makers, which can potentially result in a lack of common understanding and delays in reaching conclusions. As messages pass through many actors, valuable information can be lost or misunderstood by the time it reaches the intended recipient, as has been found in previous studies (Booher & Innes, Citation2002; Yamaki, Citation2017). The high diameter of the information network, which represents the longest distance between any two actors, also contributes to the potential misrepresentation of information, as it may need to pass through many actors before reaching the intended recipient.
Mean distance
The mean distance of the networks quantifies the level of connectivity among the actors within the group. It is computed by taking the average of the shortest path lengths between all pairs of nodes to provide insights into the efficiency of resource flow within the networks. For the meeting network, the calculated mean distance is 2.75, indicating that, on average, two nodes must traverse a minimum of two intermediary nodes to establish a connection. Similarly, the mean distance in the information-sharing network is lower at 2.37. These findings suggest that, on average, actors in these networks need to move through a minimum of two steps to reach each other. Nevertheless, as the information network has a smaller mean distance than the meeting network (by 0.35), these findings indicate that actors in the information sharing network are more likely to reach out to others directly than rely solely on face-to-face meetings to reach others. Thus, some information sharing might have occurred outside formal meetings.
A low mean distance in networks means that information sharing becomes easier, whereas a high mean distance means that information sharing among the actors is much more difficult (H. Wang et al., Citation2021; Yamaki, Citation2017). The level of connectivity offered by a low mean distance is expected to facilitate communication and potentially expedite the decision-making process. However, the influence of the mean distance on decision-making speed should be considered in conjunction with other network characteristics such as the network diameter, which might have contributed to delays in information sharing.
Network density
Density assesses the proportion of existing connections within a network relative to the total number of potential connections (Borgatti et al., Citation2018). High network density indicates a high level of cohesion within the network (Borgatti et al., Citation2018). When actors have stronger ties, they are more likely to have larger networks and obtain timely information and support, thus facilitating faster decision-making (Bravo et al., Citation2012; Gómez et al., Citation2018; Jansen et al., Citation2013). In contrast, loosely connected networks may experience delays due to limited communication channels and coordination challenges (Borgatti et al., Citation2009; Nordlund, Citation2018).
The results show that the meeting network has a density of 10%, whereas that of the information exchange network is 18%. The density values observed in the networks imply that most nodes are dispersed, with only a few located around central nodes. This finding is further supported by the significant variation in the average degrees in the two networks, with the meeting and information networks having an average degree of 3.33 and 11.45, respectively. The average degree is the mean number of connections per actor in the network and provides insight into the general level of connectedness of the actors within the network, indicating how interconnected the nodes are on average (Wasserman & Faust, Citation1994). The information network thus exhibits a relatively greater density than the meeting network, indicating that actors are more closely linked through information sharing than through meeting ties. In other words, although the actors attend meetings, most of the activities within the groups occur through communication and information sharing outside of formal meetings. Nevertheless, the densities observed in both networks were low, which can lead to delays in decision-making processes due to the limited number of direct and indirect connections among the actors (He et al., Citation2023). Low density leads to reduced access to information and can hinder collaboration among actors, as some actors may obtain information earlier than others, while some actors may not obtain the information at all. This lack of collaboration leads to a diminished exchange of ideas and perspectives, further contributing to delays in decision-making, as found in previous studies (Boyd et al., Citation2010).
In addition, low network density can lead to reduced accountability among actors (Putnam, Citation2000; Steiniger et al., Citation2016). In the decision-making process, personal commitment plays a crucial role in motivating individuals to go beyond their legally required duties (Cinelli et al., Citation2021). In situations with sparse connections (as observed in the networks in this study), this personal commitment diminishes, causing individuals to be less motivated to invest additional effort and ultimately resulting in delays (Schilke et al., Citation2021). Furthermore, low network density increases the likelihood of misunderstandings among actors, as they may lack access to the key information necessary for informed decision-making. This can lead to delays in reaching conclusions and implementing decisions, as actors must invest additional time and effort in clarifying information and resolving misunderstandings (Muller & Peres, Citation2019).
Centralization
In a group situation, some individuals have more influence, authority, or expertise than others (Muller & Peres, Citation2019). Centralization in meeting and information networks refers to the concentration of network ties on a few actors within a network, indicating an unequal distribution of power and control. In a centralized network, power and control are maintained by a small number of actors, whereas decentralized networks have diffused power structures (H. Wang et al., Citation2021; Yamaki, Citation2017). In centralized networks, information is expected to be disseminated quickly through the network as central actors function as broadcasters, reaching as many actors as possible. Nonetheless, high centralization can also result in a slower diffusion of information when central nodes act as gatekeepers and exert a disproportionate influence over the network (Nordlund, Citation2018; Smith et al., Citation2022).
provides an overview of the centralization levels in the meeting network (0.81) and the information network (0.61). These results suggest that a small number of the actors hold significant influence over the decision-making processes. A high degree of centralization can impede decision-making processes because of the limited consideration of alternative viewpoints and the lack of incentives for other decision-makers to actively participate (Dong et al., Citation2018; Putnam, Citation2000). When power is concentrated within a small group, other network members may feel undervalued, leading to disengagement and further slowing down the decision-making process. The interviews revealed that some respondents perceived their presence in the decision-making process as a regulatory requirement rather than a meaningful contribution, indicating that they felt they lack influence in the decision-making process. Additionally, high centralization might not have contributed to quick decision-making because of Norwegian cultural values that prioritize democratic decision-making and frown upon a small group of actors deciding for the people (Andersen & Røe, Citation2017). Furthermore, high centralization can result in less transparency and higher opacity in the decision-making process, as decision-makers may not readily share information. This lack of transparency can cause mistrust and hinder understanding among network members, further impeding the decision-making process (Boersma et al., Citation2021; Smith et al., Citation2022). In addition, a high degree of centralization increases the risk of decision-making paralysis when central decision-makers are unavailable or unable to make decisions, causing delays as decisions await approval or input from these actors (Anh et al., Citation2023; Boersma et al., Citation2021).
The dominance of a few actors in the decision-making process has marginalized many actors, particularly road users, who are significantly impacted by roads and tolls. For instance, a project manager described how the centralized nature of the network facilitated rapid decision-making in certain instances but also led to bottlenecks in others. He reminisced, “To get anything approved, it always had to go through the same few people. It was efficient at times, but it also meant that if they were unavailable, everything came to a halt.” Disagreements among actors regarding funding, road design, and the overall effects on road users have further hindered progress. The extensive duration of the decision-making and implementation processes also introduces the possibility of actors retiring or passing away, resulting in further delays until new replacements are found. Moreover, political changes over the years, where some parties in power supported while others rejected the project, have added complexity to the project.
Reciprocity
Reciprocity measures the likelihood of a mutual connection between two actors in a network; it indicates the probability of actor i being connected to actor j if actor j is also connected to actor i (Wasserman & Faust, Citation1994). In the context of this study, reciprocity is particularly relevant for the information network, because it represents the probability of an actor sharing information with the same actor from whom they receive information. It serves as an indicator of the hierarchical nature of the network, with lower reciprocity values suggesting greater presence of a hierarchy (Yamaki, Citation2017). Reciprocity is an integral component of social capital that can foster collaboration and trust within social networks (Putnam, Citation2000). When individuals trust each other, they are more likely to engage in open and efficient communication, freely share information, and make decisions collectively, which can lead to quicker decision-making processes (Bravo et al., Citation2012; Coffé & Geys, Citation2005).
As shown in , the information network has a low level of reciprocity, where only 20.1% of the network ties are reciprocated. This low reciprocity level indicates weak mutual trust, limited shared interactions, and poor information exchange among actors, which aligns with the network’s low density (18%). Consequently, low reciprocity can lead to delays in decision-making processes, as decision-makers may be less inclined to trust and cooperate with each other (Dong et al., Citation2018). In the absence of mutual benefits, decision-makers are less likely to share information and coordinate their efforts, which can result in a lack of necessary information and subsequent delays in reaching conclusions (Nordlund, Citation2018).
This finding is corroborated by the data obtained from the document review. An analysis of meeting minutes revealed instances in which key decisions were deferred due to the absence of certain actors, indicating a reliance on specific individuals and a lack of shared decision-making authority. For example, the outcome of one meeting was a note indicating that decisions regarding the new zoning plan were postponed until the next meeting due to PLAN3 being unavailable for consultation. The data from the interviews showed a similar pattern. For example, an interview with a project manager (ADMIN2) revealed concerns about the reliability of information received from other departments: “I often find myself double-checking information from the planning department because there have been instances where their data were outdated.” A planner (PLAN1) expressed frustration about the difficulty in directly accessing information from other actors: “Whenever I need input from the politicians, I have to go through so many hoops, which delays my work significantly.”
Moreover, low reciprocity in a network fosters high competition among decision-makers instead of collaboration. When reciprocity is low, decision-makers are less inclined to collaborate, instead prioritizing the protection of their individual interests (Boyd et al., Citation2010; Bravo et al., Citation2012; Coffé & Geys, Citation2005; Gómez et al., Citation2018). This self-focused approach hampers the decision-making process and further contributes to delays. Finally, in a network characterized by low reciprocity (as I found in this study), decision-making power tends to be concentrated among a small number of individuals, leading to delays in reaching conclusions. With limited mutuality, only a select few actors have access to critical resources, thereby impeding the decision-making process if these actors fail to adequately share the resources with the other actors in the network.
Clustering in the networks
Network clustering illustrates how actors are grouped based on their connectivity patterns to form communities, in which actors with similar characteristics collaborate. In this study, I used the walk-trap algorithm to calculate the clustering (Yang et al., Citation2016). This algorithm identifies densely connected clusters of nodes within a network while also considering the sparse connections between them. The method relies on random walks over the network and categorizes vertices that tend to be visited together into communities (Borgatti et al., Citation2018). Visualizing the clusters in both networks () revealed distinct communities with some overlapping groups, indicating that certain actors could belong to multiple groups.
The results indicate that the meeting network consists of four distinct communities. The largest cluster comprises 17 actors: ADMIN6, POL2, CONS2, POL8, ADMIN10, ADMIN1, RESE1, ADMIN4, PLAN2, POL7, POL1, POL5, CONS4, ADMIN3, PLAN1, CONS1, and RESE2. This cluster is followed by another community with 10 actors: PLAN8, ADMIN8, ADMIN9, ADMIN7, ADMIN5, PLAN6, PLAN9, PLAN10, PLAN7, and CONS3. Finally, there are two smaller clusters, each consisting of three actors: PLAN3, ADMIN2, and POL6; and POL4, POL3, and PLAN5. These results are displayed in .
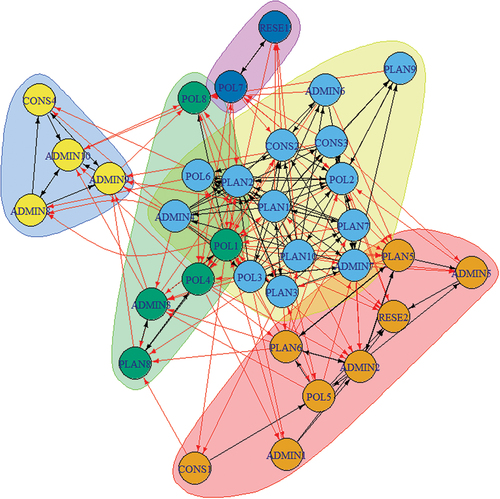
In contrast, the information network displays more complexity (as shown in ), with several overlapping clusters. Nonetheless, three clusters stand out from the overlap: the first cluster is composed of 14 of the actors (the largest cluster); the second group comprises eight actors (POL5, CONS1, ADMIN1, ADMIN2, ADMIN5, RESE2, PLAN5, and PLAN6), and third distinct cluster is composed of four members, consisting of three administrators (ADMIN10, ADMIN8, and ADMIN9) and one consultant (CONS4).
Clustered networks can influence decision-making speed, potentially leading to delays when the process is centralized within specific clusters. This clustering can cause delays because information and decisions may need to pass through multiple layers of hierarchy within a cluster before they reach the relevant decision-makers. Moreover, limited communication between clusters can also cause delays in decision-making, as information may not reach the relevant actor in a timely manner. Additionally, larger clusters may face challenges in decision-making owing to the need for consensus, as seen in the complexity of the groups in the information network (). Nonetheless, network clustering can also have positive effects on decision-making (Muller & Peres, Citation2019; Yamaki, Citation2017). A clustered network indicates a high level of communication within clusters, which could lead to faster and more efficient decision-making processes within those clusters. Furthermore, if the network is clustered into functional modules, it can enhance a group’s performance by allowing for the separation of different types of information processing and the division of labor (Muller & Peres, Citation2019).
The clustering coefficients for the meeting network and the information-sharing network are 0.06 and 0.40, respectively (see ). These indices indicate low clustering for both the meeting and information-sharing networks. The clustering coefficient measures the likelihood of nodes that are connected to the same node being connected to each other, often referred to as the “friend of a friend” effect (Gómez et al., Citation2018). It is based on shared ties among three actors, where one acts as a bridge between the other two. A high clustering coefficient can facilitate the decision-making process by promoting trust, cooperation, and coordination among the actors (H. Wang et al., Citation2021). Actors are more likely to trust and cooperate with each other because they share relationships with the same individuals, which leads to faster and more effective decision-making (Garreton et al., Citation2023). Nevertheless, when the clustering coefficient is low, as observed in the networks in this study, it can cause delays in reaching conclusions because decision-makers may be less connected to one another, resulting in a lack of trust and cooperation. Moreover, a low clustering coefficient indicates that the network is more segmented, which can lead to delays in reaching conclusions because different groups may lack awareness of each other’s actions, resulting in a lack of coordination (Yamaki, Citation2017). In networks with low cohesion, information must travel through multiple paths, which can be time-consuming, making it difficult for decision-makers to access the information necessary for effective decision-making. This difficulty is also reflected in the large diameters of the two networks.
Figure 1. Clusters in the meeting network.
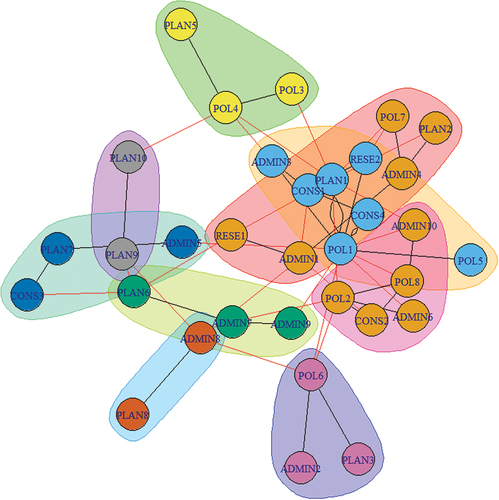
Figure 2. Clusters in the information-sharing network.
Core and periphery
Another crucial aspect of network dynamics that can significantly influence group decision-making processes is the division of the network into core and peripheral components. An understanding of core-periphery dynamics provides valuable insights into group decision-making processes and information dissemination within a network (Muller & Peres, Citation2019). To visualize the distribution of core and peripheral actors within the meeting and information networks, I employed the k-core decomposition algorithm. A k-core is a subgraph of a network in which every node has at least k connections to other nodes within the same subgraph (T. Wang et al., Citation2023). The algorithm identifies subgraphs within a network where each vertex has at least k connections, effectively determining the core of the graph (Boyd et al., Citation2010). The core consists of highly central and interconnected nodes, while the periphery comprises nodes that are less central and less connected (Yanchenko & Sengupta, Citation2023). Core nodes act as gatekeepers for information and have substantial influence and power (H. Wang et al., Citation2021). In contrast, peripheral nodes are typically located at the fringes of the network; they may face limitations in accessing information and resources, leading to reduced power and influence within the network (Nordlund, Citation2018; Yamaki, Citation2017). This understanding of network structure is crucial for analyzing information dissemination. If core actors receive information early, this information is more likely to spread rapidly to a larger number of actors than if it is only distributed among actors in the periphery (Jackson, Citation2019; Putnam, Citation2000).
and show the core and periphery of the meeting and information networks respectively. In both figures, the green nodes represent actors in the core, while the gray nodes represent actors in the periphery. illustrates the analysis of core and peripheral actors in the meeting network. It reveals that five actors (specifically, three planners, one administrator, and one politician) occupy the periphery, while the remaining 28 actors are situated within the core. Notably, the peripheral members of this network do not exhibit functional divisions.
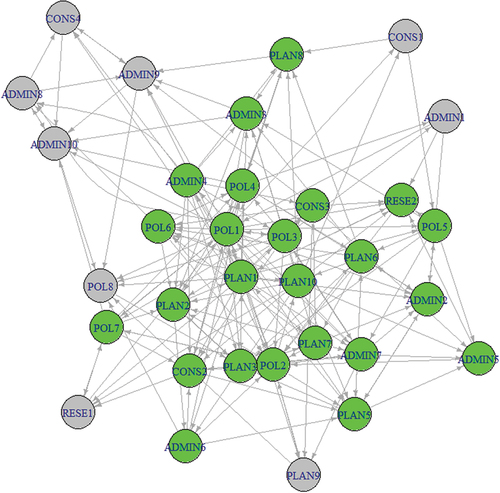
, which depicts the core and periphery of the information network, presents a more complex picture. The figure reveals the presence of nine actors on the periphery, where four of whom are administrators, which suggests that administrators predominantly occupy the periphery of the information network. This observation may be attributed to the nature of these actors’ roles, which may not require active engagement with others in the project. Interestingly, the peripheral actors differ between the two networks. This discrepancy implies either that these actors attended meetings but were not involved in information sharing or that they exhibited distinct patterns of connection within the meeting and information networks.
The clusters, as displayed in the networks, suggest the existence of tight-knit groups within the broader network, which is potentially indicative of specialized knowledge and shared objectives among certain subsets of actors. Drawing from the qualitative data, interviews with project team members revealed insights into the nature of these clusters. For instance, one interviewee mentioned, “We often find ourselves working in smaller, more focused groups, especially when dealing with specialized aspects of the project, such as environmental impact assessments and the others in community engagement.” This statement shows the functional basis for the formation of clusters, aligning with specific project needs and/or areas of expertise. In addition, the core-periphery structures observed in the analysis highlight a central group of actors who are highly connected and play pivotal roles in the decision-making process, surrounded by peripheral actors with more sporadic involvement. The document analyses, particularly for meeting minutes and internal memos, illuminate the dynamics of this structure. A recurring theme in these documents was the central role of project leadership in steering discussions and making key decisions, with peripheral actors being consulted on an as-needed basis. This finding underlines the importance of considering not only the presence of core actors but also their functional divisions and potential impacts on the decision-making process.
Figure 3. Core and periphery in the meeting network.
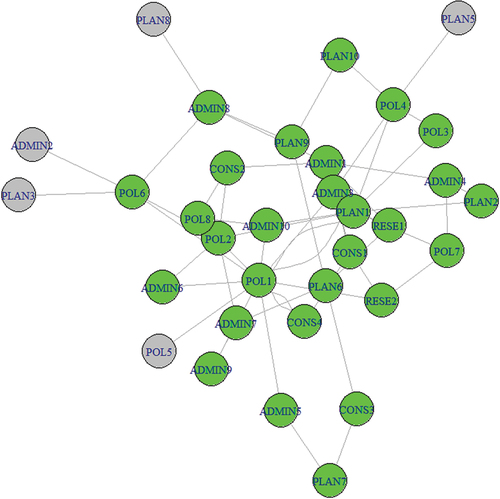
Figure 4. Core and periphery in the information-sharing network.
Conclusion and outlook
Urban planning projects consist of and are guided by interpersonal and often informal networks involving many actors, but these networks are not clearly understood. This research aimed to explore the impact of network structures on project delays. By opening the “black box” of these networks, this study not only provides an understanding of the “anatomy” of such projects but also offers new explanations for delays in decision-making. A case study of the Gartnerløkka project in Kristiansand, a road expansion project, plagued by more than a decade of delay. The results showed that long lines of communication channels, low levels of reciprocity, high clustering, high centralization, and partitioning of the networks into the core and periphery contributed to delays in the decision-making process. The findings revealed noteworthy structural characteristics in both the meeting and information-sharing networks. While some structural aspects align with the organizational logic of the development project and local governance rules in the Kristiansand municipality, others point to the intended and unintended consequences of social relationships among actors in the decision-making process.
The results from the Gartnerløkka case demonstrate that long lines of communication and interaction among the actors make it difficult for them to collaborate effectively. The mean distances (2.75 and 2.37) in the networks indicate that, on average, an actor can reach any other actor through three or fewer intermediaries. Despite the relatively short distances of communication, the decision-making process still took longer to finalize, indicating the presence of other factors that might have hindered the process. The density scores of 0.06 and 0.18 in the meeting and information networks, respectively, indicate that the network of decision-makers in the project is relatively loose. These loose networks hamper access to information, potentially causing delays as some actors gain information earlier than others, while others may not receive it at all. The findings suggest that the loose networks may not only hinder information flow but also limit the diversity of perspectives in decision-making processes. This study extends the discourse by proposing that efforts to densify these networks could enhance decision-making speed.
The results show a clear differentiation between core and periphery actors in both networks, suggesting the presence of informal hierarchies and inequalities in information access. The presence of clusters and a core-periphery structure within the network reveals the multifaceted nature of collaboration in urban development projects. While the literature has acknowledged the formation of subgroups within larger networks (Feinberg et al., Citation2023), this study provides a detailed examination of how these structures impact the timing of the decision-making process. The analysis demonstrates that only one in five ties in the information-sharing network are mutual, signifying a predominantly one-way sharing of information. This lack of mutuality hinders prompt responses to new information as well as overall adaptation to new problems and challenges.
Both networks exhibited high levels of centralization, with respective scores of 0.81 and 0.61 for the meeting and information networks. The high centralization suggests that a limited number of actors hold disproportionate control over the flow of resources and information dissemination. The high centralization found in the networks also contributes to the ongoing debate on the optimal balance between centralized control and distributed decision-making in urban development projects. While centralization can streamline decision-making and provide clear leadership, this study highlights the risk of overreliance on a select few actors, which can lead to bottlenecks and reduce the network’s adaptability. This finding challenges the prevailing notion that centralization is inherently beneficial, urging a reevaluation of the ways in which decision-making power is distributed within such networks. Although a centralized network is expected to contribute to a quicker decision-making process, this was not the case in the Gartnerløkka project. This deviation from expectations might be due to Norwegian society’s significant emphasis on the democratic decision-making process, which prevents any individual actor from driving the process. The findings also demonstrate a low level of reciprocity (20%) among the actors, making it difficult for them to trust each other and cooperate effectively, thus delaying the decision-making process.
The networks exhibit a notable level of clustering, implying the existence of subgroups within the networks. This clustering is particularly significant in the information network, as actors in the periphery encounter restricted access to information. Consequently, the peripheral actors’ effective involvement in the decision-making process and their ability to advocate for their perspectives are hindered. The qualitative analysis of the interview data further supported this finding, with some actors expressing their frustrations about their limited influence on the decision-making process. Moreover, the results show that while some actors represent the core of the network decision-making process, others are located at the periphery, where information is more difficult to reach. As such, the core and peripheral members experience difficulties with communicating and collaborating with each other, leading to delays in the decision-making process.
This study reveals the interplay between social capital, network characteristics, and decision-making efficiency in the realm of collaborative planning. The findings demonstrate that these elements not only feature but also significantly influence the dynamics of urban planning and governance. Social capital, with its emphasis on the value of social networks and resources that arise from trust, norms, and social ties, plays a pivotal role in shaping the decision-making landscape of such projects. By analyzing the roles of trust, reciprocity, and network density, this study highlights how these factors have hindered decision-making speed in the Gartnerløkka project. Contrary to Putnam’s (Citation2000) argument concerning the decline of social capital in civic participation, this study’s findings indicate that individuals are indeed willing to participate but are constrained by the prevailing network structures. The highly centralized and less dense networks observed in this study underscore the disproportionate influence wielded by a select group of key decision-makers within the network. This finding highlights the concentration of social capital around a few key nodes, which can have both positive and negative implications for the project. Although centralized structures can facilitate rapid decision-making and efficient resource allocation, they also risk creating dependencies on central actors, potentially leading to vulnerabilities and inefficiencies if these nodes become overburdened or incapacitated.
Through a core-periphery analysis, this study elucidates how actors at the core of the network form barriers that impede the speed of decision-making processes (Jackson, Citation2019). This finding suggests that while social capital may be robust within clusters, the project as a whole may not fully benefit from this capital because of the isolation of these groups. Upon closer examination, insights from the qualitative interviews illuminate the underlying factors that contribute to these characteristics. For example, some interviewees pointed to operational challenges and bureaucratic hurdles as significant impediments to more fluid and inclusive communication among the actors. One project manager highlighted the “layers of approval” required for decisions, which often resulted in a bottleneck at certain central nodes of the network, thereby contributing to its high centralization. Furthermore, the network analysis and visualization revealed the presence of subgroups within the network, a finding echoed in the thematic patterns identified through document analysis. The documents revealed instances of differing priorities among departments, which often led to the formation of informal subgroups that were aligned by shared interests or challenges. The results highlight the importance of social capital in networks to facilitate or limit decision-making within groups.
The findings demonstrate the protracted nature of communication flows between planners and politicians, as well as the subnetworks in which certain individuals receive information significantly earlier than others, making it difficult for them to make quick decisions. For instance, the long communication pathways in networks involving five to six intermediaries exacerbate the time required for planners to access decision-makers. Consequently, this extended communication process substantially contributed to the project’s prolonged decision-making duration.
These insights have implications for the governance of community development and urban planning projects, where efficient decision-making is crucial for effective outcomes. By examining how social capital is structured and flows within the decision-making network, this study demonstrates that network characteristics and social capital interact in unique ways to slow down the decision-making process. This study not only supports existing findings on the importance of social capital in collaborative activities but also extends them by highlighting the complexities of these interactions in the context of urban governance (Burt, Citation2000, Citation2005; Granovetter, Citation1973; Henttonen et al., Citation2013; Neal et al., Citation2021; Uzzi, Citation1997). The implications of the protracted decision-making process observed in the Gartnerløkka project are not only limited to this specific case but also for other infrastructure development projects in Norway and beyond. Prolonged decision-making processes often result in increased costs and failure to address the needs of the community. Using SNA in this study provides critical information for understanding the causes of decision-making delays, which can inform future research and the design of effective interventions in similar contexts. Importantly, the insights gained through SNA are not attainable through other quantitative data analysis methods such as regression analysis or structural equation modeling. By extending the discussion to the broader literature on network dynamics (Borgatti et al., Citation2009; Burt, Citation2000, Citation2005; Coleman, Citation1988; Granovetter, Citation1973; Putnam, Citation2000; H. Wang et al., Citation2021), this study contributes to ongoing conversations on networked influence in decision-making. Researchers and practitioners can draw upon these insights to design interventions that optimize information flow, minimize hierarchical challenges, and enhance the overall speed of decision-making processes within similar organizational contexts.
Although the findings show that network characteristics play a crucial role in decision-making delays, there may be alternative reasons for project delays that extend beyond the network dynamics identified in this study. Factors such as external environmental changes, regulatory challenges, and unforeseen events can significantly impact project timelines. Future research in urban development can benefit from building upon the findings of this study and exploring additional factors that may contribute to delays. In addition, while this study contributes to the literature on decision delays, a potential limitation is the cross-sectional nature of network data collection, which captures the relationships and interactions at a single point in time. This approach may not fully account for changes in relationships over the duration of a project; therefore, future research could employ a longitudinal approach to track how the network evolves over time.
Acknowledgments
I would like to thank Alexander Ruser, professor, Department of Sociology and Social Work, University of Agder, for reading and commenting on earlier drafts of the manuscript. I would also like to thank Hayley Manalang Ko at Tannhelsetjenestens kompetansesenter Øst and OsloMet for helping to proofread the ealier drafts.
Disclosure statement
No potential conflict of interest was reported by the author(s).
Additional information
Notes on contributors
Alhassan Yakubu Alhassan
Alhassan Yakubu Alhassan is a PhD research fellow at the Department of Sociology and Social Work and the Centre for Digital Transformation (CeDiT) at the University of Agder, Norway. His research focuses on Sustainable Urban Development, Rural-Urban Migration, Environment and Development, Social Network Analysis, and the Sociology of Food and Agriculture. With expertise in both qualitative and quantitative methodologies, Alhassan specializes in Computational Social Science Methods and Social Network Analysis. He holds a master’s degree in Sociology from the University of Saskatchewan, Canada, a Master’s degree in Global Development and Planning from the University of Agder, and Bachelor’s degree in Sociology and Social Work from the Kwame Nkrumah University of Science and Technology in Ghana.
References
- Andersen, B., & Røe, P. G. (2017). The social context and politics of large-scale urban architecture: Investigating the design of Barcode, Oslo. European Urban and Regional Studies, 24(3), 304–317. https://doi.org/10.1177/0969776416643751
- Andersen, B., & Skrede, J. (2017). Planning for a sustainable Oslo: The challenge of turning urban theory into practice. Local Environment, 22(5), 581–594. https://doi.org/10.1080/13549839.2016.1236783
- Anh, P. X., Nam, T. P., Toan, N. Q., Long, H. D., & Thi, B. V. (2023). Factors affecting the delay of urban development investment projects: A case of Vietnam. International Journal of Innovative Research and Scientific Studies, 6(3), 495–506. https://doi.org/10.53894/ijirss.v6i3.1553
- Boersma, K., Ferguson, J., Groenewegen, P., & Wolbers, J. (2021). The dynamics of power in disaster response networks. Risk, Hazards & Crisis in Public Policy, 12(4), 418–433. https://doi.org/10.1002/rhc3.12218
- Booher, D. E., & Innes, J. E. (2002). Network power in collaborative planning. Journal of Planning Education and Research, 21(3), 221–236. https://doi.org/10.1177/0739456X0202100301
- Borgatti, S. P., Everett, M. G., & Johnson, J. C. (2018). Analyzing social networks. Sage.
- Borgatti, S. P., Mehra, A., Brass, D. J., & Labianca, G. (2009). Network analysis in the social sciences. Science, 323(5916), 892–895. https://doi.org/10.1126/science.1165821
- Boyd, J. P., Fitzgerald, W. J., Mahutga, M. C., & Smith, D. A. (2010). Computing continuous core/periphery structures for social relations data with MINRES/SVD. Social Networks, 32(2), 125–137. https://doi.org/10.1016/j.socnet.2009.09.003
- Bravo, G., Squazzoni, F., & Boero, R. (2012). Trust and partner selection in social networks: An experimentally grounded model. Social Networks, 34(4), 481–492. https://doi.org/10.1016/j.socnet.2012.03.001
- Burt, R. S. (1992). Structural holes: The social structure of competition. Harvard University Press.
- Burt, R. S. (2000). The network structure of social capital. Research in Organizational Behavior, 22, 345–423. https://doi.org/10.1016/S0191-3085(00)22009-1
- Burt, R. S. (2005). Brokerage and closure: An introduction to social capital. Oxford University Press.
- Cinelli, M., De Francisci Morales, G., Galeazzi, A., Quattrociocchi, W., & Starnini, M. (2021). The echo chamber effect on social media. Proceedings of the National Academy of Sciences, 118(9), e2023301118. https://doi.org/10.1073/pnas.2023301118
- Coffé, H., & Geys, B. (2005). Institutional performance and social capital: An application to the local government level. Journal of Urban Affairs, 27(5), 485–501. https://doi.org/10.1111/j.0735-2166.2005.00249.x
- Coleman, J. S. (1988). Social capital in the creation of human capital. American Journal of Sociology, 94, S95–S120. https://doi.org/10.1086/228943
- Collins, B., & Del Rey, D. K. (2022). Participatory urban governance under the microscope: A qualitative study of high-functioning neighborhood councils in Los Angeles. Journal of Urban Affairs, 44(10), 1416–1431. https://doi.org/10.1080/07352166.2020.1820873
- Csardi, G., & Nepusz, T. (2006). The igraph software package for complex network research. InterJournal, Complex Systems, 1695(5), 1–9. Version 1.3.5. https://igraph.org/r
- Dong, Y., Zha, Q., Zhang, H., Kou, G., Fujita, H., Chiclana, F., & Herrera-Viedma, E. (2018). Consensus reaching in social network group decision making: Research paradigms and challenges. Knowledge-Based Systems, 162, 3–13. https://doi.org/10.1016/j.knosys.2018.06.036
- Feinberg, A., Ghorbani, A., & Herder, P. M. (2023). Commoning toward urban resilience: The role of trust, social cohesion, and involvement in a simulated urban common setting. Journal of Urban Affairs, 45(2), 142–167. https://doi.org/10.1080/07352166.2020.1851139
- Garreton, M., Espinoza, V., & Cantillan, R. (2023). Social capital in the urban context: Diversity and social contacts in Chilean cities. Journal of Urban Affairs, 45(9), 1644–1663. https://doi.org/10.1080/07352166.2021.1974302
- Gómez, E., Baur, J. W. R., & Malega, R. (2018). Dog park users: An examination of perceived social capital and perceived neighborhood social cohesion. Journal of Urban Affairs, 40(3), 349–369. https://doi.org/10.1080/07352166.2017.1343634
- Granovetter, M. S. (1973). The strength of weak ties. American Journal of Sociology, 78(6), 1360–1380. https://doi.org/10.1086/225469
- Hannibal, B., Meerow, S., Woodruff, S. C., Roy, M., Gilbertson, P. G., & Matos, M. (2022). Who collaborates on urban resilience? An analysis of flood resilience planning networks in four coastal cities. Journal of Urban Affairs, 1–18. https://doi.org/10.1080/07352166.2022.2137033
- Hays, R. A. (2015). Neighborhood networks, social capital, and political participation: The relationships revisited. Journal of Urban Affairs, 37(2), 122–143. https://doi.org/10.1111/juaf.12137
- Hays, R. A., & Kogl, A. M. (2007). Neighborhood attachment, social capital building, and political participation: A case study of low- and moderate-income residents of Waterloo, Iowa. Journal of Urban Affairs, 29(2), 181–205. https://doi.org/10.1111/j.1467-9906.2007.00333.x
- He, C., Milne, A., & Ataullah, A. (2023). What explains delays in public procurement decisions? Economic Modelling, 121, 106201. https://doi.org/10.1016/j.econmod.2023.106201
- Henttonen, K., Janhonen, M., & Johanson, J. (2013). Internal social networks in work teams: Structure, knowledge sharing and performance. International Journal of Manpower, 34(6), 616–634. https://doi.org/10.1108/ijm-06-2013-0148
- Jackson, C. (2019). The effect of urban renewal on fragmented social and political engagement in urban environments. Journal of Urban Affairs, 41(4), 503–517. https://doi.org/10.1080/07352166.2018.1478225
- Janis, I. L. (1972). Victims of groupthink: A psychological study of foreign-policy decisions and fiascoes. Houghton Mifflin.
- Jansen, R. J. G., Curşeu, P. L., Vermeulen, P. A. M., Geurts, J. L. A., & Gibcus, P. (2013). Information processing and strategic decision-making in small and medium-sized enterprises: The role of human and social capital in attaining decision effectiveness. International Small Business Journal, 31(2), 192–216. https://doi.org/10.1177/0266242611406762
- Jussila, J., & Lähtinen, K. (2020). Effects of institutional practices on delays in construction: Views of Finnish homebuilder families. Housing Studies, 35(7), 1167–1193. https://doi.org/10.1080/02673037.2019.1651831
- Kim, H., Chung, J.-K., & Lee, M.-H. (2019). Social network analysis of the Jangwi urban regeneration community. Sustainability, 11(15), 1–15. https://doi.org/10.3390/su11154185
- Milgram, S. (1967). The small world problem. Psychology Today, 2(1), 60–67.
- Muller, E., & Peres, R. (2019). The effect of social networks structure on innovation performance: A review and directions for research. International Journal of Research in Marketing, 36(1), 3–19. https://doi.org/10.1016/j.ijresmar.2018.05.003
- Neal, Z., Derudder, B., & Liu, X. (2021). Using urban networks to gain new insight into old questions: Community, economy, bureaucracy. Journal of Urban Affairs, 43(1), 2–15. https://doi.org/10.1080/07352166.2020.1770606
- Nordlund, C. (2018). Power-relational core-periphery structures: Peripheral dependency and core dominance in binary and valued networks. Network Science, 6(3), 348–369. https://doi.org/10.1017/nws.2018.15
- Parés, M., Bonet-Martí, J., & Martí-Costa, M. (2012). Does participation really matter in urban regeneration policies? Exploring governance networks in Catalonia (Spain). Urban Affairs Review, 48(2), 238–271. https://doi.org/10.1177/1078087411423352
- Putnam, R. D. (2000). Bowling alone: The collapse and revival of American community. Simon & Schuster.
- Rice, T. W. (2001). Social capital and government performance in Iowa communities. Journal of Urban Affairs, 23(3–4), 375–389. https://doi.org/10.1111/0735-2166.00095
- Rivera, L., Baguec, H., & Yeom, C. (2020). A study on causes of delay in road construction projects across 25 developing countries. Infrastructures, 5(10), 1–16. https://doi.org/10.3390/infrastructures5100084
- Schilke, O., Reimann, M., & Cook, K. S. (2021). Trust in social relations. Annual Review of Sociology, 47(1), 239–259. https://doi.org/10.1146/annurev-soc-082120-082850
- Smith, R. W., Jarvis, T., Sandhu, H. S., Pinto, A. D., O’Neill, M., DiRuggiero, E., Pawa, J., Rosella, L., & Allin, S. (2022). Centralization and integration of public health systems: Perspectives of public health leaders on factors facilitating and impeding COVID-19 responses in three Canadian provinces. Health Policy, 127, 19–28. https://doi.org/10.1016/j.healthpol.2022.11.011
- Steiniger, S., Poorazizi, M. E., & Hunter, A. J. S. (2016). Planning with citizens: Implementation of an e-Planning platform and analysis of research needs. Urban Planning, 1(2), 46–64. https://doi.org/10.17645/up.v1i2.607
- Travers, J., & Milgram, S. (1969). An experimental study of the small world problem. Sociometry, 32(4), 425–443. https://doi.org/10.2307/2786545
- Urena, R., Kou, G., Dong, Y., Chiclana, F., & Herrera-Viedma, E. (2019). A review on trust propagation and opinion dynamics in social networks and group decision making frameworks. Information Sciences, 478, 461–475. https://doi.org/10.1016/j.ins.2018.11.037
- Uzzi, B. (1997). Social structure and competition in interfirm networks: The paradox of embeddedness. Administrative Science Quarterly, 42(1), 35–67. https://doi.org/10.2307/2393808
- Van Eijk, C. (2014). Growing access to local decision-making? Explaining variation among Dutch municipalities in the institutional measures to promote citizen participation. Journal of Urban Affairs, 36(2), 256–275. https://doi.org/10.1111/juaf.12033
- Wang, H., Zhao, Y., Gao, X., & Gao, B. (2021). Collaborative decision-making for urban regeneration: A literature review and bibliometric analysis. Land Use Policy, 107, 105479. https://doi.org/10.1016/j.landusepol.2021.105479
- Wang, T., Jiang, Y., Yang, J., & Xing, L. (2023). Edge-based minimal k-core subgraph search. Mathematics, 11(15), 3407. https://doi.org/10.3390/math11153407
- Wasserman, S., & Faust, K. (1994). Social network analysis: Methods and applications (Structural analysis in the social sciences). Cambridge University Press.
- Xu, Z., & Lin, G. C. S. (2019). Participatory urban redevelopment in Chinese cities amid accelerated urbanization: Symbolic urban governance in globalizing Shanghai. Journal of Urban Affairs, 41(6), 756–775. https://doi.org/10.1080/07352166.2018.1536420
- Yamaki, K. (2017). Applying social network analysis to stakeholder analysis in Japan’s natural resource governance: Two endangered species conservation activity cases. Journal of Forest Research, 22(2), 83–90. https://doi.org/10.1080/13416979.2017.1279706
- Yanchenko, E., & Sengupta, S. (2023). Core-periphery structure in networks: A statistical exposition. Statistic Surveys, 17, 42–74. https://doi.org/10.1214/23-SS141
- Yang, Z., Algesheimer, R., & Tessone, C. J. (2016). A comparative analysis of community detection algorithms on artificial networks. Scientific Reports, 6(1), 30750. https://doi.org/10.1038/srep30750
- Zhu, Y. (2022). Interests driven or socially mobilized? Place attachment, social capital, and neighborhood participation in urban China. Journal of Urban Affairs, 44(8), 1136–1153. https://doi.org/10.1080/07352166.2020.1773837
Appendix A.
Actors and their affiliation in the Gartnerløkka project
and provide a comprehensive overview of the socio-demographic characteristics of respondents, emphasizing their potential impact on network positions and information flow in the study. Key attributes considered include age, gender, educational attainment, tenure in the current position, employment sectors, and perspectives on the project. The average participant age is 59, showcasing a right-skewed distribution with the highest age at 75 and the youngest at 37, indicating a predominant participation of older individuals. Gender disparity is evident, with 82% male and 18% female participants, underscoring challenges in achieving gender equality in decision-making roles. Additionally, 63% of participants possess higher education, reflecting research that links education to increased participation in decision-making. Respondents average 10 years in their current positions, ranging from 2 to 16 years, potentially influencing network connections. The network composition spans planners, politicians, business community members, administrators, researchers, and consultants, offering a diverse representation of actors engaged in decision-making processes.
Table A1. Summary of the socio-demographic characteristics of study participants (n = 33).
Table A2. Actors and their affiliation in the Gartnerløkka project.