
Abstract
Vegetables are an integral part of the human diet worldwide. Traditional breeding approaches have been used extensively to develop new cultivars of vegetables with desirable characteristics, including resistance/tolerance to biotic and abiotic stresses, high yield, and an elevated content of compounds beneficial to human health. The technological progress since the early 1980s has revolutionized our ability to study and manipulate genetic variation in crop plants. The development of high-throughput sequencing platforms and accompanying analytical methods have led to sequencing and assembly of a large number of plant genomes, construction of dense and ultra-dense molecular linkage maps, identification of structural variants, and application of molecular markers in breeding programs. Linkage mapping and genome-wide association mapping studies have been used to identify chromosomal locations of genes and QTLs associated with plant phenotypic variations important for crop improvement. This review provides up-to-date information on the status of genomics and marker-assisted improvement of vegetable crops with the focus on tomato, pepper, eggplant, lettuce, spinach, cucumber, and chicory. For each vegetable crop, we present the most recent information on genetic resources, mapping populations, genetic maps, genome sequences, mapped genes and QTLs, the status of marker-assisted selection and genomic selection, and discuss future research prospects and application of novel techniques and approaches.
I. Introduction
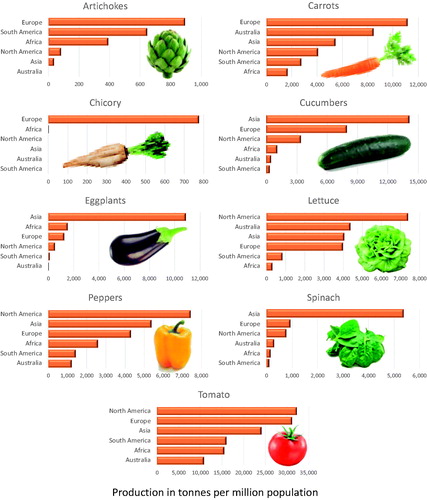
Vegetables are an assorted group of crop species whose stems, leaves, fruit, flowers, roots, or seed are important components of the human diet worldwide. They can be consumed raw or cooked, and are usually low in carbohydrates and fats while being a good source of vitamins, minerals, and dietary fiber (Singh and Lebeda, Citation2007). The exact definition of what is considered to be a “vegetable” depends on the actual terminology, as differences exist among various classifications (e.g., botanical and culinary). The continent of Asia is the largest producer of many vegetables, including spinach, eggplants, cucumbers, lettuce, peppers, and tomatoes (), while Europe leads in the production of chicory (FAOSTAT, Citation2020). When per capita production is considered, Asia is the main producer of chili peppers, spinach, eggplants, and cucumbers, North America leads in the production of tomatoes, lettuce, and sweet peppers, and Europe is the largest producer of chicory (). Besides these crops, there are many more vegetables highly popular in different regions of the world, however, in this review, we focus on tomato, pepper, eggplant, lettuce, spinach, cucumber, and chicory.
Figure 1. Percentual production of nine vegetable crops at each of six continents in 2018. Percentages were calculated from the world production data (in metric tons of fresh weight) for each crop obtained from FAO (FAOSTAT, Citation2020). Carrots category includes the combined production of carrots and turnips, chicory category shows production of chicory roots, peppers category includes the combined production of chili peppers and peppers, cucumber category includes the combined production of cucumbers and gherkins, and lettuce category includes the combined production of lettuce and leaf chicory. Notice that scales for continents differ.
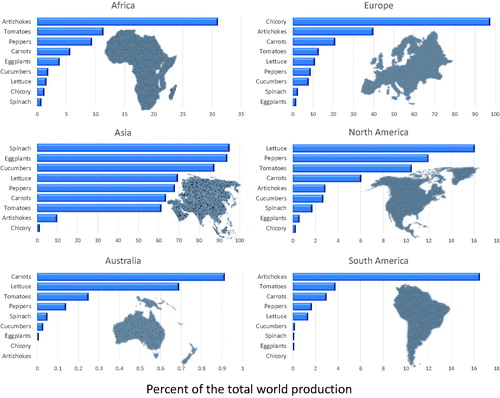
Figure 2. Relative production of nine vegetable crops after adjusting for the population size at each continent. Production in metric tons of fresh weight per million population were calculated from the 2018 world production data obtained from FAO (FAOSTAT, Citation2020). Carrots category includes the combined production of carrots and turnips, chicory category shows production of chicory roots, peppers category includes the combined production of chilies and peppers, cucumber category includes the combined production of cucumbers and gherkins, and lettuce category includes the combined production of lettuce and leaf chicory. Notice that scales for vegetable crops differ.
Traditional breeding approaches are generally slow, labor-intensive, and costly processes. Recent progress in genetics and genomics, however, has been accompanied by the development and deployment of novel tools, techniques, and approaches that could be used to enhance plant breeding programs. Molecular markers, genetic linkage maps, marker assays, and whole-genome sequence have been developed and published for many crop species, including several vegetables (Singh, Citation2007). Marker-assisted selection (MAS) (Collard and Mackill, Citation2008), marker-assisted backcrossing (MABC) (Collard and Mackill, Citation2008), marker-assisted recurrent selection (MARS) (Charmet et al., Citation1999), and genomic selection (GS) (Heffner et al., Citation2009) that can be used for precision breeding are in various stages of development for each vegetable crop, depending on available resources and the complexity of the species genetics and breeding. Various approaches, such as linkage mapping (Tanksley, Citation1993), genome-wide association mapping (GWAS) (Thornsberry et al., Citation2001), nested association mapping (NAM) (Tian et al., Citation2011), and multi-parent advanced generation inter-cross (MAGIC) populations (Cavanagh et al., Citation2008) have been developed for the detection and mapping of genes and QTLs. Though the novel genetic and genomic tools and techniques were applied primarily and frequently in major cereal crops, such as maize, rice, and wheat (Simko, Citation2015), they are gradually finding their way into vegetable genetics and breeding. The current review focuses on seven vegetable crops to provide up-to-date information on available genomic resources, the use of genetic and genomic tools and techniques in breeding programs, and the major anticipated areas of future research for each crop.
II. Tomato
The cultivated tomato (Solanum lycopersicum L.), a diploid species (2n = 2x = 24 chromosomes), is one of the world's most important vegetable crops by economic standards and consumption values. In 2018, tomato production worldwide reached nearly 182 million metric tons and US$ 47.7 billion gross production value, only second to potato (S. tuberosum L.) among all vegetable crops (FAOSTAT, Citation2020). Worldwide, there are more varieties of tomato sold than any other vegetable crop (Foolad and Panthee, Citation2012). Although a tropical species, tomato is grown in almost every corner of the world. The top tomato-producing countries include China (33.8%), India (10.6%), United States (6.9%), Turkey (3.6%), and Egypt (3.6%) (FAOSTAT, Citation2020). Tomato is also an essential dietary component in many countries, including the United States (Valpuesta, Citation2002). Although tomato fruit is generally not considered high in nutritional value, it ranks first among all fruits and vegetables as a major dietary source of vitamins (A and C), minerals (Rick, Citation1980), and phenolic antioxidants (Vinson et al., Citation1998) in the U.S.; this is due mainly to its large consumption volume (USDA, Citation2012). Lycopene is a key carotenoid predominantly found in tomatoes, which provides the red color in fruit. Both lycopene and β-carotene (also found in tomato fruit) have been shown as important antioxidants, and their consumption has been correlated with lower risks of certain cancers (Johnson, Citation2002).
Breeding history of tomato dates back to the 1930s when improvement of the overall horticultural characteristics of tomato started. Tomato has been bred with substantial diversity in plant type, size and growth habit, and fruit shape, size, color, and taste. The majority of tomato cultivars on the market are currently separated into the fresh market (FM) and processing (PROC) types. Fresh market tomatoes, including large beefsteak/slicer, plum/roma, campari, cherry, and grape types, are mainly sold and consumed fresh. Processing tomatoes are usually peeled, cubed, juiced, or sauced to make canned products. Breeding objectives for FM and PROC tomatoes are vastly different, however with the common goal of breeding higher yield per unit area for all tomato types. Other major breeding priorities generic to both types include resistance/tolerance to various biotic (e.g., diseases and insects) and abiotic stresses (e.g., salt, cold, and drought), adaptability to the changing climate, maturity, and plant type for specific production regions (e.g., warm vs. temperate) and conditions (e.g., greenhouse vs. open field), and harvest need. Major specific traits of interest in FM tomato breeding include fruit size, shape, color, firmness, the internal structure (e.g., locule size and number), uniformity, appearance, shelf-life, taste, and flavor. Major specific traits of interest in PROC tomato breeding include determinate and compact growth habit, concentrated fruit set and ripening for once-over machine harvest, jointless pedicel for easiness of harvest, and fruit characteristics, such as firmness, color, pH, titratable acidity, soluble and insoluble solids, and viscosity (Stevens and Rick, Citation1986; Tigchelaar, Citation1986; Foolad and Panthee, Citation2012).
A. Genetic resources, mapping populations, genetic maps, and genome sequences
Tomato, along with the major vegetable crops potato and eggplant, resides in the diverse Solanum genus in the Solanaceae family. In the tomato Solanum section Lycopersicon clade, there are 13 closely related taxa (species), including the cultivated tomato S. lycopersicum L. and its 12 related wild species: S. arcanum Peralta, S. cheesmaniae (L. Riley) Fosberg, S. chilense (Dunal) Reiche, S. chmielewskii (C.M. Rick, Kesicki, Fobes & M. Holle) D.M. Spooner, G.J. Anderson & R.K. Jansen, S. corneliomulleri J.F. Macbr., S. galapagense S. Darwin & Peralta, S. habrochaites S. Knapp & D.M Spooner, S. huaylasense Peralta, S. neorickii (C.M. Rick, Kesicki, Fobes & M. Holle) D.M. Spooner, G.J. Anderson & R.K. Jansen, S. pennellii Correll, S. peruvianum L., and S. pimpinellifolium L. (Knapp and Peralta, Citation2016). The Lycopersicon clade originated from the Andean regions, including Peru, Bolivia, Ecuador, Colombia, and Chile (Bauchet and Causse, Citation2012), although evidence for the exact location of tomato domestication is inconclusive pointing to both Mexico and the Andean regions (Peralta and Spooner, Citation2005). The cultivated tomato species was estimated to contain only about 5% of the total genetic variation existing in all tomato species; this has alluded to two major genetic bottlenecks and stringent selections that occurred during its domestication and early breeding (Miller and Tanksley, Citation1990). To compensate for the limited genetic diversity within the cultivated species, tomato breeding programs have utilized wild tomato accessions as germplasm resources for crop improvement as well as for genetic mapping and identification and introgression of desirable genes and QTLs. This includes genetic factors for disease and insect resistance, abiotic stress tolerance, and improved fruit quality and nutritional values (Foolad, Citation2007; Bauchet and Causse, Citation2012; Foolad and Panthee, Citation2012). To identify and map new genes and QTLs, mostly interspecific crosses between elite tomato breeding lines and accessions within the related wild species have been used to develop mapping populations, including early filial and backcross populations (e.g., F2 and BC1), backcross inbred lines (BILs), recombinant inbred lines (RILs) and near-isogenic lines (NILs), and construct genetic maps, as reviewed elsewhere (Foolad, Citation2007).
The first genetic linkage map of tomato was constructed with 153 morphological and physiological markers in 1968, which revealed all 12 tomato linkage groups (LGs) (Butler, Citation1968). The first molecular linkage map of tomato was published in 1986, using a combination of 18 isozymes and 94 RFLP markers (Bernatzky and Tanksley, Citation1986). The first “high-density” genetic map of tomato was published in 1992, which comprised 1,030 molecular markers (mostly RFLPs) (Tanksley et al., Citation1992). The development and advancement of other types of molecular markers, including AFLPs (Zabeau and Vos, Citation1993; Vos et al., Citation1995), SSRs (Tautz, Citation1989; He et al., Citation2003), RGAs (Zhang et al., Citation2002; Niño-Liu et al., Citation2003), ESTs (Adams et al., Citation1991), COSs (Fulton et al., Citation2002), RAPDs (Williams et al., Citation1990), SCARs (Paran and Michelmore, Citation1993), CAPSs (Konieczny and Ausubel, Citation1993), SNPs and InDels (Landegren et al., Citation1998), resulted in the construction and publication of additional tomato genetic linkage maps with significantly greater marker density. For example, the availability of a tomato SNP array containing 7,720 SNPs in 2012 (Hamilton et al., Citation2012) resulted in the development of rather high-density genetic maps of tomato (with >3,000 SNP markers) based on three interspecific F2 mapping populations from S. lycopersicum × S. pennellii and S. lycopersicum × S. pimpinellifolium crosses (Hamilton et al., Citation2012). Due to limited marker polymorphisms within the cultivated species of tomato, few molecular maps have been constructed based on intraspecific crosses. Most recently, an “ultra-high density” tomato genetic map was constructed based on a S. lycopersicum × S. pimpinellifolium RIL population, which contained 141,083 SNP markers grouped into 2,869 genomic bins (Gonda et al., Citation2019). This map was also used for fine mapping of genes and QTLs related to fruit weight and lycopene content in tomato (Gonda et al., Citation2019). Another high-density tomato genetic bin map, consisting of 1,195 genetic bins (8,470 SNPs), has recently been constructed using genotyping-by-sequencing (GBS) and a different S. lycopersicum × S. pimpinellifolium RIL population, which has been used for fine mapping of the late blight resistance gene Ph-5 in tomato (Jia, Citation2019).
In 2012, the tomato genome consortium published the first high-quality tomato genomic sequence of an inbred PROC tomato cultivar, Heinz 1706 (The Tomato Genome Consortium, Citation2012). An improved version of the tomato reference genome assembly (SL4.0) was released in 2019, assembled de novo from long reads of PacBio, and scaffolded with Hi-C contact maps (Hosmani et al., Citation2019). The new reference map removed 11 Mb of contig gaps from a previous assembly resulting in a total size of 782.6 Mb with 71.77% repeat content. The updated annotation of tomato genome ITAG4.0 reported a total of 34,075 protein-coding genes using RNA-seq, resistance gene enrichment sequencing (RenSeq), and other forms of expression data (Hosmani et al., Citation2019). The concurrent release of the tomato reference genome (The Tomato Genome Consortium, Citation2012) and the development of GBS method (Elshire et al., Citation2011; Poland et al., Citation2012) further revolutionized genetic mapping in tomato for traits, such as fruit, leaf, and root characteristics as well as disease resistance (Fulop et al., Citation2016; Celik et al., Citation2017; Ohlson et al., Citation2018; Xie et al., Citation2019).
B. Mapped genes and QTLs
Molecular markers and genetic maps of tomato have been used extensively for identification, mapping, and characterization of genes and QTLs for many agriculturally important traits, including resistance/tolerance to biotic and abiotic stresses, flower- and fruit-related characteristics, plant type, maturity and yield. In a previous review paper, most of the genes and QTLs which were identified and genetically mapped on tomato chromosomes for the various traits until 2012 were tabulated (Foolad and Panthee, Citation2012). Since then, molecular markers associated with additional genes or QTLs for many traits in tomato have been reported. In below, we present some of the most important genes and QTLs used for breeding purposes in tomato ().
Table 1. Major tomato (Solanum lycopersicum L.) genes and QTLs used in marker-assisted breeding for resistance against fungal, bacterial, viral and nematode diseases.
The cultivated tomato is impaired by more than 200 fungal, bacterial, viral, and nematode diseases (Lukyanenko, Citation1991). Host plant resistance has been the main focus of many tomato breeding programs around the world and has resulted in the identification, genetic mapping, and utilization of resistance genes or QTLs for many diseases, including Fusarium wilt (caused by Fusarium oxysporum), Verticillium wilt (Verticillium albo-atrum), tomato leaf mold (Cladosporium fulvum), late blight (Phytophthora infestans), bacterial speck (Pseudomonas syringae), bacterial spot (Xanthomonas race T1-T4), tomato mosaic virus (ToMV), tomato yellow leaf curling virus (TYLCV), tomato spotted wilt virus (TSWV), and root-knot nematode (RKN; Meloidogyne spp.). To date, more than 20 resistance genes for fungal, bacterial, viral, and nematode diseases have been mapped and/ or cloned in tomato () (Foolad and Panthee, Citation2012; Causse and Grandillo, Citation2016).
As the most popular vegetable crop in the world by production and value (https://www.nass.usda.gov), tomatoes are grown in very diverse climatic conditions and thus they require adaptation to various environmental stresses (Chaudhary et al., Citation2019). During the past few decades, many studies have been conducted to identify genes or QTLs conferring tolerance to abiotic stresses, including salt (Foolad and Jones, Citation1993; Foolad et al., Citation1997; Citation1998a; Citation2001; Foolad and Chen, Citation1999), cold (Foolad et al., Citation1998b; Truco et al., Citation2000; Liu et al., Citation2010; Citation2016), heat (Lin et al., Citation2010; Xu et al., Citation2017b; Wen et al., Citation2019b), and drought (Foolad et al., Citation2003; Albert et al., Citation2016; Diouf et al., Citation2020). Most of the reported QTLs cover large genomic regions often contributed from the wild species of tomato, and it has been very challenging to utilizing them in breeding programs. Therefore, little progress has been made in developing tomatoes with tolerance to abiotic stresses using the identified QTLs. An alternative and potentially promising approach to breeding for abiotic stress tolerance in tomato is the use of genetic engineering and production of transgenic tomatoes, as reviewed elsewhere (Gerszberg and Hnatuszko-Konka, Citation2017; Krishna et al., Citation2019). However, no transgenic tomato cultivar is currently available on the market, mainly due to poor consumer acceptance of genetically modified organisms (GMOs).
Other important genes and QTLs identified in tomato include those associated with plant growth habits, maturity, and fruit quality. For example, once-over machine harvest in PROC tomato production requires cultivars with determinate and compact plant type, concentrated fruit setting and ripening, very firm fruit, and easy-to-detach pedicel (jointless). The discovery, genetic mapping, and incorporation of SELF-PRUNING (sp) gene, compound inflorescence (s) gene, and jointless (j-2) gene have greatly contributed to the success of PROC tomato industry (Pnueli et al., Citation1998; Budiman et al., Citation2004; Lippman et al., Citation2008). The fresh market tomato industry has also benefited significantly from genetic mapping research, especially as relates to fruit shape and quality (Capel et al., Citation2017; Celik et al., Citation2017; Gao et al., Citation2019; Gonda et al., Citation2019; Safaei et al., Citation2020), fruit colors of red, pink, yellow, green and purple (Fray and Grierson, Citation1993; Ronen et al., Citation2000; Barry and Giovannoni, Citation2006; Mes et al., Citation2008; Ballester et al., Citation2010), increased fruit lycopene content (Chen et al., Citation1999; Zhang and Stommel, Citation2000; Ashrafi et al., Citation2012; Kinkade and Foolad, Citation2013; Gonda et al., Citation2019), and extended fruit storage life (Kinzer et al., Citation1990; Moore et al., Citation2002; Vrebalov et al., Citation2002).
To conquer difficulties of breeding for more complex traits in tomato, researchers have employed other emerging technologies to identify, map and characterize all relevant genes and QTLs. For example, genome-wide association studies (GWAS) have been carried out to characterize complex traits, such as fruit flavor (Zhang et al., Citation2015; Zhao et al., Citation2019) and quality (Zhang et al., Citation2016; Phan et al., Citation2019), metabolic attributes (Sauvage et al., Citation2014), and agronomic characteristics (Shirasawa et al., Citation2013; Bauchet et al., Citation2017). Combining RNA-seq technique with QTL mapping is another approach that has been used to fine map QTLs or identify candidate genes in QTL regions in many agriculturally important crops, including tomato (Muktar et al., Citation2015; Cui et al., Citation2017; Yang et al., Citation2018a). The RenSeq technique (Jupe et al., Citation2013) has also been a useful approach to discovering disease-resistant genes and their associated markers, which has been applied in tomato to sequence NBS-LRR (nucleotide-binding site, leucine-rich repeat) gene enriched libraries (Jupe et al., Citation2013; Andolfo et al., Citation2014). In general, recent genomic technologies have greatly enhanced our abilities to map and discover new genes and QTLs in tomato.
C. Marker-assisted selection and genomic selection
Although tomato was among the first crop plants for which genetic markers and maps were utilized for breeding purposes (Tanksley, Citation1983) until the early 1980s almost all tomato breeding programs relied mainly on phenotypic selection (PS). With the discovery of high throughput and more breeder-friendly genetic markers, including PCR-based markers and SNPs, there has been an increased interest in the use of markers to facilitate tomato crop improvement. A review of the literature indicates that although markers have been identified for the most important disease resistance traits in tomato, not all reported markers have been verified or are readily applicable in tomato breeding. Yet, MAS is employed frequently in most tomato breeding programs for gene incorporation and stacking, especially when breeding cultivars for multiple disease resistance traits. For example, SCAR, CAPS, and other PCR-based markers are frequently used in most private and public tomato breeding programs when selecting for many of the major-gene disease resistance traits (specific marker information summarized elsewhere (Foolad and Panthee, Citation2012; Lee et al., Citation2015). Genetic markers are also used routinely for various other purposes, including testing hybrid purity and screening breeding populations for plant types and fruit quality characteristics. However, markers are not typically employed when breeding for complex traits, including polygenic disease-resistant traits (e.g., bacterial canker and early blight), abiotic stress tolerance, yield, and many fruit quality characteristics.
As ultra-high density genetic linkage maps have become available in tomato (Sim et al., Citation2012; Gonda et al., Citation2019), instead of relying on individual markers associated with traits of interest for MAS, breeders may use all the available marker data in breeding material in a process known as genomic selection (GS) to predict the breeding value of a line or a population more accurately using a pre-trained model (Meuwissen et al., Citation2001; Goddard and Hayes, Citation2007). For example, in a study to compare GS model-based selection with PS when breeding for multiple bacterial spot resistance genes in tomato, a training population was developed from intercrossing among six diverse parents with different bacterial spot resistance and the progeny underwent inbreeding to model inbred line development (Liabeuf et al., Citation2018). The population was genotyped with the SolCAP chip array and different GS models were performed to estimate genomic estimated breeding values (GEBV). After cross-validation, the authors concluded that the GS models provided more accuracy in predicting breeding values of both inbred progeny and hybrids when compared with PS (Liabeuf et al., Citation2018). In another study, the efficiency of using GS for tomato fruit quality prediction was estimated, and it was determined that marker density, as well as population size and structure did affect the accuracy of GEBV (Duangjit et al., Citation2016). Although GS has been successfully implemented in animal breeding and several other crop species, it has yet to be extensively examined and utilized in tomato breeding.
D. Future outlook
Marker-assisted selection has transformed tomato breeding during the past few decades by providing breeders with the foreknowledge of traits during the seedling stage, allowing them to make selections early on and with greater precision and accuracy. However, it would be presumptuous to state that MAS or other genomic approaches will completely replace PS shortly in tomato breeding. Nonetheless, agricultural sciences are moving ahead into the era of omics discoveries, including genomics, transcriptomics and proteomics, and tomato breeders need to take advantage of the abundantly available omics data and use them for more targeted and accelerated breeding. There are indications that this is happening in tomato genetics and breeding. For example, most recently, a pan-genome study in tomato, using genome sequences of 725 diverse accessions, discovered 4,873 novel genes, which were missing from the tomato reference genome; this study also identified a novel rare allele regulating fruit flavor (Gao et al., 2019). Another pan-genome study on 100 diverse tomato lines captured 238,490 structural variants (SV), many of which have major impacts on gene expression and epistasis involved in fruit flavor, size, production, and harvest traits (Alonge et al., Citation2020). Both of the pan-genome studies unveiled opportunities for further advancement in genetic mapping and innovative breeding in tomato. One of the major challenges in PS, and to some extent in MAS, is linkage drag, which is the unwanted transfer of undesirable linked genes from wild species into the cultivated tomato genetic background. To alleviate this issue, the Nobel Prize-winning technique of gene editing via CRISPR/Cas has provided a solution in some cases by targeted modification of desired traits using gene disruption or replacement; the use of this technique in tomato has been reviewed elsewhere (Rothan et al., Citation2019). It’s expected that this technology will be highly useful to tomato breeders for targeted and accelerated crop improvement. There are also recent efforts of using gene editing to target promoter regions of several tomato genes associated with important complex agronomic characteristics in order to induce beneficial quantitative variation, which could be utilized in breeding (Rodriguez-Leal et al., Citation2017). Furthermore, Zsögön et al. (Citation2018) reported de novo domestication of a wild tomato species by editing only six critical genes involved in tomato domestication.
Some of the most important traits that tomato breeders currently focus on are disease resistance, environmental stress tolerance (in particular tolerance to heat and drought), fruit quality and shelf-life characteristics, as well as traits allowing for mechanical harvest of FM tomatoes. While some good progress has already been made, it is conceivable that tomato breeding in the next decade will conquer most of these complex traits through a combination of PS, MAS, multi-omics-based approaches, genome selection, gene editing, and genetic transformation.
III. Pepper
Pepper, belonging to the genus Capsicum of the family Solanaceae, is an important vegetable and spice crop worldwide. Believed to have been originated in Bolivia (Perry et al., Citation2007), the genus Capsicum comprises ∼35 species, including the five economically important cultivated species Capsicum annuum L., C. frutescens L., C. baccatum L., C. chinense Jacq., and C. pubescens Ruiz & Pav. Capsicum species are all diploids, generally having 24 chromosomes (2n = 2x = 24), whereas many wild species carry 26 chromosomes. Pepper exhibits diverse variation in morphological and yield-related characteristics, including plant architecture, flowering time, fruit size, shape, color, and phytochemical contents, and resistance/tolerance to biotic and abiotic stresses. Pepper can grow in almost all soil types, but a well‐drained, moisture‐retaining loamy soil is most desirable. The optimum temperature for pepper seed germination is 25—30 °C, whereas that for plant growth and fruit development ranges from 18 to 30 °C. In 2018, worldwide pepper production was ∼59.5 million metric tons on a total area of ∼4.6 million hectares (FAOSTAT, Citation2020). Apart from being used as a vegetable, pepper has a wide range of uses in the food, pharmaceutical, and cosmetics industries.
A. Genetic and genomic resources
Capsicum possesses abundant genetic resources and a rich gene pool (Barchenger et al., Citation2019), with several mutant populations and germplasm collections available for genetic and breeding studies (Paran et al., Citation2007; Jeong et al., Citation2012; Arisha et al., Citation2015; Gu et al., Citation2019; Pereira-Dias et al., Citation2019; Solomon et al., Citation2019; Siddique et al., Citation2020). Capsicum annuum is the most important species economically, and breeding programs have focused mainly on improving its resistance to pests and diseases. Landraces and wild relatives of the cultivated species are the major sources of genetic resistance to numerous pepper diseases; however, successful introgression of desirable traits from wild relatives into C. annuum has been constrained by considerable cross incompatibilities (Onus and Pickersgill, Citation2004). Selective and conscious use of wild resources is essential for the continuous improvement of the cultivated pepper.
The extent of genetic diversity within Capsicum genus has been analyzed using molecular markers (Zewdie et al., Citation2004; Nicolaï et al., Citation2013; Lee et al., Citation2016a); however, many of these studies included relatively small numbers of accessions or populations that existed in gene banks. There is a greater need for a vast and in-depth evaluation and characterization of Capsicum genetic resources, including the determination of genetic diversity within and between species.
The first genetic linkage map of Capsicum was reported in 1984, constructed based on an interspecific population derived from a cross between C. annuum and C. chinense (Tanksley, Citation1984). Since then, additional linkage maps with higher marker density and better genome coverage have been developed using both intra- and interspecific mapping populations, such as F2, BC1, RILs, and DHs (Lefebvre et al., Citation1995; Kang et al., Citation2001; Lefebvre et al., Citation2002; Paran et al., Citation2004; Han et al., Citation2016a; Lee et al., Citation2016c). Several intraspecific C. annuum mapping populations have been utilized for mapping of disease-resistance genes (Lefebvre et al., Citation1995; Lefebvre et al., Citation2002). Further, a few integrated and comparative genetic linkage maps have been developed and published (Prince et al., Citation1993; Livingstone et al., Citation1999; Jahn et al., Citation2000; Rehrig et al., Citation2014; Han et al., Citation2016a).
A high‐quality pepper reference genome is essential for further advancing molecular genetics research and promoting genomics-assisted breeding activities. Draft genome assemblies of C. annuum “Criollo de Morelos 334” (CM334), C. annuum Zunla, and C. annuum var. glabriusculum were reported in 2014 with comparable genome coverage (Kim et al., Citation2014; Qin et al., Citation2014). Resequencing of two other C. annuum lines, “Dempsey” (a large bell-type genotype) and “Perennial” (a genotype with small, elongated fruit), resulted in the development of an ultra-high density linkage map of pepper (Han et al., Citation2016a). Subsequently, efforts were made to obtain improved genome assemblies for two other domesticated species, C. chinense accession “PI159236” and C. baccatum accession “PBC81” (Kim et al., Citation2017d). However, these pepper genome assemblies have been based on short-read sequencing approaches, which have inherent limitations, such as low continuity and low coverage of transposable elements, which hamper genome-based gene identification. More recently, genomes of four Italian sweet pepper landraces, which are important pre-breeding resources, were re-sequenced using Illumina short-reads-based technology (Acquadro et al., Citation2020), and genome assembly of an intraspecific C. annuum F1 hybrid was procured (Hulse-Kemp et al., Citation2018). Further, to explore the genetic variability and diversity of Capsicum species, a pepper pan-genome was constructed based on resequencing 383 accessions, representing 355 C. annuum, 4 C. baccatum, 11 C. chinense, and 13 C. frutescens species (Ou et al., Citation2018). Further improvements in genome assemblies and genetic and genomic resources are expected to facilitate a better understanding of Capsicum genome architecture and accelerate pepper crop improvement.
B. Mapped genes and QTLs
Pepper genetic resources with different origins have been used extensively for mapping many agronomic traits, including resistance to pathogens, male sterility (MS), pungency, and morphological traits. Numerous genetic loci governing important traits have been identified and closely linked markers developed ().
Table 2. Genes and QTLs for which marker-assisted selection is conducted in pepper (Capsicum species).
A wide range of pathogens can affect pepper, causing considerable yield and fruit quality losses. One of the most devastating pathogens of pepper is oomycete Phytophthora capsici, which causes leaf blight and root rot. Capsicum annuum “CM334” is an important source of resistance to P. capsici, and has been utilized by pepper breeders. Several QTLs for resistance to various P. capsici isolates have been detected in different C. annuum genetic backgrounds (Kim et al., Citation2008; Naegele et al., Citation2014; Rehrig et al., Citation2014; Siddique et al., Citation2019). A QTL on chromosome 5 appears to be a major genetic factor involved in resistance to P. capsici (Mallard et al., Citation2013; Liu et al., Citation2014; Rehrig et al., Citation2014; Siddique et al., Citation2019). Recently, PhR10, a single dominant gene for resistance to P. capsici race 3 (Byl4), was mapped to the long arm of pepper chromosome 10 (Xu et al., Citation2016a). Root rot nematode is another important pepper pathogen, causing considerable yield losses. The RKN resistance genes, Mech1, Mech2, Me1, Me3, Me4, Me7, and N, conferring resistance to several Meloidogyne spp., have been mapped to pepper chromosome 9 (Djian-Caporalino et al., Citation2001; Wang and Bosland, Citation2006; Djian-Caporalino et al., Citation2007; Wang et al., Citation2009; Fazari et al., Citation2012; Uncu et al., Citation2015; Bucki et al., Citation2017; Changkwian et al., Citation2019), whereas a QTL conferring resistance to M. javanica co-localizes with the Me gene cluster on chromosome 9 (Barbary et al., Citation2016).
Several QTLs conferring resistance to anthracnose, caused by Colletotrichum spp., have been identified in C. chinense and linked markers have been developed (Voorrips et al., Citation2004; Pakdeevaraporn et al., Citation2005; Kim et al., Citation2010; Mahasuk et al., Citation2016). Resistance resources, including C. baccatum PBC80 and PBC81 and C. chinense PBC932, have been utilized to introgress resistance into susceptible C. annuum genetic backgrounds (Yoon et al., Citation2006; Cremona et al., Citation2018). Accession PBC80 carries a dominant (Co5) and a recessive (co4) gene mapped to chromosomes 12 and 9, respectively. The anthracnose-resistant locus AnRGO5 located on chromosome 5 (Sun et al., Citation2015), has been recently fine mapped (Zhao et al., Citation2020). Genes and QTLs associated with resistance to powdery mildew, caused by Leveillula taurica, have been identified and mapped (Lefebvre et al., Citation2003; Jo et al., Citation2017). Assays based on molecular markers associated with Verticillium resistance have been developed for breeding purposes. The resistance-linked markers were identified through a comparative analysis of Capsicum and the tomato Verticillium wilt resistance genes Ve1 and Ve2 (Barchenger et al., Citation2017). Several dominant loci, including Bs1, Bs2, Bs3, Bs4, and Bs7, conferring resistance to bacterial spots caused by Xanthomonas spp., have been identified and mapped (Wai et al., Citation2015). Further, major QTLs associated with resistance to Ralstonia bacterial wilt have been mapped to chromosomes 1 and 10 (Mimura et al., Citation2009; Du et al., Citation2019).
Pepper is affected by a wide range of viral pathogens, and numerous viral resistance genes have been identified in wild and cultivated pepper genotypes. Molecular marker assays have been developed based on several potyvirus resistance genes, including pvr1 or pvr2, pvr3, Pvr4/Pvr7, pvr5, pvr6, and pvr8 (Kang et al., Citation2005; Ruffel et al., Citation2005; Yeam et al., Citation2005; Venkatesh et al., Citation2018). Several alleles of the pvr1 and pvr6 genes were identified using eco-tilling in cultivated Capsicum accessions (Ibiza et al., Citation2010). The dominant tomato spotted wilt virus (TSWV) resistance gene, Tsw, on the distal portion of chromosome 10 has been cloned (Jahn et al., Citation2000; Kim et al., Citation2017c), and the chili veinal mottle virus (ChiVMV) resistance locus Cvr1 has been mapped to chromosome 6 (Lee et al., Citation2013; Citation2017). A dominant resistance gene, Cmr1, conferring resistance to cucumber mosaic virus (CMV) was identified from the C. annuum cultivar “Bukang” and mapped to chromosome 2 (Kang et al., Citation2010). In addition, several QTLs associated with resistance to CMV have been identified on chromosomes 5, 11, and 12 (cmv 12.1) (Ben Chaim et al., Citation2001a; Caranta et al., Citation2002; Yao et al., Citation2013). The cmr2 gene confers resistance to a broad range of CMV strains, including the Cmr1 resistance-breaking strains CMVKorean and CMVFNY (Choi et al., Citation2018). Using a specific locus amplified fragment sequencing (SLAF-seq) approach, a single gene (CA02g19570) located on chromosome 2 was identified as the candidate for qCmr2.1, which provides resistance to CMVFNY (Guo et al., Citation2017).
Both genic male sterile (GMS) and cytoplasmic male sterile (CMS) systems are utilized for hybrid seed production in pepper (Jo et al., Citation2016; Jeong et al., Citation2018). Several molecular markers linked to genes controlling GMS, such as msk (Lee et al., Citation2010a), ms1 (Lee et al., Citation2010b; Jeong et al., Citation2018), ms3 (Lee et al., Citation2010c; Naresh et al., Citation2018), ms8 (Bartoszewski et al., Citation2012), msw (Naresh et al., Citation2018), and msc1 (Cheng et al., Citation2018), have been developed and used in MAS for hybrid seed production. However, CMS remains the preferred system for hybrid seed production provided that CMS is stable and restorer genes/factors (Rfs) are available (Swamy et al., Citation2017). Cytoplasmic-genic male sterile (CGMS) systems have been used successfully in hot pepper seed production. However, many sweet pepper lines are poor restorers (Lin et al., Citation2007), which limits the successful use of CGMS in sweet pepper. Rf is the most investigated restorer gene (Min et al., Citation2009; Jo et al., Citation2016), and a SCAR marker, CRF-SCAR, linked to the Rf locus has been successfully deployed in MABC to introgress the Rf allele into sweet pepper genotypes (Gulyas et al., Citation2006). Fine mapping of the Rf locus located on chromosome 6 has been performed, and closely linked markers have been developed (Jo et al., Citation2016).
The genetic and molecular aspects of fruit secondary metabolite composition, particularly fruit pungency, have been studied extensively in pepper (Blum et al., Citation2003; Stewart et al., Citation2005; Ben-Chaim et al., Citation2006; Yarnes et al., Citation2013; Eggink et al., Citation2014; Nimmakayala et al., Citation2016; Lee et al., Citation2016b; Park et al., Citation2019). Pungency in peppers is caused by capsaicinoid compounds, the presence of which is primarily regulated by capsaicin synthase, encoded by the Pun1 gene (Stewart et al., Citation2005). Many non-pungent peppers contain non-functional Pun1 alleles with a deletion (pun1), frameshift mutation (pun12), or premature stop codon (pun13) (Stewart et al., Citation2005; Stellari et al., Citation2010). Loss of function of another gene, pAMT, causes an extreme reduction in capsaicinoid content (Lang et al., Citation2009; Tanaka et al., Citation2010). The Pun2 locus regulating pungency levels was identified in C. chacoense (Stellari et al., Citation2010). The pun2 allele is proposed to be the ortholog of gene cap (Blum et al., Citation2003). The Pun3 locus encoding the CaMYB31 transcription factor (Arce-Rodríguez and Ochoa-Alejo, Citation2017; Han et al., Citation2019) and a putative ketoacyl-ACP reductase (CaKR1) gene (Koeda et al., Citation2019) controlling pungency levels have also been identified. Structural genes involved in capsaicinoid biosynthesis, such as 3‐keto‐acyl‐ACP synthase (Kas), phenylalanine ammonia-lyase (Pal), and thioesterase (Fat), have been known for a long time; however, allelic variations affecting capsaicinoid biosynthesis have not been identified. In addition to QTLs for pungency, a QTL for fruit flavor (the strong odor of C. baccatum) was identified on pepper chromosome 3 using an interspecific cross derived from C. annuum and C. baccatum (Eggink et al., Citation2014). Minor QTLs associated with sensory traits have also been detected on different chromosomes (Eggink et al., Citation2014).
The color of ripe pepper fruit is determined mainly by carotenoids in contrast to immature fruit color that is determined by chlorophylls and anthocyanins. Both quantitative and qualitative genetic factors are known to be involved in the variation of pepper fruit pigmentation (Jeong et al., Citation2019; Jang et al., Citation2020). Based on the inheritance of pepper fruit color variation, a three-locus model (C1, C2, and Y) has been proposed (Hurtado-Hernandez and Smith, Citation1985), with the C2 and Y loci encoding phytoene synthase and capsanthin-capsorubin synthase, respectively (Popovsky and Paran, Citation2000; Huh et al., Citation2001). Recently, it was demonstrated that the C1 locus, encoding pseudo-response regulator 2 (PRR2), is responsible for the white color of immature fruit in pepper (Jeong et al., Citation2020). Mutations in carotenoid biosynthesis pathway genes, such as those encoding lycopene cyclase (LCYB), lycopene ɛ-cyclase (LCYE), β-carotene hydroxylase (CrtZ), capsorubin synthase (CCS), and zeaxanthin epoxidase (ZEP), cause color variation from red to yellow or orange (Popovsky and Paran, Citation2000; Thorup et al., Citation2000; Huh et al., Citation2001; Borovsky et al., Citation2013; Tian et al., Citation2014). The major QTLs controlling immature fruit color, pc10.1 and pc8.1 (pc1), correspond to the pepper GOLDEN2-like (GLK2) and LSD ONE LIKE1 (LOL1) transcription factors, respectively (Brand et al., Citation2012; Citation2014; Jeong et al., Citation2020). Several QTLs regulating immature fruit color variation has been detected on chromosomes 10, 11, and 12 (Han et al., Citation2016a).
Yield-related factors, such as the number of fruit per plant and fruit size and weight, have not been well-explored in pepper. However, QTLs for fruit diameter and pericarp thickness, and fruit length and weight (FW) have been identified (Ben Chaim et al., Citation2001b; Citation2003; Barchi et al., Citation2009; Yarnes et al., Citation2013; Dwivedi et al., Citation2015), including FW QTLs fw2.1, fw3.2, and fw4.2 (Ben Chaim et al., Citation2001b, Rao et al., Citation2003; Zygier et al., Citation2005). Minor QTL clusters underlying FW, shape (FS) and diameter, pericarp thickness, and the number of locules have been located on chromosomes 11 and 12 (Barchi et al., Citation2009). Two QTLs, fs3.1 and fs10.1, for fruit elongation have been identified (Ben Chaim et al., Citation2003; Borovsky and Paran, Citation2011). Major QTLs underlying FS within C. annuum have been detected on chromosomes 1, 3, and 4 in multiple populations (Ben Chaim et al., Citation2001b; Citation2003; Barchi et al., Citation2009; Yarnes et al., Citation2013; Dwivedi et al., Citation2015; Han et al., Citation2016a). Fruit shape QTLs have also been detected in several interspecific crosses, including a cross between C. annuum and C. chinense, on chromosomes 1, 3, 4, and 10 (Ben Chaim et al., Citation2003; Zygier et al., Citation2005; Borovsky and Paran, Citation2011; Yarnes et al., Citation2013). The fs2.1, FrSHP2.1, and fs3.1 are major effect QTLs for FS and are located on chromosomes 2 and 3 (Ben Chaim et al., Citation2001b; Citation2003; Rao et al., Citation2003; Zygier et al., Citation2005; Barchi et al., Citation2009; Borovsky and Paran, Citation2011; Mimura et al., Citation2012; Yarnes et al., Citation2013; Dwivedi et al., Citation2015; Hill et al., Citation2017; Chunthawodtiporn et al., Citation2018). Furthermore, genes related to shooting architecture, including CaBLIND (Jeifetz et al., Citation2011), CaJOINTLESS (Cohen et al., Citation2012), CaFASCICULATE (Elitzur et al., Citation2009), and CaS (Cohen et al., Citation2014) have been identified using ethyl methanesulfonate (EMS)-induced mutants. QTLs affecting trichome density have also been identified in CM334 on chromosome 10 (Kim et al., Citation2011; Chunthawodtiporn et al., Citation2018).
C. Marker-assisted selection and genomic selection
Over the past two decades, pepper breeding has mainly focused on the genetic improvement of hot and sweet peppers by incorporation of pest and disease resistance. Recent developments in next-generation sequencing (NGS) and high-throughput genotyping approaches have facilitated the rapid discovery of SNP markers in Capsicum spp. High-density genetic linkage maps for various populations, mostly F2 or DH, are being published. Sequence variations, including SNPs and Indels, can be easily identified using high-throughput sequencing, and genotyping can be readily performed using several platforms (Cheng et al., Citation2016; Hulse-Kemp et al., Citation2016; Nimmakayala et al., Citation2016; Han et al., Citation2016a). Among the many NGS technologies, GBS is a simple, rapid approach that has been used in biparental QTL mapping and GWAS approaches (Han et al., Citation2016a; Han et al., Citation2018; Siddique et al., Citation2019).
Among all the modern breeding tools, molecular marker technology has shown the most significant development and utility over the last two decades. Multiple marker datasets based on various marker types, including RFLPs, RAPDs, AFLPs, SCARs, SSRs, CAPS, and HRM-PCR, are now available for Capsicum researchers, along with high-throughput genotyping platforms. Marker development has become less expensive with the use of publicly available genome sequences (Kim et al., 2014; Qin et al., 2014; Kim et al., 2017d). The low cost of identifying SNPs distributed throughout the genome allows their use for QTL mapping, GWAS, or pinpointing a target region, facilitating the high-resolution mapping of QTLs and conducting MAS. Several trait-linked markers have been developed for MAS and are being utilized in pepper breeding programs, including allele-specific CAPS markers for pvr1, pvr11, pvr12, and pvr2 genes (Kang et al., Citation2005; Yeam et al., Citation2005; Rubio et al., Citation2008; Holdsworth and Mazourek, Citation2015). Several closely linked markers for resistance to important diseases in pepper, including those caused by P. capsici, pepper mottle virus (PePMoV), TSWV, and anthracnose, have also been developed for MAS (Moury et al., Citation2000; Hoang et al., Citation2013; Holdsworth and Mazourek, Citation2015; Kim et al., Citation2017c; Zhao et al., Citation2020). Bs1, Bs2, and Bs3 resistance genes have been introgressed into several commercial pepper cultivars. Marker-assisted gene pyramiding of Bs5 and Bs6 has conferred broad-spectrum resistance against Xanthomonas spp. (Vallejos et al., Citation2010). Major QTLs for resistance to Ralstonia bacterial wilt are mapped to chromosome 1 (from Capsicum accession LS2341), linked to SSR marker CAMS451 (Mimura et al., Citation2009), and chromosome 10 (from C. annuum BVRC1), linked to marker ID10-194305124 (Du et al., Citation2019).
Recently, GS was investigated for fruit-related traits in pepper using 351 accessions from the pepper core collection as a training population (Hong et al., Citation2020). Various conditions were tested for effective GS, including different genomic prediction models and the number of markers. Genomic selection models were tested using a RIL population and produced moderate prediction accuracies of 0.34, 0.48, 0.32, and 0.50 for fruit shape, weight, length, and width, respectively. This study demonstrated the potential use of GS as a tool for improving fruit-related characteristics. Although only moderate prediction accuracies have been obtained in the initial study, further improvements in the accuracy of genomic prediction are expected by integrating larger-scale genomics, GWAS, and phenomics platforms (Hong et al., Citation2020).
D. Future outlook
Capsicum genetic and breeding research has seen considerable progress during the last decade. Breeding programs are taking advantage of rapid progress in the precision and speed of NGS technologies. Reduced representation sequencing approaches, including GBS, DArTseq, and SLAF-seq, have allowed identification and analysis of a large number of genetic loci through high-throughput genome screening at a relatively low cost (Li et al., Citation2018; Naresh et al., Citation2018; Du et al., Citation2019; Siddique et al., Citation2019; Tamisier et al., Citation2020). Using C. annuum reference genomes (Qin et al., 2014; Kim et al., Citation2017b), genes governing economically important traits, such as disease resistance, pungency, male sterility, and morphological characteristics have been positioned (Jo et al., Citation2016; Nimmakayala et al., Citation2016; Han et al., Citation2016a; Cheng et al., Citation2018; Kim et al., Citation2017c). The availability of Capsicum reference genomes and their annotation data enables comparative analyses of results from multiple studies on the same traits, increasing the power of candidate gene identification.
Genomic tools, resources, and approaches are at various stages of development and application in pepper breeding programs. While MAS is being routinely employed, GS remains at an early stage of development. With ideal resource development and allocation, GS could be applied to pepper breeding for accurate estimation of hybrid performance. Since the release of the first draft genomes of pepper (Qin et al., 2014; Kim et al., 2014), GWAS has been employed for genetic analysis of traits, such as capsaicinoid content (Nimmakayala et al., Citation2016; Han et al., Citation2018), bacterial spot resistance (Potnis et al., Citation2019), P. capsici root rot resistance (Siddique et al., Citation2019), potato virus Y (PVY) resistance (Tamisier et al., Citation2020), peduncle length (Nimmakayala et al., Citation2016), and several other fruit-related characteristics (Nimmakayala et al., Citation2016; Colonna et al., Citation2019; Lee et al., Citation2020). Significant haplotypes detected in GWAS-QTL studies will serve as a unique molecular tool for developing robust markers for crop improvement. In view of the rapid progress in genomics and sequencing technologies, we anticipate that studies deploying whole‐genome-sequencing approaches, including QTL‐seq and MutMap, will facilitate pepper crop improvement and allow a comprehensive understanding of structural and functional assays of genes involved in various physiological processes. Further functional assays of candidate genes identified in these studies, will provide additional targets for genetic improvement of important traits in pepper through crop breeding. Although a number of candidate genes conferring pest and disease resistance traits have been identified in pepper, many of them have not been cloned or functionally characterized. One obstacle hampering functional genomic studies in pepper is the paucity of efficient genetic transformation protocols.
The use of reference genomes in plant breeding and other related research is highly dependent on accessibility and quality. Recent sequencing efforts (Kim et al., 2017d; Hulse-Kemp et al., Citation2018) underscore the need for further improvement of the currently available Capsicum genomic resources. Improved versions and pan-genomes of Capsicum are now becoming a reality due to rapid technical advances in DNA sequencing technologies and the reduced cost of long-read sequencing. Shortly, high-quality reference genomes and genetic tools with greater accessibility will enable the investigation of complex biological questions and expedite trait discovery in pepper.
IV. Eggplant
Eggplant (Solanum melongena L., 2n = 2x = 24), aka. brinjal or aubergine is a member of the Solanaceae family and the third most widely grown Solanaceous vegetable after potato and tomato. China, India, and Iran are the leading producing countries, and Egypt, Turkey, and Italy are the main producers in the Mediterranean region. The global production of eggplant is around 54 million metric tons annually, valued at over US$10 billion (FAOSTAT, Citation2020). Eggplant fruit (berry) has low in calorie and is considered a healthy vegetable due to its content of vitamins, minerals, and bioactive compounds, such as anthocyanins in the skin and chlorogenic acid (CGA) in the flesh (Gürbüz et al., Citation2018). The CGA content varies among cultivars and it is influenced by fruit developmental stage, storage conditions, and environmental factors (Mennella et al., Citation2012; Plazas et al., Citation2013). Oxidation of CGA by polyphenol oxidases is responsible for the browning of the fruit flesh after cutting. Eggplant also contains some anti-nutritional compounds, including saponins and steroidal glycoalkaloids (α-solamargine and α-solasonine). There are no guidelines on maximum healthy levels of glycoalkaloids in eggplant, however, it has been reported that they may also play a health-promoting function, such as inhibiting the growth of cancer cells in vitro and in vivo (Friedman, Citation2015).
Several non-exclusive theories have been proposed regarding the origin of eggplant species. Unlike its congeners tomato and potato, which are native to Central and South America, eggplant is native to the Old World. The general consensus is that eggplant was domesticated from S. insanum independently in the Indian subcontinent and China (Ali et al., Citation2011; Cericola et al., Citation2013; Page et al., Citation2019), with a possible further center of domestication in the Philippines (Meyer et al., Citation2012). Around the eighth century, eggplant spread eastward to Japan, then westward into South-East Asia and Africa, and then introduced to Mediterranean Basin and subsequently to America (Prohens et al., Citation2005).
Since eggplant is a self-pollinating plant, a large part of its current cultivation relies on the use of inbred lines and more recently progressively F1 hybrids (Kumar et al., Citation2020). Eggplant cultivars are generally classified into three major groups, elongated, semi-elongated, and round berries (Hurtado et al., Citation2013). However, the cultivated germplasm displays an extensive variation in fruit shape and size, and in Asia, some popular varieties are small-fruited and often classified as S. ovigerum (Meyer et al., Citation2019). The fruit peel color ranges from white to various shades of purple (due to a variable concentration of anthocyanin), to green (due to the presence of chlorophyll), to dark purple (due to both anthocyanin and chlorophyll). Varieties characterized by white fruit color with violet stripes are also present in the market.
Two other Solanum species are also known as eggplant and commonly grown in sub-Saharan Africa: the scarlet eggplant (S. aethiopicum L.) and the gboma eggplant (S. macrocarpon L.), to which S. melongena is fully cross-compatible. Scarlet eggplant is an important vegetable in Central and West Africa, but it is also cultivated in the Caribbean and Brazil as well as in some areas of South Italy. It includes four main inter-fertile cultivar groups: “Aculeatum,” which is mainly used as ornamental, “Gilo” grown for its fruit, “Kumba” produced for both its fruit and leaves, and “Shum” for its leaves. Gboma eggplant is also a morphologically variable species exploited for both its fruit and leaves, but it is less widespread and mainly cultivated in the forest regions of Coastal Africa and the Congo River (Plazas et al., Citation2014; Acquadro et al., Citation2017).
A. Genetic resources
The taxonomy and identification of wild eggplant relatives are challenging due to a large number of related species. Based on cross-hybridization and molecular data, the S. melongena primary gene pool (GP1) comprises cultivated eggplant and its wild progenitor S. insanum. The GP2 includes scarlet and gboma eggplants and their wild relatives S. anguivi and S. dasyphyllum, respectively, as well as >40 other wild species to which eggplant can be inter-crossed (Plazas et al., Citation2014). The GP3 includes more distantly related species, which can be hybridized with eggplant only by applying specific breeding techniques, such as embryo rescue or hybrid polyploidization (Rotino et al., Citation2014). Among the eggplant wild relatives, S. aethiopicum, S. linnaeanum, S. sisymbriifolium, S. aculeatissimum, and S. torvum represent major sources of disease resistance, including resistance to Verticillium wilt, one of the most devastating fungal diseases of eggplant (Plazas et al., Citation2016). Resistance to other diseases and pests of eggplant, including bacterial wilt (Xi’ou et al., Citation2015), Ralstonia (Lebeau et al., Citation2011), Fusarium wilt (Boyaci et al., Citation2012), leafhoppers, aphids, and eggplant root and shoot borer (Rotino et al., Citation1997), has also been identified in other wild relatives. S. insanum and S. incanum exhibit drought tolerance (Ranil et al., Citation2017) and S. incanum also possess certain phenolics in the fruit which are absent in the cultivated eggplant (Ma et al., Citation2011).
The World Vegetable Center in Taiwan holds the world's largest public collection of the cultivated eggplant and its wild relatives, maintaining more than 3,000 accessions from 90 countries (Taher et al., Citation2017). Wide collections are also maintained at the Plant Genetic Resources Conservation Unit, USDA-ARS, Griffin, GA, USA, the Center for Genetic Resources at the Wageningen University & Research, The Netherlands, the Vavilov Research Institute of Plant Genetic Resource in Russia, the National Bureau of Plant Genetic Resources in India, the Institute of Vegetables and Flowers in China (GENESYS, Citation2020) and the French National Institute for Agricultural Research (INRA) in Avignon, France (Daunay et al., Citation2000).
B. Mapped genes and QTLs
The first RFLP-based genetic map of eggplant was developed based on an F2 population (n = 58 individuals) of a cross between S. melongena and S. linneanum (Doganlar et al., Citation2002). The map was subsequently improved by including 110 COSII markers, which were previously mapped in the tomato (Wu et al., Citation2009), and used for locating QTLs controlling morphological traits, including leaf lobing, leaf prickles, and prickle anthocyanin (Frary et al., Citation2014). A more complete genetic map was then developed by increasing the number of individuals (n = 108) and markers (Doğanlar et al., Citation2014).
An interspecific F2 population of 48 individuals from a S. melongena × S. linneanum (=S. sodomeum) cross was also used to develop a RAPD/AFLP-based genetic map, in which two QTLs for Verticillium wilt were located (Sunseri et al., Citation2003). Another interspecific map based on 91 BC1 individuals of a S. melongena × S. incanum cross and 242 markers (COSII, SSRs, AFLPs, CAPS, and SNPs) was later developed (Gramazio et al., Citation2014), which encompassed 1,085 cM. Based on synteny of this map with the tomato genetic map, six candidate genes involved in the biosynthesis of chlorogenic acid, five polyphenol oxidase genes, and genes affecting fruit shape (OVATE, SISUN1) and prickliness were located on the twelve identified LGs.
The first intraspecific genetic linkage map of eggplant was published in 2001, which was based on 168 F2 individuals and 181 RAPD and AFLP markers (Nunome et al., Citation2001). This map was used to identify QTLs for fruit shape as well as fruit stem and calyx pigmentation. Another intraspecific eggplant genetic map, published in 2010, was based on 238 molecular markers and 141 F2 individuals derived from a cross between the breeding lines “305E40” (resistant to F. oxysporum due to introgressed Rfo-sa1 locus from S. aethiopicum) and “67/3” (Barchi et al., Citation2010). An intraspecific map of eggplant based on an F6 RIL population of a cross between a Ralstonia solanacearum (RS) resistant line (“AG91-25”) and a susceptible line (“MM738”) was used to locate a major dominant resistance gene, ERs1 (Lebeau et al., Citation2013). Subsequently, this map was enriched with additional markers and used to identify one major phylotype-specific QTL and two broad-spectrum QTLs for resistance to RS (Salgon et al., Citation2017). Two additional intraspecific genetic maps of eggplant, based on two F2 populations derived from crosses between two non-parthenocarpic lines (“LS1934” and “Nakate-Shinkuro”) and a parthenocarpic line “AE-P03” were developed, integrated, and used for comparative analysis with the tomato genome using a set of 326 common markers (Fukuoka et al., Citation2012). The F2 maps were also used to identify QTLs for parthenocarpy, and two contributing QTLs, Cop3.1 and Cop8.1, were mapped onto chromosomes 3 and 8, respectively (); subsequently, Cop8.1 was confirmed in a RIL population (Miyatake et al., Citation2012). However, in all the above-mentioned genetic maps, often the identified QTLs encompassed large genetic regions (cM), corresponding to several Mbs on the physical map, limiting their introgression via MAS due to potential linkage drag. Only recently a fine map of an eggplant semi-dominant Prickle (Pl) gene locus on chromosome 6, causing the absence of prickles, was obtained using a linkage map based on an F2 population derived from a cross between the no-prickly cultivar “Togenashi-senryo-nigo” and the prickly line “LS1934.” A 5-kb deletion within the Pl locus responsible for the no-prickly phenotypes was identified, and primers for detecting the InDel suitable for the MAS of the trait developed (Miyatake et al., Citation2020).
Table 3. Major genes and QTLs identified in eggplant (Solanum melongena).
With the advent of NGS technologies, the development of higher-density genetic linkage maps and the identification of candidate genes have become a reality (Jaganathan et al., Citation2020). In the aforementioned F2 population derived from the intraspecific cross “305E40” × “67/3” the application of RAD-sequencing identified ∼10,000 SNPs and 1,000 InDels, of which >2,000 SNPs were found to be potentially useful for genotyping via a GoldenGate assay (Barchi et al., Citation2011). This resulted in the development of the first post-NGS genetic map of eggplant, which included 415 SNP markers assigned to the 12 eggplant chromosomes. Subsequently, the map was used to locate QTLs for seven traits associated with anthocyanin content (Barchi et al., Citation2012) and 20 fruit yield and morphological traits (Portis et al., Citation2014), fruit qualitative traits (dry matter, sugars, and organic acids), chlorogenic acid, peel anthocyanins and steroidal glycoalkaloids (Toppino et al., Citation2016). The most recent study based on this F2 population made it possible to locate major QTLs affecting response to Fusarium oxysporum and V. dahliae (Barchi et al., Citation2018).
Genome-wide association studies were performed on a set of 191 eggplant accessions comprising a mixture of breeding lines, old varieties, and landraces from Asia and the Mediterranean basin, and genotyped with 384 SNPs (Cericola et al., Citation2014, Portis et al., Citation2015). These studies validated a number of previously identified QTLs affecting anthocyanin pigmentation, as well as fruit and plant morphology; further, due to the wide genetic diversity that existed in the panel of genotypes, several new marker-trait associations were identified. Another association mapping study based on 219 SNPs applied to a set of 377 eggplant accessions identified five SNPs near the SUN and OVATE homologs of tomato, respectively encoding for a protein promoting fruit elongation and a protein playing a negative role in the growth and elongation of fruit (Liu et al., Citation2019b).
An advancement in eggplant genetic map saturation was made in a study aimed at identifying QTLs associated with resistance to Ralstonia pseudosolanacearum. Following a GBS approach, a set of 1,370 SNPs were applied to genotyping 123 DH lines previously obtained from a cross between the susceptible “MM738” and resistant “EG203” lines. The identified QTLs were highly influenced by environmental conditions, but the two most stable QTLs were located on chromosomes 3 and 6 (Salgon et al., Citation2017). Recently, two highly saturated genetic maps of eggplants were reported. One was based on an F2 population (n = 121) of a cross between the eggplant line “1836” and accession of S. linnaeanum. Using SLAF-seq, a map containing 2,122 SNPs was obtained and used to identify 19 QTLs associated with plant and fruit traits (Wei et al., Citation2020). The second map was developed based on the intraspecific RIL population of 163 F7 RILs from a cross between the eggplant breeding lines “305E40” and “67/3.” In this RIL population, the availability of a high-quality genome sequence of the line “67/3” (male parent) and resequencing of the line “305E40” (female parent), as well as a low coverage Illumina sequencing of RILs led to the identification of 7,249 SNPs assigned to the 12 eggplant chromosomes (Barchi et al., Citation2019a). The map, spanning 2169.23 cM, had an average marker distance of 0.4 cM and has been utilized to determine genetic bases of several traits related to anthocyanin content and seed vigor (Toppino et al., Citation2020). Since the fruit of the two parental lines (“305E40” and “67/3”) show different content in several metabolites belonging to the glycoalkaloid, anthocyanin, and polyamine classes, more recently the metabolic profiling of each RIL made it possible the identification of several metabolomic QTLs (mQTLs) associated with their accumulation (Sulli et al., Citation2021).
C. Marker-assisted selection and genomic selection
Genetics and genomics research in eggplant has lagged behind that in other Solanaceae crops, such as tomato, potato, and pepper. Although conventional breeding has resulted in many improved cultivars of eggplant, to date there is no reported example of eggplant varieties developed through the use of MAS. However, the recent availability of a high-quality eggplant genome sequence offers great opportunities for the rapid development of new molecular markers tightly linked to genes and QTLs of interest, which in turn would allow the application of genomic tools to develop new eggplant varieties more efficiently.
The first draft of the eggplant genome sequence, released in 2014 (Hirakawa et al., Citation2014), covered 833.1 Mb (N50 = 64 Kb) spanning 74% of the eggplant genom. This genome sequence, however, was highly fragmented and not anchored to the eggplant chromosomes. Furthermore, the number of predicted genes was 85,446, much larger than the number of genes (∼35,000) annotated in other sequenced diploid Solanaceae genomes. A new eggplant genome sequence, released in 2019 by an Italian Consortium for the RIL male parent “67/3,” was developed by combining Illumina and optical mapping approaches (https://solgenomics.net/organism/Solanum_melongena/genome). The quality of the hybrid assembly was comparable to those of tomato, potato, and pepper (1.22 Gb gapped and 0.92 Gb un-gapped sequence; N50 = 3.59 Mb). The gene annotation, assisted by RNA-Seq, resulted in 34,916 gene models, similar to those in other Solanaceae species, of which 28,425 were anchored. Furthermore, through the resequencing of the RIL female parent “305E40” and a low coverage Illumina sequencing of each RIL, scaffolds were anchored to the 12 eggplant chromosomes (Barchi et al., Citation2019a). Subsequently, based on previous assemblies, a highly contiguous S. melongena reference genome was obtained by using 3 D chromosome conformation (Hi-C) information, resulting in a marked reduction of unanchored genes (Barchi et al., Citation2021).
Recently, a high-quality chromosome-level genome assembly for the eggplant inbred line “HQ-1315” has also been published, which was obtained by a combination of Illumina, Nanopore, 10X genomics sequencing technologies, and Hi-C technology for genome assembly (Wei et al., Citation2020). The sequencing of a QTL affecting fruit length, located on chromosome 3, was performed and the gene Smechr0301963, belonging to the SUN gene family, was predicted to be a key candidate gene for eggplant fruit length regulation. Moreover, 210 linkage markers associated with 71 traits were anchored to the eggplant chromosomes and 26 QTL hotspots were identified.
The recent availability of a high-quality eggplant genome sequence has fostered resequencing studies, which would lead to the development of further marker information and enhancing the genetic mapping of agronomic traits. The first re-sequencing study included a comprehensive structural and functional characterization of seven diverse S. melongena accessions and one accession of the wild species S. incanum L. (Gramazio et al., Citation2019). By comparing the resequencing data with the high-quality reference genome, more than 10 million new polymorphisms were identified, including 1.3 million among the S. melongena accessions and over 9 million between S. melogena and S. incanum. This highlighted the narrow genetic diversity within the domesticated eggplant, and that introgression from the wild relatives could broaden the genetic basis of cultivated eggplant significantly. In another study, a draft genome sequence of the scarlet eggplant S. aethiopicum was published and 34,906 protein-coding genes were annotated (Song et al., Citation2019). In this study, resequencing of 65 S. aethiopicum and S. anguivi accessions resulted in the identification of more than 18 million SNPs, of which ∼34,000 were located within regions of disease resistance genes. Further, a pan-genome analysis of S. aethiopicum accessions identified 51,351 protein-coding genes, of which 7,069 were missing from the cultivated eggplant reference genome.
The high-throughput sequencing technologies make large amounts of data available, which when integrated with phenotypic information would facilitate the identification of traits and regions for pyramiding desirable alleles from both cultivated and wild relatives via MAS and also GS. The use of GS for complex traits would allow incorporating a large number of markers to model the performance of a genotype, thus avoiding the risk of losing contributions of multiple small-effect genes.
D. Future outlook
Despite considerable progress made in the last decade at identifying genetic bases of traits of agronomic interest, in the future it is desirable to offer an alternative to traditional linkage or association mapping populations for increasing the precision of QTL mapping. In this regard, a good example is the recent development of a multi-parent advanced generation intercrosses (MAGIC) population obtained by crossing seven S. melongena accessions, chosen to maximize the phenotypic, genetic, and geographic variation of the material in cultivation, with a single S. incanum accession (Gramazio et al., Citation2019).
At present, eggplant wild relatives are poorly represented in genebanks and, with a few exceptions (Rotino et al., Citation2014; Liu et al., Citation2015), breeders have largely overlooked their potential value for eggplant breeding. It is necessary, therefore, to increase the number of wild eggplant accessions in the genebanks and conduct accurate genotyping and phenotyping for better evaluation of their potential use in developing new eggplant cultivars (Barchi et al., Citation2019b). In this respect, it is important to note the development of pre-breeding material obtained by crossing the cultivated eggplant with wild relatives (Kouassi et al., Citation2016), the development of an eggplant introgression line (IL) population using as donor parent S. incanum L. (Gramazio et al., Citation2017), and the recent characterization of a set of ILs carrying a single marker-defined chromosomal segment (Mangino et al., Citation2020). Research should be also focused on conducting phenotypic characterization of hybrids between eggplant and wild relatives from the primary and secondary gene pools and the evaluation of their heterotic ability for various yield, quality, and disease resistance traits (Kaushik et al., Citation2016, Citation2018).
Additional studies should be conducted to identify suitable rootstocks for eggplant grafting, so to improve the quality of eggplant cultivation by providing resistance/tolerance to soil pathogens and by inducing vigorous growth of the scions (Bletsos et al., Citation2003). Due to the tolerance to abiotic and biotic stresses, eggplant wild relatives have been used for eggplant grafting, such as S. torvum, S. sisymbriifolium, or the interspecific hybrids S. melongena × S. aethiopicum (Gisbert et al., Citation2011; Moncada et al., Citation2013). Analysis of the genome-wide changes induced by DNA methylation in eggplants grafted onto two interspecific rootstocks revealed that similar to heterotic hybrids, increased vigor of the scion is associated with changes in gene expression and reduced DNA methylation in CHH (Cerruti et al., Citation2021). In tomato, differentially expressed genes were detected between the transcriptomes of heterografts and homografts plants (Wang et al., Citation2019a), and future studies in eggplant should be aimed at deciphering the molecular interactions between scion and rootstocks.
At present large part of the eggplant production relies on non-hybrid varieties, however, farmers’ interest and preference in eggplant hybrids have remarkably increased in the last several years. F1 hybrids are available on the market, but further development of locally adapted hybrids with preferred fruit traits and having high yield and adaptation is required and will be facilitated by the development of eggplant MS lines (Kumar et al., Citation2020). Previous studies reported examples of eggplant MS caused by recessive nuclear genes (Phatak et al., Citation1991) as well as CMS by utilizing the cytoplasm of wild Solanum species (Khan and Isshiki, Citation2010; Citation2011; Citation2016). Furthermore, two independent dominant fertility restorer (Rf) genes have been discovered, sequenced, and found tightly linked to a SCAR marker (Hasnunnahar et al., Citation2012). More recently, through an RNA-seq approach, further genes and pathways related to MS in eggplant have been identified (Yang et al., Citation2018b; Li et al., Citation2019a). However, the molecular mechanism of MS is not yet fully understood and further effort is needed to integrate MS into various eggplant genetic backgrounds through MAS.
Parthenocarpy represents a key trait for eggplant breeding, as it makes it possible to obtain seedless fruit and to overcome the problem of low fruit yield under unfavorable environmental conditions. The identification of a parthenocarpic spontaneous mutant plant has been reported (Miyatake et al., Citation2020) that was not associated with Cop8.1 QTL for parthenocarpy (Miyatake et al., Citation2012). Map-based cloning of the gene revealed that Pad-1 is involved in auxin homeostasis during ovary development and the mutated allele of the gene induces parthenocarpy. Furthermore, the suppression of its orthologous genes induced parthenocarpy also in tomato and pepper (Matsuo et al., Citation2020). This result is of great interest for the future development of parthenocarpic genotypes in cultivated eggplant varieties and should be confirmed on a wider number of genotypes also through the application of the recently available biotechnological approaches, such as gene knock-out based on the CRISPR/Cas9 technique (Saini and Kaushik, Citation2019). The latter has been recently adopted to edit polyphenol oxidase genes involved in the browning of the fruit flesh after cutting (Maioli et al., Citation2020). Further improvements of the technique, as well as optimized protocols for eggplant in vitro regeneration, are needed to apply this approach commonly for eggplant improvement.
V. Lettuce
Lettuce (Lactuca sativa L.), a self-fertilized diploid species (2n = 2x = 18) from the Asteraceae (Compositae) family, is grown mainly in moderate climates in many countries around the world. Lettuce leaves are frequently consumed raw as a salad or a sandwich filling, although in some cuisines, the leaves or stems are also cooked, pickled, dried, or stir-fried. The world’s lettuce production totaled 27.3 million metric tons in 2018 (the most of any leafy vegetable), with the majority being produced in China (57.0%), U.S. (13.5%), India (4.5%), Spain (3.4%), and Italy (2.8%) (FAOSTAT, Citation2020).
Lactuca sativa is the only cultivated species from the genus Lactuca that includes ∼100 species, most of which are indigenous to Asia and Africa. Results of RNA sequencing indicate that the single domestication event of lettuce occurred ∼10,800 years ago (YAGO) in the Fertile Crescent, and L. serriola (prickly lettuce) is the progenitor of the cultivated lettuce (Zhang et al., Citation2017). Domestication was marked by the loss of seed shattering, probably caused by spontaneous mutation(s) (Wei et al., Citation2021). Besides L. serriola, other closely related species L. aculeata, L. altaica, L. azerbaijanica, L. dregeana, L. georgica, and L. scarioloides are considered to be in the primary gene pool for the domesticated lettuce. Lactuca saligna (willow-leaf lettuce from secondary gene pool) and L. virosa (bitter lettuce from tertiary gene pool) are also sexually compatible with the cultivated lettuce, however, the viability of the resulting offspring is limited (Zohary, Citation1991; Lebeda et al., Citation2007; Citation2009).
Lettuce cultivars display extensive variation in leaf color, shape, and texture. Based on the shape and size of the head, the shape, size, and texture of leaves, stem length, and seed size, lettuce cultivars are commonly divided into several horticultural types: crisphead (frequently split into iceberg and Batavia), butterhead, romaine (cos), leaf (cutting), Latin (grassé), stem (stalk), and oilseed. Leaves of all types, but stem and oilseed, are typically eaten raw; the stem type is cultivated mainly for edible stems that are eaten raw or cooked, and the oilseed type is used for the production of cooking oil from its relatively large seeds (Simko et al., Citation2014a). Since the 1990s, a dramatic expansion has been observed in the use of lettuce for fresh-cut processing and extended storage of the product in modified atmosphere packaging (MAP) (Glaser et al., Citation2001). Lettuce plants used for fresh cut (usually romaine, iceberg, or leaf) are harvested either as mature rosettes, which are then cut or shredded before packaging or whole leaves of ∼30-day-old seedlings that are harvested and packaged as baby‐leaf or spring‐mix salad (Hayes and Simko, Citation2016).
A. Genetic resources
The divergence of stem type from its ancestral cultivated lettuce occurred ∼1,900 YAGO and those of butterhead, crisphead, and romaine ∼500 YAGO (Zhang et al., Citation2017). Currently, only a fraction of the genetic diversity found in lettuce is exploited in breeding programs, where the majority of new cultivars are derived from crossing elite, closely related germplasm within a certain type. Pedigree and DNA fingerprinting show that modern lettuce cultivars, particularly within iceberg and to a lesser extent within romaine type, are closely related, whereas leaf type cultivars have the highest genetic diversity (Mikel, Citation2007; Citation2013; Simko and Hu, Citation2008; Simko, Citation2009; Rauscher and Simko, Citation2013; Zhang et al., Citation2017). To increase genetic diversity and introduce novel loci into the cultivated lettuce, hybridization of elite cultivars with old heirloom varieties and related wild species has been common in pre-breeding programs. Such diversification of the primary gene pool may help developing cultivars with improved resistance or tolerance to biotic and abiotic stresses (Adhikari et al., Citation2019), better nutritional (Simko, Citation2019), and post-harvest qualities (Hayes and Simko, Citation2016; Damerum et al., Citation2020), water and nutrient use efficiencies (Simko, Citation2020a; Macias-González et al., Citation2021), and potentially cultivars that are less hospitable to human enteric pathogens (Simko et al., Citation2015b; Melotto et al., Citation2020).
The generation and phenotypic characterization of mapping populations is usually a lengthy process. Many genes of interest have been mapped in lettuce using a diverse set of populations, including F2 and early BC generations, RILs, BILs, NILs, and diversity panels. The majority of RIL populations used to identify QTLs have been based on intraspecific crosses between two different types of the cultivated lettuce, for example, iceberg × Batavia (Hayes et al., Citation2014a; Simko et al., Citation2015a), iceberg × butterhead (Hayashi et al., Citation2008), iceberg × romaine (Simko et al., Citation2009; Simko et al., Citation2011), Latin × Batavia (Mamo et al., Citation2019; Sandoya et al., Citation2019), and Batavia × leaf (Simko et al., Citation2013). Less frequently, however, mapping populations have also been developed from crosses between cultivars of the same type, for example, Batavia × Batavia (Sandoya et al., Citation2019) and iceberg × iceberg (Aruga et al., Citation2012; Jenni et al., Citation2013; Macias-González et al., Citation2019), or between two distinct genotypes of the wild species L. serriola (Bell et al., Citation2015). Various interspecific mapping populations have also been developed, including crosses between iceberg type and L. serriola (probably the most frequently used population in mapping studies) (Argyris et al., Citation2005; Simko et al., Citation2009; Truco et al., Citation2013), butterhead and L. serriola (Uwimana et al., Citation2012), and leaf type and L. saligna (Jeuken and Lindhout, Citation2002; Jeuken et al., Citation2008). Association studies have been performed on diversity panels, which included an assortment of horticultural types. Earlier studies used fewer accessions (∼100—300), genotyped with markers relatively sparsely distributed throughout the genome (Kwon et al., Citation2013; Lu et al., Citation2014; Walley et al., Citation2017) or located in only specific genomic regions (Simko et al., Citation2009; Simko et al., Citation2011; Inderbitzin et al., Citation2019). More recently a diversity panel of almost 500 accessions genotyped with over 50,000 markers was used for GWAS of traits related to plant development, biomass production, post-harvest quality, and the traits stability (Sthapit Kandel et al., Citation2020).
The first molecular linkage map of lettuce was constructed based on 66 F2 plants and 41 RFLP markers (Landry et al., Citation1987). The markers were distributed in nine LGs and covered ∼400 cM map distance of the lettuce genome. Progress in marker technologies facilitated the construction of higher-density linkage maps of lettuce and more complete coverage of the genome (Galeano et al., Citation2014). For example, ∼14,000 SNP markers were used to construct a high-density lettuce genetic map, covering 1,585 cM of the genome (Truco et al., Citation2013). This genetic map was developed using 213 F7:8 RILs derived from interspecific cross iceberg cv. Salinas × L. serriola accession US96UC23. The same RIL population was also used to develop a consensus genetic map of lettuce, integrating information from multiple populations (Truco et al., Citation2007), and has become the lettuce reference map (Simko et al., Citation2009; Citation2013; Rauscher and Simko, Citation2013; Hayes et al., Citation2014a).
A reference assembly of the lettuce genome (iceberg cv. Salinas) has been generated and validated genetically (Reyes-Chin-Wo et al., Citation2017). The total length of the assembly is 2.38 Gb, covering ∼88% of the L. sativa genome and containing almost 39,000 annotated genes. The above-mentioned interspecific RIL population has been used for validation and anchoring of the assembly to the nine lettuce LGs. Sequencing revealed a highly repetitive nature of the lettuce genome due to a triplication that occurred around 66 million years ago (MYA) (Reyes-Chin-Wo et al., Citation2017). Whole-genome resequencing of 445 accessions from 13 Lactuca species has been used to identify lettuce domestication history, the genetic architecture of domestication traits, and detection of the introgression regions from the wild lettuce L. serriola into resistance gene clusters (Wei et al., Citation2021). In addition, more than 90 genomes of the cultivated lettuce and its wild relatives have been sequenced and assembled to some degree (Verwaaijen et al., Citation2018; Inderbitzin et al., Citation2019) (https://www.ncbi.nlm.nih.gov/bioproject/478460, https://www.ncbi.nlm.nih.gov/bioproject/412928). Whole-transcriptome analysis, with total RNA sequencing of 240 wild and cultivated lettuce accessions, has been applied to identify candidate loci involved in flavonoid biosynthesis (Zhang et al., Citation2017), and transcriptome analysis of a single cultivar led to the identification of a network of genes involved in interaction with soilborne fungus Rhizoctonia solani (Verwaaijen et al., Citation2019) and fungal necrotroph Botrytis cinerea (De Cremer et al., Citation2013).
B. Mapped genes and QTLs
Genes and QTLs for a large number of traits have been mapped in the lettuce genome using intraspecific and interspecific mapping populations. The majority of traits were related to resistance or tolerance to biotic and abiotic factors, and various plant characteristics and product qualities ().
Table 4. Major genes and QTLs positioned on the molecular linkage map of lettuce (Lactuca sativa).
Lettuce downy mildew (DM), caused by an oomycete Bremia lactucae, is economically the most important disease of the cultivated lettuce worldwide, and therefore numerous studies have focused on resistance to this disease. The disease can affect lettuce at any developmental stage, from young seedlings to mature plants. Over 50 Dm genes and resistance factors have been described, which generally provide complete resistance against specific isolates of B. lactucae (Simko et al., Citation2015a; Parra et al., Citation2016). Lettuce resistance to DM may also be polygenic (quantitative) in nature, with phenotypic reactions ranging from partial to near-complete resistance. A large number of loci for resistance to DM have been mapped for both race-specific and quantitative resistance phenotypes. Although the resistance loci have been located on all nine LGs except LG 6 (Paran et al., Citation1991; Paran and Michelmore, Citation1993; Maisonneuve et al., Citation1994; Jeuken and Lindhout, Citation2002; Jeuken et al., Citation2008; McHale et al., Citation2009; Zhang et al., Citation2009a; 2009Citationb; Simko et al., Citation2013; Citation2015a; Parra et al., Citation2021), more than half of the loci were in major resistance clusters on LGs 1, 2 and 4 (Simko, Citation2013; Parra et al., Citation2016). These major resistance gene clusters span several Mb and frequently contain NBS-LRR proteins (Meyers et al., Citation1998a; Citation1998b; Parra et al., Citation2016).
Other lettuce diseases caused by fungi or oomycetes, for which resistance genes have been mapped, are powdery mildew (caused by Golovinomyces bolayi, formerly known as G. cichoracearum), anthracnose (Microdochium panattoniana), Verticillium wilt (V. dahliae), lettuce drop (Sclerotinia minor), Fusarium wilt (F. oxysporum f. sp. lactucae), and root downy mildew (Plasmopara lactucae-radicis). Genomic locations have been identified for single resistance genes against V. dahliae race 1—“Vr1” (Hayes et al., Citation2011; Inderbitzin et al., Citation2019; Mamo et al., Citation2019), F. oxysporum race 2—“RRD2” and “qFOL1.2” (Aruga et al., Citation2012, Seki et al., Citation2021), and P. lactucae-radicis—“plr” (Kesseli et al., Citation1993), and for QTLs involved in resistance against V. dahliae race 2 (Sandoya et al., Citation2021), S. minor (Mamo et al., Citation2019), G. bolayi (Simko et al., Citation2014b), F. oxysporum race 1 (Michelmore et al., Citation2010), and M. panattoniana (McHale et al., Citation2009).
Lettuce loci for resistance against bacterial pathogens have been identified for corky root (Sphingomonas suberifaciens) strain CA1—“cor” (Moreno-Vázquez et al., Citation2003), and bacterial leaf spot (Xanthomonas hortorum pv. lactucae formerly known as X. campestris pv. vitians) including both race-specific resistance genes “Xar1” (Hayes et al., Citation2014b) and “Xcvr” (Wang et al., Citation2016a) and QTLs for quantitative resistance (Lu et al., Citation2014; Sandoya et al., Citation2019). Loci for resistance to viral diseases have been identified for lettuce mosaic virus (LMV)—“mo1” (Nicaise et al., Citation2003) and Mo-2 (McHale et al., Citation2009), lettuce dieback caused by tomato bushy stunt virus (TBSV), and lettuce necrotic stunt virus (LNSV)—“Tvr1” (Grube et al., Citation2005; Simko et al., Citation2009), turnip mosaic virus (TuMV)—“Tu” (Montesclaros et al., Citation1997), and big vein caused by mirafiori lettuce big-vein virus (MLBVV)—several QTLs (Hayes et al., Citation2010; Michelmore, Citation2010). Loci for resistance to insects have also been identified for lettuce root aphid (Pemphigus bursarius)—“Ra” (Wroblewski et al., Citation2007), currant-lettuce aphid (Nasonovia ribisnigri) (Walley et al., Citation2017), and leafminer (Liriomyza trifolii) (Kandel et al., Citation2021).
Several studies have been conducted to identify loci associated with post-harvest lettuce qualities, including the rate of salad deterioration in MAP (Hayes et al., Citation2014a; Simko et al., Citation2018; Sthapit Kandel et al., Citation2020), pinking, browning, overall discoloration (Atkinson et al., Citation2013), and shelf life (Zhang et al., Citation2007). In addition, many loci have been identified contributing to plant phenotypic appearance, and overall performance, including content of chlorophylls, anthocyanins, carotenoids, phenolics, and antioxidants (Waycott et al., Citation1999; Zhang et al., Citation2007; Citation2017; Hayashi et al., Citation2012; Kwon et al., Citation2013; Damerum et al., Citation2015; Simko et al., Citation2016; Mamo et al., Citation2019), flower and seed color (Waycott et al., Citation1999; Kwon et al., Citation2013; Simko et al., Citation2013; Wang et al., Citation2016a), plant developmental rate, bolting and flowering (Michelmore, Citation2009; Hartman et al., Citation2012; Citation2013; Kwon et al., Citation2013; Mamo et al., Citation2019; Han et al., Citation2021; Rosental et al., Citation2021), leaf morphology (Michelmore, Citation2009; Kwon et al., Citation2013; Bell et al., Citation2015), spines (Wei et al., Citation2021) and biophysical properties (Zhang et al., Citation2007), plant dwarf phenotype (Waycott et al., Citation1999), biomass production and yield (Hartman et al., Citation2012; Uwimana et al., Citation2012; Sthapit Kandel et al., Citation2020), hybrid fitness (Hartman et al., Citation2013), seed shattering (Wei et al., Citation2021), germination and longevity (Argyris et al., Citation2005; Hayashi et al., Citation2008; Schwember and Bradford, Citation2010a; Citation2010b; Hartman et al., Citation2012), root architecture (Johnson et al., Citation2000), plant adaptability to drought and salinity (Hartman et al., Citation2014; Kumar et al., Citation2021), nitrogen and water use efficiency (Kerbiriou et al., Citation2016; Macias-González et al., Citation2021), sensitivity to triforine containing pesticides (Simko et al., Citation2011), and resistance to tipburn (Jenni et al., Citation2013; Macias-González et al., Citation2019).
C. Marker-assisted selection and genomic selection
Lettuce has benefited from the application of new technologies to identify markers linked to genes or QTLs of interest and to develop assays for MAS in breeding programs. Because lettuce cultivars of different horticultural types are genetically separated into distinct subpopulations (Simko and Hu, Citation2008; Kwon et al., Citation2013; Rauscher and Simko, Citation2013; Zhang et al., Citation2017), a substantial consideration should be given to developing MAS assays that work across all types of lettuce, not only within specific types from which loci and markers were identified.
Publicly available molecular marker-assays have been developed to detect race-specific alleles associated with resistance to downy mildew—“Dm1,” “Dm3,” “Dm17,” and “Dm18” (Paran and Michelmore, Citation1993; Maisonneuve et al., Citation1994), corky root strain CA1—“cor” (Moreno-Vázquez et al., Citation2003; Simko, Citation2013), LMV—“mo-11” and “mo-12” (Nicaise et al., Citation2003; Simko, Citation2013), Fusarium wilt race 2—“RRD2” and “qFOL1.2” (Aruga et al., Citation2012, Seki et al., Citation2021), Verticillium wilt race 1—“Vr1” (Inderbitzin et al., Citation2019), and lettuce dieback—“Tvr1” (Simko et al., Citation2009). Assays also have been developed for SNP alleles which would reliably predict the rate of salad deterioration in MAP—“qSL4” (Simko et al., Citation2018). Additional marker assays developed by the private sector for MAS in lettuce are not publicly available due to competing interests among companies (Simko, Citation2013) or patent protection (Thabuis et al., Citation2013; Walley et al., Citation2017). As to genomic selection in lettuce, limited testing has been performed using data for polygenic resistance to DM and a single gene (“qSL4”) associated with salad deterioration (Hadasch et al., Citation2016). The results indicated that while for resistance to DM the genomic prediction model outperformed the MAS model, the predictive ability of the genomic prediction model for salad deterioration was significantly lower than that for the model based on QTL-linked markers (Hadasch et al., Citation2016).
Besides using molecular markers for gene mapping, identifying population structure, and MAS assays, molecular markers have also been applied for lettuce cultivar fingerprinting (Rauscher and Simko, Citation2013; Zhou et al., Citation2019) and hybrids identification (Lebeda et al., Citation2007, Patella et al., Citation2019a). Assays based on molecular markers could also be used to detect adulteration (Simko, Citation2016), though this type of product analysis has not yet been reported in lettuce.
D. Future outlook
As our understanding of genes involved in lettuce coloration improves, the development of lettuce germplasm with customized leaf color (Simko, Citation2020b) will become possible. A growing number of resistance genes from wild Lactuca species (Lebeda et al., Citation2014) will be introgressed into cultivated lettuce. Further detailed study of the lettuce genome is expected to lead to faster development of MAS assays, not only for monogenic traits but also traits that are inherited polygenically. As to DM, the most important disease of lettuce, molecular markers have been identified for both major resistance Dm-genes and QTLs. To develop cultivars with improved and more durable resistance to DM, molecular markers should be used to facilitate the pyramiding of major resistance genes as well as QTLs in individual genotypes. An alternative approach to developing lettuce cultivars with effective resistance to DM (and/or other pathogens) is the use of host-induced gene silencing (HIGS) approach, in which small interfering RNAs (siRNAs) produced in the host plant move into the pathogen where they silence its vital genes. In a recent study, the stable transgenic lettuce plants expressing siRNAs targeting vital genes of B. lactucae successfully reduced both growths of the pathogen and inhibited its sporulation (Govindarajulu et al., Citation2015). Studies have also been performed to modify the lettuce genome using the CRISPR/Cas9 technology (Bertier et al., Citation2018; Zhang et al., Citation2018a), which could be applied in the future to develop cultivars with more durable resistances. A combination of novel genome editing tools with the recent progress in automated plant phenotyping (Araus and Cairns, Citation2014; Simko et al., Citation2017) is expected to speed up the process of developing lettuce cultivars and breeding lines with desired sets of traits.
One of the most challenging issues currently facing the lettuce industry is minimizing foodborne disease outbreaks associated with lettuce products. Studies have been performed to identify plant factors associated with the growth and survival of human enteric pathogens, such as Escherichia coli and Salmonella enterica, on lettuce (Simko et al., Citation2015b; Jacob and Melotto, Citation2019). It is anticipated that molecular markers linked to heritable traits associated with the reduction of harmful human pathogen cells on plants will be used to develop cultivars with a reduced risk of contamination while maintaining lettuce quality and overall performance. Food safety can also be improved by supporting plant phyllosphere that minimizes survival of human enteric pathogens. Because the plant genotype plays a vital role in the composition of microbial communities, more comprehensive knowledge of the lettuce genome will likely allow dissection of a complex relationship between plant phenotypes, microbial communities of phyllosphere, and rhizosphere, and pathogens and pests living in the lettuce habitat.
VI. Spinach
The cultivated spinach (Spinacia oleracea L.), a member of the amaranth family (Amaranthaceae), is an annual, diploid (2n = 2x = 12), dioecious, and highly heterozygous and heterogeneous species. The worldwide annual production of this leafy vegetable is ∼30.1 million metric tons, with China producing ∼91% of the total (FAOSTAT, Citation2020). The United States is the second-largest spinach producer, with an annual production of 0.44 million metric tons. Mild summer and fall temperatures in California and mild winter temperatures in Arizona assure year-round fresh spinach production, contributing to ∼90% of the U.S. production, with New Jersey and Texas being the other two prominent spinach producing states (USDA-NASS, Citation2019).
Spinach is a highly nutritious leafy green vegetable containing high amounts of proteins, vitamins, minerals, and flavonoids, and is low in calories (Cao et al., Citation1996; Howard et al., Citation2002). Further, spinach is a rich source of iron, lutein, folate, and carotenoids (Bunea et al., Citation2008; USDA-ARS, Citation2020), and with a high level of antioxidants and phenolic compounds (Howard et al., Citation2002; Yosefi et al., Citation2010) it is considered a superior food for human health. Spinach is consumed fresh or cooked and is often mixed with other foods. Due to its presumed health benefits, the demand for FM spinach consumption has doubled in the U.S. during the past decade (USDA-NASS, Citation2016).
Morphological variation in the leaf shape and structure classifies spinach as savoy, semi-savoy, and flat (or smooth). Savoy cultivars have wrinkles on the leaves, semi-savoy have reduced wrinkles, while the flat cultivars lack wrinkles. Spinach plants are sensitive to photoperiod and temperature, bolting earlier at long days and high summer temperatures (Morelock and Correll, Citation2007). Spinach is a dioecious species; however, plant sex determination is not visually possible at the early stages of plant development. Occasionally, also monoecious plants with both pistillate and staminate flowers on the same stock may appear (Janick and Stevenson, Citation1955; Iizuka and Janick, Citation1971).
Spinach is native to central and southwest Asia (Rubatzky and Yamaguchi, Citation1997). Its domestication occurred in the current Iran area and was later introduced to eastern Asia and western Europe. The two wild species S. turkestanica Iljin. and S. tetrandra ex M. Bieb. are found in Central Asia surrounding the Caspian Sea (northern Iran), which further supports the origin and domestication of the cultivated spinach (Ribera et al., Citation2020a). All of the three known Spinacia species are inter-fertile. Phylogenetic analysis of the three species following transcriptome sequence analysis revealed that S. oleracea is genetically closer to S. turkestanica than S. tetrandra (Xu et al., Citation2017a). This study further indicated that S. turkestanica was the wild ancestor of the cultivated species. Recent genetic analysis of the cultivated and two wild species demonstrated a higher genetic variation within S. turkestanica than S. tetrandra and confirmed that the S. turkestanica accessions were genetically closer to S. oleracea landraces (Ribera et al., Citation2020a).
Worldwide increased demand for spinach due to its high nutrition and health benefitting compounds has raised attention to genetics and breeding studies of this vegetable. A wealth of spinach genomic resources has been developed in recent years, including reference genome assembly, transcriptome sequences, and genotype data for the germplasm panel. Because the downy mildew disease, caused by obligate oomycete pathogen Peronospora effusa (Pfs), is continually and severely affecting spinach production, substantial attention is given to use host plant resistance to improve disease management strategies. Considerable interest in spinach biofortification exists due to a high content of nutrient and health benefitting compounds in spinach compared to other vegetable crops. Expansion of spinach production into the new area using new production practices (e.g., hydroponics and vertical farming) may ensure a rapid and continuous supply of locally grown, fresh green vegetables in the metropolitan regions, and possibly lead to an additional increase in the consumption of this nutrient-rich vegetable.
A. Genetic resources
More than 2,000 spinach accessions are maintained in the International Spinach Database (https://ecpgr.cgn.wur.nl/LVintro/spinach/). Around 400 accessions, mainly comprising S. oleracea cultivars, landraces, and breeding lines, are available at the USDA-ARS North Central Regional Plant Introduction Station in Ames, Iowa. Recent germplasm collection expeditions of the center of Genetic variation, the Netherlands (CGN) have added 89 S. turkestanica and 49 S. tetrandra accessions to the already existing germplasm in genebanks (van Treuren et al., Citation2020; Ribera et al., Citation2020b). Genetic diversity of spinach germplasm, assessed by SSR markers (Khattak et al., Citation2007; Kuwahara et al., Citation2014) and target region amplification polymorphism (TRAP) markers (Hu et al., Citation2007), grouped the accessions mainly according to their geographic origins. These studies indicated a higher genetic diversity among western Asia accessions and a narrow genetic divergence between the wild and cultivated Spinacia species. Subsequently, SNP markers were used to characterize the genetic diversity of 343 spinach accessions, including 268 USDA germplasm, 45 commercial cultivars, and 30 University of Arkansas breeding genotypes (Shi et al., Citation2017). This study reported a broad genetic diversity among the spinach accessions divided into subpopulation structures according to their geographic origin in Asia, Europe, and America. A recent genetic diversity assessment of the cultivated and wild spinach accessions revealed that S. turkestanica was evolutionary closer to S. oleracea than S. tetrandra (Ribera et al., Citation2020a). Most recently, SNP genotyping of a panel of 76 S. turkestanica, 16 S. oleracea, and 4 S. tetrandra accessions revealed a substantial differentiation of S. tetrandra genotypes from the S. oleracea. Based on the high genetic similarity between S. turkestanica and S. oleracea species it was concluded that S. turkestanica is the immediate progenitor of cultivated spinach.
Spinach germplasm resources, especially the wild Spinacia accessions, are excellent sources for spinach breeding (van Treuren et al., Citation2020). The wild spinach species have been widely utilized to identify resistance against the spinach DM pathogen and incorporate resistant alleles into commercial cultivars. The wild spinach germplasm has been evaluated for numerous desirable traits, including nutrient contents, oxalate content (Mou, Citation2008b), leaf miner resistance (Mou, Citation2008a), leaf spot resistance (Mou et al., Citation2008), and DM resistance (Brandenberger et al., Citation1992). The presence of a wide range of phenotypic variation for several traits indicates the potential value of the available genetic variation for future spinach crop improvement.
The size of the spinach genome is estimated to be ∼989 Mb (Arumuganathan and Earle, Citation1991). The first genome sequence of spinach was recently assembled (498 Mb) and annotated (Dohm et al., Citation2014; Minoche et al., Citation2015). Additional transcriptome sequencing of all three Spinacia species (S. oleracea, S. turkestanica, and S. tetrandra) improved the annotation and gene ontology (GO) assignments (Xu et al., Citation2015). Currently, the whole genome sequence assemblies are available for two spinach accessions, Sp75 and Viroflay. The genome of inbred spinach line Sp75 was assembled to 996 Mb and annotated using the whole genome shotgun approach combined with BioNano Genomics optical maps. The scaffolds were anchored using a high-density genetic map (Xu et al., Citation2017a). The six LGs corresponding to six chromosomes covered 463.4 Mb, constituting 47% of the assembled genome. The transcriptome of 120 cultivated and wild Spinacia accessions were sequenced and annotated, predicting 25,495 protein-coding genes, including 139 NBS-LRR genes known to be involved in plant disease resistance (Xu et al., Citation2017a). The study provided novel information on SNP variants and gene expression profiles and insights into spinach evolution and domestication-related traits (Xu et al., Citation2017a; Collins et al., Citation2019). Furthermore, genome assembly of spinach cultivar Viroflay was recently completed using long-read sequencing technology (https://phytozome-next.jgi.doe.gov/info/Soleracea_Spov3) (Hulse-Kemp et al., Citation2021). The genome assembly comprises 913.5 Mb, with the six main pseudomolecules representing 745 Mb (81.6% of the genome). Genome annotation predicted 34,877 genes in spinach, of which 1,004 were annotated as the disease resistance genes. A complete report of the Viroflay genome is expected to be available shortly. In addition, the genome of 30 spinach cultivars and the near-isogenic lines (NIL) were sequenced at a depth of 30× using the paired-end Illumina approach (Bhattarai et al., Citation2021a), and 480 USDA accessions and commercial cultivars have been re-sequenced at the 10× depth (Shi et al., Citation2019). Efforts are underway to generate reference genomes for wild spinach S. turkestanica and S. tetrandra accessions and re-sequence the wild Spinacia accessions (Ribera et al., Citation2020a). The available reference genome assembly for two accessions and the resequencing data for hundreds of accessions in recent years has facilitated studying and characterizing the genetic and molecular basis of important spinach traits. These new data will add to the existing genomic resources and platforms that can be used to develop effective molecular breeding strategies for spinach.
B. Mapped genes and QTLs
Limited molecular and trait mapping research was performed in spinach until recently, compared to other vegetable crops. Previous molecular genetic studies mainly focused on marker development, genetic diversity studies, genetic mapping, and mapping of disease resistance and sex determination traits. Downy mildew disease caused P. effusa makes spinach unmarketable, thus making DM a major threat to sustainable baby leaf spinach production. The disease can have a particularly devastating effect on organic production that makes up half of the total baby leaf production. Spinach resistance to P. effusa is controlled by genes and loci with both qualitative and quantitative effects (Brandenberger, Citation1991; Irish et al., Citation2003; Correll et al., Citation2011). The identification, mapping, and introgression of major genes are the primary focus of DM resistance breeding in spinach (). Six RPF loci, each providing resistance to multiple races, were hypothesized to provide resistance to all known races of P. effusa (Correll et al., Citation2011). Initial mapping of the RPF1 locus identified Dm1 marker linked at 1.7 cM on chromosome 3 (Irish et al., Citation2008). Later, the 5B14r marker designed from the BAC-end sequences derived putative resistant gene analog (RGA) was reported to lie 1.7 cM from the RPF1 locus and co-segregating with Dm1 marker (Feng et al., Citation2015). Three RPF loci (RPF1, RPF2, and RPF3) were mapped to a 1.5 Mb region of chromosome 3 from three segregating populations and several co-dominant PCR-based diagnostic markers were identified that could distinguish these loci (Feng et al., Citation2018a). Based on disease reactions, a genotype containing RPF1, RPF2, and RPF3 loci would be resistant to races 1-16 of P. effusa (Feng et al., Citation2018b). However, such introgression in a single line has not yet been achieved, as the three RPF loci detected in three different genotypes are either very closely linked or are allelic.
Table 5. Major genes and QTLs positioned on the molecular linkage map of spinach (Spinacia oleracea).
Annotation of spinach genome identified a total of 139 NBS-LRR genes that are involved in resistance against pathogens, of which five genes likely to be involved in resistance against DM disease were predicted to be located close to the Dm1 marker region (Xu et al., Citation2017a). The RPF1 locus location was narrowed down to ∼0.37—1.12 Mb region, with three candidate genes potentially controlling the resistance (She et al., Citation2018). Multi-parent cross populations screened with race 13 of P. effusa identified resistance-associated SNP markers located within 0.39—1.20 Mb of chromosome 3 containing the three RPF resistance loci (Bhattarai et al., Citation2020a). An association analysis performed on another population identified six SNP markers on chromosome 3 to be located within 0.66—1.23 Mb, providing resistance against race 16 of P. effusa (Bhattarai, Citation2019; Bhattarai et al., Citation2021b). All major resistance loci mapped so far have been detected only on the proximal end of chromosome 3. Besides major resistance genes, minor genes and QTLs have been reported following GWAS analysis in the USDA germplasm panel screened with natural pathogen populations in the field condition across years and locations (Bhattarai, Citation2019; Bhattarai et al., Citation2020d). Recently, RNA-seq analysis of resistant and susceptible cultivars inoculated with P. effusa identified potential genes associated with resistance and provided an insight into the molecular mechanism of resistance control (Kandel et al., Citation2020). Additional RNA-seq projects are in progress to elucidate the host-pathogen interactions using different races of P. effusa. These investigations aim to improve our understanding of the genetic mechanism, genes and pathways underlying resistance to P. effusa and to develop improved management strategies against downy mildew disease.
Spinach is primarily a dioecious species, but monoecious lines are infrequently found with varying proportions of male, female and hermaphrodite flowers (Janick and Stevenson, Citation1955; Onodera et al., Citation2008). The first framework genetic map assigned the sex determination locus to the LG 3, located at 1.9 cM from the SSR marker “SO4” (Khattak et al., Citation2006). A major gene for the monoecy was mapped to a 13.4 cM region around the Y locus, positioning the monoecious gene (Xm) to 4.3 cM from the SO4 marker (Onodera et al., Citation2011). A later study confirmed that the monoecious gene (Xm) is not allelic but linked to the dioecious locus (X/Y), and identified markers closely linked to the gene (Yamamoto et al., Citation2014). In contrast to earlier reports, more recent studies mapped the dioecious sex determination locus (X/Y) to two regions (66.98—69.72 and 75.48—92.96 cM) on LG 4 (Qian et al., Citation2017). A follow-up study positioned the male-specific locus to the 21 Kb region (58.76—58.78 Mb) on chromosome 4 and described a KASP-based marker assay (SponR) that can distinguish the XX, XY, and YY plants (She et al., Citation2021). Markers developed to distinguish sex forms in spinach allow early selection of desirable plants, thus increasing breeding efficiency.
Genetic maps using GBS markers were used to map QTLs for leaf color in spinach (Cai et al., Citation2018). Another study constructed linkage maps and identified QTLs for growth under low nitrogen conditions to improve nitrogen use efficiency (NUE) (Chan-Navarrete et al., Citation2016). RNA-seq approach was used to characterize genes expressed in spinach root and leaf in response to nitrogen stress and identified molecular mechanisms and pathways involved in nitrogen use efficiency (Joshi et al., Citation2020). Around 400 USDA accessions and commercial cultivars were genotyped using GBS (Shi et al., Citation2017). Genome-wide association studies performed on this set of accessions identified SNP region associated with leaf surface texture, petiole color, and edge shape (Ma et al., Citation2016), earliness of bolting, plant height, and erect leaf traits (Chitwood et al., Citation2016), low oxalate content (Shi et al., Citation2016b), mineral composition (Qin et al., Citation2017), and vitamin C content (Kunz et al., Citation2020). Additional analyses of this germplasm panel revealed genomic locations of resistance loci against leafminer (Liriomyza spp.) (Shi et al., Citation2016a), Verticillium wilt caused by race 2 (isolate So 923) of V. dahliae Kleb. (Shi et al., Citation2016d), leaf spot disease caused by Stemphylium botryosum (Shi et al., Citation2016c) and S. vesicarium (Bhattarai et al., Citation2020b), anthracnose disease caused by Colletotrichum dematium (Awika et al., Citation2020), white rust caused by Albugo occidentalis (Awika et al., Citation2019), Fusarium wilt caused by Fusarium oxysporum f. sp. spinaciae (Fos) (Gyawali et al., Citation2019), and the diseases caused by Pythium species (ongoing project).
C. Marker-assisted selection and genomic selection
The major limitations to FM spinach production are diseases, particularly DM, Fusarium wilt, white rust, and leaf spot. Therefore, the major goal of spinach breeding is to develop cultivars with improved disease resistance, as well as with tolerance to abiotic stresses, slow bolting, improved yield, and quality, increased levels of beneficial nutrients, and decreased levels of nitrate, oxalate, and cadmium (Morelock and Correll, Citation2007; Andersen and Torp, Citation2011; Correll et al., Citation2011). Despite beneficial nutrients, spinach contains a relatively large amount of oxalic acid (Mou, Citation2008b) that may convert to calcium oxalate in the human body leading to kidney stones (Noonan and Savage, Citation1999). Further, spinach may take up a high level of cadmium from the soil, which can lead to a variety of adverse effects on human health. However, efforts are underway to identify germplasm with a low concentration of cadmium in the plant and determine the genetic basis of cadmium uptake and accumulation (Greenhut, Citation2018).
The molecular and functional genomics research in spinach has progressed in recent years. Studies have focused on investigations of the cultivated and wild genetic resources using molecular markers to determine genetic diversity, population structure, and developing fingerprinting assays (Shi et al., Citation2017; van Treuren et al., Citation2020; Ribera et al., Citation2020a; Citation2020b; Bhattarai et al., Citation2021). Regarding plant disease resistance, genetic research has focused primarily on DM, the disease that causes the largest economic losses in spinach production. Markers linked to DM resistance genes suitable for MAS have been reported (Irish et al., Citation2008; Feng et al., Citation2018a; Bhattarai et al., Citation2020a), and assays developed using these markers would be preferred by breeding programs compared with the currently used labor-intensive disease screening (Feng et al., Citation2014; Bhattarai et al., Citation2020c). Current commercial spinach cultivars are mostly hybrids produced from true monoecious lines (Yamamoto et al., Citation2014; Janick, Citation2015). Several studies have examined the genetic control of sex in spinach and identified markers to determine it, which may help in the selection process. Molecular markers associated with several biotic and abiotic stresses, plant morphology, nutritional and health contents have been reported; however, they have not been tested and validated and practical marker-assays are yet to be developed. Genomic selection has not been utilized in spinach breeding though several phenotypes evaluated in the USDA germplasm panels are being explored for GS assessment. The recent upsurge of whole-genome sequence data for spinach germplasm has resulted in millions of SNP markers (Shi et al., Citation2019) that can be used for GWAS and GS studies and to develop effective molecular breeding strategies.
D. Future outlook
The demand for spinach is growing in the U.S. and worldwide owing to consumers’ increased interest in a healthier diet. To meet the growing demand and sustainable production, the breeding of spinach has focused on improving spinach yield and quality, disease resistance, abiotic stress tolerance, slow bolting, increasing the content of beneficial nutrients while minimizing the content of undesirable compounds. The Spinacia germplasm is diverse and offers excellent resources for identifying new traits, particularly for resistance to diseases and insects (van Treuren et al., Citation2020; Ribera et al., Citation2020b). The rapid emergence of new DM races remains the most critical challenge, needing an improved understanding of the mechanism regulating susceptibility and resistance. Long-term goals are to develop strategies to optimize the use of host resistance by exploiting all qualitative, quantitative, and susceptibility factors to manage DM and to achieve sustainable and profitable spinach production. Current spinach DM research efforts are focused on detailed characterization of host-pathogen interactions, identifying and mapping qualitative and quantitative resistances, functional tests of RPF loci by knocking down the RPF genes for potential susceptibility and/or transforming the susceptible lines with the resistant alleles, and characterization of effector genes. Future studies are expected to integrate phenotypic data with molecular and genomic data to identify genes and pathways involved in disease resistance and provide more detailed insights into resistance mechanisms. Identifying functional gene-based markers that are now possible with new genomic data should allow efficient stacking of multiple DM-resistant RPF genes in a single cultivar.
Further exploration of phenotypic and genetic variation among the diverse genetic resources (germplasm accessions, landraces, and wild accessions) will allow identifying novel traits, alleles, and genes. A combination of GWAS, linkage mapping, comparative genomics, and pan genomics studies will help to detect QTL regions and candidate genes involved in regulating traits. However, more efficient genetic transformation and gene editing systems in spinach are still needed to verify detected loci, characterize gene functions, and remove deleterious and introduce beneficial alleles. Targeted approaches are set to understand the mechanism of trait controls. Simultaneously, MAS and GS methods being optimized show promises in breeding superior spinach cultivars with desirable traits in near future.
VII. Cucumber
Cucumber, Cucumis sativus L. (2n = 2x = 14, family Cucurbitaceae), is among the most cultivated and consumed vegetable crops in the world. In 2018, cucumber was harvested from ∼1.98 million hectares of land with a total production of 75.22 million metric tons. The top five producers are China, Iran, Russia, Turkey, and the U.S. (FAOSTAT, Citation2020). There are ∼50 species in the genus Cucumis, including melon (C. melo L., 2n = 2x = 24) and the sister species of cucumber C. hystrix (2n = 2x = 24), which were diverged from the cucumber lineage ∼10 and 5 MYA, respectively (Sebastian et al., Citation2010; Yang et al., Citation2014). Cucumis hystrix is the only known species in the genus Cucumis that is sexually compatible with cucumber (Chen et al., Citation1997; Han et al., Citation2016b) and could be considered a secondary gene pool for cucumber breeding.
The primary gene pool of cucumber consists of four cross-compatible botanical varieties, the cultivated cucumber (C. sativus var. sativus), the wild cucumber (C. sativus var. hardwickii), the semi-wild Xishuangbanna (XIS) cucumber (C. sativus var. xishuangbannanesis), and the Sikkim cucumber (C. sativus L. var. sikkimensis). The wild cucumber is widely distributed in south and southeastern Asian countries with significant differentiation from other three taxa, and is the progenitor from which modern cucumbers were domesticated (Yang et al., Citation2012). The semi-wild XIS cucumber from Southwest China and surrounding regions exhibit some unique traits, such as very large fruit, orange flesh color due to accumulation of high levels of β-carotene, late flowering, and strong seed dormancy in some accessions, which are likely the results of diversifying selection after cucumber domestication (Qi et al., Citation1983; Bo et al., Citation2012, Citation2015; Pan et al., Citation2017). The Sikkim cucumber is distributed mainly in the Sikkim region of India and Nepal, which is featured with black spine, brown fruit with fine and heavy netting, and large hollow in mature fruit. The Sikkim cucumber could be considered as an ecotype of the cultivated cucumber that was under selection for local adaptation (Wang et al., Citation2021).
India is the center of cucumber diversity where it has been cultivated for at least 3,000 years (Candolle, Citation1959; Sebastian et al., Citation2010). Cucumber spread eastward to China ∼2,000 YAGO, and westward to Europe ∼1,500—700 YAGO (Keng, Citation1973; Paris et al., Citation2012; reviewed in Weng, Citation2021). Since its dispersal from India, natural and human selections have reshaped the cucumber, resulting in many ecotypes or landraces with adaptation to local climates, production systems, specific processing requirements, and consumer preferences. Cucumbers in different geographic regions are morphologically diverse in fruit size, skin color and texture, fruit firmness, crispness, and taste (Wehner, Citation1989), all resulted from selections to accommodate fresh consumption or processing (pickles). Modern cucumber breeding has intensified the divisions between the two types, resulting in several market classes adapting to large-scale commercial production in diverse environments for various purposes (Weng, Citation2021). Commercial cucumber breeding has also resulted in genetic erosion, and each market type seems to have a very narrow genetic base (Dijkhuizen et al., Citation1996). Hundreds of cucumber accessions are preserved in several major gene banks across the world (Weng and Sun, Citation2011). Molecular marker analysis of these accessions reveals that only a small portion of genetic diversity in cucumber from the diversity center is present in land races or commercial cultivars from other regions (Lv et al., Citation2012; Qi et al., Citation2013; Wang et al., Citation2018a); this observation suggests that gene bank collections remain a valuable source of genetic variation for future cucumber breeding.
A. Genetic and genomic resources
As a minor specialty crop, previously limited genetic and genomic resources were available as compared with many major horticultural and field crops. Recent advances in technology and instrumentation for genome sequencing, however, have provided exciting opportunities to expedite cucumber genetic and breeding research. Among major horticultural crops, cucumber was the first with a publicly available draft genome sequence, which was for genotype “9930,” a Chinese Long type (Huang et al., Citation2009; Li et al., Citation2011). Subsequently, three more cucumber genomes were sequenced, including the North European pickling type variety B10 (v1.0), the U.S. pickling inbred line Gy14 (v1.0), and the wild accession PI 193967 (Wóycicki et al., Citation2011; Yang et al., Citation2012; Qi et al., 2013). The initial assemblies, using Illumina or 454 sequencing technologies, varied with some issues, such as low continuity, limited coverage (∼55% of the 367 Mb genome), and poor genome annotation. New versions of the 9903 (v3.0) and B10 (v3.0) genomes, however, have recently been released (Li et al., Citation2019b; Osipowski et al., Citation2020). The 9930 v3.0 draft genome has 211 Mb in seven pseudomolecules, with 24,317 annotated genes, estimated 37.7% repetitive sequences, and an N50 contig/scaffold size of 8.9/31.1 Mb (Li et al., Citation2019b). This has been a significant improvement as compared with the 9930 v2.0 genome assembly. The genome coverage of 9930 v3.0 assembly, however, is only ∼60% complete, suggesting the presence of complex repetitive DNA sequences that are intractable despite the use of state-of-the-art sequencing technologies. Nonetheless, all the current assemblies do likely contain the majority of the coding regions of the cucumber genome, facilitating the development of molecular markers and linkage maps to help with genetic studies and molecular breeding. During the past decade, several high-density genetic maps of cucumber have been developed (Ren et al., Citation2009; Cavagnaro et al., Citation2010; Yang et al., Citation2013; Rubinstein et al., Citation2015; Zhou et al., Citation2015), and more than 300 cucumber lines re-sequenced (Qi et al., 2013; Bo et al., Citation2016; Liu et al., Citation2019a). Further, over 1,200 cucumber accessions in the USDA national germplasm collection have been genotyped using GBS technology, resulting in the public availability of hundreds of thousands of molecular markers (Wang et al., Citation2018a).
B. Mapped genes and QTLs, and marker-assisted selection
The availability of draft genome sequences coupled with cost-effective high-throughput genome sequencing and genotyping technologies have greatly expedited molecular mapping and QTL analysis in cucumber. Further, the relatively small genome size with no recent whole-genome duplication (Huang et al., 2009) and the annual growth habit with a relatively short life cycle (2-3 months from seed to seed) offer great advantages for genetic studies in cucumber (Weng, Citation2016). Indeed, we have witnessed the exponential growth of cucumber publications in this field. For example, the most recent Cucumber Gene Catalog (Weng and Wehner, Citation2017) documented 199 genes or major-effect QTLs, of which 70 were added since 2009 when the first draft genome of cucumber was released. From among cucumber genes described in the 2010 gene catalog, only a few had known chromosomal locations and only one had a known candidate gene, the femaleness (F) locus coding the 1-aminocyclopropane-1-carboxylate synthase in the ethylene biosynthesis pathway. Recently, Wang et al. (Citation2019a) conducted an extensive literature review of the mutants, genes, and QTLs that were genetically mapped or characterized in cucumber. They documented 81 simply inherited major genes and QTLs that were cloned or fine mapped. For each gene, detailed information was presented including chromosomal locations, allelic variants and associated polymorphisms, predicted functions, and linked markers that could be used for MAS in cucumber breeding (). They also documented 322 QTLs for 42 quantitative traits, including 109 for resistances against seven pathogens. Further, through collaborative efforts among public cucumber researchers and commercial breeders, the authors identified 130 quantitative traits and developed a set of recommendations for QTL nomenclature for these traits in cucumber (Wang et al., Citation2019c).
Table 6. Major genes and QTLs for disease resistance traits in cucumber (Cucumis sativus).
Pan et al. (Citation2020a) reviewed QTLs identified previously for fruit size, shape, and weight in cucumber, melon, and watermelon, and from which they identified 150 consensus QTLs. Additionally, the authors identified 253 homologs of eight classes of fruit or grain size/weight-related genes cloned in other plant species, which revealed the widespread structure and function conservation of fruit size/shape gene homologs in cucurbits. The rapid progress in mapping and cloning of genes/QTLs in cucumber is reflected in a large number of publications in this field. The aforementioned two recent reviews (Wang et al., Citation2019c; Pan et al., Citation2020a) included the literature until June 2019. In 2019 alone, more than 20 studies were published that reported identification of new candidate genes for simply inherited mutants or QTLs in cucumber. These publications covered a variety of traits, such as resistance to cucumber vein yellowing virus (CVYV), powdery mildew and angular leaf spot (Pujol et al., Citation2019; Zhang et al., Citation2020a; Citation2020b; Citation2021), tolerance to abiotic stresses (heat and cold) (Dong et al., Citation2019; Citation2020; Wang et al., Citation2019b), plant architecture (Wen et al., Citation2019a; Njogu et al., Citation2020), flowering time, fruit size, shape, skin features, pedicel direction, and internal quality attributes (Rett-Cadman et al., Citation2019; Sun et al., Citation2019; Zhang et al., Citation2019, Citation2020b; Gao et al., Citation2020; Sheng et al., Citation2020; Song et al., Citation2020; Pan et al., Citation2020b; Wang et al., Citation2020a; Citation2020b; Wang et al., Citation2021), and leaf color and shape mutations (Ding et al., Citation2019; Liu et al., Citation2019; Hu et al., Citation2020).
A large number of molecular markers developed for horticulturally-important traits facilitate MAS breeding in cucumber (Wang et al., Citation2019c; Feng et al., Citation2020; Hao et al., Citation2020). MAS and QTL pyramiding is of particular importance in breeding for multiple disease resistance in cucumber, traits that are often controlled by multiple, recessively-inherited QTLs (Wang et al., Citation2019c). This is especially true for international vegetable seed companies, which routinely conduct MAS in cucumber breeding.
C. Future outlook
The availability of genomic and genetic resources in cucumber is revolutionizing cucumber genetic studies and breeding activities, though many challenges remain. The newest genome assembly (9930 v3.0) covers only ∼60% of the cucumber genome. A genome assembly with better coverage and annotation is needed. A large amount of genomic data is being continuously accumulated; however, it is challenging to analyze these data and establish sequence-trait associations. Numerous genes and QTLs for horticulturally important traits have been reported, yet many of them have not been validated in different genetic backgrounds or environments. It is important to continue exploring cucumber germplasm resources for novel resistance genes or alleles to diversify the gene pool and avoid resistance breakdown. Different sources of resistances for the same pathogens, or multiple resistances genes for various pathogens, could be pyramided in new cultivars via MAS. A very limited number of genes or QTLs have been cloned in cucumber, and their functions are largely unknown. Further, a reliable and efficient genetic transformation system is lacking for cucumber, which hinders studies of gene function or editing genes for cucumber improvement.
VIII. Chicory
Chicory (Cichorium intybus L., 2n = 2x = 18) is one of the most popular horticultural crops in the world. Although there are large differences in cultivation techniques and cultural uses, chicory is widely consumed as a leafy vegetable and it is found in almost every corner of the world and included in the diet of most Western and Eastern cultures. It belongs to the Asteraceae, a very large botanical family with ∼23,000 species, subdivided into 1,535 genera and grouped into three subfamilies: Asteroideae, Barnadesioideae, and Cichorioideae (Bremer and Anderberg, Citation1994). In the subfamily Cichorioideae, the tribe Lactuceae includes the genus Cichorium, with different horticultural species recognized according to their origin and uses (Barcaccia et al., Citation2016).
Integrating data from the analysis of morphological descriptors and molecular markers with diffusion, production, and commercial indicators, C. intybus and C. endivia appeared as the two most popular cultivated species (Kiers, Citation2000; Lucchin et al., Citation2008; Barcaccia et al., Citation2016). Considering their taxonomy, within these two distinct species of the genus Cichorium, the subspecies intybus L. and glabratum (C. Presl) Arcang. were recognized for C. intybus, whereas the subspecies endivia Hegi and pumilum (Jacq) Cout. were established for C. endivia L. (Lucchin et al., Citation2008; Barcaccia et al., Citation2016). The botanical varieties and cultivar groups of C. intybus subsp. intybus are several and classified as follows: var. foliosum (Witloof chicory), var. porphyreum (Pain de Sucre), var. latifolium (Radicchio), var. sylvestre (Catalogne), and var. sativum (Root chicory) (Barcaccia et al., Citation2016 and references therein). Within C. intybus, cultivated chicory types are biennial whereas wild chicory types are perennial plants.
Most likely known by the Egyptians as a medicinal plant and used as a vegetable crop by ancient Greeks and the Romans, chicory gradually underwent a process of naturalization in Europe (Lucchin et al., Citation2008 and references therein). Currently, wild C. intybus covers a great portion of the entire European continent, where leafy products from chicory landraces have traditionally become a part of the diet of local populations as an important ingredient of typical local dishes (Lucchin et al., Citation2008; Barcaccia et al., Citation2016). Further, cultivated varieties of the different C. intybus cultivars and biotypes are mainly grown throughout continental Europe, in southwestern Asia, and limited areas of North America, South Africa, and Australia (Barcaccia et al., Citation2016). In horticultural markets, leaf chicory traditionally includes all the cultivar groups whose commercial products are the leaves and used in the short food supply chain (for preparation of both cooked and fresh salads), whereas all the other types, whose commercial products derived from the roots, are destined to either industrial transformation (inulin extracts) or human consumption (coffee substitutes), and are classified as root chicory (Barcaccia et al., Citation2016 and references therein).
Chicory is commonly an allogamous species due to an efficient sporophytic self-incompatibility (SSI) system and consistent entomophilous pollination that favors outcrossing (Barcaccia et al., Citation2003a; Citation2003b; Lucchin et al., Citation2008). Furthermore, hybridization among plants is also promoted by floral morphological barriers that hinder selfing, and physiological mechanisms that boost germination and growth of pollen grains and tubes in case of outcrossing (Lucchin et al., Citation2008; Barcaccia et al., Citation2016). Commercial seeds of OP varieties, synthetic varieties, and F1 hybrids are available on the global chicory market, which is adopted for large-scale farming systems; however, a great proportion of chicory is planted in many small farming units, using seed of local varieties selected and maintained through mass selection by individual farmers (Barcaccia et al., Citation2003b; Patella et al., Citation2019b).
A. Genetic resources
Extensive lists of Cichorium species, subspecies, botanical varieties, and cultivar groups have been published, some of which are accessible via the internet. The most complete repository is through the USDA Germplasm Resources Information Network (GRIN) database (https://www.ars-grin.gov/), in which several hundred accessions are listed. A smaller list is provided in Mansfeld’s World Database of Agricultural and Horticultural Crops developed at IPK in Germany (https://mansfeld.ipk-gatersleben.de/), which includes <100 accessions.
In Italy, where chicory is widely cultivated, especially in the north-eastern regions, for a long time, plant materials grown by farmers were represented by local varieties known to possess variation and adaptation to the natural and anthropological environment where they were originated and still are widely cultivated (Lucchin et al., Citation2008; Barcaccia et al., Citation2016 and references therein). Such local varieties were conserved and multiplied by farmers as OP populations via phenotypic selection, and thus they were highly heterozygous and heterogeneous. Although a considerable range of phenotypic variation within each population was present across all cultivated types, clear genetic differentiation was also noticeable among populations for various traits and molecular markers (Lucchin et al., Citation2008; Barcaccia et al., Citation2016 and references therein).
During the past two decades, the agricultural scenery in the Mediterranean countries has profoundly changed for chicory cultivations, where subsistence mixed farming units have been transformed into extensive farming systems growing mainly modern improved varieties instead of local varieties (i.e., farmer populations). In recent years, professional breeders have developed protocols based on controlled hybridizations among chosen individual plants to obtain genetically improved synthetic varieties showing higher distinctiveness, uniformity, and stability for both agronomic and esthetical characteristics (Barcaccia et al., Citation2003b; Patella et al., Citation2019b). The modern breeding programs aim to isolate individuals within the best local populations for the selection of inbred lines suitable for the production of commercial F1 hybrids (Barcaccia et al., Citation2003b; Patella et al., Citation2019b). These programs are increasingly assisted by the use of molecular markers (Ghedina et al., Citation2015; Galla et al., Citation2016; Patella et al., Citation2019b).
B. Mapped genes and QTLs
Several saturated genetic linkage maps spanning the entire genome (∼2.6 Gb) are available for leaf and root chicory (Cadalen et al., Citation2010; Gonthier et al., Citation2013; Muys et al., Citation2014; Palumbo et al., Citation2019); these maps are highly useful for molecular genetics and breeding studies of chicory. The first genetic linkage map of chicory is of particular interest; it included 431 SSR and 41 STS markers, placed onto its nine LGs covering 878 cM of the genome (Cadalen et al., Citation2010). This consensus map was constructed by the integration and organization of molecular marker data derived from one Witloof and segregating populations of two root chicory. More recently, the first high-density genetic linkage map of chicory was constructed using GBS technology and leaf chicory variety Radicchio (Palumbo et al., Citation2019); this map contained 727 SNP markers assembled into nine LGs covering a total length of 1,413 cM of the genome. The current genetic linkage maps of chicory (Cadalen et al., Citation2010; Gonthier et al., Citation2013; Muys et al., Citation2014; Palumbo et al., Citation2019) represent a starting point for mapping single genes and QTLs (). For example, the maps have been successfully used for fine mapping of self-incompatibility and MS genes (Gonthier et al., Citation2013; Palumbo et al., Citation2019), providing a basis for understanding the genetic control of reproductive barriers in chicory and their applications for the production of F1 hybrids (Barcaccia et al., Citation2016). In root chicory, molecular markers linked to the nuclear male sterility (NMS1) locus (LG 5) and SSI locus (LG 2) were identified (Cadalen et al., Citation2010; Gonthier et al., Citation2013). Similarly, in leaf chicory, two SSR markers were closely linked to another NMS locus (ms1) in the LG 4 (Cadalen et al., Citation2010; Barcaccia and Tiozzo, Citation2012). More recently, several SNP markers were discovered that fully co-segregated with this MS locus (Barcaccia and Tiozzo, Citation2014; Palumbo et al., Citation2019). A subsequent mesosynteny analysis revealed that as many as 10 genomic DNA sequences encompassing the selected SNP variants of chicory mapped in a peripheral region of chromosome 5 of lettuce (L. sativa) spanning about 18 Mb. Overall, these molecular marker data could be used for genotyping plant material and for MAS in leaf chicory breeding.
Table 7. Major genes and QTLs positioned on the molecular linkage map of chicory (Cichorium intybus).
The genetic linkage maps of chicory (Cadalen et al., Citation2010; Palumbo et al., Citation2019) have been essential for the development of robust genotyping methods using SSR and SNP markers (Ghedina et al., Citation2015; Galla et al., Citation2016; Palumbo et al., Citation2019). These methods, including various types of molecular markers, can be effectively used to assess genetic distinctness and population structure of various types of commercial varieties of leaf chicory, such as synthetics, F1 hybrids, and F2 populations (Patella et al., Citation2019b). It is expected that marker genotyping will also find practical utility for evaluating the genetic distinctiveness, uniformity, and stability of seed lots belonging to commercial varieties.
C. Marker-assisted selection and genomic selection
Historically, most cultivated varieties of chicory have been developed using mass selection to obtain uniform populations characterized by high yield and suitable commercial standards (Barcaccia et al., Citation2016 and references therein). Currently, two genetically distinct types of chicory cultivars are on the market: OP or synthetics, and F1 hybrids (Barcaccia et al., Citation2003b; Patella et al., Citation2019b). Newly released cultivars are mostly synthetics, developed through inter-crossing or poly-crossing among many selected parental individuals or clonal lines, followed by progeny testing to assess general combining ability (Barcaccia et al., Citation2003b; Barcaccia et al., Citation2016). By their nature, synthetics have a wide genetic base represented by a mixture of highly heterozygous and heterogeneous individuals, yet showing rather similar phenotypes. In recent years, however, developing F1 hybrid cultivars has become more common, mainly done in the private sector (Barcaccia et al., Citation2016; Patella et al., Citation2019b). Experimental data on how these hybrids are developed are currently scarce, and presumably, each company employs its own protocol depending on genetic material used and the system(s) of pollination control during inbred line development and F1 hybrid seed production (Barcaccia et al., Citation2016). In general, the strong SI system in chicory has been a great barrier for the development of parental inbred lines or clones used to produce single-cross hybrids (Lucchin et al., Citation2008; Barcaccia et al., Citation2016; Patella et al., Citation2019b). However, there has been an increased interest in the production of F1 hybrids due to the discovery of MS genes (Gonthier et al., Citation2013; Palumbo et al., Citation2019 and references therein). For instance, an increasing number of cultivars of the Witloof and Radicchio types are commercialized as true F1 hybrids. Further, owing to the economic benefits, most newly released varieties of leaf chicory are F1 hybrids, mainly developed by European seed companies. Moreover, most commercial breeding programs have improved their efficiency during the past several years due to the use of genomic tools. Various types of genetic markers, including SSRs, ESTs, and SNPs, have been implemented for genotyping elite breeding stocks of leaf chicory (Ghedina et al., Citation2015; Palumbo et al., Citation2019; Patella et al., Citation2019b). The available data show that markers have been reliable for assessing multi-locus genotypes of individual plants, breeding stocks, and lineages, including assessing the degree of homozygosity of inbred lines and their genetic stability. Moreover, markers have also been used to accurately estimate the specific combining ability between parental lines, as judged based on their genetic diversity and predicted degree of heterozygosity in their F1 hybrid progeny. Such information could be utilized for planning 2-way crosses and predict heterosis of the experimental F1 hybrids based on genetic distance and allelic divergence between parental inbred lines. Information on the parental genotypes would also allow protection of newly registered cultivars' assessment of genetic purity and identity of the seed stocks of commercial F1 hybrids.
D. Future outlook
Local farmer varieties of chicory represent invaluable genetic resources, which should be collected and preserved in gene banks for characterization and future exploitation by breeding programs. Most of this germplasm is OP farmer-derived populations as well as local synthetics that typically exhibit a great deal of genetic diversity in morphological and physiological characteristics, highly desirable to breeding programs. However, it appears that variation in traits related to biotic and abiotic stresses is scarce in the local populations. The reason could be that farmer selection was traditionally focused on morphological and esthetical characteristics important to the market, instead of selecting for disease resistance, abiotic stress tolerance, or post-harvest quality traits. It is, therefore, important to identify and characterize genetic resources for the latter traits and use new molecular marker technologies to identify the underlying genes or QTLs to be utilized in breeding programs. Such technologies have been extensively and successfully used in many other horticultural crops, and it is expected that they would be of great help in advancing basic genetic knowledge and applied breeding progress in chicory.
In chicory, next-generation breeding programs currently include several selection steps based on MAS and MABC applications (Ghedina et al., Citation2015; Barcaccia et al., Citation2016; Palumbo et al., Citation2019; Patella et al., Citation2019b). Molecular markers are now routinely adopted in this species to predict and select single plant reproductive barriers (e.g., SI and MS), to develop parental inbred lines or clones, and to assess their specific combining ability to better exploit potential heterosis in F1 hybrids (Ghedina et al., Citation2015; Patella et al., Citation2019b). This information also enables chicory breeders to determine the genetic distinctness, uniformity, and stability of commercial varieties (i.e., DUS testing).
IX. Prospects, perspectives, and direction of future research on vegetable crops
With the availability of reference genomes and new genomic tools, including GBS, BSA-seq, GWAS, and GS, vegetable crop breeding in the twenty-first century relies heavily on the use of molecular markers and NGS data. The recent application of modern technologies has already led to substantial progress in our understanding of the genetics of many vegetable crops and significantly improved the efficiency and accuracy of breeding programs. For example, advanced DNA technologies have expedited the identification and use of molecular markers and candidate genes associated with important horticultural characteristics, leading to more effective and efficient breeding strategies. Although some vegetable crops, including eggplant, spinach, and chicory, lag in the availability and use of new technologies for breeding purposes, for many crops MAS is already standard practice for numerous traits, in particular disease resistance and fruit quality characteristics, in both public and private breeding programs. It is expected that MAS will be more common for additional traits and other vegetable crops shortly. The ease of marker development and application, as well as the decreasing cost of marker genotyping, make MAS a primary breeding choice for many traits and in most breeding programs.
Unlike for simple qualitative traits for which the application of markers has been rather straightforward, for most complex quantitative traits, the use of MAS is currently hampered by several impediments, including inaccurate QTL identification due to phenotyping difficulties, the large size of QTL intervals, lack of QTL validation, scarcity of reliable, closely-linked markers, QTLs originating from distantly-related wild species, population specificity of QTLs and linkage drag. For example, for many quantitative traits, and in most vegetable crops, reported QTLs often encompass large genomic intervals including genes with undesirable phenotypic effects, thus prohibiting their effective use in breeding programs. These issues, of course, are not limited to vegetable crops as they are present in most other crops as well, and have significantly interdicted the use of MAS for many important agricultural traits. Before effective use of QTLs in widespread marker-assisted breeding, it is pivotal that efforts be made to fine-map and delineate QTLs to small intervals, validate QTLs and their associated markers across breeding populations, and identify reliable and reproducible closely-linked markers. It is expected that once QTLs are more characterized and verified, the use of MAS will rapidly and progressively extend beyond just simple Mendelian qualitative traits.
In addition to markers and MAS, newer techniques, such as pan-genome analysis (Khan et al., Citation2020), SNP-chip genotyping, and CRISPR/Cas system are inspiring many vegetable breeders to think and breed more holistically, yet more precisely. Traditionally, often breeders had to focus on one or a few traits at a time and breed for such traits for a long time. The conventional breeding protocols required development and phenotypic evaluation of hundreds of inbred lines and trialing of thousands of experimental F1 hybrids before identifying desirable hybrids with commercial value. With the use of new technologies, breeders may now design and develop inbred lines with numerous combinations of desirable characteristics based on predesigned molecular blueprints of the lines, and subsequently, develop F1 hybrids with the most complementary combinations of traits coming from genetically and phenotypically selected parental lines. The advanced technologies may allow the development of elite inbred lines and commercial F1 hybrids with complex trait packages, for example with gene/QTL combinations that would fit grower and consumer demands for specific growing conditions, in a much shorter time and with substantially reduced cost. Further, the ever-increasing and more inclusive SNP chips will allow genotyping breeding materials for numerous traits at very early developmental stages, which would significantly reduce the time needed to develop/identify elite inbred lines and complementary hybrid combinations.
In addition to the expected advancement in marker technology across vegetable crops, more reliable and efficient regeneration and genetic transformation systems with predictable and reproducible results must be available for most vegetable crops, which would allow more common use of gene editing techniques to not only better understand gene function but also facilitate precise genetic modification toward crop improvement. Advances in genome-editing tools will help drive vegetable crop breeding efforts and further reveal links between the nature of gene action and phenotypic performances.
Author contributions
Tomato section was written by MJ and MRF, pepper section was written by JV and B-CK, eggplant section was written by SL, lettuce section was written by IS, spinach section was written by GeB, cucumber section was written by YW, chicory section was written by GiB, all other sections were written by IS and MRF. MRF and IS comprehensively edited all sections. All authors read, edited, and approved the final manuscript.
| Abbreviations | ||
| AFLP | = | amplified fragment length polymorphism |
| BC | = | backcross |
| BIL | = | backcross inbred line |
| BSA-seq | = | bulked segregant analysis sequencing |
| CAPS | = | cleaved amplified polymorphic sequence |
| CGA | = | chlorogenic acid |
| CGMS | = | cytoplasmic-genic male sterility |
| ChiVMV | = | chili veinal mottle virus |
| cM | = | centi Morgan |
| CMS | = | cytoplasmic male sterility |
| COS | = | conserved ortholog set |
| CRISPR/Cas | = | clustered regularly interspaced short palindromic repeat/CRISPR associated protein |
| CVYV | = | cucumber vein yellowing virus |
| DArTseq | = | diversity arrays technology sequencing |
| DM | = | downy mildew |
| DUS testing | = | distinctness, uniformity and stability testing |
| EMS | = | ethyl methanesulfonate |
| EST | = | expressed sequence tag |
| F locus | = | femaleness locus |
| FM | = | fresh market |
| GBS | = | genotyping by sequencing |
| GEBV | = | genomic estimated breeding values |
| GMO | = | genetically modified organism |
| GMS | = | genic male sterility |
| GO | = | gene ontology |
| GP1 | = | primary gene pool |
| GP2 | = | secondary gene pool |
| GRIN | = | Germplasm Resources Information Network |
| GS | = | genomic selection |
| GWAS | = | genome-wide association mapping |
| Hi-C | = | unbiased genome-wide chromatin conformation capture protocol using proximity ligation |
| HIGS | = | host-induced silencing |
| HRM | = | high resolution melting |
| IL | = | introgression line |
| InDel | = | insertion/deletion |
| LG | = | linkage group |
| LMV | = | lettuce mosaic virus |
| LNSV | = | lettuce necrotic stunt virus |
| MABC | = | marker-assisted backcrossing |
| MAGIC | = | multi-parental advanced generation inter-cross |
| MAP | = | modified atmosphere packaging |
| MARS | = | marker-assisted recurrent selection |
| MAS | = | marker-assisted selection |
| MLBVV | = | Mirafiori lettuce big-vein virus |
| mQTL | = | metabolomic quantitative trait locus |
| MS | = | male sterility |
| MutMap | = | approach to identify causative mutations responsible for a phenotype |
| MYA | = | million years ago |
| NAM | = | nested association mapping |
| NBS-LRR | = | nucleotide-binding site, leucine-rich repeat |
| NGS | = | next generation sequencing |
| NIL | = | near-isogenic line |
| NMS | = | nuclear male sterility |
| NUE | = | nitrogen use efficiency |
| OP | = | open pollinated |
| PCR | = | polymerase chain reaction |
| PePMov | = | pepper mottle virus |
| PROC | = | processing |
| PRR | = | pseudo-response regulator |
| PS | = | phenotypic selection |
| PVY | = | potato virus Y |
| QTL | = | quantitative trait locus |
| RAD-sequencing | = | restriction site associated DNA sequencing |
| RAPD | = | random amplified polymorphic DNA |
| RenSeq | = | resistance gene enrichment sequencing |
| RFLP | = | restriction fragment length polymorphism |
| RGA | = | resistance gene analog |
| RIL | = | recombinant inbred line |
| RKN | = | root-knot nematode |
| RNA-Seq | = | RNA-sequencing |
| RS | = | Ralstonia solanacearum |
| SCAR | = | sequence characterized amplified region |
| siRNA | = | small interfering RNA |
| SLAF-seq | = | specific locus amplified fragment sequencing |
| SolCAP | = | Solanaceae coordinated agricultural project |
| SSR | = | simple sequence repeat |
| STS | = | sequence-tagged site |
| SV | = | structural variants |
| TBSV | = | tomato bushy stunt virus |
| ToMV | = | tomato mosaic virus |
| TRAP | = | target region amplification polymorphism |
| TSWV | = | tomato spotted wilt virus |
| TuMV | = | turnip mosaic virus |
| TYLCV | = | tomato yellow leaf curling virus |
| XIS | = | Xishuangbanna |
| YAGO | = | year(s) ago |
Acknowledgments
The mentioning of trade names or commercial products in this publication is solely to provide specific information and does not imply recommendation or endorsement by the U.S. Department of Agriculture (USDA) or the authors of this publication.
Disclosure statement
The authors declare that there is no conflict of interest.
References
- Acquadro, A., Barchi, L., Gramazio, P., Portis, E., Vilanova, S., Comino, C., Plazas, M., Prohens, J., and Lanteri, S. 2017. Coding SNPs analysis highlights genetic relationships and evolution pattern in eggplant complexes. PLoS ONE. 12: e0180774. doi:https://doi.org/10.1371/journal.pone.0180774
- Acquadro, A., Barchi, L., Portis, E., Nourdine, M., Carli, C., Monge, S., Valentino, D., and Lanteri, S. 2020. Whole genome resequencing of four Italian sweet pepper landraces provides insights on sequence variation in genes of agronomic value. Sci. Rep. 10: 9189. doi:https://doi.org/10.1038/s41598-020-66053-2
- Adams, M. D., Kelley, J. M., Gocayne, J. D., Dubnick, M., Polymeropoulos, M. H., Xiao, H., Merril, C. R., Wu, A., Olde, B., Moreno, R. F., Kerlavage, A. R., McCombie, W. R., and Venter, J. C. 1991. Complementary DNA sequencing: expressed sequence tags and human genome project. Science 252: 1651–1656. doi:https://doi.org/10.1126/science.2047873
- Adhikari, N. D., Simko, I., and Mou, B. 2019. Phenomic and physiological analysis of salinity effects on lettuce. Sensors 19: 4814. doi:https://doi.org/10.3390/s19214814
- Albert, E., Segura, V., Gricourt, J., Bonnefoi, J., Derivot, L., and Causse, M. 2016. Association mapping reveals the genetic architecture of tomato response to water deficit: focus on major fruit quality traits. J. Exp. Bot. 67: 6413–6430. doi:https://doi.org/10.1093/jxb/erw411
- Ali, Z., Xu, Z. L., Zhang, D. Y., He, X. L., Bahadur, S., and Yi, J. X. 2011. Molecular diversity analysis of eggplant (Solanum melongena) genetic resources. Genet. Mol. Res. 10: 1141–1155. doi:https://doi.org/10.4238/vol10-2gmr1279
- Alonge, M., Wang, X., Benoit, M., Soyk, S., Pereira, L., Zhang, L., Suresh, H., Ramakrishnan, S., Maumus, F., Ciren, D., Levy, Y., Harel, T. H., Shalev-Schlosser, G., Amsellem, Z., Razifard, H., Caicedo, A. L., Tieman, D. M., Klee, H., Kirsche, M., Aganezov, S., Ranallo-Benavidez, T. R., Lemmon, Z. H., Kim, J., Robitaille, G., Kramer, M., Goodwin, S., McCombie, W. R., Hutton, S., Van Eck, J., Gillis, J., Eshed, Y., Sedlazeck, F. J., van der Knaap, E., Schatz, M. C., and Lippman, Z. B. 2020. Major impacts of widespread structural variation on gene expression and crop improvement in tomato. Cell 182: 145–161 e23. doi:https://doi.org/10.1016/j.cell.2020.05.021
- Amano, M., Mochizuki, A., Kawagoe, Y., Iwahori, K., Niwa, K., Svoboda, J., Maeda, T., and Imura, Y. 2013. High-resolution mapping of zym, a recessive gene for Zucchini yellow mosaic virus resistance in cucumber. Theor. Appl. Genet. 126: 2983–2993. doi:https://doi.org/10.1007/s00122-013-2187-5
- Andersen, S. B., and Torp, A. M. 2011. Spinacia. In Wild Crop Relatives: Genomic and Breeding Resources; Kole, C., Ed. Springer, pp 273–276.
- Andolfo, G., Jupe, F., Witek, K., Etherington, G. J., Ercolano, M. R., and Jones, J. D. G. 2014. Defining the full tomato NB-LRR resistance gene repertoire using genomic and cDNA RenSeq. BMC Plant Biol. 14: 120. doi:https://doi.org/10.1186/1471-2229-14-120
- Araus, J. L., and Cairns, J. E. 2014. Field high-throughput phenotyping: the new crop breeding frontier. Trends Plant Sci. 19: 52–61. doi:https://doi.org/10.1016/j.tplants.2013.09.008
- Arce-Rodríguez, M. L., and Ochoa-Alejo, N. 2017. An R2R3-MYB transcription factor regulates capsaicinoid biosynthesis. Plant Physiol. 174: 1359–1370. doi:https://doi.org/10.1104/pp.17.00506
- Arens, P., Mansilla, C., Deinum, D., Cavellini, L., Moretti, A., Rolland, S., van der Schoot, H., Calvache, D., Ponz, F., Collonnier, C., Mathis, R., Smilde, D., Caranta, C., and Vosman, B. 2010. Development and evaluation of robust molecular markers linked to disease resistance in tomato for distinctness, uniformity and stability testing. Theor. Appl. Genet. 120: 655–664. doi:https://doi.org/10.1007/s00122-009-1183-2
- Argyris, J., Truco, J. M., Ochoa, O., McHale, L., Dahal, P., Van Deynze, A., Michelmore, R. W., and Bradford, K. J. 2011. A gene encoding an abscisic acid biosynthetic enzyme (LsNCED4) collocates with the high temperature germination locus Htg6.1 in lettuce (Lactuca sp.). Theor. Appl. Genet. 122: 95–108. doi:https://doi.org/10.1007/s00122-010-1425-3
- Argyris, J., Truco, M. J., Ochoa, O., Knapp, S. J., Still, D. W., Lenssen, G. M., Schut, J. W., Michelmore, R. W., and Bradford, K. J. 2005. Quantitative trait loci associated with seed and seedling traits in Lactuca. Theor. Appl. Genet. 111: 1365–1376. doi:https://doi.org/10.1007/s00122-005-0066-4
- Arisha, M. H., Shah, S. N. M., Gong, Z. H., Jing, H., Li, C., and Zhang, H. X. 2015. Ethyl methane sulfonate induced mutations in M2 generation and physiological variations in M1 generation of peppers (Capsicum annuum L.). Front. Plant Sci. 6: 399. doi:https://doi.org/10.3389/fpls.2015.00399
- Arnedo-Andrés, M., Gil-Ortega, R., Luis-Arteaga, M., and Hormaza, J. 2002. Development of RAPD and SCAR markers linked to the Pvr4 locus for resistance to PVY in pepper (Capsicum annuum L.). Theor. Appl. Genet. 105: 1067–1074. doi:https://doi.org/10.1007/s00122-002-1058-2
- Aruga, D., Tsuchiya, N., Matsumura, H., Matsumoto, E., and Hayashida, N. 2012. Analysis of RAPD and AFLP markers linked to resistance to Fusarium oxysporum f. sp. lactucae race 2 in lettuce (Lactuca sativa L.). Euphytica 187: 1–9. doi:https://doi.org/10.1007/s10681-012-0665-5
- Arumuganathan, K., and Earle, E. D. 1991. Nuclear DNA content of some important plant species. Plant Mol. Biol. Rep. 9: 208–218. doi:https://doi.org/10.1007/BF02672069
- Ashrafi, H., Kinkade, M. P., Merk, H. L., and Foolad, M. R. 2012. Identification of novel quantitative trait loci for increased lycopene content and other fruit quality traits in a tomato recombinant inbred line population. Mol. Breed. 30: 549–567. doi:https://doi.org/10.1007/s11032-011-9643-1
- Atkinson, L. D., McHale, L. K., Truco, M. J., Hilton, H. W., Lynn, J., Schut, J. W., Michelmore, R. W., Hand, P., and Pink, D. A. 2013. An intra-specific linkage map of lettuce (Lactuca sativa) and genetic analysis of postharvest discolouration traits. Theor. Appl. Genet. 126: 2737–2752. doi:https://doi.org/10.1007/s00122-013-2168-8
- Awika, H. O., Cochran, K., Joshi, V., Bedre, R., Mandadi, K. K., and Avila, C. A. 2020. Single-marker and haplotype-based association analysis of anthracnose (Colletotrichum dematium) resistance in spinach (Spinacia oleracea). Plant Breed. 139: 402–418. doi:https://doi.org/10.1111/pbr.12773
- Awika, H. O., Marconi, T. G., Bedre, R., Mandadi, K. K., and Avila, C. A. 2019. Minor alleles are associated with white rust (Albugo occidentalis) susceptibility in spinach (Spinacia oleracea). Hortic. Res. 6.
- Ballester, A. R., Molthoff, J., de Vos, R., Hekkert, B., Orzaez, D., Fernandez-Moreno, J. P., Tripodi, P., Grandillo, S., Martin, C., Heldens, J., Ykema, M., Granell, A., and Bovy, A. 2010. Biochemical and molecular analysis of pink tomatoes: deregulated expression of the gene encoding transcription factor SlMYB12 leads to pink tomato fruit color. Plant Physiol. 152: 71–84. doi:https://doi.org/10.1104/pp.109.147322
- Barbary, A., Djian-Caporalino, C., Marteu, N., Fazari, A., Caromel, B., Castagnone-Sereno, P., and Palloix, A. 2016. Plant genetic background increasing the efficiency and durability of major resistance genes to root-knot nematodes can be resolved into a few resistance QTLs. Front. Plant Sci. 7: 632. doi:https://doi.org/10.3389/fpls.2016.00632
- Barcaccia, G., and Tiozzo, C.S. 2012. New male sterile Cichorium spp. mutant, parts or derivatives, where male sterility is due to a recessive nuclear mutation linked to a polymorphic molecular marker, useful for producing F1 hybrids of Cichorium spp. EU Patent No. WO2012163389-A1.
- Barcaccia, G., and Tiozzo, C.S. 2014. New male sterile mutant of leaf chicory, including radicchio, used to produce chicory plants and seeds with traits such as male sterility exhibiting cytological phenotype with shapeless, small and shrunken microspores in dehiscent anthers. U.S. Patent No. US20140157448-A1.
- Barcaccia, G., Ghedina, A., and Lucchin, M. 2016. Current advances in genomics and breeding of leaf chicory (Cichorium intybus L.). Agriculture 6: 50. doi:https://doi.org/10.3390/agriculture6040050
- Barcaccia, G., Pallottini, L., Soattin, M., Lazzarin, R., Parrini, P., and Lucchin, M. 2003a. Genomic DNA fingerprints as a tool for identifying cultivated types of red chicory (Cichorium intybus L.) from Veneto, Italy. Plant Breed. 122: 178–183. doi:https://doi.org/10.1046/j.1439-0523.2003.00786.x
- Barcaccia, G., Varotto, S., Soattin, M., Lucchin, M., and Parrini, P. 2003b. Genetic and molecular studies of sporophytic self-incompatibility in Cichorium intybus L. In Proceedings of the EUCARPIA Meeting on Leafy Vegetables Genetics and Breeding, Noordwijkerhout, The Netherlands, 19–21 March 2003; p. 154.
- Barchenger, D. W., Naresh, P., and Kumar, S. 2019. Genetic resources of Capsicum. In The Capsicum Genome; Ramchiary, N. and Kole, C., Eds. Springer, pp 9–23.
- Barchenger, D. W., Rodriguez, K., Jiang, L., Hanson, S. F., and Bosland, P. W. 2017. Allele-specific CAPS marker in a Ve1 homolog of Capsicum annuum for improved selection of Verticillium dahliae resistance. Mol. Breed. 37: 134.
- Barchi, L., Acquadro, A., Alonso, D., Aprea, G., Bassolino, L., Demurtas, O., Ferrante, P., Gramazio, P., Mini, P., Portis, E., Scaglione, D., Toppino, L., Vilanova, S., Díez, M. J., Rotino, G. L., Lanteri, S., Prohens, J., and Giuliano, G. 2019a. Single primer enrichment technology (SPET) for high-throughput genotyping in tomato and eggplant germplasm. Front. Plant Sci. 10: 1005. doi:https://doi.org/10.3389/fpls.2019.01005
- Barchi, L., Lanteri, S., Portis, E., Acquadro, A., Valè, G., Toppino, L., and Rotino, G. L. 2011. Identification of SNP and SSR markers in eggplant using RAD tag sequencing. BMC Genomics 12: 304. doi:https://doi.org/10.1186/1471-2164-12-304
- Barchi, L., Lanteri, S., Portis, E., Stàgel, A., Valè, G., Toppino, L., and Rotino, G. L. 2010. Segregation distortion and linkage analysis in eggplant (Solanum melongena L.). Genome 53: 805–815. doi:https://doi.org/10.1139/g10-073
- Barchi, L., Lanteri, S., Portis, E., Valè, G., Volante, A., Pulcini, L., Ciriaci, T., Acciarri, N., Barbierato, V., Toppino, L., and Rotino, G. L. 2012. A RAD tag derived marker based eggplant linkage map and the location of QTLs determining anthocyanin pigmentation. PLoS ONE 7: e43740. doi:https://doi.org/10.1371/journal.pone.0043740
- Barchi, L., Lefebvre, V., Sage-Palloix, A. M., Lanteri, S., and Palloix, A. 2009. QTL analysis of plant development and fruit traits in pepper and performance of selective phenotyping. Theor. Appl. Genet. 118: 1157–1171. doi:https://doi.org/10.1007/s00122-009-0970-0
- Barchi, L., Pietrella, M., Venturini, L., Minio, A., Toppino, L., Acquadro, A., Andolfo, G., Aprea, G., Avanzato, C., Bassolino, L., Comino, C., Molin, A. D., Ferrarini, A., Maor, L. C., Portis, E., Reyes-Chin-Wo, S., Rinaldi, R., Sala, T., Scaglione, D., Sonawane, P., Tononi, P., Almekias-Siegl, E., Zago, E., Ercolano, M. R., Aharoni, A., Delledonne, M., Giuliano, G., Lanteri, S., and Rotino, G. L. 2019b. A chromosome-anchored eggplant genome sequence reveals key events in Solanaceae evolution. Sci. Rep. 9: 11769. doi:https://doi.org/10.1038/s41598-019-47985-w
- Barchi, L., Rabanus-Wallace, M. T., Prohens, J., Toppino, L., Portis, E., Rotino, G. L., Stein, N., Lanteri, S., and Giuliano, G. 2021. Improved genome assembly and resequencing provide key insights on eggplant domestication and breeding. Plant J. https://doi.org/10.1111/tpj.15313.
- Barchi, L., Toppino, L., Valentino, D., Bassolino, L., Portis, E., Lanteri, S., and Rotino, G. L. 2018. QTL analysis reveals new eggplant loci involved in resistance to fungal wilts. Euphytica 214: 20. doi:https://doi.org/10.1007/s10681-017-2102-2
- Barry, C. S., and Giovannoni, J. J. 2006. Ripening in the tomato Green-ripe mutant is inhibited by ectopic expression of a protein that disrupts ethylene signaling. Proc. Natl. Acad. Sci. U.S.A. 103: 7923–7928. doi:https://doi.org/10.1073/pnas.0602319103
- Bartoszewski, G., Waszczak, C., Gawroński, P., Stępień, I., Bolibok-Brągoszewska, H., Palloix, A., Lefebvre, V., Korzeniewska, A., and Niemirowicz-Szczytt, K. 2012. Mapping of the ms8 male sterility gene in sweet pepper (Capsicum annuum L.) on the chromosome P4 using PCR-based markers useful for breeding programmes. Euphytica 186: 453–461. doi:https://doi.org/10.1007/s10681-012-0637-9
- Bauchet, G., and Causse, M. 2012. Genetic diversity in tomato (Solanum lycopersicum) and its wild relatives. In Genetic Diversity in Plants. Çalişkan, M., Ed. InTech: Rijeka, pp 133–162.
- Bauchet, G., Grenier, S., Samson, N., Bonnet, J., Grivet, L., and Causse, M. 2017. Use of modern tomato breeding germplasm for deciphering the genetic control of agronomical traits by genome wide association study. Theor. Appl. Genet. 130: 875–889. doi:https://doi.org/10.1007/s00122-017-2857-9
- Bell, J. L., Burke, I. C., and Neff, M. M. 2015. Genetic and biochemical evaluation of natural rubber from eastern Washington prickly lettuce (Lactuca serriola L.). J. Agric. Food Chem. 63: 593–602. doi:https://doi.org/10.1021/jf503934v
- Ben Chaim, A. B., Borovsky, Y., Rao, G. U., Tanyolac, B., and Paran, I. 2003. fs3.1: a major fruit shape QTL conserved in Capsicum. Genome 46: 1–9. doi:https://doi.org/10.1139/g02-096
- Ben Chaim, A. B., Grube, R. C., Lapidot, M., Jahn, M., and Paran, I. 2001a. Identification of quantitative trait loci associated with resistance to cucumber mosaic virus in Capsicum annuum. Theor. Appl. Genet 102: 1213–1220.
- Ben Chaim, A. B., Paran, I., Grube, R. C., Jahn, M., van Wijk, R., and Peleman, J. 2001b. QTL mapping of fruit-related traits in pepper (Capsicum annuum). Theor. Appl. Genet. 102: 1016–1028.
- Ben-Chaim, A., Borovsky, Y., Falise, M., Mazourek, M., Kang, B. C., Paran, I., and Jahn, M. 2006. QTL analysis for capsaicinoid content in Capsicum. Theor. Appl. Genet. 113: 1481–1490. doi:https://doi.org/10.1007/s00122-006-0395-y
- Berg, J. A., Appiano, M., Santillan Martinez, M., Hermans, F. W., Vriezen, W. H., Visser, R. G., Bai, Y., and Schouten, H. J. 2015. A transposable element insertion in the susceptibility gene CsaMLO8 results in hypocotyl resistance to powdery mildew in cucumber. BMC Plant Biol. 15:243. doi:https://doi.org/10.1186/s12870-015-0635-x
- Berg, J. A., Hermans, F. W. K., Beenders, F., Abedinpour, H., Vriezen, W. H., Visser, R. G. F., Bai, Y., and Schouten, H. J. 2021. The amino acid permease (AAP) genes CsAAP2A and SlAAP5A/B are required for oomycete susceptibility in cucumber and tomato. Mol. Plant Pathol. 22: 658–672. doi:https://doi.org/10.1111/mpp.13052
- Berg, J. A., Hermans, F. W. K., Beenders, F., Lou, L., Vriezen, W. H., Visser, R. G. F., Bai, Y., and Schouten, H. J. 2020. Analysis of QTL DM4.1 for downy mildew resistance in cucumber reveals multiple subQTL: a novel RLK as candidate gene for the most important subQTL. Front. Plant Sci. 11: 569876. doi:https://doi.org/10.3389/fpls.2020.569876
- Bernatzky, R., and Tanksley, S. D. 1986. Towards a saturated linkage map in tomato based on isozymes and random cDNA sequences. Genetics 112: 887–898. doi:https://doi.org/10.1093/genetics/112.4.887
- Bertier, L. D., Ron, M., Huo, H., Bradford, K. J., Britt, A. B., and Michelmore, R. W. 2018. High-resolution analysis of the efficiency, heritability, and editing outcomes of CRISPR/Cas9-induced modifications of NCED4 in lettuce (Lactuca sativa). Genes Genom. Genet. 8: 1513–1521.
- Bhattarai, G. 2019. Genetic resistance to the downy mildew pathogen and mapping the RPF resistance loci in spinach. Doctoral dissertation, University of Arkansas, Fayetteville, AR, USA.
- Bhattarai, G., Feng, C., Dhillon, B., Shi, A., Villarroel-Zeballos, M., Klosterman, S., and Correll, J. 2020a. Detached leaf inoculation assay for evaluating resistance to the spinach downy mildew pathogen. Eur. J. Plant Pathol. 158: 511–520. doi:https://doi.org/10.1007/s10658-020-02096-5
- Bhattarai, G., Liu, B., Shi, A., Feng, C., and Correll, J. C. 2020b. Genome-wide association of leaf spot (Stemphylium vesicarium) resistance in USDA spinach germplasm. HortScience 55: S351. Abstr.).
- Bhattarai, G., Shi, A., Correll, J. C., and Feng, C. 2020c. Field evaluation and genome-wide association analysis of downy mildew resistance in spinach. HortScience 55: S227.
- Bhattarai, G., Shi, A., Feng, C., Dhillon, B., Mou, B., and Correll, J. C. 2020d. Genome wide association studies in multiple spinach breeding populations refine downy mildew race 13 resistance genes. Front. Plant Sci. 11: 563187. doi:https://doi.org/10.3389/fpls.2020.563187
- Bhattarai, G., Shi, A., Kandel, D. R., Solís-Gracia, N., da Silva, J. A., and Avila, C. A. 2021a. Genome-wide simple sequence repeats (SSR) markers discovered from whole-genome sequence comparisons of multiple spinach accessions. Sci. Rep. 11: 9999. doi:https://doi.org/10.1038/s41598-021-89473-0
- Bhattarai, G., Yang, W., Shi, A., Feng, C., Dhillon, B., Correll, J. C., and Mou, B. 2021b. High resolution mapping and candidate Add reference: gene identification of downy mildew race 16 resistance in spinach. BMC Genomics 22: 478. doi:https://doi.org/10.1186/s12864-021-07788-8
- Bletsos, F., Thanassoulopoulos, C., and Roupakias, D. 2003. Effect of Grafting on Growth, Yield, and Verticillium wilt of eggplant. HortScience 38: 183–186. doi:https://doi.org/10.21273/HORTSCI.38.2.183
- Blum, E., Mazourek, M., O'Connell, M., Curry, J., Thorup, T., Liu, K., Jahn, M., and Paran, I. 2003. Molecular mapping of capsaicinoid biosynthesis genes and quantitative trait loci analysis for capsaicinoid content in Capsicum. Theor. Appl. Genet. 108: 79–86. doi:https://doi.org/10.1007/s00122-003-1405-y
- Bo, K. L., Ma, Z., Chen, J. F., and Weng, Y. 2015. Molecular mapping reveals structural rearrangements and quantitative trait loci underlying traits with local adaptation in semi-wild Xishuangbanna cucumber (Cucumis sativus L. var. xishuangbannanesis Qi et Yuan). Theor. Appl. Genet. 128: 25–39. doi:https://doi.org/10.1007/s00122-014-2410-z
- Bo, K. L., Wang, H., Pan, Y., Behera, T. K., Pandey, S., Wen, C. L., Wang, Y.H., Simon, P.W., Li, Y.H., Chen, J. F., and Weng, Y. 2016. Short Hypocotyl1 Encodes a SMARCA3-Like Chromatin Remodeling Factor Regulating Elongation . Plant Physiol. 172: 1273–1292. doi:https://doi.org/10.1104/pp.16.00501
- Bo, K., Song, H., Shen, J., Qian, C. T., Staub, J. E., Simon, P. W., Lou, Q., and Chen, J. 2012. Inheritance and mapping of the ore gene controlling the quantity of β-carotene in cucumber (Cucumis sativus L.) endocarp. Mol. Breed. 30: 335–344. doi:https://doi.org/10.1007/s11032-011-9624-4
- Bohn, G. W., and Tucker, C. M. 1939. Immunity to fusarium wilt in the tomato. Science 89: 603–604. doi:https://doi.org/10.1126/science.89.2322.603
- Borovsky, Y., and Paran, I. 2011. Characterization of fs10.1, a major QTL controlling fruit elongation in Capsicum. Theor. Appl. Genet. 123: 657–665. doi:https://doi.org/10.1007/s00122-011-1615-7
- Borovsky, Y., Tadmor, Y., Bar, E., Meir, A., Lewinsohn, E., and Paran, I. 2013. Induced mutation in β-carotene hydroxylase results in accumulation of β-carotene and conversion of red to orange color in pepper fruit. Theor. Appl. Genet. 126: 557–565. doi:https://doi.org/10.1007/s00122-012-2001-9
- Boyaci, F., Unlu, A., and Abak, K. 2012. Screening for resistance to Fusarium wilt of some cultivated eggplants and wild Solanum accessions. Acta Hortic. 935: 23–27. doi:https://doi.org/10.17660/ActaHortic.2012.935.2
- Brand, A., Borovsky, Y., Hill, T., Rahman, K. A. A., Bellalou, A., Van Deynze, A., and Paran, I. 2014. CaGLK2 regulates natural variation of chlorophyll content and fruit color in pepper fruit. Theor. Appl. Genet. 127: 2139–2148. doi:https://doi.org/10.1007/s00122-014-2367-y
- Brand, A., Borovsky, Y., Meir, S., Rogachev, I., Aharoni, A., and Paran, I. 2012. pc8.1, a major QTL for pigment content in pepper fruit, is associated with variation in plastid compartment size. Planta 235: 579–588. doi:https://doi.org/10.1007/s00425-011-1530-9
- Brandenberger, L. P. 1991. Identification of and cultivar reactions to a new race (race 4) of Peronospora farinosa f. sp. spinaciae on spinach in the United States. Plant Dis. 75: 630–634. doi:https://doi.org/10.1094/PD-75-0630
- Brandenberger, L. P., Morelock, T. E., and Correll, J. C. 1992. Evaluation of spinach germplasm for resistance to a new race (race 4) of Peronospora farinosa f. sp. spinaciae. HortScience 27: 1118–1119. doi:https://doi.org/10.21273/HORTSCI.27.10.1118
- Bremer, K., and Anderberg, A. A. 1994. Asteraceae: Cladistics and Classification. Timber Press, Portland, OR.
- Brommonschenkel, S. H., Frary, A., Frary, A., and Tanksley, S. D. 2000. The broad-spectrum tospovirus resistance gene Sw-5 of tomato is a homolog of the root-knot nematode resistance gene Mi. Mol. Plant Microbe Interact. 13: 1130–1138. doi:https://doi.org/10.1094/MPMI.2000.13.10.1130
- Bucki, P., Paran, I., Ozalvo, R., Iberkleid, I., Ganot, L., and Miyara, S. B. 2017. Pathogenic variability of Meloidogyne incognita populations occurring in pepper-production greenhouses in Israel toward Me1, Me3 and N pepper resistance genes. Plant Dis. 101: 1391–1401. doi:https://doi.org/10.1094/PDIS-11-16-1667-RE
- Budiman, M. A., Chang, S. B., Lee, S., Yang, T. J., Zhang, H. B., de Jong, H., and Wing, R. A. 2004. Localization of jointless-2 gene in the centromeric region of tomato chromosome 12 based on high resolution genetic and physical mapping. Theor. Appl. Genet. 108: 190–196. doi:https://doi.org/10.1007/s00122-003-1429-3
- Bunea, A., Andjelkovic, M., Socaciu, C., Bobis, O., Neacsu, M., Verhé, R., and Camp, J. V. 2008. Total and individual carotenoids and phenolic acids content in fresh, refrigerated and processed spinach (Spinacia oleracea L.). Food Chem. 108: 649–656. doi:https://doi.org/10.1016/j.foodchem.2007.11.056
- Butler, L. 1968. Linkage summary. Rep. Tomato Genet. Coop. 18: 4–6.
- Cadalen, T., Mörchen, M., Blassiau, C., Clabaut, A., Scheer, I., Hilbert, J. L., Hendriks, T., and Quillet, M. C. 2010. Development of SSR markers and construction of a consensus genetic map for chicory (Cichorium intybus L.). Mol. Breed. 25: 699–722. doi:https://doi.org/10.1007/s11032-009-9369-5
- Cai, X., Xu, C., Wang, X., Wang, S., Zhang, Z., Fei, Z., and Wang, Q. 2018. Construction of genetic linkage map using genotyping-by-sequencing and identification of QTLs associated with leaf color in spinach. Euphytica 214: 229. doi:https://doi.org/10.1007/s10681-018-2312-2
- Candolle, A. D. 1959. Origin of Cultivated Plants. Hafner Pub. Co., New York, NY.
- Cao, G., Sofic, E., and Prior, R. L. 1996. Antioxidant capacity of tea and common vegetables. J. Agric. Food Chem. 44:3426–3431. doi:https://doi.org/10.1021/jf9602535
- Capel, C., Yuste-Lisbona, F. J., Lopez-Casado, G., Angosto, T., Cuartero, J., Lozano, R., and Capel, J. 2017. Multi-environment QTL mapping reveals genetic architecture of fruit cracking in a tomato RIL Solanum lycopersicum × S. pimpinellifolium population. Theor. Appl. Genet. 130: 213–222. doi:https://doi.org/10.1007/s00122-016-2809-9
- Caranta, C., Pflieger, S., Lefebvre, V., Daubeze, A. M., Thabuis, A., and Palloix, A. 2002. QTLs involved in the restriction of cucumber mosaic virus (CMV) long-distance movement in pepper. Theor. Appl. Genet. 104: 586–591. doi:https://doi.org/10.1007/s001220100753
- Cassan, L., Moreau, L., Segouin, S., Bellamy, A., Falque, M., and Limami, A.M. 2010. Genetic map construction and quantitative trait loci (QTL) mapping for nitrogen use efficiency and its relationship with productivity and quality of the biennial crop Belgian endive (Cichorium intybus L.). J. Plant Physiol. 167: 1253–1263. doi:https://doi.org/10.1016/j.jplph.2010.04.016
- Catanzariti, A. M., Do, H. T. T., Bru, P., de Sain, M., Thatcher, L. F., Rep, M., and Jones, D. A. 2017. The tomato I gene for Fusarium wilt resistance encodes an atypical leucine-rich repeat receptor-like protein whose function is nevertheless dependent on SOBIR1 and SERK3/BAK1. Plant J. 89: 1195–1209. doi:https://doi.org/10.1111/tpj.13458
- Catanzariti, A. M., Lim, G. T., and Jones, D. A. 2015. The tomato I-3 gene: a novel gene for resistance to Fusarium wilt disease. New Phytol. 207: 106–118. doi:https://doi.org/10.1111/nph.13348
- Causse, M., and Grandillo, S. 2016. Gene mapping in tomato. In The Tomato Genome; Causse, M., Giovannoni, J., Bouzayen, M., and Zouine, M., Eds. Springer, pp 23–37.
- Cavagnaro, P. F., Senalik, D. A., Yang, L., Simon, P. W., Harkins, T. T., Kodira, C. D., Huang, S., and Weng, Y. 2010. Genome-wide characterization of simple sequence repeats in cucumber (Cucumis sativus L.). BMC Genomics. 11: 569. doi:https://doi.org/10.1186/1471-2164-11-569
- Cavanagh, C., Morell, M., Mackay, I., and Powell, W. 2008. From mutations to MAGIC: resources for gene discovery, validation and delivery in crop plants. Curr. Opin. Plant Biol. 11: 215–221. doi:https://doi.org/10.1016/j.pbi.2008.01.002
- Celik, I., Gurbuz, N., Uncu, A. T., Frary, A., and Doganlar, S. 2017. Genome-wide SNP discovery and QTL mapping for fruit quality traits in inbred backcross lines (IBLs) of Solanum pimpinellifolium using genotyping by sequencing. BMC Genomics 18: 1. doi:https://doi.org/10.1186/s12864-016-3406-7
- Cericola, F., Portis, E., Lanteri, S., Toppino, L., Barchi, L., Acciarri, N., Pulcini, L., Sala, T., and Rotino, G. 2014. Linkage disequilibrium and genome-wide association analysis for anthocyanin pigmentation and fruit color in eggplant. BMC Genomics 15: 896. doi:https://doi.org/10.1186/1471-2164-15-896
- Cericola, F., Portis, E., Toppino, L., Barchi, L., Acciarri, N., Ciriaci, T., Sala, T., Rotino, G. L., and Lanteri, S. 2013. The population structure and diversity of eggplant from Asia and the Mediterranean basin. PLoS ONE 8: e73702. doi:https://doi.org/10.1371/journal.pone.0073702
- Cerruti, E., Gisbert, C., Drost, H. G., Valentino, D., Portis, E., Barchi, L., Prohens, J., Lanteri, S., Comino, C., and Catoni, M. 2021. Grafting vigour is associated with DNA de-methylation in eggplant. Hortic. Res.
- Changkwian, A., Venkatesh, J., Lee, J. H., Han, J. W., Kwon, J. K., Siddique, M. I., Solomon, A. M., Choi, G. J., Kim, E., Seo, Y., Kim, Y. H., and Kang, B. C. 2019. Physical localization of the root-knot nematode (Meloidogyne incognita) resistance locus Me7 in Pepper (Capsicum annuum). Front. Plant Sci. 10: 886. doi:https://doi.org/10.3389/fpls.2019.00886
- Chan-Navarrete, R., Dolstra, O., van Kaauwen, M., Lammerts van Bueren, E. T., and van der Linden, C. G. 2016. Genetic map construction and QTL analysis of nitrogen use efficiency in spinach (Spinacia oleracea L.). Euphytica 208: 621–636. doi:https://doi.org/10.1007/s10681-015-1618-6
- Charmet, G., Robert, N., Perretant, M. R., Gay, G., Sourdille, P., Groos, C., Bernard, S., and Bernard, M. 1999. Marker-assisted recurrent selection for cumulative additive and interactive QTLs in recomninant inbred lines. Theor. Appl. Genet. 99: 143–1148.
- Chaudhary, J., Khatri, P., Singla, P., Kumawat, S., Kumari, A., R, V., Vikram, A., Jindal, S. K., Kardile, H., Kumar, R., Sonah, H., and Deshmukh, R. 2019. Advances in omics approaches for abiotic stress tolerance in Tomato. Biology 8: 90. doi:https://doi.org/10.3390/biology8040090
- Chen, F.Q., Foolad, M.R., Hyman, J., St. Clair, D.A., and Beelaman, R.B. 1999. Mapping of QTLs for lycopene and other fruit traits in a Lycopersicon esculentum × L-pimpinellifolium cross and comparison of QTLs across tomato species. Mol. Breed. 5: 283–299. doi:https://doi.org/10.1023/A:1009656910457
- Chen, J. F., Staub, J. E., Tashiro, Y., Isshiki, S., and Miyazaki, S. 1997. Successful interspecific hybridization between Cucumis sativus L. and C. hystrix Chakr. Euphytica 96: 413–419. doi:https://doi.org/10.1023/A:1003017702385
- Cheng, J., Qin, C., Tang, X., Zhou, H., Hu, Y., Zhao, Z., Cui, J., Li, B., Wu, Z., Yu, J., and Hu, K. 2016. Development of a SNP array and its application to genetic mapping and diversity assessment in pepper (Capsicum spp.). Sci. Rep. 6: 33293. doi:https://doi.org/10.1038/srep33293
- Cheng, Q., Wang, P., Liu, J., Wu, L., Zhang, Z., Li, T., Gao, W., Yang, W., Sun, L., and Shen, H. 2018. Identification of candidate genes underlying genic male-sterile msc-1 locus via genome resequencing in Capsicum annuum L. Theor. Appl. Genet. 131: 1861–1872. doi:https://doi.org/10.1007/s00122-018-3119-1
- Chitwood, J., Shi, A., Mou, B., Evans, M., Clark, J., Motes, D., Chen, P., and Hensley, D. 2016. Population structure and association analysis of bolting, plant height, and leaf erectness in spinach. HortScience 51: 481–486. doi:https://doi.org/10.21273/HORTSCI.51.5.481
- Choi, S., Lee, J. H., Kang, W. H., Kim, J., Huy, H. N., Park, S. W., Son, E. H., Kwon, J. K., and Kang, B. C. 2018. Identification of cucumber mosaic resistance 2 (cmr2) that confers resistance to a new cucumber mosaic virus isolate P1 (CMV-P1) in pepper (Capsicum spp.). Front. Plant Sci. 9: 1106. doi:https://doi.org/10.3389/fpls.2018.01106
- Chunthawodtiporn, J., Hill, T., Stoffel, K., and Van Deynze, A. 2018. Quantitative trait loci controlling fruit size and other horticultural traits in bell pepper (Capsicum annuum). Plant Genome 11: 160125. doi:https://doi.org/10.3835/plantgenome2016.12.0125
- Clayberg, C. D., Butler, L., Rick, C. M., and Robinson, R. W. 1965. Report of tomato genes of January 1965. Rep. Tomato Genet. Coop. 15: 7–21.
- Cohen, O., Borovsky, Y., David-Schwartz, R., and Paran, I. 2012. CaJOINTLESS is a MADS-box gene involved in suppression of vegetative growth in all shoot meristems in pepper. J. Exp. Bot. 63: 4947–4957. doi:https://doi.org/10.1093/jxb/ers172
- Cohen, O., Borovsky, Y., David‐Schwartz, R., and Paran, I. 2014. Capsicum annuum S (CaS) promotes reproductive transition and is required for flower formation in pepper (Capsicum annuum). New Phytol. 202: 1014–1023. doi:https://doi.org/10.1111/nph.12711
- Collard, B. C. Y., and Mackill, D. J. 2008. Marker-assisted selection: an approach for precision plant breeding in the twenty-first century. Philos. Trans. R. Soc. Lond. B Biol. Sci. 363: 557–572. doi:https://doi.org/10.1098/rstb.2007.2170
- Collins, K., Zhao, K., Jiao, C., Xu, C., Cai, X., Wang, X., Ge, C., Dai, S., Wang, Q., Wang, Q., Fei, Z., and Zheng, Y. 2019. SpinachBase: a central portal for spinach genomics. Database 2019: baz072. doi:https://doi.org/10.1093/database/baz072
- Colonna, V., D'Agostino, N., Garrison, E., Albrechtsen, A., Meisner, J., Facchiano, A., Cardi, T., and Tripodi, P. 2019. Genomic diversity and novel genome-wide association with fruit morphology in Capsicum, from 746k polymorphic sites. Sci. Rep. 9: 10067. doi:https://doi.org/10.1038/s41598-019-46136-5
- Correll, J. C., Bluhm, B. H., Feng, C., Lamour, K., Du Toit, L. J., and Koike, S. T. 2011. Spinach: better management of downy mildew and white rust through genomics. Eur. J. Plant Pathol. 129: 193–205. doi:https://doi.org/10.1007/s10658-010-9713-y
- Cremona, G., Iovene, M., Festa, G., Conicella, C., and Parisi, M. 2018. Production of embryo rescued hybrids between the landrace “Friariello”(Capsicum annuum var. annuum) and C. baccatum var. pendulum: phenotypic and cytological characterization. Euphytica 214: 129. doi:https://doi.org/10.1007/s10681-018-2211-6
- Cui, J., Luan, Y., Jiang, N., Bao, H., and Meng, J. 2017. Comparative transcriptome analysis between resistant and susceptible tomato allows the identification of lncRNA16397 conferring resistance to Phytophthora infestans by co-expressing glutaredoxin. Plant J. 89: 577–589. doi:https://doi.org/10.1111/tpj.13408
- Damerum, A., Chapman, M. A., and Taylor, G. 2020. Innovative breeding technologies in lettuce for improved post-harvest quality. Postharvest. Biol. Technol. 168: 111266. doi:https://doi.org/10.1016/j.postharvbio.2020.111266
- Damerum, A., Selmes, S. L., Biggi, G. F., Clarkson, G. J., Rothwell, S. D., Truco, M. J., Michelmore, R. W., Hancock, R. D., Shellcock, C., Chapman, M. A., and Taylor, G. 2015. Elucidating the genetic basis of antioxidant status in lettuce (Lactuca sativa). Hortic. Res. 2: 15055. doi:https://doi.org/10.1038/hortres.2015.55
- Daunay, M. C., Lester, R. N., Gebhardt, C., Hennart, J. W., Jahn, M. and Frary, A. 2000. Genetic resources of eggplant (Solanum melongena) and allied species: a new challenge for molecular geneticists and eggplant breeders. In 5th International Solanaceae Conference, Nijmegen, Netherlands.
- Dax, E., Livneh, O., Edelbaum, O., Kedar, N., Gavish, N., Karchi, H., Milo, J., Sela, I., and Rabinowit, H. D. 1994. A random amplified polymorphic DNA (RAPD) molecular marker for the Tm-2a gene in tomato. Euphytica 74: 159–163. doi:https://doi.org/10.1007/BF00033782
- De Cremer, K., Mathys, J., Vos, C., Froenicke, L., Michelmore, R. W., Cammue, B. P. A., and De Coninck, B. 2013. RNAseq-based transcriptome analysis of Lactuca sativa infected by the fungal necrotroph Botrytis cinerea. Plant Cell Environ. 36: 1992–2007. doi:https://doi.org/10.1111/pce.12106
- Dijkhuizen, A., Kennard, W. C., Havey, H. J., and Staub, J. E. 1996. RFLP variation and genetic relationships in cultivated cucumber. Euphytica 90: 79–87.
- Ding, Y., Yang, W., Su, C. G., Ma, H., Pan, Y., Zhang, X. G., and Li, J.H. 2019. Tandem 13-lipoxygenase genes in a cluster confers yellow-green leaf in cucumber. IJMS 20: 3102. doi:https://doi.org/10.3390/ijms20123102
- Diouf, I., Albert, E., Duboscq, R., Santoni, S., Bitton, F., Gricourt, J., and Causse, M. 2020. Integration of QTL, transcriptome and polymorphism studies reveals candidate genes for water stress response in tomato. Genes 11: 900. doi:https://doi.org/10.3390/genes11080900
- Dixon, M. S., Hatzixanthis, K., Jones, D. A., Harrison, K., and Jones, J. D. 1998. The tomato Cf-5 disease resistance gene and six homologs show pronounced allelic variation in leucine-rich repeat copy number. Plant Cell. 10: 1915–1925. doi:https://doi.org/10.2307/3870913
- Dixon, M. S., Jones, D. A., Keddie, J. S., Thomas, C. M., Harrison, K., and Jones, J. D. G. 1996. The tomato Cf-2 disease resistance locus comprises two functional genes encoding leucine-rich repeat proteins. Cell 84: 451–459. doi:https://doi.org/10.1016/S0092-8674(00)81290-8
- Djian-Caporalino, C., Fazari, A., Arguel, M. J., Vernie, T., VandeCasteele, C., Faure, I., Brunoud, G., Pijarowski, L., Palloix, A., Lefebvre, V., and Abad, P. 2007. Root-knot nematode (Meloidogyne spp.) Me resistance genes in pepper (Capsicum annuum L.) are clustered on the P9 chromosome. Theor. Appl. Genet. 114: 473–486. doi:https://doi.org/10.1007/s00122-006-0447-3
- Djian-Caporalino, C., Pijarowski, L., Fazari, A., Samson, M., Gaveau, L., O’byrne, C., Lefebvre, V., Caranta, C., Palloix, A., and Abad, P. 2001. High-resolution genetic mapping of the pepper (Capsicum annuum L.) resistance loci Me3 and Me4 conferring heat-stable resistance to root-knot nematodes (Meloidogyne spp.). Theor. Appl. Genet. 103: 592–600.
- Doğanlar, S., Frary, A., Daunay, M. C., Huvenaars, K., Mank, R., and Frary, A. 2014. High resolution map of eggplant (Solanum melongena) reveals extensive chromosome rearrangement in domesticated members of the Solanaceae. Euphytica 198: 231–241. doi:https://doi.org/10.1007/s10681-014-1096-2
- Doganlar, S., Frary, A., Daunay, M. C., Lester, R. N., and Tanksley, S. D. 2002. A comparative genetic linkage map of eggplant (Solanum melongena) and its implications for genome evolution in the Solanaceae. Genetics 161: 1697–1711. doi:https://doi.org/10.1093/genetics/161.4.1697
- Dohm, J. C., Minoche, A. E., Holtgräwe, D., Capella-Gutiérrez, S., Zakrzewski, F., Tafer, H., Rupp, O., Sörensen, T. R., Stracke, R., Reinhardt, R., Goesmann, A., Kraft, T., Schulz, B., Stadler, P. F., Schmidt, T., Gabaldón, T., Lehrach, H., Weisshaar, B., and Himmelbauer, H. 2014. The genome of the recently domesticated crop plant sugar beet (Beta vulgaris). Nature 505: 546–549. doi:https://doi.org/10.1038/nature12817
- Dong, S., Wang, W., Bo, K., Miao, H., Song, S., Wei, S., Zhang, S. P., and Gu, X. 2019. Quantitative trait loci mapping and candidate gene analysis of low temperature tolerance in cucumber seedlings. Front. Plant Sci. 10: 1620. doi:https://doi.org/10.3389/fpls.2019.01620
- Dong, S.Y., Zhang, S., Wei, S., Liu, Y. Y., Li, C. X., Bo, K. L., Miao, H., Gu, X. F., and Zhang, S. P. 2020. Identification of quantitative trait loci controlling high-temperature tolerance in cucumber (Cucumis sativus L.) seedlings. Plants 9: 1155. doi:https://doi.org/10.3390/plants9091155
- Du, H., Wen, C., Zhang, X., Xu, X., Yang, J., Chen, B., and Geng, S. 2019. Identification of a major QTL (qRRs-10.1) that confers resistance to Ralstonia solanacearum in pepper (Capsicum annuum) using SLAF-BSA and QTL mapping. IJMS 20: 5887. doi:https://doi.org/10.3390/ijms20235887
- Duangjit, J., Causse, M., and Sauvage, C. 2016. Efficiency of genomic selection for tomato fruit quality. Mol. Breed. 36: 29.
- Dwivedi, N., Kumar, R., Paliwal, R., Kumar, U., Kumar, S., Singh, M., and Singh, R. K. 2015. QTL mapping for important horticultural traits in pepper (Capsicum annuum L.). J. Plant Biochem. Biotechnol. 24: 154–160. doi:https://doi.org/10.1007/s13562-013-0247-1
- Eggink, P. M., Tikunov, Y., Maliepaard, C., Haanstra, J. P. W., De Rooij, H., Vogelaar, A., Gutteling, E. W., Freymark, G., Bovy, A. G., and Visser, R. G. F. 2014. Capturing flavors from Capsicum baccatum by introgression in sweet pepper. Theor. Appl. Genet. 127: 373–390. doi:https://doi.org/10.1007/s00122-013-2225-3
- Elitzur, T., Nahum, H., Borovsky, Y., Pekker, I., Eshed, Y., and Paran, I. 2009. Co-ordinated regulation of flowering time, plant architecture and growth by FASCICULATE: the pepper orthologue of SELF PRUNING. J. Exp. Bot. 60: 869–880. doi:https://doi.org/10.1093/jxb/ern334
- Elshire, R. J., Glaubitz, J. C., Sun, Q., Poland, J. A., Kawamoto, K., Buckler, E. S., and Mitchell, S. E. 2011. A robust, simple genotyping-by-sequencing (GBS) approach for high diversity species. PLoS ONE 6: e19379. doi:https://doi.org/10.1371/journal.pone.0019379
- FAOSTAT. 2020. Crops data for 2018. http://faostat3.fao.org
- Fazari, A., Palloix, A., Wang, L., Yan Hua, M., Sage‐Palloix, A. M., Zhang, B. X., and Djian‐Caporalino, C. 2012. The root‐knot nematode resistance N‐gene co‐localizes in the Me‐genes cluster on the pepper (Capsicum annuum L.) P9 chromosome. Plant Breed. 131: 665–673. doi:https://doi.org/10.1111/j.1439-0523.2012.01994.x
- Feng, C., Bluhm, B. H., and Correll, J. C. 2015. Construction of a spinach bacterial artificial chromosome (BAC) library as a resource for gene identification and marker development. Plant Mol. Biol. Rep. 33: 1996–2005. doi:https://doi.org/10.1007/s11105-015-0891-9
- Feng, C., Bluhm, B., Shi, A., and Correll, J. C. 2018a. Development of molecular markers linked to three spinach downy mildew resistance loci. Euphytica 214: 174. doi:https://doi.org/10.1007/s10681-018-2258-4
- Feng, C., Correll, J. C., Kammeijer, K. E., and Koike, S. T. 2014. Identification of new races and deviating strains of the spinach downy mildew pathogen Peronospora farinosa f. sp. spinaciae. Plant Dis. 98: 145–152. doi:https://doi.org/10.1094/PDIS-04-13-0435-RE
- Feng, C., Saito, K., Liu, B., Manley, A., Kammeijer, K., Mauzey, S. J., Koike, S., and Correll, J. C. 2018b. New races and novel strains of the spinach downy mildew pathogen Peronospora effusa. Plant Dis. 102: 613–618. doi:https://doi.org/10.1094/PDIS-05-17-0781-RE
- Feng, S., Zhang, J., Mu, Z., Wang, Y., Wen, C., Wu, T., Yu, C., Li, Z., and Wang, H. 2020. Recent progress on the molecular breeding of Cucumis sativus L. in China. Theor. Appl. Genet. 133: 1777–1790. doi:https://doi.org/10.1007/s00122-019-03484-0
- Foolad, M. R. 2007. Genome mapping and molecular breeding of tomato. Int. J. Plant Genomics 2007: 64358.
- Foolad, M. R., and Chen, F. Q. 1999. RFLP mapping of QTLs conferring salt tolerance during the vegetative stage in tomato. Theor. Appl. Genet. 99: 235–243.
- Foolad, M. R., and Jones, R. A. 1993. Mapping salt-tolerance genes in tomato (Lycopersicon esculentum) using trait-based marker analysis. Theor. Appl. Genet. 87: 184–192. doi:https://doi.org/10.1007/BF00223763
- Foolad, M. R., and Panthee, D. R. 2012. Marker-assisted selection in tomato breeding. Crit. Rev. Plant Sci. 31: 93–123. doi:https://doi.org/10.1080/07352689.2011.616057
- Foolad, M. R., Chen, F. Q., and Lin, G. Y. 1998a. RFLP mapping of QTLs conferring salt tolerance during germination in an interspecific cross of tomato. Theor. Appl. Genet. 97: 1133–1144.
- Foolad, M. R., Chen, F. Q., and Lin, G. Y. 1998b. RFLP mapping of QTLs conferring cold tolerance during seed germination in an interspecific cross of tomato. Mol. Breed. 4: 519–529. doi:https://doi.org/10.1023/A:1009648112491
- Foolad, M. R., Stoltz, T., Dervinis, C., Rodriguez, R. L., and Jones, R. A. 1997. Mapping QTLs conferring salt tolerance during germination in tomato by selective genotyping. Mol. Breed. 3: 269–277. doi:https://doi.org/10.1023/A:1009668325331
- Foolad, M. R., Zhang, L., and Lin, G. Y. 2001. Identification and validation of QTLs for salt tolerance during vegetative growth in tomato by selective genotyping. Genome 44: 444–454. doi:https://doi.org/10.1139/g01-030
- Foolad, M. R., Zhang, L., and Subbiah, P. 2003. Genetics of drought tolerance during seed germination in tomato: inheritance and QTL mapping. Genome 46: 536–545. doi:https://doi.org/10.1139/g03-035
- Frary, A., Frary, A., Daunay, M. C., Huvenaars, K., Mank, R., and Doğanlar, S. 2014. QTL hotspots in eggplant (Solanum melongena) detected with a high resolution map and CIM analysis. Euphytica 197: 211–228. doi:https://doi.org/10.1007/s10681-013-1060-6
- Fray, R. G., and Grierson, D. 1993. Identification and genetic analysis of normal and mutant phytoene synthase genes of tomato by sequencing, complementation and co-suppression. Plant Mol. Biol. 22: 589–602. doi:https://doi.org/10.1007/BF00047400
- Friedman, M. 2015. Chemistry and anticarcinogenic mechanisms of glycoalkaloids produced by eggplants, potatoes, and tomatoes. J. Agric. Food Chem. 63: 3323–3337. doi:https://doi.org/10.1021/acs.jafc.5b00818
- Fukuoka, H., Miyatake, K., Nunome, T., Negoro, S., Shirasawa, K., Isobe, S., Asamizu, E., Yamaguchi, H., and Ohyama, A. 2012. Development of gene-based markers and construction of an integrated linkage map in eggplant by using Solanum orthologous (SOL) gene sets. Theor. Appl. Genet. 125: 47–56. doi:https://doi.org/10.1007/s00122-012-1815-9
- Fulop, D., Ranjan, A., Ofner, I., Covington, M. F., Chitwood, D. H., West, D., Ichihashi, Y., Headland, L., Zamir, D., Maloof, J. N., and Sinha, N. R. 2016. A new advanced backcross tomato population enables high resolution leaf QTL mapping and gene identification. Genes Genom. Genet. 6: 3169–3184. doi:https://doi.org/10.1534/g3.116.030536
- Fulton, T. M., Van der Hoeven, R., Eannetta, N. T., and Tanksley, S. D. 2002. Identification, analysis, and utilization of conserved ortholog set markers for comparative genomics in higher plants. Plant Cell. 14: 1457–1467. doi:https://doi.org/10.1105/tpc.010479
- Galeano, C. H., Froenicke, L., Duitama, J., Kozik, A., Reyes-Chin-Wo, S., Carrasquilla-Garcia, N., Simko, I., Hayes, R. J., and Michelmore, R. 2014. Development of high-density intra-specific linkage map using genotyping by sequencing (GBS) in lettuce. In International Plant and Animal Genome Conference XXII, San Diego, CA, 2014, poster #686.
- Galla, G., Ghedina, A., Tiozzo, C. S., and Barcaccia, G. 2016. Toward a first high-quality genome draft for marker-assisted breeding in leaf chicory, radicchio (Cichorium intybus L.). In Plant Genomics; Abdurakhmonov, I. Y., Ed. InTech: Rijeka.
- Gao, L., Gonda, I., Sun, H., Ma, Q., Bao, K., Tieman, D. M., Burzynski-Chang, E. A., Fish, T. L., Stromberg, K. A., Sacks, G. L., Thannhauser, T. W., Foolad, M. R., Diez, M. J., Blanca, J., Canizares, J., Xu, Y., van der Knaap, E., Huang, S., Klee, H. J., Giovannoni, J. J., and Fei, Z. 2019. The tomato pan-genome uncovers new genes and a rare allele regulating fruit flavor. Nat. Genet. 51: 1044–1051. doi:https://doi.org/10.1038/s41588-019-0410-2
- Gao, Z.H., Zhang, H. Y., Cao, C. X., Han, J., Li, H., and Ren, Z. H. 2020. QTL mapping for cucumber fruit size and shape with populations from long and round fruited inbred lines. Hort. Plant J. 6: 132–144. doi:https://doi.org/10.1016/j.hpj.2020.04.004
- GENESYS. 2020. The global gateway to genetic resources. https://www.genesys-pgr.org/
- Gerszberg, A., and Hnatuszko-Konka, K. 2017. Tomato tolerance to abiotic stress: a review of most often engineered target sequences. Plant Growth Regul. 83: 175–198. doi:https://doi.org/10.1007/s10725-017-0251-x
- Ghedina, A., Galla, G., Cadalen, T., Hilbert, J.L., Tiozzo, C. S., and Barcaccia, G. 2015. A method for genotyping elite breeding stocks of leaf chicory (Cichorium intybus L.) by assaying mapped microsatellite marker loci. BMC Res. Notes 8: 831. doi:https://doi.org/10.1186/s13104-015-1819-z
- Gisbert, C., Prohens, J., Raigón, M. D., Stommel, J. R., and Nuez, F. 2011. Eggplant relatives as sources of variation for developing new rootstocks: effects of grafting on eggplant yield and fruit apparent quality and composition. Sci. Hortic. 128:14–22. doi:https://doi.org/10.1016/j.scienta.2010.12.007
- Glaser, L. K., Thompson, G. D., and Handy, C. R. 2001. Recent changes in marketing and trade practices in the US lettuce and fresh-cut vegetable industries. Agriculture Information Bulletin, no. 767. US Department of Agriculture, Economic Research Service, Washington, DC, USA.
- Goddard, M. E., and Hayes, B. J. 2007. Genomic selection. J. Anim. Breed. Genet. 124: 323–330. doi:https://doi.org/10.1111/j.1439-0388.2007.00702.x
- Gonda, I., Ashrafi, H., Lyon, D. A., Strickler, S. R., Hulse-Kemp, A. M., Ma, Q., Sun, H., Stoffel, K., Powell, A. F., Futrell, S., Thannhauser, T. W., Fei, Z., Van Deynze, A. E., Mueller, L. A., Giovannoni, J. J., and Foolad, M. R. 2019. Sequencing-based bin map construction of a tomato mapping population, facilitating high-resolution quantitative trait loci detection. Plant Genome 12: 180010. doi:https://doi.org/10.3835/plantgenome2018.02.0010
- Gonthier, L., Blassiau, C., Mörchen, M., Cadalen, T., Poiret, M., Hendriks, T., and Quillet, M. C. 2013. High-density genetic maps for loci involved in nuclear male sterility (NMS1) and sporophytic self-incompatibility (S-locus) in chicory (Cichorium intybus L., Asteraceae). Theor. Appl. Genet. 126: 2103–2121. doi:https://doi.org/10.1007/s00122-013-2122-9
- Govindarajulu, M., Epstein, L., Wroblewski, T., and Michelmore, R. W. 2015. Host-induced gene silencing inhibits the biotrophic pathogen causing downy mildew of lettuce. Plant Biotechnol. J. 13: 875–883. doi:https://doi.org/10.1111/pbi.12307
- Gramazio, P., Prohens, J., Plazas, M., Andújar, I., Herraiz, F. J., Castillo, E., Knapp, S., Meyer, R. S., and Vilanova, S. 2014. Location of chlorogenic acid biosynthesis pathway and polyphenol oxidase genes in a new interspecific anchored linkage map of eggplant. BMC Plant Biol. 14: 350. doi:https://doi.org/10.1186/s12870-014-0350-z
- Gramazio, P., Prohens, J., Plazas, M., Mangino, G., Herraiz, F. J., and Vilanova, S. 2017. Development and genetic characterization of advanced backcross materials and an introgression line population of Solanum incanum in a S. melongena background. Front. Plant Sci. 8: 1477. doi:https://doi.org/10.3389/fpls.2017.01477
- Gramazio, P., Yan, H., Hasing, T., Vilanova, S., Prohens, J., and Bombarely, A. 2019. Whole-genome resequencing of seven eggplant (Solanum melongena) and one wild relative (S. incanum) accessions provides new insights and breeding tools for eggplant enhancement. Front. Plant Sci. 10: 1220. doi:https://doi.org/10.3389/fpls.2019.01220
- Greenhut, R. F. 2018. Developing baby leaf spinach with reduced cadmium accumulation. M.S. Thesis, University of California, Davis, CA, USA.
- Grube, R. C., Wintermantel, W. M., Hand, P., Aburomia, R., Pink, D. A. C., and Ryder, E. J. 2005. Genetic analysis and mapping of resistance to lettuce dieback: a soilborne disease caused by tombusviruses. Theor. Appl. Genet. 110: 259–268. doi:https://doi.org/10.1007/s00122-004-1825-3
- Grushetskaya, Z. E., Lemesh, V. A., Poliksenova, V. D., and Khotyleva, L. V. 2007. Mapping of the Cf-6 tomato leaf mould resistance locus using SSR markers. Russ. J. Genet. 43: 1266–1270. doi:https://doi.org/10.1134/S1022795407110099
- Gu, X., Cao, Y., Zhang, Z., Zhang, B., Hong, Z., Zhang, X., Wang, H., Li, X., and Wang, L. 2019. Genetic diversity and population structure analysis of Capsicum germplasm accessions. J. Integr. Agric. 18: 1312–1320. doi:https://doi.org/10.1016/S2095-3119(18)62132-X
- Gulyas, G., Pakozdi, K., Lee, J. S., and Hirata, Y. 2006. Analysis of fertility restoration by using cytoplasmic male-sterile red pepper (Capsicum annuum L.) lines. Breed. Sci. 56: 331–334. doi:https://doi.org/10.1270/jsbbs.56.331
- Guo, G., Wang, S., Liu, J., Pan, B., Diao, W., Ge, W., Gao, C., and Snyder, J. C. 2017. Rapid identification of QTLs underlying resistance to Cucumber mosaic virus in pepper (Capsicum frutescens). Theor. Appl. Genet. 130: 41–52. doi:https://doi.org/10.1007/s00122-016-2790-3
- Gürbüz, N., Uluişik, S., Frary, A., Frary, A., and Doğanlar, S. 2018. Health benefits and bioactive compounds of eggplant. Food Chem. 268: 602–610. doi:https://doi.org/10.1016/j.foodchem.2018.06.093
- Gyawali, S., Du Toit, L. J., Shi, A., and Correll, J. C. 2019. Genome wide association studies of Fusarium wilt resistance in spinach (Spinacia oleracea L.). Phytopathology 109: 83–84.
- Hadasch, S., Simko, I., Hayes, R. J., Ogutu, J. O., and Piepho, H. P. 2016. Comparing the predictive abilities of phenotypic and marker-assisted selection methods in a biparental lettuce population. Plant Genome 9. doi:https://doi.org/10.3835/plantgenome2015.03.0014
- Hamilton, J. P., Sim, S. C., Stoffel, K., Van Deynze, A., Buell, C. R., and Francis, D. M. 2012. Single nucleotide polymorphism discovery in cultivated tomato via sequencing by synthesis. Plant Genome 5: 17–29. doi:https://doi.org/10.3835/plantgenome2011.12.0033
- Han, K., Jang, S., Lee, J. H., Lee, D. G., Kwon, J. K., and Kang, B. C. 2019. A MYB transcription factor is a candidate to control pungency in Capsicum annuum. Theor. Appl. Genet. 132: 1235–1246. doi:https://doi.org/10.1007/s00122-018-03275-z
- Han, K., Jeong, H. J., Yang, H. B., Kang, S. M., Kwon, J. K., Kim, S., Choi, D., and Kang, B. C. 2016a. An ultra-high-density bin map facilitates high-throughput QTL mapping of horticultural traits in pepper (Capsicum annuum). DNA Res. 23: 81–91. doi:https://doi.org/10.1093/dnares/dsv038
- Han, K., Lee, H. Y., Ro, N. Y., Hur, O. S., Lee, J. H., Kwon, J. K., and Kang, B. C. 2018. QTL mapping and GWAS reveal candidate genes controlling capsaicinoid content in Capsicum. Plant Biotechnol. J. 16: 1546–1558. doi:https://doi.org/10.1111/pbi.12894
- Han, R., Truco, M. J., Lavelle, D. O., and Michelmore, R. W. 2021. A composite analysis of flowering time regulation in lettuce. Front. Plant Sci. 12: 632708. doi:https://doi.org/10.3389/fpls.2021.632708
- Han, Y. H., Pan, J. S., Thammapichai, P., Li, Z. Y., and Weng, Y. 2016b. Asynchronous meiosis in Cucumis hystrix-cucumber synthetic tetraploids resulting in low male fertility. Crop J. 4: 275–279. doi:https://doi.org/10.1016/j.cj.2016.05.003
- Hao, N., Han, D. G., Huang, K., Du, Y. L., Yang, J. J., Zhang, J., Wen, C. L., and Wu, T. 2020. Genome-based breeding approaches in major vegetable crops . Theor. Appl. Genet. 133: 1739–1752. doi:https://doi.org/10.1007/s00122-019-03477-z
- Hartman, Y., Hooftman, D. A., Uwimana, B., Schranz, M. E., Van de Wiel, C. C., Smulders, M. J., Visser, R. G., Michelmore, R. W., and Van Tienderen, P. H. 2014. Abiotic stress QTL in lettuce crop-wild hybrids: comparing greenhouse and field experiments. Ecol. Evol. 4: 2395–2409. doi:https://doi.org/10.1002/ece3.1060
- Hartman, Y., Hooftman, D. A., Uwimana, B., van de Wiel, C. C., Smulders, M. J., Visser, R. G., and van Tienderen, P. H. 2012. Genomic regions in crop-wild hybrids of lettuce are affected differently in different environments: implications for crop breeding. Evol. Appl. 5: 629–640. doi:https://doi.org/10.1111/j.1752-4571.2012.00240.x
- Hartman, Y., Uwimana, B., Hooftman, D. A., Schranz, M. E., van de Wiel, C. C., Smulders, M. J., Visser, R. G., and van Tienderen, P. H. 2013. Genomic and environmental selection patterns in two distinct lettuce crop-wild hybrid crosses. Evol. Appl. 6: 569–584. doi:https://doi.org/10.1111/eva.12043
- Hasnunnahar M., Khan, M. M. R., and Isshiki, S. 2012. Inheritance analysis of fertility restoration genes (Rf) in a male sterile system of eggplant using cytoplasm of Solanum grandifolium. Aust. J. Crop Sci. 6: 475–479.
- Hayashi, E., Aoyama, N., and Still, D. W. 2008. Quantitative trait loci associated with lettuce seed germination under different temperature and light environments. Genome 51: 928–947. doi:https://doi.org/10.1139/G08-077
- Hayashi, E., You, Y., Lewis, R., Calderon, M. C., Wan, G., and Still, D. W. 2012. Mapping QTL, epistasis and genotype × environment interaction of antioxidant activity, chlorophyll content and head formation in domesticated lettuce (Lactuca sativa). Theor. Appl. Genet. 124: 1487–1502. doi:https://doi.org/10.1007/s00122-012-1803-0
- Hayes, R. J., Galeano, C. H., Luo, Y., Antonise, R., and Simko, I. 2014a. Inheritance of decay of fresh-cut lettuce in a recombinant inbred line population from ‘Salinas 88’ × ‘La Brillante’. J. Amer. Soc. Hort. Sci. 139: 388–398. doi:https://doi.org/10.21273/JASHS.139.4.388
- Hayes, R. J., McHale, L. K., Vallad, G. E., Truco, M. J., Michelmore, R. W., Klosterman, S. J., Maruthachalam, K., and Subbarao, K. V. 2011. The inheritance of resistance to Verticillium wilt caused by race 1 isolates of Verticillium dahliae in the lettuce cultivar La Brillante. Theor. Appl. Genet. 123: 509–517. doi:https://doi.org/10.1007/s00122-011-1603-y
- Hayes, R. J., Trent, M. A., Truco, M. J., Antonise, R., Michelmore, R. W., and Bull, C. T. 2014b. The inheritance of resistance to bacterial leaf spot of lettuce caused by Xanthomonas campestris pv. vitians in three lettuce cultivars. Hortic. Res. 1: 14066. doi:https://doi.org/10.1038/hortres.2014.66
- Hayes, R., and Simko, I. 2016. Breeding lettuce for improved fresh-cut processing. Acta Hortic. 1141: 65–76. doi:https://doi.org/10.17660/ActaHortic.2016.1141.7
- Hayes, R., Simko, I., Mou, B., and McCreight, J. D. 2010. Lettuce breeding, USDA-ARS. In California Leafy Greens Research Program. https://calgreens.org/control/uploads/2009-10_CLRBP_-_USDA_final_report.pdf
- He, C., Poysa, V., and Yu, K. 2003. Development and characterization of simple sequence repeat (SSR) markers and their use in determining relationships among Lycopersicon esculentum cultivars. Theor. Appl. Genet. 106: 363–373. doi:https://doi.org/10.1007/s00122-002-1076-0
- Heffner, E. L., Sorrells, M. E., and Jannink, J. L. 2009. Genomic selection for crop improvement. Crop Sci. 49: 1–12. doi:https://doi.org/10.2135/cropsci2008.08.0512
- Hill, T. A., Chunthawodtiporn, J., Ashrafi, H., Stoffel, K., Weir, A., and Van Deynze, A. 2017. Regions underlying population structure and the genomics of organ size determination in Capsicum annuum. Plant Genome 10. doi:https://doi.org/10.3835/plantgenome2017.03.0026
- Hirakawa, H., Shirasawa, K., Miyatake, K., Nunome, T., Negoro, S., Ohyama, A., Yamaguchi, H., Sato, S., Isobe, S., Tabata, S., and Fukuoka, H. 2014. Draft genome sequence of eggplant (Solanum melongena L.): the representative Solanum species indigenous to the Old world. DNA Res. 21: 649–660. doi:https://doi.org/10.1093/dnares/dsu027
- Hoang, N. H., Yang, H. B., and Kang, B. C. 2013. Identification and inheritance of a new source of resistance against Tomato spotted wilt virus (TSWV) in Capsicum. Sci. Hortic. 161: 8–14. doi:https://doi.org/10.1016/j.scienta.2013.06.033
- Holdsworth, W. L., and Mazourek, M. 2015. Development of user-friendly markers for the pvr1 and Bs3 disease resistance genes in pepper. Mol. Breed. 35: 28.
- Hong, J. P., Ro, N., Lee, H. Y., Kim, G. W., Kwon, J. K., Yamamoto, E., and Kang, B. C. 2020. Genomic selection for prediction of fruit-related traits in pepper (Capsicum spp.). Front. Plant Sci. 11: 1575. doi:https://doi.org/10.3389/fpls.2020.570871
- Hosmani, P. S., Flores-Gonzalez, M., van de Geest, H., Maumus, F., Bakker, L. V., Schijlen, E., van Haarst, J., Cordewener, J., Sanchez-Perez, G., Peters, S., Fei, Z., Giovannoni, J. J., Mueller, L. A., and Saha, S. 2019. An improved de novo assembly and annotation of the tomato reference genome using single-molecule sequencing, Hi-C proximity ligation and optical maps. bioRxiv 767764.
- Howard, L. R., Pandjaitan, N., Morelock, T., and Gil, M. I. 2002. Antioxidant capacity and phenolic content of spinach as affected by genetics and growing season. J. Agric. Food Chem. 50: 5891–5896. doi:https://doi.org/10.1021/jf020507o
- Hu, J., Mou, B., and Vick, B. A. 2007. Genetic diversity of 38 spinach (Spinacia oleracea L.) germplasm accessions and 10 commercial hybrids assessed by TRAP markers. Genet. Resour. Crop Evol. 54: 1667–1674. doi:https://doi.org/10.1007/s10722-006-9175-4
- Hu, L. L., Zhang, H. Q., Xie, C., Wang, J., Zhang, J. Y., Wang, H., Weng, Y., Chen, P., and Li, Y.H. 2020. A mutation in CsHD encoding a histidine and aspartic acid domain containing protein leads to yellow young leaf-1 (yyl-1) in cucumber (Cucumis sativus L.). Plant Sci. 293: 110470.
- Huang, S., Li, R., Zhang, Z. H., Li, L., Gu, X. F., Fan, W., Lucas, W. J., Wang, X. W., Xie, B. Y., Nie, P. X., Ren, Y. Y., Zhu, H. M., Li, J., Jin, W. W., Fei, Z. J., Li, G. C., Staub, J., Kilian, A., van der Vossen, E. A. G., Wu, Y., Guo, J., He, J., Jia, Z., Ren, Y., Tian, G., Lu, Y., Ruan, J., Qian, W., Wang, M., Huang, Q., Li, B., Xuan, Z., Cao, J., Zhang, J., Cai, J., Bai, Y., Zhao, B., Han, Y., Li, Y., Li, X., Wang, S., Shi, Q., Liu, S., Cho, W. K., Kim, J. Y., Xu, Y., Heller-Uszynska, K., Miao, H., Cheng, Z., Zhang, Z., Wu, J., Yang, Y., Kang, J., Li, M., Liang, H., Ren, X., Shi, Z., Wen, M., Jian, M., Yang, H., Zhang, G., Yang, Z., Chen, R., Liu, S., Li, J., Ma, L., Liu, H., Zhou, Y., Zhao, J., Fang, X., Li, L., Fang, L., Li, Y., Liu, D., Zheng, H., Zhang, Y., Qin, N., Li, Z., Yang, S., Yang, J., Kristiansen, B. K., Zheng, H., Li, S., Zhang, X., Yang, H., Wang, J., Sun, Z., Zhang, B., Jiang, S., Wang, J., Du, Y., and Li, J. 2009. The genome of the cucumber, Cucumis sativus L. Nat. Genet. 41: 1275–1281.
- Huh, J. H., Kang, B. C., Nahm, S. H., Kim, S., Ha, K. S., Lee, M. H., and Kim, B. D. 2001. A candidate gene approach identified phytoene synthase as the locus for mature fruit color in red pepper (Capsicum spp.). Theor. Appl. Genet. 102: 524–530.
- Hulse-Kemp, A. M., Ashrafi, H., Plieske, J., Lemm, J., Stoffel, K., Hill, T., Luerssen, H., Pethiyagoda, C. L., Lawley, C. T., Ganal, M. W., and Van Deynze, A. 2016. A HapMap leads to a Capsicum annuum SNP infinium array: a new tool for pepper breeding. Hortic. Res. 3: 16036. doi:https://doi.org/10.1038/hortres.2016.36
- Hulse-Kemp, A. M., Maheshwari, S., Stoffel, K., Hill, T. A., Jaffe, D., Williams, S. R., Weisenfeld, N., Ramakrishnan, S., Kumar, V., Shah, P., Schatz, M. C., Church, D. M., and Van Deynze, A. 2018. Reference quality assembly of the 3.5-Gb genome of Capsicum annuum from a single linked-read library . Hortic. Res. 5: 4. doi:https://doi.org/10.1038/s41438-017-0011-0
- Hulse-Kemp, A. M., Bostan, H., Chen, S., Ashrafi, H., Stoffel, K., Sanseverino, W., Li, L., Cheng, S., Schatz, M. C., Garvin, T., du Toit, L. J., Tseng, E., Chin, J., Iorizzo, M., and Van Deynze, A. 2021. An anchored chromosome-scale genome assembly of spinach improves annotation and reveals extensive gene rearrangements in euasterids. Plant Genome e20101.
- Hurtado, M., Vilanova, S., Plazas, M., Gramazio, P., Herraiz, F. J., Andújar, I., and Prohens, J. 2013. Phenomics of fruit shape in eggplant (Solanum melongena L.) using Tomato Analyzer software. Sci. Hortic. 164: 625–632. doi:https://doi.org/10.1016/j.scienta.2013.10.028
- Hurtado-Hernandez, H., and Smith, P. G. 1985. Inheritance of mature fruit color in Capsicum annuum L. J. Hered. 76: 211–213. doi:https://doi.org/10.1093/oxfordjournals.jhered.a110070
- Hwang, J., Li, J., Liu, W. Y., An, S.J., Cho, H., Her, N. H., Yeam, I., Kim, D., and Kang, B. C. 2009. Double mutations in eIF4E and eIFiso4E confer recessive resistance to Chilli veinal mottle virus in pepper. Mol. Cells 27: 329–336. doi:https://doi.org/10.1007/s10059-009-0042-y
- Ibiza, V. P., Cañizares, J., and Nuez, F. 2010. EcoTILLING in Capsicum species: searching for new virus resistances. BMC Genomics 11: 631. doi:https://doi.org/10.1186/1471-2164-11-631
- Iizuka, M., and Janick, J. 1971. Sex chromosome variation in Spinacia oleracea L. J. Hered. 62: 349–352. doi:https://doi.org/10.1093/oxfordjournals.jhered.a108192
- Inderbitzin, P., Christopoulou, M., Lavelle, D., Reyes-Chin-Wo, S., Michelmore, R. W., Subbarao, K. V., and Simko, I. 2019. The LsVe1L allele provides a molecular marker for resistance to Verticillium dahliae race 1 in lettuce. BMC Plant Biol. 19: 305. doi:https://doi.org/10.1186/s12870-019-1905-9
- Irish, B. M., Correll, J. C., Feng, C., Bentley, T., and De Los Reyes, B. G. 2008. Characterization of a resistance locus (Pfs-1) to the spinach downy mildew pathogen (Peronospora farinosa f. sp. spinaciae) and development of a molecular marker linked to Pfs-1. Phytopathology 98: 894–900. doi:https://doi.org/10.1094/PHYTO-98-8-0894
- Irish, B. M., Correll, J. C., Koike, S. T., Schafer, J., and Morelock, T. E. 2003. Identification and cultivar reaction to three new races of the spinach downy mildew pathogen from the United States and Europe. Plant Dis. 87: 567–572. doi:https://doi.org/10.1094/PDIS.2003.87.5.567
- Ishibashi, K., Masuda, K., Naito, S., Meshi, T., and Ishikawa, M. 2007. An inhibitor of viral RNA replication is encoded by a plant resistance gene. Proc. Natl. Acad. Sci. U.S.A. 104: 13833–13838. doi:https://doi.org/10.1073/pnas.0703203104
- Jacob, C., and Melotto, M. 2019. Human pathogen colonization of lettuce dependent upon plant genotype and defense response activation. Front. Plant Sci. 10: 1769. doi:https://doi.org/10.3389/fpls.2019.01769
- Jaganathan, D., Bohra, A., Thudi, M., and Varshney, R. K. 2020. Fine mapping and gene cloning in the post-NGS era: advances and prospects. Theor. Appl. Genet. 133: 1791–1810. doi:https://doi.org/10.1007/s00122-020-03560-w
- Jahn, M., Paran, I., Hoffmann, K., Radwanski, E. R., Livingstone, K. D., Grube, R. C., Aftergoot, E., Lapidot, M., and Moyer, J. 2000. Genetic mapping of the Tsw locus for resistance to the Tospovirus tomato spotted wilt virus in Capsicum spp. and its relationship to the Sw-5 gene for resistance to the same pathogen in tomato. Mol. Plant Microbe Interact. 13: 673–682. doi:https://doi.org/10.1094/MPMI.2000.13.6.673
- Jang, S. J., Jeong, H. B., Jung, A., Kang, M. Y., Kim, S., Ha, S. H., Kwon, J. K., and Kang, B. C. 2020. Phytoene synthase 2 can compensate for the absence of Psy1 in the control of color in Capsicum fruit. J. Exp. Bot. 71: 3417–3427. doi:https://doi.org/10.1093/jxb/eraa155
- Janick, J. 2015. Hybrids in horticultural crops. In Concepts and Breeding of Heterosis in Crop Plants. Lamkey, K. R., and Staub J. E., Eds. Crop Science Society of America: Madison, WI, pp 45–56.
- Janick, J., and Stevenson, E. C. 1955. Genetics of the monoecious character in spinach. Genetics 40: 429–437. doi:https://doi.org/10.1093/genetics/40.4.429
- Jeifetz, D., David-Schwartz, R., Borovsky, Y., and Paran, I. 2011. CaBLIND regulates axillary meristem initiation and transition to flowering in pepper. Planta 234: 1227–1236. doi:https://doi.org/10.1007/s00425-011-1479-8
- Jenni, S., Truco, M. J., and Michelmore, R. W. 2013. Quantitative trait loci associated with tipburn, heat stress-induced physiological disorders, and maturity traits in crisphead lettuce. Theor. Appl. Genet. 126: 3065–3079. doi:https://doi.org/10.1007/s00122-013-2193-7
- Jeong, H. B., Kang, M. Y., Jung, A., Han, K., Lee, J. H., Jo, J., Lee, H. Y., An, J. W., Kim, S., and Kang, B. C. 2019. Single‐molecule real‐time sequencing reveals diverse allelic variations in carotenoid biosynthetic genes in pepper (Capsicum spp.). Plant Biotechnol. J. 17: 1081–1093. doi:https://doi.org/10.1111/pbi.13039
- Jeong, H. S., Jang, S., Han, K., Kwon, J. K., and Kang, B. C. 2015. Marker-assisted backcross breeding for development of pepper varieties (Capsicum annuum) containing capsinoids. Mol. Breed. 35: 1–10.
- Jeong, H. B., Jang, S. J., Kang, M. Y., Kim, S., Kwon, J. K., and Kang, B. C. 2020. Candidate gene analysis reveals that the fruit color locus C1 corresponds to PRR2 in pepper (Capsicum frutescens). Front. Plant Sci. 11: 399. doi:https://doi.org/10.3389/fpls.2020.00399
- Jeong, H. J., Kwon, J. K., Pandeya, D., Hwang, J., Hoang, N. H., Bae, J. H., and Kang, B. C. 2012. A survey of natural and ethyl methane sulfonate-induced variations of eIF4E using high-resolution melting analysis in Capsicum. Mol. Breed. 29: 349–360. doi:https://doi.org/10.1007/s11032-011-9550-5
- Jeong, K., Choi, D., and Lee, J. 2018. Fine mapping of the genic male-sterile ms1 gene in Capsicum annuum L. Theor. Appl. Genet. 131: 183–191. doi:https://doi.org/10.1007/s00122-017-2995-0
- Jeuken, M., and Lindhout, P. 2002. Lactuca saligna, a non-host for lettuce downy mildew (Bremia lactucae), harbors a new race-specific Dm gene and three QTLs for resistance . Theor. Appl. Genet. 105: 384–391. doi:https://doi.org/10.1007/s00122-002-0943-z
- Jeuken, M., Pelgrom, K., Stam, P., and Lindhout, P. 2008. Efficient QTL detection for nonhost resistance in wild lettuce: backcross inbred lines versus F(2) population. Theor. Appl. Genet. 116: 845–857. doi:https://doi.org/10.1007/s00122-008-0718-2
- Ji, Y. F., and Scott, J. W. 2006. Ty-3, a begomovirus resistance locus linked to Ty-1 on chromosome 6 of tomato. Rep. Tomato Genet. Coop. 56: 22–25.
- Jia, M. 2019. Genetic characterization and mapping of late blight resistance genes in the wild tomato accession PI 270443. Dissertation, The Pennsylvania State University, University Park, PA, USA.
- Jo, J., Venkatesh, J., Han, K., Lee, H. Y., Choi, G. J., Lee, H. J., Choi, D., and Kang, B. C. 2017. Molecular mapping of PMR1, a novel locus conferring resistance to powdery mildew in pepper (Capsicum annuum). Front. Plant Sci. 8: 2090. doi:https://doi.org/10.3389/fpls.2017.02090
- Jo, Y. D., Ha, Y., Lee, J. H., Park, M., Bergsma, A. C., Choi, H. I., Goritschnig, S., Kloosterman, B., van Dijk, P. J., Choi, D., and Kang, B. C. 2016. Fine mapping of Restorer-of-fertility in pepper (Capsicum annuum L.) identified a candidate gene encoding a pentatricopeptide repeat (PPR)-containing protein. Theor. Appl. Genet. 129: 2003–2017. doi:https://doi.org/10.1007/s00122-016-2755-6
- Johnson, E. J. 2002. The role of carotenoids in human health. Nutr. Clin. Care 5: 56–65. doi:https://doi.org/10.1046/j.1523-5408.2002.00004.x
- Johnson, W., Jackson, L., Ochoa, O., Van Wijk, R., Peleman, J., Clair, D. S., and Michelmore, R. W. 2000. Lettuce, a shallow-rooted crop, and Lactuca serriola, its wild progenitor, differ at QTL determining root architecture and deep soil water exploitation. Theor. Appl. Genet. 101: 1066–1073.
- Jones, D. A., Thomas, C. M., Hammond-Kosack, K. E., Balint-Kurti, P. J., and Jones, J. D. G. 1994. Isolation of the tomato Cf-9 gene for resistance to Cladosporium fulvum by transposon tagging. Science 266: 789–793. doi:https://doi.org/10.1126/science.7973631
- Joshi, V., Joshi, M., and Penalosa, A. 2020. Comparative analysis of tissue-specific transcriptomic responses to nitrogen stress in spinach (Spinacia oleracea). PLoS ONE 15: e0232011. doi:https://doi.org/10.1371/journal.pone.0232011
- Jung, S., Venkatesh, J., Kang, M. Y., Kwon, J. K., and Kang, B. C. 2019. A non-LTR retrotransposon activates anthocyanin biosynthesis by regulating a MYB transcription factor in Capsicum annuum. Plant Sci. 287: 110181. doi:https://doi.org/10.1016/j.plantsci.2019.110181
- Jupe, F., Witek, K., Verweij, W., Sliwka, J., Pritchard, L., Etherington, G. J., Maclean, D., Cock, P. J., Leggett, R. M., Bryan, G. J., Cardle, L., Hein, I., and Jones, J. D. 2013. Resistance gene enrichment sequencing (RenSeq) enables reannotation of the NB-LRR gene family from sequenced plant genomes and rapid mapping of resistance loci in segregating populations. Plant J. 76: 530–544. doi:https://doi.org/10.1111/tpj.12307
- Kaloshian, I., Yaghoobi, J., Liharska, T., Hontelez, J., D, H., P, H., T, J., Wijbrandi, J., Simons, G., Vos, P., Zabel, P., and Williamson, V. M. 1998. Genetic and physical localization of the root-knot nematode resistance locus Mi in tomato. Mol. Gen. Genet. 257: 376–385. doi:https://doi.org/10.1007/s004380050660
- Kandel, R., Lu, H., and Sandoya, G. V. 2021. Identification and mapping of quantitative trait loci for resistance to Liriomyza trifolii in romaine lettuce cultivar ‘Valmaine’. Sci. Rep. 11: 998. doi:https://doi.org/10.1038/s41598-020-80050-5
- Kandel, S. L., Hulse-Kemp, A. M., Stoffel, K., Koike, S. T., Shi, A., Mou, B., Van Deynze, A., and Klosterman, S. J. 2020. Transcriptional analyses of differential cultivars during resistant and susceptible interactions with Peronospora effusa, the causal agent of spinach downy mildew. Sci. Rep. 10: 6719. doi:https://doi.org/10.1038/s41598-020-63668-3
- Kang, B. C., Nahm, S. H., Huh, J. H., Yoo, H. S., Yu, J. W., Lee, M. H., and Kim, B. D. 2001. An interspecific (Capsicum annuum × C. chinese) F2 linkage map in pepper using RFLP and AFLP markers. Theor. Appl. Genet. 102: 531–539.
- Kang, B. C., Yeam, I., Frantz, J. D., Murphy, J. F., and Jahn, M. M. 2005. The pvr1 locus in Capsicum encodes a translation initiation factor eIF4E that interacts with Tobacco etch virus VPg. Plant J. 42: 392–405. doi:https://doi.org/10.1111/j.1365-313X.2005.02381.x
- Kang, H., Weng, Y., Yang, Y., Zhang, Z., Zhang, S., Mao, Z., Cheng, G., Gu, X., Huang, S., and Xie, B. 2011. Fine genetic mapping localizes cucumber scab resistance gene Ccu into an R gene cluster. Theor. Appl. Genet. 122: 795–803. doi:https://doi.org/10.1007/s00122-010-1487-2
- Kang, W. H., Hoang, N. H., Yang, H. B., Kwon, J. K., Jo, S. H., Seo, J. K., Kim, K. H., Choi, D., and Kang, B. C. 2010. Molecular mapping and characterization of a single dominant gene controlling CMV resistance in peppers (Capsicum annuum L.). Theor. Appl. Genet. 120: 1587–1596. doi:https://doi.org/10.1007/s00122-010-1278-9
- Kaushik, P., Plazas, M., Prohens, J., Vilanova, S., and Gramazio, P. 2018. Diallel genetic analysis for multiple traits in eggplant and assessment of genetic distances for predicting hybrids performance. PLoS ONE 13: e0199943. doi:https://doi.org/10.1371/journal.pone.0199943
- Kaushik, P., Prohens, J., Vilanova, S., Gramazio, P., and Plazas, M. 2016. Phenotyping of eggplant wild relatives and interspecific hybrids with conventional and phenomics descriptors provides insight for their potential utilization in breeding. Front. Plant Sci. 7: 677. doi:https://doi.org/10.3389/fpls.2016.00677
- Kawchuk, L. M., Hachey, J., Lynch, D. R., Kulcsar, F., van Rooijen, G., Waterer, D. R., Robertson, A., Kokko, E., Byers, R., Howard, R. J., Fischer, R., and Prufer, D. 2001. Tomato Ve disease resistance genes encode cell surface-like receptors. Proc. Natl. Acad. Sci. U.S.A. 98: 6511–6515. doi:https://doi.org/10.1073/pnas.091114198
- Keng, H. 1973. Economic plants of ancient North-China as mentioned in Shih-Ching (Book of Poetry). Econ. Bot. 28: 391–410. doi:https://doi.org/10.1007/BF02862856
- Kerbiriou, P. J., Maliepaard, C. A., Stomph, T. J., Koper, M., Froissart, D., Roobeek, I., Lammerts Van Bueren, E. T., and Struik, P. C. 2016. Genetic control of water and nitrate capture and their use efficiency in lettuce (Lactuca sativa L.). Front. Plant Sci. 7: 343. doi:https://doi.org/10.3389/fpls.2016.00343
- Kesseli, R., Witsenboer, H., Stanghellini, M., Vandermark, G., and Michelmore, R. 1993. Recessive resistance to Plasmopara lactucae-radicis maps by bulked segregant analysis to a cluster of dominant disease resistance genes in lettuce. MPMI 6: 722–728. doi:https://doi.org/10.1094/MPMI-6-722
- Khan, A. W., Garg, V., Roorkiwal, M., Golicz, A. A., Edwards, D., and Varshney, R. K. 2020. Super-pangenome by integrating the wild side of a species for accelerated crop improvement. Trends Plant Sci. 25: 148–158. doi:https://doi.org/10.1016/j.tplants.2019.10.012
- Khan, M. M. R., and Isshiki, S. 2010. Development of the male-sterile line of eggplant utilizing the cytoplasm of Solanum aethiopicum L. Aculeatum group. J. Japan. Soc. Hort. Sci. 79: 348–353. doi:https://doi.org/10.2503/jjshs1.79.348
- Khan, M. M. R., and Isshiki, S. 2011. Development of a cytoplasmic male-sterile line of eggplant (Solanum melongena L.) with the cytoplasm of Solanum anguivi: developing a new cytoplasmic male-sterile line of eggplant. Plant Breed. 130: 256–260. doi:https://doi.org/10.1111/j.1439-0523.2010.01788.x
- Khan, M. M. R., and Isshiki, S. 2016. Cytoplasmic male sterility in eggplant. Hortic. J. 85: 1–7. doi:https://doi.org/10.2503/hortj.MI-IR03
- Khattak, J. Z. K., Christiansen, J. L., Torp, A. M., and Andersen, S. B. 2007. Genic microsatellite markers for discrimination of spinach cultivars. Plant Breed. 126: 454–456. doi:https://doi.org/10.1111/j.1439-0523.2007.01392.x
- Khattak, J. Z. K., Torp, A. M., and Andersen, S. B. 2006. A genetic linkage map of Spinacia oleracea and localization of a sex determination locus. Euphytica 148: 311–318. doi:https://doi.org/10.1007/s10681-005-9031-1
- Kiers, A.M. 2000. Endive, chicory and their wild relatives: a systematic and phylogenetic study of Cichorium (Asteraceae). Thesis, Universiteit Leiden, Leiden, The Netherlands.
- Kim, B., Hwang, I. S., Lee, H. J., and Oh, C. S. 2017a. Combination of newly developed SNP and InDel markers for genotyping the Cf-9 locus conferring disease resistance to leaf mold disease in the tomato. Mol. Breed. 37: 59.
- Kim, H. J., Han, J. H., Kim, S., Lee, H. R., Shin, J. S., Kim, J. H., Cho, J., Kim, Y. H., Lee, H. J., Kim, B. D., and Choi, D. 2011. Trichome density of main stem is tightly linked to PepMoV resistance in chili pepper (Capsicum annuum L.). Theor. Appl. Genet. 122: 1051–1058. doi:https://doi.org/10.1007/s00122-010-1510-7
- Kim, H., Yoon, J. B., and Lee, J. 2017b. Development of fluidigm SNP type genotyping assays for marker-assisted breeding of chili pepper (Capsicum annuum L.). Hortic. Sci. Technol. 35: 465–479.
- Kim, H. J., Nahm, S. H., Lee, H. R., Yoon, G. B., Kim, K. T., Kang, B. C., Choi, D., Kweon, O. Y., Cho, M. C., Kwon, J. K., Han, J. H., Kim, J. H., Park, M., Ahn, J. H., Choi, S. H., Her, N. H., Sung, J. H., and Kim, B. D. 2008. BAC-derived markers converted from RFLP linked to Phytophthora capsici resistance in pepper (Capsicum annuum L.). Theor. Appl. Genet. 118: 15–27. doi:https://doi.org/10.1007/s00122-008-0873-5
- Kim, S., Kim, K. T., Kim, D. H., Yang, E. Y., Cho, M. C., Jamal, A., Chae, Y., Pae, D. H., and Hwang, J. K. 2010. Identification of quantitative trait loci associated with anthracnose resistance in chili pepper (Capsicum spp.). Korean J. Hortic. Sci. Technol. 28: 1014–1024
- Kim, S., Park, J., Yeom, S. I., Kim, Y. M., Seo, E., Kim, K. T., Kim, M. S., Lee, J. M., Cheong, K., Shin, H. S., Kim, S. B., Han, K., Lee, J., Park, M., Lee, H. A., Lee, H. Y., Lee, Y., Oh, S., Lee, J. H., Choi, E., Choi, E., Lee, S. E., Jeon, J., Kim, H., Choi, G., Song, H., Lee, J., Lee, S. C., Kwon, J. K., Lee, H. Y., Koo, N., Hong, Y., Kim, R. W., Kang, W. H., Huh, J. H., Kang, B. C., Yang, T. J., Lee, Y. H., Bennetzen, J. L., and Choi, D. 2017d. New reference genome sequences of hot pepper reveal the massive evolution of plant disease-resistance genes by retroduplication. Genome Biol. 18: 210–210. doi:https://doi.org/10.1186/s13059-017-1341-9
- Kim, S., Park, M., Yeom, S. I., Kim, Y. M., Lee, J. M., Lee, H. A., Seo, E., Choi, J., Cheong, K., Kim, K. T., Jung, K., Lee, G. W., Oh, S. K., Bae, C., Kim, S. B., Lee, H. Y., Kim, S. Y., Kim, M. S., Kang, B. C., Jo, Y. D., Yang, H. B., Jeong, H. J., Kang, W. H., Kwon, J. K., Shin, C., Lim, J. Y., Park, J. H., Huh, J. H., Kim, J. S., Kim, B. D., Cohen, O., Paran, I., Suh, M. C., Lee, S. B., Kim, Y. K., Shin, Y., Noh, S. J., Park, J., Seo, Y. S., Kwon, S. Y., Kim, H. A., Park, J. M., Kim, H. J., Choi, S. B., Bosland, P. W., Reeves, G., Jo, S. H., Lee, B. W., Cho, H. T., Choi, H. S., Lee, M. S., Yu, Y., Do Choi, Y., Park, B. S., van Deynze, A., Ashrafi, H., Hill, T., Kim, W. T., Pai, H. S., Ahn, H. K., Yeam, I., Giovannoni, J. J., Rose, J. K. C., Sørensen, I., Lee, S. J., Kim, R. W., Choi, I. Y., Choi, B. S., Lim, J. S., Lee, Y. H., and Choi, D. 2014. Genome sequence of the hot pepper provides insights into the evolution of pungency in Capsicum species. Nat. Genet. 46: 270–278. doi:https://doi.org/10.1038/ng.2877
- Kim, S. B., Kang, W. H., Huy, H. N., Yeom, S. I., An, J. T., Kim, S., Kang, M. Y., Kim, H. J., Jo, Y. D., Ha, Y., Choi, D., and Kang, B. C. 2017c. Divergent evolution of multiple virus-resistance genes from a progenitor in Capsicum spp. New Phytol. 213: 886–899. doi:https://doi.org/10.1111/nph.14177
- Kinkade, M. P., and Foolad, M. R. 2013. Validation and fine mapping of lyc12.1, a QTL for increased tomato fruit lycopene content. Theor. Appl. Genet. 126: 2163–2175. doi:https://doi.org/10.1007/s00122-013-2126-5
- Kinzer, S. M., Schwager, S. J., and Mutschler, M. A. 1990. Mapping of ripening-related or -specific cDNA clones of tomato (Lycopersicon esculentum). Theor. Appl. Genet. 79: 489–496. doi:https://doi.org/10.1007/BF00226158
- Knapp, S., and Peralta, I. E. 2016. The tomato (Solanum lycopersicum L., Solanaceae) and its botanical relatives. In The Tomato Genome; Causse, M., Giovannoni, J. J., Bouzayen, M., and Zouine, M., Eds. Springer: Berlin Heidelberg, pp 7–22.
- Koeda, S., Sato, K., Saito, H., Nagano, A. J., Yasugi, M., Kudoh, H., and Tanaka, Y. 2019. Mutation in the putative ketoacyl-ACP reductase CaKR1 induces loss of pungency in Capsicum. Theor. Appl. Genet. 132: 65–80. doi:https://doi.org/10.1007/s00122-018-3195-2
- Konieczny, A., and Ausubel, F. A. 1993. A procedure for mapping Arabidopsis mutations using co-dominant ecotype-specific PCR-based markers. Plant J. 4: 403–410. doi:https://doi.org/10.1046/j.1365-313x.1993.04020403.x
- Kouassi, B., Prohens, J., Gramazio, P., Kouassi, A. B., Vilanova, S., Galán-Ávila, A., Herraiz, F. J., Kouassi, A., Seguí-Simarro, J. M., and Plazas, M. 2016. Development of backcross generations and new interspecific hybrid combinations for introgression breeding in eggplant (Solanum melongena). Sci. Hortic. 213: 199–207. doi:https://doi.org/10.1016/j.scienta.2016.10.039
- Krishna, R., Karkute, S. G., Ansari, W. A., Jaiswal, D. K., Verma, J. P., and Singh, M. 2019. Transgenic tomatoes for abiotic stress tolerance: status and way ahead. 3 Biotech. 9: 143–143. doi:https://doi.org/10.1007/s13205-019-1665-0
- Kumar, A., Sharma, V., Jain, B. T., and Kaushik, P. 2020. Heterosis breeding in eggplant (Solanum melongena L.): gains and provocations. Plants 9: 403. doi:https://doi.org/10.3390/plants9030403
- Kumar, P., Eriksen, R. L., Simko, I., and Mou, B. 2021. Molecular mapping of water-stress responsive genomic loci in lettuce (Lactuca spp.) using kinetics chlorophyll fluoroscence, hyperspectral imaging and machine learning. Front. Genet. 12: 634554. doi:https://doi.org/10.3389/fgene.2021.634554
- Kunz, D. D. R., Awika, H. O., and Avila, C. A. 2020. Vitamin C content in spinach germplasm: phenotypic diversity and genome-wide association mapping. HortScience 55: S351.
- Kuwahara, K., Suzuki, R., Ito, Y., Mikami, T., and Onodera, Y. 2014. An analysis of genetic differentiation and geographical variation of spinach germplasm using SSR markers. Plant Genet. Res. 12: 185–190. doi:https://doi.org/10.1017/S1479262113000464
- Kwon, S. J., Simko, I., Hellier, B., Mou, B., and Hu, J. 2013. Genome-wide association of 10 horticultural traits with expressed sequence tag-derived SNP markers in a collection of lettuce lines. Crop J. 1: 23–33.
- Landegren, U., Nilsson, M., and Kwok, P. Y. 1998. Reading bits of genetic information: methods for single-nucleotide polymorphism analysis. Genome Res. 8:769–776. doi:https://doi.org/10.1101/gr.8.8.769
- Landry, B. S., Kesseli, R. V., Farrara, B., and Michelmore, R. W. 1987. A genetic map of lettuce (Lactuca sativa L.) with restriction fragment length polymorphism, isozyme, disease resistance and morphological markers. Genetics 116: 331–337.
- Lanfermeijer, F. C., Dijkhuis, J., Sturre, M. J. G., de Haan, P., and Hille, J. 2003. Cloning and characterization of the durable tomato mosaic virus resistance gene Tm-2(2) from Lycopersicon esculentum. Plant Mol. Biol. 52: 1037–1049. doi:https://doi.org/10.1023/a:1025434519282
- Lang, Y., Kisaka, H., Sugiyama, R., Nomura, K., Morita, A., Watanabe, T., Tanaka, Y., Yazawa, S., and Miwa, T. 2009. Functional loss of pAMT results in biosynthesis of capsinoids, capsaicinoid analogs, in Capsicum annuum cv. CH-19 Sweet. Plant J. 59: 953–961. doi:https://doi.org/10.1111/j.1365-313X.2009.03921.x
- Lebeau, A., Daunay, M. C., Frary, A., Palloix, A., Wang, J. F., Dintinger, J., Chiroleu, F., Wicker, E., and Prior, P. 2011. Bacterial wilt resistance in tomato, pepper, and eggplant: genetic resources respond to diverse strains in the Ralstonia solanacearum species complex. Phytopathology 101: 154–165. doi:https://doi.org/10.1094/PHYTO-02-10-0048
- Lebeau, A., Gouy, M., Daunay, M. C., Wicker, E., Chiroleu, F., Prior, P., Frary, A., and Dintinger, J. 2013. Genetic mapping of a major dominant gene for resistance to Ralstonia solanacearum in eggplant. Theor. Appl. Genet. 126: 143–158. doi:https://doi.org/10.1007/s00122-012-1969-5
- Lebeda, A., Doležalová, I., Křístková, E., Kitner, M., Petrželová, I., Mieslerová, B., and Novotná, A. 2009. Wild Lactuca germplasm for lettuce breeding: current status, gaps and challenges. Euphytica 170: 15–34. doi:https://doi.org/10.1007/s10681-009-9914-7
- Lebeda, A., Křístková, E., Kitner, M., Mieslerová, B., Jemelková, M., and Pink, D. A. C. 2014. Wild Lactuca species, their genetic diversity, resistance to diseases and pests, and exploitation in lettuce breeding. Eur. J. Plant Pathol. 138: 597–640. doi:https://doi.org/10.1007/s10658-013-0254-z
- Lebeda, A., Ryder, E. J., Grube, R., Doležalová, I., and Křístková, E. 2007. Lettuce (asteraceae; Lactuca spp.). In Genetic Resources, Chromosome Engineering, and Crop Improvement. Volume 3 – Vegetable Crops. Singh, R. J., Ed. CRC Press: Boca Raton, FL, pp 377–472.
- Lee, C. J., Yoo, E. Y., Shin, J. H., Lee, J., Hwang, H. S., and Kim, B. D. 2005. Non-pungent Capsicum contains a deletion in the capsaicinoid synthetase gene, which allows early detection of pungency with SCAR markers. Mol. Cells 19: 262–267.
- Lee, H. R., Cho, M. C., Kim, H.J., Park, S. W., and Kim, B. D. 2008. Marker development for erect versus pendant-orientated fruit in Capsicum annuum L. Mol. Cells 26: 548–553.
- Lee, H. R., An, H. J., You, Y. G., Lee, J., Kim, H. J., Kang, B. C., and Harn, C. H. 2013. Development of a novel codominant molecular marker for chili veinal mottle virus resistance in Capsicum annuum L. Euphytica 193: 197–205. doi:https://doi.org/10.1007/s10681-013-0897-z
- Lee, H. Y., Ro, N. Y., Jeong, H. J., Kwon, J. K., Jo, J., Ha, Y., Jung, A., Han, J. W., Venkatesh, J., and Kang, B. C. 2016a. Genetic diversity and population structure analysis to construct a core collection from a large Capsicum germplasm. BMC Genet. 17: 142–142. doi:https://doi.org/10.1186/s12863-016-0452-8
- Lee, H. Y., Ro, N. Y., Patil, A., Lee, J. H., Kwon, J. K., and Kang, B. C. 2020. Uncovering candidate genes controlling major fruit-related traits in pepper via genotype-by-sequencing based QTL mapping and genome-wide association study. Front. Plant Sci. 11: 1100. doi:https://doi.org/10.3389/fpls.2020.01100
- Lee, J. M., Oh, C. S., and Yeam, I. 2015. Molecular markers for selecting diverse disease resistances in tomato breeding programs. Plant Breed. Biotech. 3: 308–322. doi:https://doi.org/10.9787/PBB.2015.3.4.308
- Lee, J., Lee, W. P., J.H, H., and Yoon, J. B. 2010a. Development of molecular marker linked to a genic male sterile gene msk in chili pepper. Korean J. Hortic. Sci. Technol. 28: 270–274.
- Lee, J., Park, S. J., Hong, S. C., Han, J. H., Choi, D., and Yoon, J. B. 2016b. QTL mapping for capsaicin and dihydrocapsaicin content in a population of Capsicum annuum ‘NB 1’× Capsicum chinense ‘Bhut Jolokia’. Plant Breed. 135: 376–383. doi:https://doi.org/10.1111/pbr.12355
- Lee, J., Yoon, J. B., Han, J. H., Lee, W. P., Do, J. W., Ryu, H., Kim, S. H., and Park, H. G. 2010b. A codominant SCAR marker linked to the genic male sterility gene (ms1) in chili pepper (Capsicum annuum). Plant Breed. 129: 35–38. doi:https://doi.org/10.1111/j.1439-0523.2009.01643.x
- Lee, J., Yoon, J. B., Han, J. H., Lee, W. P., Kim, S. H., and Park, H. G. 2010c. Three AFLP markers tightly linked to the genic male sterility ms3 gene in chili pepper (Capsicum annuum L.) and conversion to a CAPS marker. Euphytica 173: 55–61. doi:https://doi.org/10.1007/s10681-009-0107-1
- Lee, J. H., An, J. T., Siddique, M. I., Han, K., Choi, S., Kwon, J. K., and Kang, B. C. 2017. Identification and molecular genetic mapping of Chili veinal mottle virus (ChiVMV) resistance genes in pepper (Capsicum annuum). Mol. Breed. 37: 121.
- Lee, S. Y., Jang, S. J., Jeong, H. B., Lee, S. Y., Venkatesh, J., Lee, J. H., Kwon, J. K., and Kang, B. C. 2021. A mutation in Zeaxanthin epoxidase contributes to orange coloration and alters carotenoid contents in pepper fruit (Capsicum annuum). Plant J. https://doi.org/10.1111/tpj.15264
- Lee, Y. R., Yoon, J. B., and Lee, J. 2016c. A SNP-based genetic linkage map of Capsicum baccatum and its comparison to the Capsicum annuum reference physical map. Mol. Breed. 36: 61.
- Lefebvre, V., Daubèze, A. M., Rouppe van der Voort, J., Peleman, J., Bardin, M., and Palloix, A. 2003. QTLs for resistance to powdery mildew in pepper under natural and artificial infections. Theor. Appl. Genet. 107: 661–666. doi:https://doi.org/10.1007/s00122-003-1307-z
- Lefebvre, V., Palloix, A., Caranta, C., and Pochard, E. 1995. Construction of an intraspecific integrated linkage map of pepper using molecular markers and doubled-haploid progenies. Genome 38: 112–121. doi:https://doi.org/10.1139/g95-014
- Lefebvre, V., Pflieger, S., Thabuis, A., Caranta, C., Blattes, A., Chauvet, J. C., Daubèze, A. M., and Palloix, A. 2002. Towards the saturation of the pepper linkage map by alignment of three intraspecific maps including known-function genes. Genome 45: 839–854. doi:https://doi.org/10.1139/g02-053
- Li, B., Chen, X., Wu, Y., Gu, A., Zhang, J., Luo, S., Gao, X., Zhao, J., Pan, X., and Shen, S. 2019a. Gene characterization and molecular pathway analysis of reverse thermosensitive genic male sterility in eggplant (Solanum melongena L.). Hortic. Res. 6: 118. doi:https://doi.org/10.1038/s41438-019-0201-z
- Li, D., Li, S., Li, W., Liu, A., Jiang, Y., Gan, G., Li, W., Liang, X., Yu, N., Chen, R., and Wang, Y. 2020. Comparative transcriptome analysis provides insights into the molecular mechanism underlying double fertilization between self-crossed Solanum melongena and that hybridized with Solanum aethiopicum. PLoS ONE 15: e0235962. doi:https://doi.org/10.1371/journal.pone.0235962
- Li, N., Yin, Y., Wang, F., and Yao, M. 2018. Construction of a high-density genetic map and identification of QTLs for cucumber mosaic virus resistance in pepper (Capsicum annuum L.) using specific length amplified fragment sequencing (SLAF-seq). Breed. Sci. 68: 233–241. doi:https://doi.org/10.1270/jsbbs.17063
- Li, Q., Li, H. B., Huang, W., Xu, Y. C., Zhou, Q., Wang, S. H., Ruan, J., Huang, S. W., and Zhang, Z.H. 2019b. A chromosome-scale genome assembly of cucumber (Cucumis sativus L.). GigaScience 8: giz072. doi:https://doi.org/10.1093/gigascience/giz072
- Li, Z., Zhang, Z., Yan, P., Huang, Z., Fei, Z., and Lin, K. 2011. RNA-Seq improves annotation of protein-coding genes in the cucumber genome. BMC Genomics 12: 540. doi:https://doi.org/10.1186/1471-2164-12-540
- Liabeuf, D., Sim, S. C., and Francis, D. M. 2018. Comparison of marker-based genomic estimated breeding values and phenotypic evaluation for selection of bacterial spot resistance in tomato. Phytopathology 108: 392–401. doi:https://doi.org/10.1094/PHYTO-12-16-0431-R
- Liao, Y., Sun, B. J., Sun, G. W., Liu, H. C., Li, Z. L., Li, Z. X., Wang, G. P., and Chen, R. Y. 2009. AFLP and SCAR markers associated with peel color in eggplant (Solanum melongena). Agric. Sci. China 8: 1466–1474. doi:https://doi.org/10.1016/S1671-2927(08)60360-0
- Lin, K. H., Yeh, W. L., Chen, H. M., and Lo, H. F. 2010. Quantitative trait loci influencing fruit-related characteristics of tomato grown in high-temperature conditions. Euphytica 174: 119–135. doi:https://doi.org/10.1007/s10681-010-0147-6
- Lin, S. W., Shieh, S. C., and Gniffke, P. A. 2007. Using cytoplasmic male-sterile sweet peppers (Capsicum annuum L.) to identify sweet pepper fertility restorer lines. J. Taiwan Soc. Hortic. Sci. 53: 566–567.
- Lippman, Z. B., Cohen, O., Alvarez, J. P., Abu-Abied, M., Pekker, I., Paran, I., Eshed, Y., and Zamir, D. 2008. The making of a compound inflorescence in tomato and related nightshades. PLoS Biol. 6: e288. doi:https://doi.org/10.1371/journal.pbio.0060288
- Liu, B., Du, Y., Wang, X., Guo, Y., Gao, J., Zhu, D., and Dai, S. 2010. QTL analysis of cold tolerance from Solanum pimpinellifolium during seed germination and seedling stages using advanced backcross population. Acta Hortic. Sin. 37: 1093–1101.
- Liu, B., Guan, D. L., Zhai, X. L., Yang, S., Xue, S. D., Chen, S. Y., Huang, J., Ren, H. Z., and Liu, X.W. 2019a. Selection footprints reflect genomic changes associated with breeding efforts in 56 cucumber inbred lines. Hort. Res. 6: 127.
- Liu, J., Zheng, Z. S., Zhou, X. H., Feng, C., and Zhuang, Y. 2015. Improving the resistance of eggplant (Solanum melongena) to Verticillium wilt using wild species Solanum linnaeanum. Euphytica 201: 463–469. doi:https://doi.org/10.1007/s10681-014-1234-x
- Liu, W., Qian, Z., Zhang, J., Yang, J., Wu, M., Barchi, L., Zhao, H., Sun, H., Cui, Y., and Wen, C. 2019b. Impact of fruit shape selection on genetic structure and diversity uncovered from genome-wide perfect SNPs genotyping in eggplant. Mol. Breed. 39: 140.
- Liu, W. Y., Kang, J. H., Jeong, H. S., Choi, H. J., Yang, H. B., Kim, K. T., Choi, D., Choi, G. J., Jahn, M., and Kang, B. C. 2014. Combined use of bulked segregant analysis and microarrays reveals SNP markers pinpointing a major QTL for resistance to Phytophthora capsici in pepper. Theor. Appl. Genet. 127: 2503–2513. doi:https://doi.org/10.1007/s00122-014-2394-8
- Liu, X.F., Hao, N., Li, H. Y., Ge, D. F., Du, Y. L., Liu, R. Y., Wen, C. L., Li, Y. H., Zhang, X. L., and Wu, T. 2019. PINOID is required for lateral organ morphogenesis and ovule development in cucumber. J. Exp. Bot. 70: 5715–5730. doi:https://doi.org/10.1093/jxb/erz354
- Liu, Y., Zhou, T., Ge, H., Pang, W., Gao, L., Ren, L., and Chen, H. 2016. SSR mapping of QTLs conferring cold tolerance in an interspecific cross of tomato. Int. J. Genomics 2016: 3219276. doi:https://doi.org/10.1155/2016/3219276
- Livingstone, K. D., Lackney, V. K., Blauth, J. R., Van Wijk, R. I. K., and Jahn, M. K. 1999. Genome mapping in Capsicum and the evolution of genome structure in the Solanaceae. Genetics 152: 1183–1202. doi:https://doi.org/10.1093/genetics/152.3.1183
- Lu, H., Hu, J., and Kwon, S. J. 2014. Association analysis of bacterial leaf spot resistance and SNP markers derived from expressed sequence tags (ESTs) in lettuce (Lactuca sativa L.). Mol. Breed. 34: 997–1006. doi:https://doi.org/10.1007/s11032-014-0092-5
- Lucchin, M., Varotto, S., Barcaccia, G., and Parrini, P. 2008. Chicory and endive. In Handbook of Plant Breeding, Vegetables I: Asteraceae, Brassicaceae, Chenopodicaceae; Springer: New York, NY, pp 1–46.
- Lukyanenko, A. N. 1991. Genetic improvement of tomato: disease resistance in tomato. Vol. 14, Monographs on theoretical and applied genetics. Springer Berlin, Heidelberg, Germany.
- Lv, J., Qi, J., Shi, Q., Shen, S., Zhang, S., Shao, G., Zhang, S. P., Shao, H., Li, H., Sun, Y., Weng, Y., Shang, Y., Gu, X. F., Li, X., Zhu, X., Zhang, J., van Treuren, R., van Dooijeweert, W., Zhang, Z., and Huang, S. 2012. Genetic diversity and population structure of cucumber (Cucumis sativus L.). PLoS ONE 7: e46919. doi:https://doi.org/10.1371/journal.pone.0046919
- Ma, C., Dastmalchi, K., Whitaker, B. D., and Kennelly, E. J. 2011. Two new antioxidant malonated caffeoylquinic acid isomers in fruits of wild eggplant relatives. J. Agric. Food Chem. 59: 9645–9651. doi:https://doi.org/10.1021/jf202028y
- Ma, J., Shi, A., Mou, B., Evans, M., Clark, J. R., Motes, D., Correll, J. C., Xiong, H., Qin, J., Chitwood, J., and Weng, Y. 2016. Association mapping of leaf traits in spinach (Spinacia oleracea L.). Plant Breed. 135: 399–404. doi:https://doi.org/10.1111/pbr.12369
- Macias-González, M., Truco, M. J., Smith, R., Cahn, M., Simko, I., Hayes, R., and Michelmore, R. W. 2021. Genetics of robustness under nitrogen and water deficient conditions in field grown lettuce. Crop Sci. 61: 1582–1619. doi:https://doi.org/10.1002/csc2.20380
- Macias-González, M., Truco, M., Bertier, L., Jenni, S., Simko, I., Hayes, R., and Michelmore, R. W. 2019. Genetic architecture of tipburn resistance in lettuce. Theor. Appl. Genet. 132: 2209–2222. doi:https://doi.org/10.1007/s00122-019-03349-6
- Maharijaya, A., Vosman, B., Steenhuis-Broers, G., Pelgrom, K., Purwito, A., Visser, R. G. F., and Voorrips, R. E. 2015. QTL mapping of thrips resistance in pepper. Theor. Appl. Genet. 128: 1945–1956. doi:https://doi.org/10.1007/s00122-015-2558-1
- Mahasuk, P., Struss, D., and Mongkolporn, O. 2016. QTLs for resistance to anthracnose identified in two Capsicum sources. Mol. Breed. 36: 10.
- Maioli, A., Gianoglio, S., Moglia, A., Acquadro, A., Valentino, D., Milani, A. M., Prohens, J., Orzaez, D., Granell, A., Lanteri, S., and Comino, C. 2020. Simultaneous CRISPR/Cas9 editing of three PPO genes reduces fruit flesh browning in Solanum melongena L. Front. Plant Sci. 11: 607161. doi:https://doi.org/10.3389/fpls.2020.607161
- Maisonneuve, B., Bellec, Y., Anderson, P., and Michelmore, R. W. 1994. Rapid mapping of two genes for resistance to downy mildew from Lactuca serriola to existing clusters of resistance genes. Theor. Appl. Genet. 89: 96–104. doi:https://doi.org/10.1007/BF00226989
- Mallard, S., Cantet, M., Massire, A., Bachellez, A., Ewert, S., and Lefebvre, V. 2013. A key QTL cluster is conserved among accessions and exhibits broad-spectrum resistance to Phytophthora capsici: a valuable locus for pepper breeding. Mol. Breed. 32: 349–364. doi:https://doi.org/10.1007/s11032-013-9875-3
- Mamo, B. E., Hayes, R. J., Truco, M. J., Puri, K. D., Michelmore, R. W., Subbarao, K. V., and Simko, I. 2019. The genetics of resistance to lettuce drop (Sclerotinia spp.) in lettuce in a recombinant inbred line population from Reine des Glaces × Eruption. Theor. Appl. Genet. 132: 2439–2460. doi:https://doi.org/10.1007/s00122-019-03365-6
- Mangino, G., Plazas, M., Vilanova, S., Prohens, J., and Gramazio, P. 2020. Performance of a set of eggplant (Solanum melongena) lines with introgressions from its wild relative S. incanum under open field and screenhouse conditions and detection of QTLs. Agronomy 10: 467. doi:https://doi.org/10.3390/agronomy10040467
- Matsuo, S., Miyatake, K., Endo, M., Urashimo, S., Kawanishi, T., Negoro, S., Shimakoshi, S., and Fukuoka, H. 2020. Loss of function of the Pad-1 aminotransferase gene, which is involved in auxin homeostasis, induces parthenocarpy in Solanaceae plants. Proc. Natl. Acad. Sci. U.S.A. 117: 12784–12790. doi:https://doi.org/10.1073/pnas.2001211117
- McHale, L. K., Truco, M. J., Kozik, A., Wroblewski, T., Ochoa, O. E., Lahre, K. A., Knapp, S. J., and Michelmore, R. W. 2009. The genomic architecture of disease resistance in lettuce. Theor. Appl. Genet. 118: 565–580. doi:https://doi.org/10.1007/s00122-008-0921-1
- Melotto, M., Brandl, M. T., Jacob, C., Jay-Russell, M. T., Micallef, S. A., Warburton, M. L., and Van Deynze, A. 2020. Breeding crops for enhanced food safety. Front. Plant Sci. 11: 428. doi:https://doi.org/10.3389/fpls.2020.00428
- Mennella, G., Lo Scalzo, R., Fibiani, M., D'Alessandro, A., Francese, G., Toppino, L., Acciarri, N., de Almeida, A. E., and Rotino, G. L. 2012. Chemical and bioactive quality traits during fruit ripening in eggplant (S. melongena L.) and allied species. J. Agric. Food Chem. 60: 11821–11831. doi:https://doi.org/10.1021/jf3037424
- Merk, H. L., Ashrafi, H., and Foolad, M. R. 2012. Selective genotyping to identify late blight resistance genes in an accession of the tomato wild species Solanum pimpinellifolium. Euphytica 187: 63–75. doi:https://doi.org/10.1007/s10681-012-0729-6
- Mes, P. J., Boches, P., Myers, J. R., and Durst, R. 2008. Characterization of tomatoes expressing anthocyanin in the fruit. Amer. Soc. Hort. Sci. 133: 262–269. doi:https://doi.org/10.21273/JASHS.133.2.262
- Meuwissen, T. H., Hayes, B. J., and Goddard, M. E. 2001. Prediction of total genetic value using genome-wide dense marker maps. Genetics 157: 1819–1829. doi:https://doi.org/10.1093/genetics/157.4.1819
- Meyer, R. S., Karol, K. G., Little, D. P., Nee, M. H., and Litt, A. 2012. Phylogeographic relationships among Asian eggplants and new perspectives on eggplant domestication. Mol. Phylogenet. Evol. 63: 685–701. doi:https://doi.org/10.1016/j.ympev.2012.02.006
- Meyer, R. S., Little, D. P., Whitaker, B. D., and Litt, A. 2019. The genetics of eggplant nutrition. In The Eggplant Genome; Chapman, M. A., Ed. Springer, pp 23–32.
- Meyers, B. C., Chin, D. B., Shen, K. A., Sivaramakrishnan, S., Lavelle, D. O., Zhang, Z., and Michelmore, R. W. 1998b. The major resistance gene cluster in lettuce is highly duplicated and spans several megabases. Plant Cell. 10: 1817–1832. doi:https://doi.org/10.2307/3870906
- Meyers, B. C., Shen, K. A., Rohani, P., Gaut, B. S., and Michelmore, R. W. 1998a. Receptor-like genes in the major resistance locus of lettuce are subject to divergent selection. Plant Cell. 10: 1833–1846. doi:https://doi.org/10.2307/3870907
- Michelmore, R. W. 2009. Genetic variation in lettuce. In California Leafy Greens Research Program. http://calgreens.org/control/uploads/Genetic_Variation_in_Lettuce_-_Michelmore.pdf
- Michelmore, R. W. 2010. Genetic variation in lettuce. In California Leafy Greens Research Program. https://calgreens.org/control/uploads/Michelmore_Variation_report_2009-2010_final_%282%291.pdf
- Michelmore, R. W., Truco, M. J., and Ochoa, O. E. 2010. Breeding leaf lettuce. In California Leafy Greens Research Program. https://calgreens.org/control/uploads/Michelmore_Leaf_Lettuce_Report_2009-2010_final1.pdf
- Mikel, M. A. 2007. Genealogy of contemporary North American lettuce. Horts. 42: 489–493. doi:https://doi.org/10.21273/HORTSCI.42.3.489
- Mikel, M. A. 2013. Genetic composition of contemporary proprietary U.S. lettuce (Lactuca sativa L.) cultivars. Genet. Resour. Crop Evol. 60: 89–96. doi:https://doi.org/10.1007/s10722-012-9818-6
- Miller, J. C., and Tanksley, S. D. 1990. RFLP analysis of phylogenetic relationships and genetic variation in the genus Lycopersicon. Theor. Appl. Genet. 80: 437–448. doi:https://doi.org/10.1007/BF00226743
- Milligan, S. B., Bodeau, J., Yaghoobi, J., Kaloshian, I., Zabel, P., and Williamson, V. M. 1998. The root knot nematode resistance gene Mi from tomato is a member of the leucine zipper, nucleotide binding, leucine-rich repeat family of plant genes. Plant Cell. 10: 1307–1319. doi:https://doi.org/10.1105/tpc.10.8.1307
- Mimura, Y., Inoue, T., Minamiyama, Y., and Kubo, N. 2012. An SSR-based genetic map of pepper (Capsicum annuum L.) serves as an anchor for the alignment of major pepper maps. Breed. Sci. 62: 93–98. doi:https://doi.org/10.1270/jsbbs.62.93
- Mimura, Y., Kageyama, T., Minamiyama, Y., and Hirai, M. 2009. QTL analysis for resistance to Ralstonia solanacearum in Capsicum accession ‘LS2341’. J. Japan. Soc. Hort. Sci. 78: 307–313. doi:https://doi.org/10.2503/jjshs1.78.307
- Min, W. K., Kim, S., Sung, S. K., Kim, B. D., and Lee, S. 2009. Allelic discrimination of the Restorer-of-fertility gene and its inheritance in peppers (Capsicum annuum L.). Theor. Appl. Genet. 119: 1289–1299. doi:https://doi.org/10.1007/s00122-009-1134-y
- Minoche, A. E., Dohm, J. C., Schneider, J., Holtgräwe, D., Viehöver, P., Montfort, M., Rosleff Sörensen, T., Weisshaar, B., and Himmelbauer, H. 2015. Exploiting single-molecule transcript sequencing for eukaryotic gene prediction. Genome Biol. 16: 184. doi:https://doi.org/10.1186/s13059-015-0729-7
- Miyatake, K., Saito, T., Negoro, S., Yamaguchi, H., Nunome, T., Ohyama, A., and Fukuoka, H. 2016. Detailed mapping of a resistance locus against Fusarium wilt in cultivated eggplant (Solanum melongena). Theor. Appl. Genet. 129: 357–367. doi:https://doi.org/10.1007/s00122-015-2632-8
- Miyatake, K., Saito, T., Negoro, S., Yamaguchi, H., Nunome, T., Ohyama, A., and Fukuoka, H. 2012. Development of selective markers linked to a major QTL for parthenocarpy in eggplant (Solanum melongena L.). Theor. Appl. Genet. 124: 1403–1413. doi:https://doi.org/10.1007/s00122-012-1796-8
- Miyatake, K., Saito T., Nunome, T., Yamaguchi, H., Negoro, S., Ohyama A., Wu, J., Katayose, Y., and Fukuoka, H. 2020. Fine mapping of a major locus representing the lack of prickles in eggplant revealed the availability of a 0.5-kb insertion/deletion for marker-assisted selection. Breed. Sci. 70: 438–448. doi:https://doi.org/10.1270/jsbbs.20004
- Moncada, A., Miceli, A., Vetrano, F., Mineo, V., Planeta, D., and D’Anna, F. 2013. Effect of grafting on yield and quality of eggplant (Solanum melongena L.). Sci. Hortic. 149: 108–114. doi:https://doi.org/10.1016/j.scienta.2012.06.015
- Montesclaros, L., Nicol, N., Ubalijoro, E., Leclerc-Potvin, C., Ganivet, L., Laliberté, J. F., and Fortin, M. G. 1997. Response to potyvirus infection and genetic mapping of resistance loci to potyvirus infection in Lactuca. Theor. Appl. Genet. 94: 941–946.
- Moore, S., Vrebalov, J., Payton, P., and Giovannoni, J. J. 2002. Use of genomics tools to isolate key ripening genes and analyse fruit maturation in tomato. J. Exp. Bot. 53: 2023–2030. doi:https://doi.org/10.1093/jxb/erf057
- Moreau, P., Thoquet, P., Olivier, J., Laterrot, H., and Grimsley, N. 1998. Genetic mapping of Ph-2, a single locus controlling partial resistance to Phytophthora infestans in tomato. MPMI 11: 259–269. doi:https://doi.org/10.1094/MPMI.1998.11.4.259
- Morelock, T. E., and Correll, J. C. 2007. Spinach. In Vegetables I. Prohens, J., and Nuez, F., Eds. Springer: New York, NY, pp 189–218.
- Moreno-Vázquez, S., Ochoa, O. E., Faber, N., Chao, S., Jacobs, J. M. E., Maisonneuve, B., Kesseli, R. V., and Michelmore, R. W. 2003. SNP-based codominant markers for a recessive gene conferring resistance to corky root rot (Rhizomonas suberifaciens) in lettuce (Lactuca sativa). Genome 46: 1059–1069. doi:https://doi.org/10.1139/g03-073
- Mou, B. 2008a. Evaluation of oxalate concentration in the U.S. spinach germplasm collection. HortScience 43: 1690–1693. doi:https://doi.org/10.21273/HORTSCI.43.6.1690
- Mou, B. 2008b. Leafminer resistance in spinach. HortScience 43: 1716–1719. doi:https://doi.org/10.21273/HORTSCI.43.6.1716
- Mou, B., Koike, S. T., and Du Toit, L. J. 2008. Screening for resistance to leaf spot diseases of spinach. HortScience 43: 1706–1710. doi:https://doi.org/10.21273/HORTSCI.43.6.1706
- Moury, B., Pflieger, S., Blattes, A., Lefebvre, V., and Palloix, A. 2000. A CAPS marker to assist selection of tomato spotted wilt virus (TSWV) resistance in pepper. Genome 43: 137–142. doi:https://doi.org/10.1139/g99-098
- Muktar, M. S., Lubeck, J., Strahwald, J., and Gebhardt, C. 2015. Selection and validation of potato candidate genes for maturity corrected resistance to Phytophthora infestans based on differential expression combined with SNP association and linkage mapping. Front. Genet. 6: 294. doi:https://doi.org/10.3389/fgene.2015.00294
- Muys, C., Thienpont, C. N., Dauchot, N., Maudoux, O., Draye, X., and Cutsem, P.V. 2014. Integration of AFLPs, SSRs and SNPs markers into a new genetic map of industrial chicory (Cichorium intybus L. var. sativum). Plant Breed. 133: 130–137. doi:https://doi.org/10.1111/pbr.12113
- Naegele, R. P., Ashrafi, H., Hill, T. A., Chin-Wo, S. R., Van Deynze, A. E., and Hausbeck, M. K. 2014. QTL mapping of fruit rot resistance to the plant pathogen Phytophthora capsici in a recombinant inbred line Capsicum annuum population. Phytopathology 104: 479–483. doi:https://doi.org/10.1094/PHYTO-05-13-0143-R
- Naresh, P., Lin, S. W., Lin, C. Y., Wang, Y. W., Schafleitner, R., Kilian, A., and Kumar, S. 2018. Molecular markers associated to two non-allelic genic male sterility genes in peppers (Capsicum annuum L.). Front. Plant Sci. 9: 1343. doi:https://doi.org/10.3389/fpls.2018.01343
- Nicaise, V., German-Retana, S., Sanjuan, R., Dubrana, M. P., Mazier, M., Maisonneuve, B., Candresse, T., Caranta, C., and Le Gall, O. 2003. The eukaryotic translation initiation factor 4E controls lettuce susceptibility to the potyvirus Lettuce mosaic virus. Plant Physiol. 132: 1272–1282. doi:https://doi.org/10.1104/pp.102.017855
- Nicolaï, M., Cantet, M., Lefebvre, V., Sage-Palloix, A. M., and Palloix, A. 2013. Genotyping a large collection of pepper (Capsicum spp.) with SSR loci brings new evidence for the wild origin of cultivated C. annuum and the structuring of genetic diversity by human selection of cultivar types. Genet. Resour. Crop Evol. 60: 2375–2390. doi:https://doi.org/10.1007/s10722-013-0006-0
- Nie, J., Wang, Y., He, H., Guo, C., Zhu, W., Pan, J., Li, D., Lian, H., Pan, J., and Cai, R. 2015. Loss-of-function mutations in CsMLO1 confer durable powdery mildew resistance in cucumber (Cucumis sativus L.). Front. Plant Sci. 6: 1155. doi:https://doi.org/10.3389/fpls.2015.01155
- Nimmakayala, P., Abburi, V. L., Saminathan, T., Alaparthi, S. B., Almeida, A., Davenport, B., Nadimi, M., Davidson, J., Tonapi, K., Yadav, L., Malkaram, S., Vajja, G., Hankins, G., Harris, R., Park, M., Choi, D., Stommel, J., and Reddy, U. K. 2016. Genome-wide diversity and association mapping for capsaicinoids and fruit weight in Capsicum annuum L. Sci. Rep. 6: 38081. doi:https://doi.org/10.1038/srep38081
- Niño-Liu, D. O., Zhang, L., and Foolad, M. R. 2003. Sequence comparison and characterization of DNA fragments amplified by resistance gene primers in tomato. Acta Hortic. 625: 49–58. doi:https://doi.org/10.17660/ActaHortic.2003.625.4
- Njogu, M. K., Yang, F., Li, J., Wang, X., Ogweno, J. O., and Chen, J. 2020. A novel mutation in TFL1 homolog sustaining determinate growth in cucumber (Cucumis sativus L.). Theor. Appl. Genet. 133: 3323–3332. doi:https://doi.org/10.1007/s00122-020-03671-4
- Noonan, S. C., and Savage, G. P. 1999. Oxalate content of foods and its effect on humans. Asia Pac. J. Clin. Nutr. 8: 64–74.
- Nunome, T., Ishiguro, K., Yoshida, T., and Hirai, M. 2001. Mapping of fruit shape and color development traits in eggplant (Solanum melongena L.) based on RAPD and AFLP markers. Breed. Sci. 51: 19–26. doi:https://doi.org/10.1270/jsbbs.51.19
- Ohlson, E. W., Ashrafi, H., and Foolad, M. R. 2018. Identification and mapping of late blight resistance quantitative trait loci in tomato accession PI 163245. Plant Genome 11: 180007. doi:https://doi.org/10.3835/plantgenome2018.01.0007
- Onodera, Y., Yonaha, I., Masumo, H., Tanaka, A., Niikura, S., Yamazaki, S., and Mikami, T. 2011. Mapping of the genes for dioecism and monoecism in Spinacia oleracea L.: evidence that both genes are closely linked. Plant Cell Rep. 30: 965–971. doi:https://doi.org/10.1007/s00299-010-0998-2
- Onodera, Y., Yonaha, I., Niikura, S., Yamazaki, S., and Mikami, T. 2008. Monoecy and gynomonoecy in Spinacia oleracea L.: morphological and genetic analyses. Sci. Hortic. 118: 266–269. doi:https://doi.org/10.1016/j.scienta.2008.06.008
- Onus, A. N., and Pickersgill, B. 2004. Unilateral incompatibility in Capsicum (Solanaceae): occurrence and taxonomic distribution. Ann. Bot. 94: 289–295. doi:https://doi.org/10.1093/aob/mch139
- Osipowski, P., Pawełkowicz, M., Wojcieszek, M., Skarzyńska, A., Przybecki, Z., and Pląder, W. 2020. A high-quality cucumber genome assembly enhances computational comparative genomics. Mol. Genet. Genomics 295: 177–193. doi:https://doi.org/10.1007/s00438-019-01614-3
- Ou, L., Li, D., Lv, J., Chen, W., Zhang, Z., Li, X., Yang, B., Zhou, S., Yang, S., Li, W., Gao, H., Zeng, Q., Yu, H., Ouyang, B., Li, F., Liu, F., Zheng, J., Liu, Y., Wang, J., Wang, B., Dai, X., Ma, Y., and Zou, X. 2018. Pan-genome of cultivated pepper (Capsicum) and its use in gene presence-absence variation analyses. New Phytol. 220: 360–363. doi:https://doi.org/10.1111/nph.15413
- Page, A., Gibson, J., Meyer, R. S., and Chapman, M. A. 2019. Eggplant domestication: pervasive gene flow, feralization, and transcriptomic divergence. Mol. Biol. Evol. 36: 1359–1372. doi:https://doi.org/10.1093/molbev/msz062
- Pakdeevaraporn, P., Wasee, S., Taylor, P. W. J., and Mongkolporn, O. 2005. Inheritance of resistance to anthracnose caused by Colletotrichum capsici in Capsicum. Plant Breed. 124: 206–208. doi:https://doi.org/10.1111/j.1439-0523.2004.01065.x
- Palumbo, F., Qi, P., Batista Pinto, V., Devos, K. M., and Barcaccia, G. 2019. Construction of the first SNP-based linkage map using genotyping-by-sequencing and mapping of the male-sterility gene in leaf chicory (Cichorium intybus L.). Front. Plant Sci. 10: 276. doi:https://doi.org/10.3389/fpls.2019.00276
- Pan, J. S., Tan, J. Y., Wang, Y. H., Zheng, X. Y., Owens, K., Li, D. W., Li, Y. H., and Weng, Y. 2018. STAYGREEN (CsSGR) is a candidate for the anthracnose (Colletotrichum orbiculare) resistance locus cla in Gy14 cucumber. Theor. Appl. Genet. 131: 1577–1587. doi:https://doi.org/10.1007/s00122-018-3099-1
- Pan, Y. P., Liang, X. J., Gao, M. L., Meng, H. W., Liu, H. Q., Weng, Y., and Cheng, Z. H. 2017. Round fruit shape in WI7239 cucumber is controlled by two interacting quantitative trait loci with one putatively encoding a tomato SUN homolog. Theor. Appl. Genet. 130: 573–586. doi:https://doi.org/10.1007/s00122-016-2836-6
- Pan, Y. P., Wang, Y. H., McGregor, C., Liu, S., Luan, F. S., Gao, M. L., and Weng, Y. 2020a. Genetic architecture of fruit size and shape variation in cucurbits: a comparative perspective. Theor. Appl. Genet. 133: 1–21. doi:https://doi.org/10.1007/s00122-019-03481-3
- Pan, Y. P., Wen, C. L., Han, Y. H., Wang, Y. H., Li, Y. H., Li, S., Cheng, X. M., and Weng, Y. 2020b. QTL for horticulturally important traits associated with pleiotropic andromonoecy and carpel number loci, and a paracentric inversion in cucumber. Theor. Appl. Genet. 133: 2271–2290. doi:https://doi.org/10.1007/s00122-020-03596-y
- Paran, I., and Michelmore, R. W. 1993. Development of reliable PCR-based markers linked to downy mildew resistance genes in lettuce. Theor. Appl. Genet. 85: 985–993. doi:https://doi.org/10.1007/BF00215038
- Paran, I., Borovsky, Y., Nahon, S., and Cohen, O. 2007. The use of induced mutations to study shoot architecture in Capsicum. Isr. J. Plant Sci. 55: 125–131. doi:https://doi.org/10.1560/IJPS.55.2.125
- Paran, I., Kesseli, R., and Michelmore, R. 1991. Identification of restriction fragment length polymophism and random amplified polymorphic DNA markers linked to downy mildew resistance genes in lettuce, using near-isogenic lines. Genome 34: 1021–1027. doi:https://doi.org/10.1139/g91-157
- Paran, I., van der Voort, J. R., Lefebvre, V., Jahn, M., Landry, L., van Schriek, M., Tanyolac, B., Caranta, C., Chaim, A. B., Livingstone, K., Palloix, A., and Peleman, J. 2004. An integrated genetic linkage map of pepper (Capsicum spp.). Mol. Breed 13: 251–261. doi:https://doi.org/10.1023/B:MOLB.0000022526.30914.31
- Paris, H. S., Daunay, M. C., and Janick, J. 2012. Occidental diffusion of cucumber (Cucumis sativus) 500-1300 CE: two routes to Europe. Ann. Bot. 109: 117–126. doi:https://doi.org/10.1093/aob/mcr281
- Park, M., Lee, J. H., Han, K., Jang, S., Han, J., Lim, J. H., Jung, J. W., and Kang, B. C. 2019. A major QTL and candidate genes for capsaicinoid biosynthesis in the pericarp of Capsicum chinense revealed using QTL-seq and RNA-seq. Theor. Appl. Genet. 132: 515–529. doi:https://doi.org/10.1007/s00122-018-3238-8
- Parra, L., Maisonneuve, B., Lebeda, A., Schut, J., Christopoulou, M., Jeuken, M., McHale, L., Truco, M. J., Crute, I., and Michelmore, R. 2016. Rationalization of genes for resistance to Bremia lactucae in lettuce. Euphytica 210: 309–326. doi:https://doi.org/10.1007/s10681-016-1687-1
- Parra, L., Simko, I., and Michelmore, R. W. 2021. Identification of major quantitative trait loci controlling field resistance to downy mildew in cultivated lettuce (Lactuca sativa). Phytopathology 111: 541–547. doi:https://doi.org/10.1094/PHYTO-08-20-0367-R
- Patella, A., Palumbo, F., Galla, G., and Barcaccia, G. 2019a. The molecular determination of hybridity and homozygosity estimates in breeding populations of lettuce (Lactuca sativa L.). Genes 10: 916. doi:https://doi.org/10.3390/genes10110916
- Patella, A., Scariolo, F., Palumbo, F., and Barcaccia, G. 2019b. Genetic structure of cultivated varieties of radicchio (Cichorium intybus L.): a comparison between F1 hybrids and synthetics. Plants 8: 213. doi:https://doi.org/10.3390/plants8070213
- Pei, C., Wang, H., Zhang, J., Wang, Y., Francis, D. M., and Yang, W. 2012. Fine mapping and analysis of a candidate gene in tomato accession PI128216 conferring hypersensitive resistance to bacterial spot race T3. Theor. Appl. Genet. 124: 533–542. doi:https://doi.org/10.1007/s00122-011-1726-1
- Peralta, I. E., and Spooner, D. M. 2005. History, origin and early cultivation of tomato (Solanaceae). In Genetic Improvement of Solanaceous Crops: Tomato; Razdan, M. K., and Mattoo, A. K., Eds. Science Publishers: Enfield, NH, pp 1–24.
- Pereira-Dias, L., Vilanova, S., Fita, A., Prohens, J., and Rodríguez-Burruezo, A. 2019. Genetic diversity, population structure, and relationships in a collection of pepper (Capsicum spp.) landraces from the Spanish centre of diversity revealed by genotyping-by-sequencing (GBS). Hortic. Res. 6: 54.
- Perry, L., Dickau, R., Zarrillo, S., Holst, I., Pearsall, D. M., Piperno, D. R., Berman, M. J., Cooke, R. G., Rademaker, K., Ranere, A. J., Raymond, J. S., Sandweiss, D. H., Scaramelli, F., Tarble, K., and Zeidler, J. A. 2007. Starch fossils and the domestication and dispersal of chili peppers (Capsicum spp. L.) in the Americas. Science 315: 986–988. doi:https://doi.org/10.1126/science.1136914
- Phan, N. T., Trinh, L. T., Rho, M. Y., Park, T. S., Kim, O. R., Zhao, J., Kim, H. M., and Sim, S. C. 2019. Identification of loci associated with fruit traits using genome-wide single nucleotide polymorphisms in a core collection of tomato (Solanum lycopersicum L.). Scientia Hortic 243: 567–574. doi:https://doi.org/10.1016/j.scienta.2018.09.003
- Phatak, S. C., Liu, J., Jaworski, C. A., and Sultanbawa, A. F. 1991. Functional male sterility in eggplant: Inheritance and linkage to the purple fruit color gene. J. Hered. 82:81–83. doi:https://doi.org/10.1093/jhered/82.1.81
- Pierre, M., Noel, L., Lahaye, T., Ballvora, A., Veuskens, J., Ganal, M., and Bonas, U. 2000. High-resolution genetic mapping of the pepper resistancelocus Bs3 governing recognition of the Xanthomonas campestris pv vesicatora AvrBs3 protein. Theor. Appl. Genet. 101: 255–263.
- Plazas, M., Andújar, I., Vilanova, S., Gramazio, P., Herraiz, F. J., and Prohens, J. 2014. Conventional and phenomics characterization provides insight into the diversity and relationships of hypervariable scarlet (Solanum aethiopicum L.) and gboma (S. macrocarpon L.) eggplant complexes. Front. Plant Sci. 5: 318. doi:https://doi.org/10.3389/fpls.2014.00318
- Plazas, M., Andújar, I., Vilanova, S., Hurtado, M., Gramazio, P., Herraiz, F. J., and Prohens, J. 2013. Breeding for chlorogenic acid content in eggplant: interest and prospects. Not. Bot. Hort. Agrobot. Cluj. 41: 26–35. doi:https://doi.org/10.15835/nbha4119036
- Plazas, M., Vilanova, S., Gramazio, P., Rodríguez-Burruezo, A., Fita, A., Herraiz, F. J., Ranil, R., Fonseka, R., Niran, L., Fonseka, H., Kouassi, B., Kouassi, A., Kouassi, A., and Prohens, J. 2016. Interspecific hybridization between eggplant and wild relatives from different genepools. J. Am. Soc. Hort. Sci. 141: 34–44. doi:https://doi.org/10.21273/JASHS.141.1.34
- Pnueli, L., Carmel-Goren, L., Hareven, D., Gutfinger, T., Alvarez, J., Ganal, J., Zamir, D., and Lifschitz, E. 1998. The SELF-PRUNING gene of tomato regulates vegetative to reproductive switching of sympodial meristems and is the ortholog of CEN and TFl1. Development 125: 1979–1989. doi:https://doi.org/10.1242/dev.125.11.1979
- Poland, J. A., Brown, P. J., Sorrells, M. E., and Jannink, J. L. 2012. Development of high-density genetic maps for barley and wheat using a novel two-enzyme genotyping-by-sequencing approach. PLoS ONE 7: e32253. doi:https://doi.org/10.1371/journal.pone.0032253
- Popovsky, S., and Paran, I. 2000. Molecular genetics of the y locus in pepper: its relation to capsanthin-capsorubin synthase and to fruit color. Theor. Appl. Genet. 101: 86–89.
- Portis, E., Barchi, L., Toppino, L., Lanteri, S., Acciarri, N., Felicioni, N., Fusari, F., Barbierato, V., Cericola, F., Valè, G., and Rotino, G. L. 2014. QTL mapping in eggplant reveals clusters of yield-related loci and orthology with the tomato genome. PLoS ONE 9: e89499. doi:https://doi.org/10.1371/journal.pone.0089499
- Portis, E., Cericola, F., Barchi, L., Toppino, L., Acciarri, N., Pulcini, L., Sala, T., Lanteri, S., and Rotino, G. L. 2015. Association mapping for fruit, plant and leaf morphology traits in eggplant. PLoS ONE 10: e0135200. doi:https://doi.org/10.1371/journal.pone.0135200
- Potnis, N., Branham, S. E., Jones, J. B., and Wechter, W. P. 2019. Genome-wide association study of resistance to Xanthomonas gardneri in the USDA pepper (Capsicum) collection. Phytopathology 109: 1217–1225. doi:https://doi.org/10.1094/PHYTO-06-18-0211-R
- Prince, J. P., Pochard, E., and Tanksley, S. D. 1993. Construction of a molecular linkage map of pepper and a comparison of synteny with tomato. Genome 36: 404–417. doi:https://doi.org/10.1139/g93-056
- Prohens, J., Blanca, J. M., and Nuez, F. 2005. Morphological and molecular variation in a collection of eggplants from a secondary center of diversity: implications for conservation and breeding. JASHS 130: 54–63. doi:https://doi.org/10.21273/JASHS.130.1.54
- Pujol, M., Alexiou, K. G., Fontaine, A. S., Mayor, P., Miras, M., Jahrmann, T., Garcia-Mas, J., and Aranda, M.A. 2019. Mapping cucumber vein yellowing virus resistance in cucumber (Cucumis sativus L.) by using BSA-seq analysis. Front. Plant Sci. 10: 1583. doi:https://doi.org/10.3389/fpls.2019.01583
- Qi, C. Z., Yuan, Z. Z., and Li, Y.X. 1983. A new type of cucumber, Cucumis sativus L. var. xishuangbannanesis Qi et Yuan. Acta Hortic. Sin. 10: 259–263.
- Qi, J. J., Liu, X., Shen, D., Miao, H., Xie, B., Li, X., Zeng, P., Wang, S., Shang, Y., Gu, X., Du, Y., Li, Y., Lin, T., Yuan, J., Yang, X., Chen, J., Chen, H., Xiong, X., Huang, K., Fei, Z., Mao, L., Tian, L., Städler, T., Renner, S. S., Kamoun, S., Lucas, W. J., Zhang, Z., and Huang, S. 2013. A genomic variation map provides insights into the genetic basis of cucumber domestication and diversity. Nat. Genet. 45: 1510–1515. doi:https://doi.org/10.1038/ng.2801
- Qian, W., Fan, G., Liu, D., Zhang, H., Wang, X., Wu, J., and Xu, Z. 2017. Construction of a high-density genetic map and the X/Y sex-determining gene mapping in spinach based on large-scale markers developed by specific-locus amplified fragment sequencing (SLAF-seq). BMC Genomics 18: 276. doi:https://doi.org/10.1186/s12864-017-3659-9
- Qin, C., Yu, C., Shen, Y., Fang, X., Chen, L., Min, J., Cheng, J., Zhao, S., Xu, M., Luo, Y., Yang, Y., Wu, Z., Mao, L., Wu, H., Ling-Hu, C., Zhou, H., Lin, H., González-Morales, S., Trejo-Saavedra, D. L., Tian, H., Tang, X., Zhao, M., Huang, Z., Zhou, A., Yao, X., Cui, J., Li, W., Chen, Z., Feng, Y., Niu, Y., Bi, S., Yang, X., Li, W., Cai, H., Luo, X., Montes-Hernández, S., Leyva-González, M. A., Xiong, Z., He, X., Bai, L., Tan, S., Tang, X., Liu, D., Liu, J., Zhang, S., Chen, M., Zhang, L., Zhang, L., Zhang, Y., Liao, W., Zhang, Y., Wang, M., Lv, X., Wen, B., Liu, H., Luan, H., Zhang, Y., Yang, S., Wang, X., Xu, J., Li, X., Li, S., Wang, J., Palloix, A., Bosland, P. W., Li, Y., Krogh, A., Rivera-Bustamante, R. F., Herrera-Estrella, L., Yin, Y., Yu, J., Hu, K., and Zhang, Z. 2014. Whole-genome sequencing of cultivated and wild peppers provides insights into Capsicum domestication and specialization. Proc. Natl. Acad. Sci. U.S.A. 111: 5135–5140. doi:https://doi.org/10.1073/pnas.1400975111
- Qin, J., Shi, A., Mou, B., Grusak, M. A., Weng, Y., Ravelombola, W., Bhattarai, G., Dong, L., and Yang, W. 2017. Genetic diversity and association mapping of mineral element concentrations in spinach leaves. BMC Genomics 18:941. doi:https://doi.org/10.1186/s12864-017-4297-y
- Ramírez-Madera, A. O., and Havey, M. J. 2017. Different haplotypes encode the same protein for independent sources of Zucchini Yellow Mosaic Virus resistance in cucumber. HortScience. 52: 1040–1042. doi:https://doi.org/10.21273/HORTSCI11951-17
- Ranil, R. H. G., Prohens, J., Aubriot, X., Niran, H. M. L., Plazas, M., Fonseka, R. M., Vilanova, S., Fonseka, H. H., Gramazio, P., and Knapp, S. 2017. Solanum insanum L. (subgenus Leptostemonum Bitter, Solanaceae), the neglected wild progenitor of eggplant (S. melongena L.): a review of taxonomy, characteristics and uses aimed at its enhancement for improved eggplant breeding. Genet. Resour. Crop Evol. 64: 1707–1722. doi:https://doi.org/10.1007/s10722-016-0467-z
- Rao, G. U., and Paran, I. 2003. Polygalacturonase: a candidate gene for the soft flesh and deciduous fruit mutation in Capsicum. Plant Mol. Biol. 51: 135–141. doi:https://doi.org/10.1023/a:1020771906524
- Rao, G. U., Chaim, A. B., Borovsky, Y., and Paran, I. 2003. Mapping of yield-related QTLs in pepper in an interspecific cross of Capsicum annuum and C. frutescens. Theor. Appl. Genet. 106: 1457–1466. doi:https://doi.org/10.1007/s00122-003-1204-5
- Rauscher, G., and Simko, I. 2013. Development of genomic SSR markers for fingerprinting lettuce (Lactuca sativa L.) cultivars and mapping genes. BMC Plant Biol. 13: 11. doi:https://doi.org/10.1186/1471-2229-13-11
- Rehrig, W. Z., Ashrafi, H., Hill, T., Prince, J., and Van Deynze, A. 2014. CaDMR1 cosegregates with QTL Pc5.1 for resistance to Phytophthora capsici in pepper (Capsicum annuum). Plant Genome 7. doi:https://doi.org/10.3835/plantgenome2014.03.0011
- Ren, Y., Zhang, Z., Liu, J., Staub, J. E., Han, Y., Cheng, Z., Li, X., Lu, J., Miao, H., Kang, H., Xie, B., Gu, X., Wang, X., Du, Y., Jin, W. W., and Huang, S. 2009. An integrated genetic and cytogenetic map of the cucumber genome. PLoS ONE 4: e5795. doi:https://doi.org/10.1371/journal.pone.0005795
- Rett-Cadman, S., Colle, M., Mansfeld, B., Barry, C. S., Wang, Y. H., Weng, Y., Gao, L., Fei, Z., and Grumet, R. 2019. QTL and transcriptomic analyses implicate cuticle transcription factor SHINE as a source of natural variation for epidermal traits in cucumber Fruit. Front. Plant Sci. 10: 1536. doi:https://doi.org/10.3389/fpls.2019.01536
- Reyes-Chin-Wo, S., Wang, Z., Yang, X., Kozik, A., Arikit, S., Song, C., Xia, L., Froenicke, L., Lavelle, D. O., Truco, M. J., Xia, R., Zhu, S., Xu, C., Xu, H., Xu, X., Cox, K., Korf, I., Meyers, B. C., and Michelmore, R. W. 2017. Genome assembly with in vitro proximity ligation data and whole-genome triplication in lettuce. Nat. Commun. 8: 14953. doi:https://doi.org/10.1038/ncomms14953
- Ribera, A., Bai, Y., Wolters, A. M. A., van Treuren, R., and Kik, C. 2020a. A review on the genetic resources, domestication and breeding history of spinach (Spinacia oleracea L.). Euphytica 216: 48. doi:https://doi.org/10.1007/s10681-020-02585-y
- Ribera, A., van Treuren, R., Kik, C., Bai, Y., and Wolters, A. M. A. 2020b. On the origin and dispersal of cultivated spinach (Spinacia oleracea L.). Genet. Resour. Crop Evol. 68: 1023–1032. doi:https://doi.org/10.1007/s10722-020-01042-y
- Rick, C. M. 1980. Tomato. In Hybridization of Crop Plants; Fehr, W. R., and Hadley, H. H., Eds. American Society of Agronomy, Crop Science Society of America, Madison, WI, pp 669–680.
- Robbins, M. D., Masud, M. A. T., Panthee, D. R., Gardner, R. G., Francis, D., and Stevens, M. A. 2010. Marker-assisted selection for coupling phase resistance to tomato spotted wilt virus and Phytophthora infestans (late blight) in tomato. HortScience 45: 1424–1428. doi:https://doi.org/10.21273/HORTSCI.45.10.1424
- Rodriguez-Leal, D., Lemmon, Z. H., Man, J., Bartlett, M. E., and Lippman, Z. B. 2017. Engineering quantitative trait variation for crop improvement by genome editing. Cell 171: 470–480.e478. doi:https://doi.org/10.1016/j.cell.2017.08.030
- Ronald, P. C., Salmeron, J. M., Carland, F. M., and Staskawicz, B. J. 1992. The cloned avirulence gene avrPto induces disease resistance in tomato cultivars containing the Pto resistance gene. J. Bacteriol. 174: 1604–1611. doi:https://doi.org/10.1128/jb.174.5.1604-1611.1992
- Ronen, G., Carmel-Goren, L., Zamir, D., and Hirschberg, J. 2000. An alternative pathway to beta -carotene formation in plant chromoplasts discovered by map-based cloning of beta and old-gold color mutations in tomato. Proc. Natl. Acad. Sci. U.S.A. 97: 11102–11107. doi:https://doi.org/10.1073/pnas.190177497
- Rosental, L., Still, D.W., You, Y., Hayes, R. J., and Simko, I. 2021. Mapping and identification of genetic loci affecting earliness of bolting and flowering in lettuce. Theor. Appl. Genet. doi:https://doi.org/10.1007/s00122-021-03898-9
- Rothan, C., Diouf, I., and Causse, M. 2019. Trait discovery and editing in tomato. Plant J. 97: 73–90. doi:https://doi.org/10.1111/tpj.14152
- Rotino, G. L., Sala, T., and Toppino, L. 2014. Eggplant. In Alien Gene Transfer in Crop Plants, Volume 2; Pratap, A., and Kumar, J., Eds. Springer New York: New York, NY, pp 381–409.
- Rotino, G., Perri, E., Acciarri, N., Sunseri, F., and Arpaia, S. 1997. Development of eggplant varietal resistance to insects and diseases via plant breeding. Adv. Hortic. Sci. 11: 193–201.
- Rubatzky, V. E., and Yamaguchi, M. 1997. Spinach, table beets, and other vegetable chenopods. In World Vegetables. Principles, Production, and Nutritive Values; Rubatzky, V. E., and Yamaguchi, M., Eds. Springer, pp 457–473.
- Rubinstein, M., Katzenellenbogen, M., Eshed, R., Rozen, A., Katzir, N., Colle, M., Yang, L. M., Grumet, R., Weng, Y., Sherman, A., and Ophir, R. 2015. A ultrahigh-density linkage map for cultivated cucumber (Cucumis sativus L.) using a single-nucleotide polymorphism genotyping array. PLoS ONE 10: e0124101. doi:https://doi.org/10.1371/journal.pone.0124101
- Rubio, M., Caranta, C., and Palloix, A. 2008. Functional markers for selection of potyvirus resistance alleles at the pvr2-eIF4E locus in pepper using tetra-primer ARMS-PCR. Genome 51: 767–771. doi:https://doi.org/10.1139/G08-056
- Ruffel, S., Gallois, J. L., Lesage, M. L., and Caranta, C. 2005. The recessive potyvirus resistance gene pot-1 is the tomato orthologue of the pepper pvr2-eIF4E gene. Mol. Genet. Genomics 274: 346–353. doi:https://doi.org/10.1007/s00438-005-0003-x
- Safaei, M., Olfati, J. A., Hamidoghli, Y., Rabiei, B., Yamamoto, E., and Shirasawa, K. 2020. Four genetic loci control compact plant size with yellow pear-shaped fruit in ornamental tomato (Solanum lycopersicum L.). Plant Genome 13: e20017. doi:https://doi.org/10.1002/tpg2.20017
- Saini, D. K., and Kaushik, P. 2019. Visiting eggplant from a biotechnological perspective: a review. Sci. Hortic. 253: 327–340. doi:https://doi.org/10.1016/j.scienta.2019.04.042
- Salgon, S., Jourda, C., Sauvage, C., Daunay, M. C., Reynaud, B., Wicker, E., and Dintinger, J. 2017. Eggplant resistance to the Ralstonia solanacearum species complex involves both broad-spectrum and strain-specific quantitative trait loci. Front. Plant Sci. 8: 828. doi:https://doi.org/10.3389/fpls.2017.00828
- Sandoya, G. V., Maisonneuve, B., Truco, M. J., Bull, C. T., Simko, I., Trent, M., Hayes, R. J., and Michelmore, R. W. 2019. Genetic analysis of resistance to bacterial leaf spot in the heirloom lettuce cultivar Reine des Glaces. Mol. Breed. 39: 160.
- Sandoya, G. V., Truco, M. J., Bertier, L. D., Subbarao, K. V., Simko, I., Hayes, R. J., and Michelmore, R. W. 2021. Genetics of partial resistance against Verticillium dahliae race 2 in wild and cultivated lettuce. Phytopathology 111. doi:https://doi.org/10.1094/PHYTO-09-20-0396-R
- Sauvage, C., Segura, V., Bauchet, G., Stevens, R., Do, P. T., Nikoloski, Z., Fernie, A. R., and Causse, M. 2014. Genome-wide association in tomato reveals 44 candidate loci for fruit metabolic traits. Plant Physiol. 165: 1120–1132. doi:https://doi.org/10.1104/pp.114.241521
- Schwember, A. R., and Bradford, K. J. 2010a. A genetic locus and gene expression patterns associated with the priming effect on lettuce seed germination at elevated temperatures. Plant Mol. Biol. 73: 105–118. doi:https://doi.org/10.1007/s11103-009-9591-x
- Schwember, A. R., and Bradford, K. J. 2010b. Quantitative trait loci associated with longevity of lettuce seeds under conventional and controlled deterioration storage conditions. J. Exp. Bot. 61: 4423–4436. doi:https://doi.org/10.1093/jxb/erq248
- Seah, S., Williamson, V. M., Garcia, B. E., Mejía, L., Salus, M. S., Martin, C. T., and Maxwell, D. P. 2007. Evaluation of a co-dominant SCAR marker for detection of the Mi-1 locus for resistance to root-knot nematode in tomato germplasm. Rep. Tomato Genet. Coop. 57: 37–40.
- Sebastian, P., Schaefer, H., Telford, I. R. H., and Renner, S.S. 2010. Cucumber (Cucumis sativus) and melon (C. melo) have numerous wild relatives in Asia and Australia, and the sister species of melon is from Australia. Proc. Natl. Acad. Sci. U.S.A. 107: 14269–14273. doi:https://doi.org/10.1073/pnas.1005338107
- Seki, K., Komatsu, K., Hiraga, M., Tanaka, K., Uno, Y., and Matsumura, H. 2021. Development of PCR-based marker for resistance to Fusarium wilt race 2 in lettuce (Lactuca sativa L.). Euphytica 217: 126. doi:https://doi.org/10.1007/s10681-021-02857-1
- Sharlach, M., Dahlbeck, D., Liu, L., Chiu, J., Jimenez-Gomez, J. M., Kimura, S., Koenig, D., Maloof, J. N., Sinha, N., Minsavage, G. V., Jones, J. B., Stall, R. E., and Staskawicz, B. J. 2013. Fine genetic mapping of RXopJ4, a bacterial spot disease resistance locus from Solanum pennellii LA716. Theor. Appl. Genet. 126: 601–609. doi:https://doi.org/10.1007/s00122-012-2004-6
- She, H., Qian, W., Zhang, H., Liu, Z., Wang, X., Wu, J., Feng, C., Correll, J. C., and Xu, Z. 2018. Fine mapping and candidate gene screening of the downy mildew resistance gene RPF1 in Spinach. Theor. Appl. Genet. 131: 2529–2541. doi:https://doi.org/10.1007/s00122-018-3169-4
- She, H., Xu, Z., Zhang, H., Li, G., Wu, J., Wang, X., Li, Y., Liu, Z., and Qian, W. 2021. Identification of a male-specific region (MSR) in Spinacia oleracea. Hortic. Plant J. 7: 341–346. https://doi.org/10.1016/j.hpj.2021.01.003
- Sheng, Y. S., Pan, Y. P., Li, Y. H., Yang, L. M., and Weng, Y. 2020. Quantitative trait loci for fruit size and flowering time-related traits under domestication and diversifying selection in cucumber (Cucumis sativus L.). Plant Breed. 139: 176–191. doi:https://doi.org/10.1111/pbr.12754
- Shi, A., Correll, J., Feng, C., Mou, B., Avila, C. A., Stein, L. A., Hogan, R., Lindsey, d. T., Qin, J., Bhattarai, G., and Awika, H. O. 2019. Progress at developing genetic and molecular resources to improve spinach production and management. HortScience 54: S137.
- Shi, A., Mou, B., and Cheng, Z. M. 2016a. Genetic diversity and association analysis of leafminer (Liriomyza langei) resistance in spinach (Spinacia oleracea). Genome 59: 581–588. doi:https://doi.org/10.1139/gen-2016-0075
- Shi, A., Mou, B., and Correll, J. C. 2016b. Association analysis for oxalate concentration in spinach. Euphytica 212: 17–28. doi:https://doi.org/10.1007/s10681-016-1740-0
- Shi, A., Mou, B., Correll, J., Koike, S. T., Motes, D., Qin, J., Weng, Y., and Yang, W. 2016c. Association analysis and identification of SNP markers for Stemphylium leaf spot (Stemphylium botryosum f. sp. spinacia) resistance in spinach (Spinacia oleracea.). AJPS 7: 1600–1611. doi:https://doi.org/10.4236/ajps.2016.712151
- Shi, A., Mou, B., Correll, J., Motes, D., Weng, Y., Qin, J., and Yang, W. 2016d. SNP association analysis of resistance to Verticillium wilt (Verticillium dahliae Kleb.) in spinach. Aust. J. Crop Sci. 10: 1188–1196. doi:https://doi.org/10.21475/ajcs.2016.10.08.p7893
- Shi, A., Qin, J., Mou, B., Correll, J., Weng, Y., Brenner, D., Feng, C., Motes, D., Yang, W., Dong, L., Bhattarai, G., and Ravelombola, W. 2017. Genetic diversity and population structure analysis of spinach by single-nucleotide polymorphisms identified through genotyping-by-sequencing. PLoS ONE 12: e0188745. doi:https://doi.org/10.1371/journal.pone.0188745
- Shi, L., Yang, Y. H., Xie, Q., Miao, H., Bo, K. L., Song, Z. C., Wang, Y., Xie, B. Y., Zhang, S. P., and Gu, X. F. 2018. Inheritance and QTL mapping of cucumber mosaic virus resistance in cucumber (Cucumis sativus L.). PLoS ONE 13: e0200571. doi:https://doi.org/10.1371/journal.pone.0200571
- Shirasawa, K., Fukuoka, H., Matsunaga, H., Kobayashi, Y., Kobayashi, I., Hirakawa, H., Isobe, S., and Tabata, S. 2013. Genome-wide association studies using single nucleotide polymorphism markers developed by re-sequencing of the genomes of cultivated tomato. DNA Res. 20: 593–603. doi:https://doi.org/10.1093/dnares/dst033
- Siddique, M. I., Back, S., Lee, J. H., Jo, J., Jang, S., Han, K., Venkatesh, J., Kwon, J. K., Jo, Y. D., and Kang, B. C. 2020. Development and characterization of an ethyl methane sulfonate (EMS) induced mutant population in Capsicum annuum L. Plants 9: 396–396. doi:https://doi.org/10.3390/plants9030396
- Siddique, M. I., Lee, H. Y., Ro, N. Y., Han, K., Venkatesh, J., Solomon, A. M., Patil, A. S., Changkwian, A., Kwon, J. K., and Kang, B. C. 2019. Identifying candidate genes for Phytophthora capsici resistance in pepper (Capsicum annuum) via genotyping-by-sequencing-based QTL mapping and genome-wide association study. Sci. Rep. 9: 9962. doi:https://doi.org/10.1038/s41598-019-46342-1
- Sim, S. C., Durstewitz, G., Plieske, J., Wieseke, R., Ganal, M. W., Van Deynze, A., Hamilton, J. P., Buell, C. R., Causse, M., Wijeratne, S., and Francis, D. M. 2012. Development of a large SNP genotyping array and generation of high-density genetic maps in tomato. PLoS ONE 7: e40563. doi:https://doi.org/10.1371/journal.pone.0040563
- Simko, I. 2009. Development of EST-SSR markers for the study of population structure in lettuce (Lactuca sativa L.). J. Hered. 100: 256–262. doi:https://doi.org/10.1093/jhered/esn072
- Simko, I. 2013. Marker-assisted selection for disease resistance in lettuce. In Translational Genomics for Crop Breeding. Volume I: Biotic Stresses; Varshney, R. K., and Tuberosa, R., Eds. Wiley-Blackwell Publishers: Hoboken, NJ, pp 267–289.
- Simko, I. 2015. Analysis of bibliometric indicators to determine citation bias. Palgrave Commun. 1: 15011. doi:https://doi.org/10.1057/palcomms.2015.11
- Simko, I. 2016. High-resolution DNA melting analysis in plant research. Trends Plant Sci. 21: 528–537. doi:https://doi.org/10.1016/j.tplants.2016.01.004
- Simko, I. 2019. Genetic variation and relationship among content of vitamins, pigments, and sugars in baby leaf lettuce. Food Sci. Nutr. 7: 3317–3326. doi:https://doi.org/10.1002/fsn3.1196
- Simko, I. 2020a. Genetic variation in response to N, P, or K deprivation in baby leaf lettuce. Horticulturae 6: 15. doi:https://doi.org/10.3390/horticulturae6010015
- Simko, I. 2020b. Predictive modeling of a leaf conceptual midpoint quasi-color (CMQ) using artificial neural network. Sensors 20:3938. doi:https://doi.org/10.3390/s20143938
- Simko, I., and Hu, J. 2008. Population structure in cultivated lettuce and its impact on association mapping. J. Am. Soc. Hort. Sci. 133: 61–68. doi:https://doi.org/10.21273/JASHS.133.1.61
- Simko, I., Atallah, A. J., Ochoa, O. E., Antonise, R., Galeano, C. H., Truco, M. J., and Michelmore, R. W. 2013. Identification of QTLs conferring resistance to downy mildew in legacy cultivars of lettuce. Sci. Rep. 3: 2875. doi:https://doi.org/10.1038/srep02875
- Simko, I., Hayes, R. J., and Furbank, R. T. 2016. Non-destructive phenotyping of lettuce plants in early stages of development with optical sensors. Front. Plant Sci. 7:1985. doi:https://doi.org/10.3389/fpls.2016.01985
- Simko, I., Hayes, R. J., Mou, B., and McCreight, J. D. 2014a. Lettuce and spinach. In Yield Gains in Major U.S. Field Crops; Smith, S., Diers, B., Specht, J., and Carver, B., Eds. American Society of Agronomy, Inc., Crop Science Society of America, Inc., and Soil Science Society of America, Inc., Madison, WI, pp 53–86.
- Simko, I., Hayes, R. J., Truco, M. J., and Michelmore, R. W. 2011. Mapping a dominant negative mutation for triforine sensitivity in lettuce and its use as a selectable marker for detecting hybrids. Euphytica 182: 157–166. doi:https://doi.org/10.1007/s10681-011-0407-0
- Simko, I., Hayes, R. J., Truco, M. J., Michelmore, R. W., Antonise, R., and Massoudi, M. 2018. Molecular markers reliably predict post-harvest deterioration of fresh-cut lettuce in modified atmosphere packaging. Hortic. Res. 5: 21. doi:https://doi.org/10.1038/s41438-018-0022-5
- Simko, I., Jimenez-Berni, J. A., and Sirault, X. R. 2017. Phenomic approaches and tools for phytopathologists. Phytopathology 107: 6–17. doi:https://doi.org/10.1094/PHYTO-02-16-0082-RVW
- Simko, I., Ochoa, O. E., Pel, M. A., Tsuchida, C., Font I Forcada, C., Hayes, R. J., Truco, M. J., Antonise, R., Galeano, C. H., and Michelmore, R. W. 2015a. Resistance to downy mildew in lettuce ‘La Brillante’ is conferred by Dm50 gene and multiple QTL. Phytopathology 105: 1220–1228. doi:https://doi.org/10.1094/PHYTO-02-15-0057-R
- Simko, I., Pechenick, D. A., McHale, L. K., Truco, M. J., Ochoa, O. E., Michelmore, R. W., and Scheffler, B. E. 2009. Association mapping and marker-assisted selection of the lettuce dieback resistance gene Tvr1. BMC Plant Biol. 9: 135. doi:https://doi.org/10.1186/1471-2229-9-135
- Simko, I., Rauscher, G., Sideman, R. G., McCreight, J. D., and Hayes, R. J. 2014b. Evaluation and QTL mapping of resistance to powdery mildew in lettuce. Plant Pathol. 63: 344–353. doi:https://doi.org/10.1111/ppa.12087
- Simko, I., Zhou, Y., and Brandl, M. T. 2015b. Downy mildew disease promotes the colonization of romaine lettuce by Escherichia coli O157:H7 and Salmonella enterica. BMC Microbiol. 15: 19. doi:https://doi.org/10.1186/s12866-015-0360-5
- Simons, G., Groenendijk, J., Wijbrandi, J., Reijans, M., Groenen, J., Diergaarde, P., Van Der Lee, T., Bleeker, M., Onstenk, J., de Both, M., Haring, M., Mes, J., Cornelissen, B., Zabeau, M., and Vos, P. 1998. Dissection of the fusarium I2 gene cluster in tomato reveals six homologs and one active gene copy. Plant Cell 10: 1055–1068. doi:https://doi.org/10.2307/3870690
- Singh, R. J. 2007. Genetic Resources, Chromosome Engineering, and Crop Improvement. Volume 3 – Vegetable Crops. CRC Press, Boca Raton, FL, USA.
- Singh, R. J., and Lebeda, A. 2007. Landmark research in vegetable crops. In Genetic Resources, Chromosome Engineering, and Crop Improvement. Volume 3 – Vegetable Crops. Singh, R. J., Ed. CRC Press: Boca Raton, FL, pp 1–15.
- Solomon, A. M., Han, K., Lee, J. H., Lee, H. Y., Jang, S., and Kang, B. C. 2019. Genetic diversity and population structure of Ethiopian Capsicum germplasms. PLoS ONE 14: e0216886. doi:https://doi.org/10.1371/journal.pone.0216886
- Solomon, A. M., Kim, T. G., Han, K., Lee, H. Y., Patil, A., Siddique, M. I., Ahn J., and Kang, B. C. 2021. Fine mapping and candidate gene identification for the CapUp locus controlling fruit orientation in pepper (Capsicum spp.). Front. Plant Sci. 12: 1293. doi:https://doi.org/10.3389/fpls.2021.675474
- Song, B., Song, Y., Fu, Y., Kizito, E. B., Kamenya, S. N., Kabod, P. N., Liu, H., Muthemba, S., Kariba, R., Njuguna, J., Maina, S., Stomeo, F., Djikeng, A., Hendre, P. S., Chen, X., Chen, W., Li, X., Sun, W., Wang, S., Cheng, S., Muchugi, A., Jamnadass, R., Shapiro, H. Y., Van Deynze, A., Yang, H., Wang, J., Xu, X., Odeny, D. A., and Liu, X. 2019. Draft genome sequence of Solanum aethiopicum provides insights into disease resistance, drought tolerance, and the evolution of the genome. GigaScience 8: giz115. doi:https://doi.org/10.1093/gigascience/giz115
- Song, M. F., Zhang, M. G., Cheng, F., Wei, Q. Z., Wang, J., Davoudi, M., Chen, J. F., and Lou, Q. F. 2020. An irregularly striped rind mutant reveals new insight into the function of PG1β in cucumber (Cucumis sativus L.). Theor. Appl. Genet. 133: 371–382. doi:https://doi.org/10.1007/s00122-019-03468-0
- Stall, R. E., and Walter, J. M. 1965. Selection and inheritance of resistance in tomato to isolates of races 1 and 2 of the Fusarium wilt organism. Phytopathology 55: 1213–1215.
- Stellari, G. M., Mazourek, M., and Jahn, M. M. 2010. Contrasting modes for loss of pungency between cultivated and wild species of Capsicum. Heredity 104: 460–471. doi:https://doi.org/10.1038/hdy.2009.131
- Stevens, M. A., and Rick, C. M. 1986. Genetics and Breeding. In The Tomato Crop; Atherton, J. G., and Rudich, J., Eds. Chapman and Hall: New York, NY, pp 35–109.
- Stevens, M. R., Lamb, E. M., and Rhoads, D. D. 1995. Mapping the Sw-5 locus for tomato spotted wilt virus resistance in tomatoes using RAPD and RFLP analyses. Theor. Appl. Genet. 90: 451–456. doi:https://doi.org/10.1007/BF00221989
- Stewart, C. Jr., Kang, B. C., Liu, K., Mazourek, M., Moore, S. L., Yoo, E. Y., Kim, B. D., Paran, I., and Jahn, M. M. 2005. The Pun1 gene for pungency in pepper encodes a putative acyltransferase. Plant J. 42: 675–688. doi:https://doi.org/10.1111/j.1365-313X.2005.02410.x
- Sthapit Kandel, J., Peng, H., Hayes, R. J., Mou, B., and Simko, I. 2020. Genome-wide association mapping reveals loci for shelf life and developmental rate of lettuce. Theor. Appl. Genet. 133: 1947–1966. doi:https://doi.org/10.1007/s00122-020-03568-2
- Sulli, M., Barchi, L., Toppino, L., Diretto, G., Sala, T., Lanteri, S., Rotino, G. L., and Giuliano, G. 2021. An eggplant recombinant inbred population allows the discovery of metabolic QTLs controlling fruit nutritional quality. Front. Plant Sci. 12: 638195. doi:https://doi.org/10.3389/fpls.2021.638195
- Sun, C., Mao, S. L., Zhang, Z. H., Palloix, A., Wang, L. H., and Zhang, B. X. 2015. Resistances to anthracnose (Colletotrichum acutatum) of Capsicum mature green and ripe fruit are controlled by a major dominant cluster of QTLs on chromosome P5. Sci. Hortic. 181: 81–88. doi:https://doi.org/10.1016/j.scienta.2014.10.033
- Sun, J. X., Xiao, T. T., Nie, J. T., Chen, Y., Lv, D., Pan, M., Gao, Q. F., Guo, C. L., Zhang, L., He, L., Lian, H., Pan, J., Cai, R., and Wang, G. 2019. Mapping and identification of CsUp, a gene encoding an auxilin-like protein, as a putative candidate gene for the upward pedicel mutation (up) in cucumber. BMC Plant Biol. 19: 157. doi:https://doi.org/10.1186/s12870-019-1772-4
- Sunseri, F., Sciancalepore, A., Martelli, G., Acciarri, N., Rotino, G. L., Valentino, D., and Tamietti, G. 2003. Development of RAPD-AFLP map of eggplant and improvement of tolerance to Verticillium wilt. Acta Hortic. 625: 107–115. doi:https://doi.org/10.17660/ActaHortic.2003.625.10
- Suwor, P., Sanitchon, J., Thummabenjapone, P., Kumar, S., and Techawongstien, S. 2017. Inheritance analysis of anthracnose resistance and marker-assisted selection in introgression populations of chili (Capsicum annuum L.). Sci. Hortic. 220: 20–26. doi:https://doi.org/10.1016/j.scienta.2017.03.032
- Swamy, B. N., Hedau, N. K., Chaudhari, G. V., Kant, L., and Pattanayak, A. 2017. CMS system and its stimulation in hybrid seed production of Capsicum annuum L. Sci. Hortic. 222: 175–179. doi:https://doi.org/10.1016/j.scienta.2017.05.023
- Taher, D., Solberg, S. Ø., Prohens, J., Chou, Y., Rakha, M., and Wu, T. 2017. World vegetable center eggplant collection: origin, composition, seed dissemination and utilization in breeding. Front. Plant Sci. 8: 1484. doi:https://doi.org/10.3389/fpls.2017.01484
- Tamisier, L., Szadkowski, M., Nemouchi, G., Lefebvre, V., Szadkowski, E., Duboscq, R., Santoni, S., Sarah, G., Sauvage, C., Palloix, A., and Moury, B. 2020. Genome-wide association mapping of QTLs implied in potato virus Y population sizes in pepper: evidence for widespread resistance QTL pyramiding. Mol. Plant Pathol. 21: 3–16. doi:https://doi.org/10.1111/mpp.12874
- Tanaka, Y., Hosokawa, M., Miwa, T., Watanabe, T., and Yazawa, S. 2010. Novel loss-of-function putative aminotransferase alleles cause biosynthesis of capsinoids, nonpungent capsaicinoid analogues, in mildly pungent chili peppers (Capsicum chinense). J. Agric. Food Chem. 58: 11762–11767. doi:https://doi.org/10.1021/jf1019642
- Tanksley, S. D. 1983. Molecular markers in plant breeding. Plant Mol. Biol. Rep. 1: 3–8. doi:https://doi.org/10.1007/BF02680255
- Tanksley, S. D. 1993. Mapping polygenes. Annu. Rev. Genet. 27: 205–233. doi:https://doi.org/10.1146/annurev.ge.27.120193.001225
- Tanksley, S. D., Ganal, M. W., Prince, J. P., de-Vicente, M. C., Bonierbale, M. W., Broun, P., Fulton, T. M., Giovannoni, J. J., Grandillo, S., Martin, G. B., Messeguer, R., Miller, J. C., Miller, L., Paterson, A. H., Pineda, O., Roder, M. S., Wing, R. A., Wu, W., and Young, N. D. 1992. High density molecular linkage maps of the tomato and potato genomes. Genetics 132: 1141–1160. doi:https://doi.org/10.1093/genetics/132.4.1141
- Tanksley, S.D. 1984. Linkage relationships and chromosomal locations of enzyme-coding genes in pepper, Capsicum annuum. Chromosoma 89: 352–360. doi:https://doi.org/10.1007/BF00331252
- Tautz, D. 1989. Hypervariability of simple sequences as a general source for polymorphic DNA markers. Nucleic Acids Res. 17: 6463–6471. doi:https://doi.org/10.1093/nar/17.16.6463
- Thabuis, A. P. P., Teekens, K. C., and Van Herwijnen, Z. O. 2013. Lettuce that is resistant to the lettuce aphid Nasonovia ribisnigri biotype 1. Rijk Zwaan Zaadteelt en Zaadhandel B.V. De Lier (NL), US 2013/0239250 A1.
- The Tomato Genome Consortium. 2012. The tomato genome sequence provides insights into fleshy fruit evolution. Nature 485: 635–641.
- Thomas, C. M., Jones, D. A., Parniske, M., Harrison, K., Kurti, P. J. B., Hatzixanthis, K., and Jones, J. D. G. 1997. Characterization of the tomato Cf-4 gene for resistance to Cladosporium fulvum ldentifies sequences that determine recognitional specificity in Cf-4 and Cf-9. Plant Cell 9: 2209–2224. doi:https://doi.org/10.2307/3870580
- Thornsberry, J. M., Goodman, M. M., Doebley, J., Kresovich, S., Nielsen, D., and Buckler, E. S. 2001. Dwarf8 polymorphisms associate with variation in flowering time. Nat. Genet. 28: 286–289. doi:https://doi.org/10.1038/90135
- Thorup, T. A., Tanyolac, B., Livingstone, K. D., Popovsky, S., Paran, I., and Jahn, M. 2000. Candidate gene analysis of organ pigmentation loci in the Solanaceae. Proc. Natl. Acad. Sci. U.S.A. 97: 11192–11197. doi:https://doi.org/10.1073/pnas.97.21.11192
- Tian, F., Bradbury, P. J., Brown, P. J., Hung, H., Sun, Q., Flint-Garcia, S., Rocheford, T. R., McMullen, M. D., Holland, J. B., and Buckler, E. S. 2011. Genome-wide association study of leaf architecture in the maize nested association mapping population. Nat. Genet. 43: 159–162. doi:https://doi.org/10.1038/ng.746
- Tian, G., Miao, H., Yang, Y. H., Zhou, J., Lu, H. W., Wang, Y., Xie, B. Y., Zhang, S. P., and Gu, X. F. 2016. Genetic analysis and fine mapping of Watermelon mosaic virus resistance gene in cucumber. Mol. Breed. 36: 131.
- Tian, G., Yang, Y. H., Zhang, S. P., Miao, H., Lu, H. W., Wang, Y., Xie, B. Y., and Gu, X. F. 2015. Genetic analysis and gene mapping of papaya ring spot virus resistance in cucumber. Mol. Breed. 35: 110.
- Tian, S. L., Li, L., Chai, W. G., Shah, S. N. M., and Gong, Z. H. 2014. Effects of silencing key genes in the capsanthin biosynthetic pathway on fruit color of detached pepper fruits. BMC Plant Biol. 14: 314. doi:https://doi.org/10.1186/s12870-014-0314-3
- Tigchelaar, E. C. 1986. Tomato breeding. In Breeding for Vegetable Crops; Bassett, M. J., Ed. AVI Publishing Co.: Westport, CT, pp 135–171.
- Toppino, L., Barchi, L., Lo Scalzo, R., Palazzolo, E., Francese, G., Fibiani, M., D'Alessandro, A., Papa, V., Laudicina, V. A., Sabatino, L., Pulcini, L., Sala, T., Acciarri, N., Portis, E., Lanteri, S., Mennella, G., and Rotino, G. L. 2016. Mapping quantitative trait loci affecting biochemical and morphological fruit properties in eggplant (Solanum melongena L.). Front. Plant Sci. 7: 256. doi:https://doi.org/10.3389/fpls.2016.00256
- Toppino, L., Barchi, L., Mercati, F., Acciarri, N., Perrone, D., Martina, M., Gattolin, S., Sala, T., Fadda, S., Mauceri, A., Ciriaci, T., Carimi, F., Portis, E., Sunseri, F., Lanteri, S., and Rotino, G. L. 2020. A New intra-specific and high-resolution genetic map of eggplant based on a RIL population, and location of QTLs related to plant anthocyanin pigmentation and seed vigour. Genes 11: 745. doi:https://doi.org/10.3390/genes11070745
- Toppino, L., Valè, G., and Rotino, G. L. 2008. Inheritance of Fusarium wilt resistance introgressed from Solanum aethiopicum Gilo and Aculeatum groups into cultivated eggplant (S. melongena) and development of associated PCR-based markers. Mol. Breed. 22: 237–250. doi:https://doi.org/10.1007/s11032-008-9170-x
- Truco, M. J., Antonise, R., Lavelle, D., Ochoa, O., Kozik, A., Witsenboer, H., Fort, S. B., Jeuken, M. J. W., Kesseli, R. V., Lindhout, P., Michelmore, R. W., and Peleman, J. 2007. A high-density, integrated genetic linkage map of lettuce (Lactuca spp.). Theor. Appl. Genet. 115: 735–746. doi:https://doi.org/10.1007/s00122-007-0599-9]
- Truco, M. J., Ashrafi, H., Kozik, A., Van Leeuwen, H., Bowers, J., Wo, S. R. C., Stoffel, K., Xu, H., Hill, T., and Van Deynze, A. 2013. An ultra-high-density, transcript-based, genetic map of lettuce. Genes Genom. Genet. 3: 617–631.
- Truco, M. J., Randall, L. B., Bloom, A. J., and St. Clair, D. A. 2000. Detection of QTL associated with shoot wilting and root ammonium uptake under chilling temperatures in an interspecific backcross population from Lycopersicon esculentum × L. hirsutum. Theor. Appl. Genet. 101: 1082–1092.
- Truong, H. T. H., Kim, K. T., Kim, S., Cho, M. C., Kim, H. R., and Woo, J. G. 2011. Development of gene-based markers for the Bs2 bacterial spot resistance gene for marker-assisted selection in pepper (Capsicum spp.). Hortic. Environ. Biotechnol. 52: 65–73. doi:https://doi.org/10.1007/s13580-011-0142-4
- Uncu, A. T., Celik, I., Devran, Z., Ozkaynak, E., Frary, A., Frary, A., and Doganlar, S. 2015. Development of a SNP-based CAPS assay for the Me1 gene conferring resistance to root knot nematode in pepper. Euphytica 206: 393–399. doi:https://doi.org/10.1007/s10681-015-1489-x
- USDA. 2012. National Nutrient Database for Standard Reference. http://ndb.nal.usda.gov
- USDA-ARS. 2020. FoodData Central 2020. https://fdc.nal.usda.gov
- USDA-NASS. 2016. Agricultural Statistics 2016. https://www.nass.usda.gov
- USDA-NASS. 2019. Vegetables 2018 summary. https://www.nass.usda.gov
- Uwimana, B., Smulders, M. J., Hooftman, D. A., Hartman, Y., van Tienderen, P. H., Jansen, J., McHale, L. K., Michelmore, R. W., Visser, R. G., and van de Wiel, C. C. 2012. Crop to wild introgression in lettuce: following the fate of crop genome segments in backcross populations. BMC Plant Biol. 12: 43. doi:https://doi.org/10.1186/1471-2229-12-43
- Vallejos, C. E., Jones, V., Stall, R. E., Jones, J. B., Minsavage, G. V., Schultz, D. C., Rodrigues, R., Olsen, L. E., and Mazourek, M. 2010. Characterization of two recessive genes controlling resistance to all races of bacterial spot in peppers. Theor. Appl. Genet. 121: 37–46. doi:https://doi.org/10.1007/s00122-010-1289-6
- Valpuesta, V. 2002. Fruit and Vegetable Biotechnology. Woodhead Publishing, UK.
- Van Stallen, N., Vandenbussche, B., Londers, E., Noten, V., and De Proft, M. 2005a. QTL analysis of important pith characteristics in a cross between two inbred lines of chicory (Cichorium intybus var. foliosum): a preliminary study. Plant Breed. 124: 54–58. doi:https://doi.org/10.1111/j.1439-0523.2005.00955.x
- Van Stallen, N., Vandenbussche, B., Londers, E., Noten, V., and De Proft, M. 2005b. QTL analysis of production and taste characteristics of chicory (Cichorium intybus var. foliosum). Plant Breed. 124: 59–62. doi:https://doi.org/10.1111/j.1439-0523.2004.01043.x
- van Treuren, R., de Groot, L., Hisoriev, H., Khassanov, F., Farzaliyev, V., Melyan, G., Gabrielyan, I., van Soest, L., Tulmans, C., Courand, D., de Visser, J., Kimura, R., Boshoven, J. C., Kanda, T., Goossens, R., Verhoef, M., Dijkstra, J., and Kik, C. 2020. Acquisition and regeneration of Spinacia turkestanica Iljin and S. tetrandra Steven ex M. Bieb. to improve a spinach gene bank collection. Genet. Resour. Crop Evol. 67: 549–559. doi:https://doi.org/10.1007/s10722-019-00792-8
- Venkatesh, J., An, J., Kang, W. H., Jahn, M., and Kang, B. C. 2018. Fine mapping of the dominant potyvirus resistance gene Pvr7 reveals a relationship with Pvr4 in Capsicum annuum. Phytopathology 108: 142–148. doi:https://doi.org/10.1094/PHYTO-07-17-0231-R
- Verlaan, M. G., Hutton, S. F., Ibrahem, R. M., Kormelink, R., Visser, R. G. F., Scott, J. W., Edwards, J. D., and Bai, Y. 2013. The tomato yellow leaf curl virus resistance genes Ty-1 and Ty-3 are allelic and code for DFDGD-class RNA-dependent RNA polymerases. PLoS Genet. 9: e1003399. doi:https://doi.org/10.1371/journal.pgen.1003399
- Verwaaijen, B., Wibberg, D., Nelkner, J., Gordin, M., Rupp, O., Winkler, A., Bremges, A., Blom, J., Grosch, R., Pühler, A., and Schlüter, A. 2018. Assembly of the Lactuca sativa, L. cv. Tizian draft genome sequence reveals differences within major resistance complex 1 as compared to the cv. Salinas reference genome. J. Biotechnol. 267: 12–18. doi:https://doi.org/10.1016/j.jbiotec.2017.12.021
- Verwaaijen, B., Wibberg, D., Winkler, A., Zrenner, R., Bednarz, H., Niehaus, K., Grosch, R., Pühler, A., and Schlüter, A. 2019. A comprehensive analysis of the Lactuca sativa, L. transcriptome during different stages of the compatible interaction with Rhizoctonia solani. Sci. Rep. 9: 7221. doi:https://doi.org/10.1038/s41598-019-43706-5
- Vinson, J., Hao, Y., Su, X., and Zubik, L. 1998. Phenol antioxidant quantity and quality in foods: vegetables. J. Agric. Food Chem. 46: 3630–3634. doi:https://doi.org/10.1021/jf980295o
- Voorrips, R. E., Finkers, R., Sanjaya, L., and Groenwold, R. 2004. QTL mapping of anthracnose (Colletotrichum spp.) resistance in a cross between Capsicum annuum and C. chinense. Theor. Appl. Genet. 109: 1275–1282. doi:https://doi.org/10.1007/s00122-004-1738-1
- Vos, P., Hogers, R., Bleeker, M., Reijans, M., van de Lee, T., Hornes, M., Frijters, A., Pot, J., Peleman, J., Kuiper, M., and Zabeau, M. 1995. AFLP: a new technique for DNA fingerprinting. Nucleic Acids Res. 23: 4407–4414. doi:https://doi.org/10.1093/nar/23.21.4407
- Vrebalov, J., Ruezinsky, D. M., Padmanabhan, V., White, R., Medrano, D., Drake, R., Schuch, W., and Giovannoni, J. 2002. A MADS-box gene necessary for fruit ripening at the tomato ripening-inhibitor (rin) locus. Science 296: 343–346. doi:https://doi.org/10.1126/science.1068181
- Wai, K. P. P., Siddique, M. I., Mo, H. S., Yoo, H. J., Byeon, S. E., Jegal, Y., Mekuriaw, A. A., and Kim, B. S. 2015. Pathotypes of bacterial spot pathogen infecting Capsicum peppers in Korea. Plant Pathol. J. 31: 428–432. doi:https://doi.org/10.5423/PPJ.NT.05.2015.0074
- Walley, P. G., Hough, G., Moore, J. D., Carder, J., Elliott, M., Mead, A., Jones, J., Teakle, G., Barker, G., Buchanan-Wollaston, V., Hand, P., Pink, D., and Collier, R. 2017. Towards new sources of resistance to the currant-lettuce aphid (Nasonovia ribisnigri). Mol. Breed. 37: 4. doi:https://doi.org/10.1007/s11032-016-0606-4
- Wang, D., and Bosland, P. W. 2006. The genes of Capsicum. HortScience 41: 1169–1187. doi:https://doi.org/10.21273/HORTSCI.41.5.1169
- Wang, H., Zhou, P., Zhu, W., and Wang, F. 2019a. De novo comparative transcriptome analysis of genes differentially expressed in the scion of homografted and heterografted tomato seedlings. Sci. Rep. 9: 20240.
- Wang, J. F., Stall, R. E., and Vallejos, C. E. 1994. Genetic analysis of a complex hypersensitive reaction to bacterial spot in tomato. Phytopathology 84: 126–132. doi:https://doi.org/10.1094/Phyto-84-126
- Wang, L. H., Gu, X. H., Hua, M., Mao, S., Zhang, Z., Peng, D. L., Yun, X., and Zhang, B. X. 2009. A SCAR marker linked to the N gene for resistance to root knot nematodes (Meloidogyne spp.) in pepper (Capsicum annuum L.). Sci. Hortic. 122: 318–322. doi:https://doi.org/10.1016/j.scienta.2009.04.011
- Wang, M., Liu, W. R., Jiang, B., Peng, Q. W., He, X. M., Liang, Z., and Lin, Y. 2019b. Genetic analysis and related gene primary mapping of heat stress tolerance in cucumber using bulked segregant analysis. HortScience 54: 423–428. doi:https://doi.org/10.21273/HORTSCI13734-18
- Wang, S. H., Li, H. B., Li, Y. Y., Li, Z., Qi, J. J., Lin, T., Yang, X. Y., Zhang, Z. H., and Huang, S. W. 2020a. FLOWERING LOCUS T improves cucumber adaptation to higher latitudes. Plant Physiol. 182: 908–918. doi:https://doi.org/10.1104/pp.19.01215
- Wang, X. F., Li, H., Gao, Z. H., Wang, L. N., and Ren, Z. H. 2020b. Localization of quantitative trait loci for cucumber fruit shape by a population of chromosome segment substitution lines. Sci. Rep. 10: 11030. doi:https://doi.org/10.1038/s41598-020-68312-8
- Wang, X., Bao, K., Reddy, U. K., Bai, Y., Hammar, S. A., Jiao, C., Wehner, T. C., Ramírez-Madera, A. O., Weng, Y., Grumet, R., and Fei, Z. 2018a. The USDA cucumber (Cucumis sativus L.) collection: genetic diversity, population structure, genome-wide association studies, and core collection development. Hortic. Res. 5: 64. doi:https://doi.org/10.1038/s41438-018-0080-8
- Wang, X., Fazari, A., Cao, Y., Zhang, Z., Palloix, A., Mao, S., Zhang, B., Djian-Caporalino, C., and Wang, L. 2018b. Fine mapping of the root-knot nematode resistance gene Me1 in pepper (Capsicum annuum L.) and development of markers tightly linked to Me1. Mol. Breed. 38: 39.
- Wang, Y. H., Bo, K. L., Gu, X., Pan, J., Li, Y. H., Chen, J. F., Wen, C. L., Ren, Z. H., Ren, H. Z., Chen, X. H., Grumet, R., and Weng, Y. 2019c. Molecularly tagged genes and quantitative trait loci in cucumber with recommendations for QTL nomenclature. Hortic. Res. 7: 3.
- Wang, Y. H., Jiang, B., Dymerski, R. D., Xu, X. W., and Weng, Y. 2021. Quantitative trait loci for horticulturally important traits defining the Sikkim cucumber, Cucumis sativus var. sikkimensis. Theor. Appl. Genet. 134: 229–247. doi:https://doi.org/10.1007/s00122-020-03693-y
- Wang, Y. H., Tan, J. Y., Wu, Z.M., VandenLangenberg, K., Wehner, T. C., Wen, C. L., Zheng, X. Y., Owens, K., Thornton, A., Bang, H. H., Hoeft, E., Kraan, P. A. G., Suelmann, J., Pan, J. S., and Weng, Y. 2019d. STAYGREEN, STAY HEALTHY: a loss-of-susceptibility mutation in the STAYGREEN gene provides durable, broad-spectrum disease resistances for over 50 years of US cucumber production. New Phytol. 221: 415–430. doi:https://doi.org/10.1111/nph.15353
- Wang, Y. H., VandenLangenberg, K., Wehner, T. C., Kraan, P. A. G., Suelmann, J., Zheng, X. Y., Owens, K., and Weng, Y. 2016b. QTL mapping for downy mildew resistance in cucumber inbred line WI7120 (PI 330628). Theor. Appl. Genet. 129: 1493–1505. doi:https://doi.org/10.1007/s00122-016-2719-x
- Wang, Y., Lu, H., and Hu, J. 2016a. Molecular mapping of high resistance to bacterial leaf spot in lettuce PI 358001-1. Phytopathology 106: 1319–1325. doi:https://doi.org/10.1094/PHYTO-09-15-0238-R
- Wang, Y., VandenLangenberg, K., Wen, C., Wehner, T. C., and Weng, Y. 2018c. QTL mapping of downy and powdery mildew resistances in PI 197088 cucumber with genotyping-by-sequencing in RIL population. Theor. Appl. Genet. 131: 597–611. doi:https://doi.org/10.1007/s00122-017-3022-1
- Waycott, W., Fort, S., Ryder, E., and Michelmore, R. W. 1999. Mapping morphological genes relative to molecular markers in lettuce (Lactuca sativa L.). Heredity 82: 245–251. doi:https://doi.org/10.1038/sj.hdy.6884730
- Wehner, T. C. 1989. Breeding for improved yield in cucumber. Plant Breed. Rev. 6: 323–359.
- Wei, Q., Wang, W., Hu, T., Hu, H., Wang, J., and Bao, C. 2020. Construction of a SNP-based genetic map using SLAF-Seq and QTL analysis of morphological traits in eggplant. Front. Genet. 11: 178. doi:https://doi.org/10.3389/fgene.2020.00178
- Wei, T., van Treuren, R., Liu, X., Zhang, Z., Chen, J., Liu, Y., Dong, S., Sun, P., Yang, T., Lan, T., Wang, X., Xiong, Z., Liu, Y., Wei, J., Lu, H., Han, S., Chen, J. C., Ni, X., Wang, J., Yang, H., Xu, X., Kuang, H., van Hintum, T., Liu, X., and Liu, H. 2021. Whole-genome resequencing of 445 Lactuca accessions reveals the domestication history of cultivated lettuce. Nat. Genet. 53: 752–760. doi:https://doi.org/10.1038/s41588-021-00831-0
- Wen, C. L., Mao, A. J., Dong, C. J., Liu, H. Y., Yu, S. C., Guo, Y. D., Weng, Y., and Xu, Y. 2015. Fine genetic mapping of target leaf spot resistance gene cca-3 in cucumber, Cucumis sativus L. Theor. Appl. Genet. 128: 2495–2506. doi:https://doi.org/10.1007/s00122-015-2604-z
- Wen, C. L., Zhao, W. C., Liu, W. L., Yang, L. M., Wang, Y. H., Liu, X. W., Xu, Y., Ren, H., Guo, Y., Li, C., Li, J., Weng, Y., and Zhang, X. L. 2019a. CsTFL1 inhibits determinate growth and terminal flower formation through interaction with CsNOT2a in cucumber. Development 146: dev180166.
- Wen, J., Jiang, F., Weng, Y., Sun, M., Shi, X., Zhou, Y., Yu, L., and Wu, Z. 2019b. Identification of heat-tolerance QTLs and high-temperature stress-responsive genes through conventional QTL mapping, QTL-seq and RNA-seq in tomato. BMC Plant Biol. 19: 398. doi:https://doi.org/10.1186/s12870-019-2008-3
- Weng, Y. 2016. The cucumber genome. In Genetics and Genomics of Cucurbitaceae, Plant Genetics and Genomics: Crops and Models; Grumet, R., and Garcia-Mas, J. Eds. Springer, pp 183–198.
- Weng, Y. 2021. Cucumis sativus: chromosome evolution, domestication, and genetic diversity: implications for cucumber breeding. Plant Breed. Rev. 49: 77–111.
- Weng, Y., and Sun, Z. Y. 2011. Major Cucurbit crops. In Genetics, Genomics and Breeding of Cucurbits; Wang, Y. H., Behera, T. K., and Kole, C., Eds. CRC Press: Boca Raton, FL, pp 1–15.
- Weng, Y., and Wehner, T. C. 2017. Cucumber gene catalogue. Cucurbit Genet. Coop. Issues (34–35). https://www.ars.usda.gov/southeast-area/charleston-sc/vegetable-research/docs/cgc/
- Williams, J. G., Kubelik, A. R., Livak, K. J., Rafalski, J. A., and Tingey, S. V. 1990. DNA polymorphisms amplified by arbitrary primers are useful as genetic markers. Nucleic Acids Res. 18: 6531–6535. doi:https://doi.org/10.1093/nar/18.22.6531
- Wóycicki, R., Witkowicz, J., Gawroński, P., Dąbrowska, J., Lomsadze, A., Pawełkowicz, M., Siedlecka, E., Agi, K., Pląder, W., Seroczyńska, A., Śmiech, M., Gutman, W., Niemirowicz-Szczytt, K., Bartoszewski, G., Tagashira, N., Hoshi, Y., Borodovsky, M., Karpiński, S., Malepszy, S., and Przybecki, Z. 2011. The genome sequence of the North-European cucumber (Cucumis sativus L.) unravels evolutionary adaptation mechanisms in plants. PLoS ONE 6: e22728. doi:https://doi.org/10.1371/journal.pone.0022728
- Wroblewski, T., Piskurewicz, U., Tomczak, A., Ochoa, O., and Michelmore, R. W. 2007. Silencing of the major family of NBS-LRR-encoding genes in lettuce results in the loss of multiple resistance specificities . Plant J. 51: 803–818. doi:https://doi.org/10.1111/j.1365-313X.2007.03182.x
- Wu, F., Eannetta, N. T., Xu, Y., and Tanksley, S. D. 2009. A detailed synteny map of the eggplant genome based on conserved ortholog set II (COSII) markers. Theor. Appl. Genet. 118: 927–935. doi:https://doi.org/10.1007/s00122-008-0950-9
- Xi’ou, X., Bihao, C., Guannan, L., Jianjun, L., Qinghua, C., Jin, J., and Yujing, C. 2015. Functional characterization of a putative bacterial wilt resistance gene (RE-bw) in eggplant. Plant Mol. Biol. Rep. 33: 1058–1073. doi:https://doi.org/10.1007/s11105-014-0814-1
- Xie, L., Klein, P., Crosby, K., and Jifon, J. 2019. A genotyping-by-sequencing single nucleotide polymorphism–based map and genetic analysis of root traits in an interspecific tomato population. J. Am. Soc. Hort. Sci. 144: 394–404. doi:https://doi.org/10.21273/JASHS04565-19
- Xu, C., Jiao, C., Sun, H., Cai, X., Wang, X., Ge, C., Zheng, Y., Liu, W., Sun, X., Xu, Y., Deng, J., Zhang, Z., Huang, S., Dai, S., Mou, B., Wang, Q., Fei, Z., and Wang, Q. 2017a. Draft genome of spinach and transcriptome diversity of 120 Spinacia accessions. Nat. Commun. 8: 15275. doi:https://doi.org/10.1038/ncomms15275
- Xu, C., Jiao, C., Zheng, Y., Sun, H., Liu, W., Cai, X., Wang, X., Liu, S., Xu, Y., Mou, B., Dai, S., Fei, Z., and Wang, Q. 2015. De novo and comparative transcriptome analysis of cultivated and wild spinach. Sci. Rep. 5: 17706.
- Xu, J., Driedonks, N., Rutten, M. J. M., Vriezen, W. H., de Boer, G. J., and Rieu, I. 2017b. Mapping quantitative trait loci for heat tolerance of reproductive traits in tomato (Solanum lycopersicum). Mol. Breed. 37: 58. doi:https://doi.org/10.1007/s11032-017-0664-2
- Xu, X., Chao, J., Cheng, X., Wang, R., Sun, B., Wang, H., Luo, S., Xu, X., Wu, T., and Li, Y. 2016a. Mapping of a novel race specific resistance gene to Phytophthora root rot of pepper (Capsicum annuum) using bulked segregant analysis combined with specific length amplified fragment sequencing strategy. PLoS ONE 11: e0151401. doi:https://doi.org/10.1371/journal.pone.0151401
- Xu, X., Yu, T., Xu, R., Shi, Y., Lin, X., Xu, Q., Qi, X., Weng, Y., and Chen, X. 2016b. Fine mapping of a dominantly inherited powdery mildew resistance major-effect QTL, Pm1.1, in cucumber identifies a 41.1 kb region containing two tandemly arrayed cysteine-rich receptor-like protein kinase genes. Theor. Appl. Genet. 129: 507–516. doi:https://doi.org/10.1007/s00122-015-2644-4
- Yaghoobi, J., Yates, J. L., and Williamson, V. M. 2005. Fine mapping of the nematode resistance gene Mi-3 in Solanum peruvianum and construction of a S. lycopersicum DNA contig spanning the locus. Mol. Genet. Genomics 274: 60–69. doi:https://doi.org/10.1007/s00438-005-1149-2
- Yamamoto, K., Oda, Y., Haseda, A., Fujito, S., Mikami, T., and Onodera, Y. 2014. Molecular evidence that the genes for dioecism and monoecism in Spinacia oleracea L. are located at different loci in a chromosomal region. Heredity 112: 317–324. doi:https://doi.org/10.1038/hdy.2013.112
- Yang, H. B., Liu, W. Y., Kang, W. H., Jahn, M., and Kang, B. C. 2009. Development of SNP markers linked to the L locus in Capsicum spp. by a comparative genetic analysis. Mol. Breed. 24: 433–446. doi:https://doi.org/10.1007/s11032-009-9304-9
- Yang, L. M., Koo, D. H., Li, D. W., Zhang, T., Jiang, J. M., Luan, F. S., Renner, S. S., Hénaff, E., Sanseverino, W., Garcia-Mas, J., Casacuberta, J., Senalik, D. A., Simon, P. W., Chen, J., and Weng, Y. 2014. Next-generation sequencing, FISH mapping and synteny-based modeling reveal mechanisms of decreasing dysploidy in Cucumis. Plant J. 77: 16–30. doi:https://doi.org/10.1111/tpj.12355
- Yang, L. M., Li, D. W., Li, Y. H., Gu, X. F., Huang, S. W., Garcia-Mas, J., and Weng, Y. 2013. A 1,681-locus consensus genetic map of cultivated cucumber including 67 NB-LRR resistance gene homolog and ten gene loci. BMC Plant Biol. 13: 53. doi:https://doi.org/10.1186/1471-2229-13-53
- Yang, L., Koo, D. H., Li, Y., Zhang, X., Luan, F., Havey, M. J., Jiang, J., and Weng, Y. 2012. Chromosome rearrangements during domestication of cucumber as revealed by high-density genetic mapping and draft genome assembly. Plant J. 71: 895–906. doi:https://doi.org/10.1111/j.1365-313X.2012.05017.x
- Yang, W., and Francis, D. M. 2005. Marker-assisted selection for combining resistance to bacterial spot and bacterial speck in tomato. JASHS 130: 716–721. doi:https://doi.org/10.21273/JASHS.130.5.716
- Yang, X., Guo, X., Yang, Y., Ye, P., Xiong, X., Liu, J., and Dong, D.L. G. 2018a. Gene profiling in late blight resistance in potato genotype SD20. Int. J. Mol. Sci. 19: 1729.
- Yang, Y., Bao, S., Zhou, X., Liu, J., and Zhuang, Y. 2018b. The key genes and pathways related to male sterility of eggplant revealed by comparative transcriptome analysis. BMC Plant Biol. 18: 209. doi:https://doi.org/10.1186/s12870-018-1430-2
- Yao, M., Li, N., Wang, F., and Ye, Z. 2013. Genetic analysis and identification of QTLs for resistance to cucumber mosaic virus in chili pepper (Capsicum annuum L.). Euphytica 193: 135–145. doi:https://doi.org/10.1007/s10681-013-0953-8
- Yarnes, S. C., Ashrafi, H., Reyes-Chin-Wo, S., Hill, T. A., Stoffel, K. M., and Van Deynze, A. 2013. Identification of QTLs for capsaicinoids, fruit quality, and plant architecture-related traits in an interspecific Capsicum RIL population. Genome 56: 61–74. doi:https://doi.org/10.1139/gen-2012-0083
- Yeam, I., Kang, B. C., Lindeman, W., Frantz, J. D., Faber, N., and Jahn, M. M. 2005. Allele-specific CAPS markers based on point mutations in resistance alleles at the pvr1 locus encoding eIF4E in Capsicum. Theor. Appl. Genet. 112: 178–186. doi:https://doi.org/10.1007/s00122-005-0120-2
- Yoon, J. B., Yang, D. C., Do, J. W., and Park, H. G. 2006. Overcoming two post-fertilization genetic barriers in Interspecific hybridization between Capsicum annuum and C. baccatum for introgression of anthracnose resistance. Breed. Sci. 56: 31–38. doi:https://doi.org/10.1270/jsbbs.56.31
- Yosefi, Z., Tabaraki, R., Gharneh, H. A. A., and Mehrabi, A. A. 2010. Variation in antioxidant activity, total phenolics, and nitrate in spinach. Int. J. Veg. Sci. 16: 233–242. doi:https://doi.org/10.1080/19315260903577278
- Yu, Z. H., Wang, J. F., Stall, R. E., and Vallejos, C. E. 1995. Genomic localization of tomato genes that control a hypersensitive reaction to Xanthomonas campestris pv. vesicatoria (Doidge) dye. Genetics 141: 675–682. doi:https://doi.org/10.1093/genetics/141.2.675
- Zabeau, M., and Vos, P. 1993. Selective restriction fragment amplification: a general method for DNA fingerprinting. European Patent Application no. 92402629.
- Zamir, D., Ekstein-Michelson, I., Zakay, U., Navot, N., Zeidan, M., Sarfatti, M., Eshed, Y., Harel, E., Pleban, T., van-Oss, H., Kedar, N., Rabinowitch, H. D., and Czosnek, H. 1994. Mapping and introgression of a tomato yellow leaf curl virus tolerance gene, Ty-1. Theor. Appl. Genet. 88: 141–146. doi:https://doi.org/10.1007/BF00225889
- Zewdie, Y., Tong, N., and Bosland, P. 2004. Establishing a core collection of Capsicum using a cluster analysis with enlightened selection of accessions. Genet. Resour. Crop Evol. 51: 147–151. doi:https://doi.org/10.1023/B:GRES.0000020858.96226.38
- Zhang, C. Y., Anarjan, M. B., Win, K. T., Begum, S., and Lee, S. 2021. QTL-Seq analysis of powdery mildew resistance in a Korean cucumber inbred line. Theor. Appl. Genet. 134: 435–451. doi:https://doi.org/10.1007/s00122-020-03705-x
- Zhang, C., Liu, L., Wang, X., Vossen, J., Li, G., Li, T., Zheng, Z., Gao, J., Guo, Y., Visser, R. G. F., Li, J., Bai, Y., and Du, Y. 2014a. The Ph-3 gene from Solanum pimpinellifolium encodes CC-NBS-LRR protein conferring resistance to Phytophthora infestans. Theor. Appl. Genet. 127: 1353–1364. doi:https://doi.org/10.1007/s00122-014-2303-1
- Zhang, F. Z., Wagstaff, C., Rae, A. M., Sihota, A. K., Keevil, C. W., Rothwell, S. D., Clarkson, G. J. J., Michelmore, R. W., Truco, M. J., Dixon, M. S., and Taylor, G. 2007. QTLs for shelf life in lettuce co-locate with those for leaf biophysical properties but not with those for leaf developmental traits. J. Exp. Bot. 58: 1433–1449. doi:https://doi.org/10.1093/jxb/erm006
- Zhang, H., Si, X., Ji, X., Fan, R., Liu, J., Chen, K., Wang, D., and Gao, C. 2018a. Genome editing of upstream open reading frames enables translational control in plants. Nat. Biotechnol. 36: 894–898. doi:https://doi.org/10.1038/nbt.4202
- Zhang, J., and Dilip, P. R. 2021. Development of codominant SCAR markers to detect the Pto, Tm2-2, I3 and Sw5 genes in tomato (Solanum lycopersicum). Plant Breed. 140: 342–348. doi:https://doi.org/10.1111/pbr.12902
- Zhang, J., Yang, J., Yang, Y., Luo, J., Zheng, X. Y., Wen, C. L., and Xu, Y. 2019. Transcription factor CsWIN1 regulates pericarp wax biosynthesis in cucumber grafted on pumpkin. Front. Plant Sci. 10: 1564. doi:https://doi.org/10.3389/fpls.2019.01564
- Zhang, J., Zhao, J., Liang, Y., and Zou, Z. 2016. Genome-wide association-mapping for fruit quality traits in tomato. Euphytica 207: 439–451. doi:https://doi.org/10.1007/s10681-015-1567-0
- Zhang, J., Zhao, J., Xu, Y., Liang, J., Chang, P., Yan, F., Li, M., Liang, Y., and Zou, Z. 2015. Genome-wide association mapping for tomato volatiles positively contributing to tomato flavor. Front. Plant Sci. 6: 1042. doi:https://doi.org/10.3389/fpls.2015.01042
- Zhang, K. J., Wei, Y. F., Njogu, M. K., Wang, X., Lou, Q. F., Li, J., and Chen, J. F. 2020a. Genetic mapping of angular leaf spot resistance to Pseudomonas syringae pv. lachrymans in a Cucumis hystrix introgression line of cucumber. Euphytica 215: 176. doi:https://doi.org/10.1007/s10681-019-2497-z
- Zhang, K., Wang, X., Zhu, W., Qin, X., Xu, J., Cheng, C., Lou, Q., Li, J., and Chen, J. 2018b. Complete resistance to powdery mildew and partial resistance to downy mildew in a Cucumis hystrix introgression line of cucumber were controlled by a co-localized locus. Theor. Appl. Genet. 131: 2229–2243.
- Zhang, L. P., Khan, A., Niño-Liu, D., and Foolad, M. R. 2002. A molecular linkage map of tomato displaying chromosomal locations of resistance gene analogs based on a Lycopersicon esculentum x L. hirsutum cross. Genome 45: 133–146. doi:https://doi.org/10.1139/g01-124
- Zhang, L., Su, W., Tao, R., Zhang, W., Chen, J., Wu, P., Yan, C., Jia, Y., Larkin, R. M., Lavelle, D., Truco, M. J., Reyes Chin-Wo, S., Michelmore, R. W., and Kuang, H. 2017. RNA sequencing provides insights into the evolution of lettuce and the regulation of flavonoid biosynthesis. Nat. Commun. 8: 2264. doi:https://doi.org/10.1038/s41467-017-02445-9
- Zhang, N. W., Lindhout, P., Niks, R. E., and Jeuken, M. J. W. 2009a. Genetic dissection of Lactuca saligna nonhost resistance to downy mildew at various lettuce developmental stages. Plant Pathol. 58: 923–932. doi:https://doi.org/10.1111/j.1365-3059.2009.02066.x
- Zhang, N. W., Pelgrom, K., Niks, R. E., Visser, R. G. F., and Jeuken, M. J. W. 2009b. Three combined quantitative trait loci from nonhost Lactuca saligna are sufficient to provide complete resistance of lettuce against Bremia lactucae. Mol. Plant Microbe Interact. 22: 1160–1168. doi:https://doi.org/10.1094/MPMI-22-9-1160
- Zhang, S. P., Miao, H., Yang, Y. H., Xie, B. Y., Wang, Y., and Gu, X. F. 2014b. A major quantitative trait locus conferring resistance to fusarium wilt was detected in cucumber by using recombinant inbred lines. Mol. Breed. 34: 1805–1815. doi:https://doi.org/10.1007/s11032-014-0140-1
- Zhang, Y., and Stommel, J. R. 2000. RAPD and AFLP tagging and mapping of Beta (B) and Beta modifier (MoB), two genes which influence beta-carotene accumulation in fruit of tomato (Lycopersicon esculentum Mill.). Theor. Appl. Genet. 100: 368–375.
- Zhang, Z., Wang, B. W., Wang, S. H., Lin, T., Yang, L., Zhao, Z., Zhang, Z. H., Huang, S., and Yang, X.Y. 2020b. Genome-wide target mapping shows histone deacetylase complex1 regulates cell proliferation in cucumber fruit. Plant Physiol. 182: 167–184. doi:https://doi.org/10.1104/pp.19.00532
- Zhao, J., Sauvage, C., Zhao, J., Bitton, F., Bauchet, G., Liu, D., Huang, S., Tieman, D. M., Klee, H. J., and Causse, M. 2019. Meta-analysis of genome-wide association studies provides insights into genetic control of tomato flavor. Nat. Commun. 10: 1534. doi:https://doi.org/10.1038/s41467-019-09462-w
- Zhao, Y., Liu, Y., Zhang, Z., Cao, Y., Yu, H., Ma, W., Zhang, B., Wang, R., Gao, J., and Wang, L. 2020. Fine mapping of the major anthracnose resistance QTL AnRGO5 in Capsicum chinense ‘PBC932’. BMC Plant Biol. 20: 189. doi:https://doi.org/10.1186/s12870-019-2115-1
- Zhi, X., Shu, J., Zheng, Z., Li, T., Sun, X., Bai, J., Cui, Y., Wang, X., Huang, Z., Guo, Y., Du, Y., Yang, Y., Liu, L., and Li, J. 2021. Fine mapping of the Ph-2 gene conferring resistance to late blight (Phytophthora infestans) in tomato. Plant Dis. 105: 851–858. doi:https://doi.org/10.1094/PDIS-03-19-0679-RE
- Zhou, H., Zhang, P., Luo, J., Liu, X., Fan, S., Liu, C., and Han, Y. 2019. The establishment of a DNA fingerprinting database for 73 varieties of Lactuca sativa capitate L. using SSR molecular markers. Hortic. Environ. Biotechnol. 60: 95–103. doi:https://doi.org/10.1007/s13580-018-0102-3
- Zhou, Q., Li, S., Miao, H., Zhang, S., Wang, Y., Weng, Y., Zhang, Z., Huang, S., and., and Gu, X. F. 2015. A sequencing-based linkage map of cucumber. Mol. Plant. 8: 961–963. doi:https://doi.org/10.1016/j.molp.2015.03.008
- Zohary, D. 1991. The wild genetic resources of cultivated lettuce (Lactuca sativa L.). Euphytica 53: 31–35. doi:https://doi.org/10.1007/BF00032029
- Zsögön, A., Čermák, T., Naves, E. R., Notini, M. M., Edel, K. H., Weinl, S., Freschi, L., Voytas, D. F., Kudla, J., and Peres, L. E. P. 2018. De novo domestication of wild tomato using genome editing. Nat. Biotechnol. 36: 1211–1216. doi:https://doi.org/10.1038/nbt.4272
- Zygier, S., Chaim, A. B., Efrati, A., Kaluzky, G., Borovsky, Y., and Paran, I. 2005. QTLs mapping for fruit size and shape in chromosomes 2 and 4 in pepper and a comparison of the pepper QTL map with that of tomato. Theor. Appl. Genet. 111: 437–445. doi:https://doi.org/10.1007/s00122-005-2015-7