ABSTRACT
K-RAS mutation is being developed as a cancer biomarker and tumor K-RAS is being used to predict therapeutic response. Yet, levels of K-RAS mutation in normal and pathological tissue samples have not been determined rigorously, nor inter-individual variation in these levels characterized. Therefore, K-RAS codon 12 GAT and GTT mutant fractions were measured in colonic mucosa of individuals without colon cancer, tumor-distal mucosa, tumor-proximal mucosa, normal tumor-adjacent tissues, colonic adenomas, and carcinomas. The results indicate K-RAS codon 12 GAT mutation is present at measurable levels in normal appearing mucosa. All tumors carried K-RAS mutation, in most cases as a mutant subpopulation.
INTRODUCTION
The use of K-RAS mutations as potential biomarkers of cancer risk, particularly colon cancer risk, has been intensely investigated. The detection of K-RAS mutation has been investigated as a cancer screening approach using plasma and stool DNA samples (Citation1–4). The detection of the K-RAS codon 12 GTT mutation in colon tumors has been associated with poor prognosis (Citation5–7). More recently, detection of K-RAS mutation in a patient's tumor is being used in selecting a therapeutic approach (Citation8, 9). Specifically, patients with metastatic colon cancer or non-small cell lung cancer, whose tumors carry a K-RAS mutation, fail to respond to therapies directed against the epidermal growth factor receptor (e.g., gefitinib, erlotinib, cetuximab, and panitumumab) (Citation8).
Despite broad interest in using K-RAS mutation as a cancer biomarker, generally, K-RAS mutation has not been evaluated in a quantitative manner. Most studies describing investigations of K-RAS mutation report the prevalence of K-RAS mutation (i.e., employ plus/minus scoring for mutation and report number of mutation positive samples relative to the total number of samples analyzed) (Citation10–14). In addition, some studies investigating K-RAS as a potential cancer screening biomarker describe an apparent lack of specificity, as individuals without colon cancer may produce positive results (Citation15–17).
Using an allele-specific PCR, Zhang et al. (Citation10) reported the detection of K-RAS mutation in colon tumors and tumor-adjacent mucosa, but K-RAS was not detected in normal mucosa. Using mutant allele-specific PCR, Yamada et al. (Citation18) reported the detection of K-RAS mutation in tumors and normal colon from colon cancer patients, but the absence of mutation in the colonic mucosa of subjects without colon cancer. Using an enriched PCR method with a sensitivity of 10−4, Ronai et al. (Citation12) detected K-RAS mutation in 14/42 (33%) tumors, 2/13 (Citation15%) tumor distant mucosa samples, and 1/11 (9%) mucosa samples from control subjects. Using a combination of mutant allele enrichment and denaturing gradient gel electrophoresis with a sensitivity of 10−4 to 10−5, Zhu et al. (Citation13) detected K-RAS mutation in 22/22 (100%) tumors (including one tumor with two different K-RAS mutations), in 7/13 (54%) tumor-adjacent mucosa samples (including detection of multiple K-RAS mutations), in 0/13 (0%) tumor-distant mucosa samples, and 0/4 (0%) mucosa samples from control subjects. Using a PCR-restriction fragment length polymorphism (PCR-RFLP) approach, Kraus et al. (Citation14) detected K-RAS mutation in 21/144 (15%) mucosa samples, 20/22 (91%) polyps, and 34/84 (40%) tumor samples.
A study by Dieterle et al. (Citation19) is the only study that attempted to describe the levels of K-RAS mutation. They used a semi-quantitative PCR-RFLP method with a sensitivity of 10−3 to categorize levels of mutation in tumors and colonic mucosa as having mutant:wild-type ratios of 0.1, 0.01, 0.001, or <0.001. Of 199 subjects with a colon tumor, 74 (38%) had a K-RAS positive tumor. In addition, 3/15 (20%) mucosa samples had K-RAS mutation at a mutant:wild-type ratio of 10−3 or above. Significantly, Dieterle et al. (Citation19) showed that the ratio of K-RAS mutant:wild-type alleles in carcinomas varied over four orders of magnitude. In summary, K-RAS mutation has rarely been quantified, has been detected infrequently in mucosa samples from control subjects, and has been shown to occur as subpopulations within tumors in a single study. However, a rigorous description of the levels of K-RAS mutation (and the variability in these levels) in tissues corresponding to various pathological stages of sporadic colon tumor development using a methodology that is both quantitative and sensitive is critical for the rational use of K-RAS mutation as a cancer biomarker.
A method called Allele-Specific Competitive Blocker Polymerase Chain Reaction (ACB-PCR) can quantify specific K-RAS point mutations (Citation20). The ACB-PCR approach, a type of allele-specific PCR amplification, permits the quantification of specific point mutations when present at a mutant fraction (MF) of 10−5 or higher (i.e., ratios as low as one mutant DNA sequence per 100,000 wild-type DNA sequences). The ACB-PCR approach was developed for the human K-RAS mutation because K-RAS mutations are prevalent in all types of colonic lesions, including aberrant crypt foci (ACF) (41% mutation positive), adenoma (39% mutation positive), and carcinomas (41% mutation positive). Furthermore, two specific K-RAS codon 12 hotspot mutations (GAT and GTT) are reported to occur in 14% and 9% of colonic lesions, respectively (combined occurrence in ACF, adenomas, and carcinomas) (Catalogue of Somatic Mutations in Cancer, COSMIC database (www.sanger.ac.uk/genetics/CPG/cosmic/) search included all histologies within cecum, and left and right colon; accessed June 12, 2009).
A quantitative understanding of the levels of mutation commonly found in normal and pathological samples is a reasonable prerequisite to the meaningful application of a mutational biomarker to cancer screening, for describing patient prognosis, or for selecting a therapeutic approach. Therefore, the goal of this study was to use ACB-PCR to quantify K-RAS codon 12 GAT and GTT MF in normal appearing colonic mucosa, normal appearing mucosa at different distances from a colonic tumor, normal tumor-adjacent (NTA) tissues, colonic adenomas, and colonic carcinomas.
MATERIALS AND METHODS
Tissue Collection
This study was reviewed, approved, and conducted in accordance with the Federal Wide Assurance (FWA) filed by the UAMS Institutional Review Board (UAMS IRB, FWA 00001119), the FDA Research Involving Human Subjects Committee (RIHSC, FWA 00006196), and the Central Arkansas Veterans Healthcare System IRB (CAVHS IRB#1, FWA 00006264). Male colon cancer patients scheduled for a colectomy as a curative treatment for colon cancer were recruited into the study. Because this study was focused on sporadic colon cancer, patients having a first-degree relative with colon cancer (i.e., familial colon cancer), a previous cancer (other than non-melanoma skin cancer), ulcerative colitis, or rectal cancer, were not eligible to participate. A smoking history was elicited from these subjects. Extra tissues not needed for patient diagnosis, along with pathology reports for patient tissues, were collected from subjects who had given their consent to participate in the study. The following fresh samples were collected: a section of normal appearing mucosa 2–5 cm from the subject's tumor (referred to as tumor-proximal mucosa or TPM), a section of normal appearing mucosa 5 cm or more from the subject's tumor (referred to as tumor-distal mucosa or TDM), and a portion of the subject's tumor (later identified as an adenoma or carcinoma, although in one case both were obtained). Not all tissue types were available from all subjects. Pathology reports were reviewed for histological diagnosis and tumor stage. The second source of tissue samples was the Cooperative Human Tissue Network (CHTN). Fresh-frozen colon tumor samples, tumor-adjacent normal appearing mucosa samples (NTA), and colonic mucosa autopsy samples from males without colon cancer (referred to as normal) were collected from the CHTN.
After excising a portion of the fresh TDM sample for DNA isolation, the remainder was fixed in 2% paraformaldehyde and stained with 0.2% methylene blue to identify ACF. Mucosa regions containing ACF were paraffin-embedded and sectioned.
Genomic DNA Isolation and Restriction Digestion
DNAs from mucosa and tumor tissues were isolated on separate days, while employing precautions to limit the possibility of sample cross-contamination. Fresh and frozen tumor samples and mucosa samples were washed extensively in phosphate buffered saline. Any submucosa was removed, and the tissues were homogenized using a tissue tearer (Biospec Products, Inc., Bartlesville, OK) and 10 ml of proteinase K buffer (1 mg/ml proteinase K, 100-mM NaCl, 2.5-mM EDTA (pH 8), and 0.1% SDS) per gram of tissue, incubated ∼16 hr at 37°C, and then extracted with an equal volume of a phenol/chloroform/isoamyl alcohol mixture (25:24:1). Samples were resuspended in 200 μL of RNase buffer: 10 mg/ml RNase A (Sigma, St. Louis, MO), 4.2 units/μL ribonuclease T1 (Sigma), 100-mM sodium acetate, and 50-mM Tris-HCl (pH 8), incubated ∼16 hr at 37°C, and again extracted as described above. The DNA was precipitated and resuspended in 20 μL of TE buffer (5-mM Tris, 0.5-mM EDTA, pH 7.5). DNA was isolated from rehydrated tissue curls manually microdissected from paraffin-embedded sections of ACF using conditions identical to those described above, except Pefabloc (Roche Applied Science, Indianapolis, IN) was added to the samples after proteinase K treatment, and then followed by RNase treatment. All genomic DNAs were digested with Afl II and Ava II (New England Bioloabs, Beverly, MA).
First-round PCR Amplification
For each mucosal or tumor genomic DNA sample, two 200-μL first-round PCR reactions were performed. A single 200-μL first-round PCR reaction was performed using DNA samples isolated from ACF. Each 200-μL reaction contained 1 μg of digested genomic DNA, 10-mM KCl, 10-mM (NH4)2SO4, 20-mM Tris-HCl (pH 8.75), 2-mM MgSO4, 0.1% Triton X-100, 0.1 mg/ml bovine serum albumin, 0.2-mM dNTP, 0.2-μM RD1 (5′TTAAGCGTCGATGGAGGAGTT-3′), 0.2-μM RD2 (5′-GTCCTGCACCAGTAATATGC-3′), and 4 units of Cloned Pfu DNA Polymerase (Stratagene, La Jolla, CA). Amplification conditions included heating for 2 min at 94°C, followed by 35 cycles of 1 min at 94°C, 1 min at 56°C, and 1 min at 72°C, with a final extension of 7 min at 72°C. An aliquot of the PCR product (which included sequence 5′ of exon 1, exon 1, and part of intron 1) was analyzed by agarose gel electrophoresis to confirm product length (384 bp) and that the different samples were amplified to an equivalent extent. The remainder of the PCR product was isolated following preparative agarose gel electrophoresis using a Geneclean Spin Kit (Bio 101, Vista, CA) and frozen as multiple single-use aliquots. The concentration of each DNA sample was determined by repeated measurement using a NanoDrop® ND-1000 Spectrophotometer (NanoDrop Technologies, Wilmington, DE); final concentrations were calculated once three determinations that varied by ≤10% from the group mean were obtained.
ACB-PCR
The ACB-PCR approach relies upon parallel analyses of a set of MF standards and unknowns, all of which contain equal numbers of K-RAS molecules. Mutant and wild-type standards were prepared by digestion of cloned mutant or wild-type plasmid DNA (wild-type, codon 12 GGT; A mutant, codon 12 GAT; and T mutant, codon 12 GTT) with Afl II and Ava II and isolation of a DNA segment corresponding in sequence composition to the first-round PCR product prepared from the isolated colon DNA samples (Citation20).
For measurement of K-RAS codon 12 GAT MF by ACB-PCR, mixtures of purified mutant and wild-type standard DNAs were prepared at a concentration of 5 × 10⁷ copies/μL, with the K-RAS codon 12 GAT MFs of either 10−1, 10−2, 10−3, 10−4, 10−5, or 0 (containing only the wild-type codon 12 sequence). Each ACB-PCR reaction incorporated 10 μL of each DNA mixture, for a total of 5 × 10⁸ K-RAS copies per reaction. Each MF standard was analyzed in duplicate, along with a no-DNA control. The K-RAS codon 12 GAT ACB-PCR reaction employed three primers: P4 (5′-GATTTACCTCTATTGTTGGA-3′), a 5′ fluorescein-labeled mutant-specific primer (MSP-A, 5′-CTTGTGGTAGTTGGAGCTTA-3′), and a blocker primer (BP-A, 5′-CTTGTGGTAGTTGGAGCTTddG-3′) carrying a 3′-dideoxy chain terminator. For ACB-PCR, polyacrylamide gel-purified primers were purchased from Sigma-Genosys (The Woodlands, TX) (Citation20). Each ACB-PCR reaction was prepared by placing 10-μL DNA and 35 μL of reaction mix into a 0.5 ml thin-walled microfuge tube to which 40 μL of mineral oil was added. The reaction mix was prepared such that the final concentration of reagents in each 50-μL ACB-PCR reaction was 60-μM dNTPs, 1x Stoffel buffer, 1.6-mM MgCl2, 0.1 mg/ml gelatin, 1.0 mg/ml Triton X-100, 500-nM primer P4, 500-nM MSP-A, and 375-nM BP-A. Reactions were initiated using a hot-start procedure by the addition of 3.3 units/reaction of Amplitaq DNA Polymerase Stoffel fragment and 0.02 units/reaction of PerfectMatch PCR enhancer that had been diluted into 5 μL of reaction mix (Citation20, 21). Thermocycler conditions were 36 cycles of 30 s at 94°C, 45 s at 45°C, and 1 min at 72°C.
The K-RAS codon 12 GTT ACB-PCR reaction employed three primers: P3 (5′-GTTGGATCATATTCGTCCAC-3′), a 5′ fluorescein-labeled mutant-specific primer (MSP-T, 5′-CTTGTGGTAGTTGGAGCTAT-3′), and a blocker primer (BP-T, 5′-CTTGTGGTAGTTGGAGCTAddG-3′) (Citation20). Each ACB-PCR reaction was prepared by placing 10 μL DNA and 35 μL of reaction mix into a 0.5 ml thin-walled microfuge tube to which 40 μL of mineral oil was added. The reaction mix was prepared such that the final concentration of reagents in each 50-μL ACB-PCR reaction was 40-μM dNTPs, 1x Stoffel buffer, 1.5-mM MgCl2, 0.1 mg/ml gelatin, 1.0 mg/ml Triton X-100, 400-nM primer P3, 300-nM MSP-T, and 240-nM BP-T. Reactions were initiated using a hot-start procedure by the addition of 3.3 units/reaction of Amplitaq DNA Polymerase Stoffel fragment (Applied Biosystems) and 0.06 units/reaction of PerfectMatch PCR enhancer (Stratagene) that had been diluted into 5 μL of reaction mix. Thermocycler conditions were 36 cycles of 30 s at 94°C, 45 s at 41°C, and 1 min at 72°C.
Gel Electrophoresis, Image Analysis, and Data Collection
Equal volumes of ACB-PCR products were analyzed on non-denaturing, 8% polyacrylamide gels. The fluorescent products were visualized following excitation at 488 nm by either a Molecular Dynamics FlourImager (GE Healthcare, Piscataway, NJ) or a PharosFX imaging system with an external blue laser (Bio-Rad Laboratories, Hercules, CA). For each MF standard, the fluorescence of the correct-sized product (GAT ACB-PCR, 103 bp; GTT ACB-PCR, 89 bp) was measured, using ImageQuaNT software (GE Healthcare/Amersham Biosciences) or Quantity One software (Bio-Rad). Specifically, replicate boxes were drawn around individual bands and an average background pixel measurement (collected under the outline of each box) was subtracted from the total pixel count for each box. Log-linear plots relating MF to fluorescence (in pixels) were constructed and fit with an exponential function. This function was then used to calculate the MF in each unknown sample based on the fluorescence of the ACB-PCR product generated using that sample and the same quantitation methodology.
The ACB-PCR mutational analysis of the ten tumors with the highest K-RAS codon 12 MFs was confirmed by DNA sequencing of the corresponding first-round PCR products. The DNA sequencing was performed using a BigDye terminator v3.1 cycle sequencing kit and a 3130 × l Genetic Analyzer (Applied Biosystems, Foster City, CA).
Statistical Analyses
The K-RAS MF for each sample was calculated as the arithmetic average of three replicate assays. In order to standardize variability of measurements distributed over a log10-scale, the average MF measurement for each sample was log10-transformed. For each type of tissue, the average of the log10-transformed MF measurements were calculated and then converted back to MF to obtain the geometric mean MF.
Analysis of variance was performed on log10-transformed data using SigmaStat 3.11 (Systat Software Inc., Chicago, IL). Analysis of variance on ranks was performed because the log-transformed data were not normally distributed. Pair-wise comparisons between TPM versus TDM and adenoma versus carcinoma were performed using Fisher's exact test. Because the tumor K-RAS MF might influence the observed MF in NTA mucosa, the relationships between K-RAS MF and age were examined using only normal, TPM, and TDM MF measurements. The relationships between K-RAS MFs and smoking history were examined using the data collected from the TPM and TDM samples. Significant relationships between age or smoking and K-RAS MF were examined by Spearman rank order correlation, in single-tailed tests performed using GraphPad Prism 5 (GraphPad Software, Inc., La Jolla, CA).
RESULTS
A total of 89 normal appearing colonic mucosa and colon tumor samples were collected and analyzed using ACB-PCR. The number and types of samples are described in . Although characterization of K-RAS codon 12 MF in ACF was a goal of this study, only three ACF from a single subject (7160–25) were detected and analyzed by ACB-PCR. For each tissue sample, genomic DNA was isolated, a segment of K-RAS2 exon 1 was amplified in a high-fidelity, first-round PCR, and then gel-purified, with mucosa samples and tumor samples processed separately to minimize potential cross-contamination. The DNA concentrations of the first-round PCR products were quantified and ACB-PCR reactions were performed using equal copies of K-RAS MF standards (defined mixtures of K-RAS mutant and wild-type sequence, with MFs of 10−1, 10−2, 10−3, 10−4, 10−5, and 0 analyzed in duplicate), and first-round PCR products prepared from the colon tissue samples. Because the MSP used in the ACB-PCR was labeled with a 5′-fluorescein molecule, the ACB-PCR products were fluorescent and were visualized as the expected-size band following polyacrylamide gel electrophoresis (). The fluorescent intensities (in pixels) of the PCR products amplified from the MF standards were quantified and used to construct standard curves ((C) and (D)). For each experiment, the concurrently run wild-type standard (no-mutant control) defines the assay-specific ACB-PCR background signal. Using the linear regression formula derived from the standard curves and the fluorescent intensities of the ACB-PCR products generated from each colon tissue sample, the K-RAS codon 12 MF in each colon DNA sample was calculated.
Table 1. Human Colon Tissue Samples Analyzed by ACB-PCR
Figure 1. Fluorescent ACB-PCR products were quantified following polyacrylamide gel electrophoresis. Equal volumes of the ACB-PCR reactions (MF standards and unknowns) were electrophoresed through polyacrylamide gels, along with a DNA length marker (not shown), and analyzed by fluorescent imaging. (A) K-RAS codon 12 GAT ACB-PCR products; (B) K-RAS codon 12 GTT ACB-PCR products. Two of the three replicate ACB-PCR analyses are presented. Mucosa samples are labeled as follows: Nor: normal mucosa from individuals without colon cancer; TDM: tumor-distal mucosa (≥5 cm from a tumor); TPM: tumor-proximal mucosa (2–5 cm from a tumor); and NTA: normal tumor-adjacent. Examples of the standard curves used to quantify the levels of K-RAS MF in each unknown sample are provided. (C) K-RAS codon 12 GAT standard curve; (D) K-RAS codon 12 GTT standard curve. The dotted lines in (C) and (D) correspond to the average pixel intensity of the two no-mutant control samples (i.e., the technical background of the assay).
Every unknown sample was quantified based on three independent ACB-PCR experiments including three different sets of MF standards. For each K-RAS mutation, 21 gels were used to analyze all the study samples (with sets of 12 MF standards per gel, as given above). For the GAT MF measurements, three of 252 MF standard samples appeared to be technical failures and were not used in the construction of a standard curve. For the GTT MF measurements, seven of 252 MF standard samples appeared to be technical failures and were not used in the construction of a standard curve. A standard was considered a technical failure when its pixel intensity was lower than its replicate standard, as well as other lower MF standards (e.g., a 10−4 standard lower than the other 10−4 standard and the 10−5 standards analyzed in parallel). For the GAT MF measurement, the average squared correlation coefficient (r2) value for the set of 21 standard curves was 0.9786 (range 0.9516 to 0.9924). For the GTT MF measurement, the average r2 value for the set of standard curves was 0.9830 (range 0.9660 to 0.9971).
The K-RAS codon 12 GAT and GTT MFs in colonic mucosa and tumor samples were each measured in three replicate ACB-PCR experiments, producing a dataset of 534 individual ACB-PCR measurements on the 89 samples. The average MF measurement and standard deviation for each MF measurement are plotted in . Given that there were infrequent failures in the mutant fraction standards, it seems likely that occasional ACB-PCR failures could be expected among the measurements of unknowns. For this reason each unknown sample was measured in three independent experiments. The fact that the standard deviations were, on average, 55% and 56% of the MF measurements for the codon 12 GAT and GTT mutations, respectively, suggests that such errors did not have a significant impact. (A), however, does include a few examples (like the first adenoma), for which the standard deviation is quite large and likely reflects a technical failure in one of the three replicate measurements.
Figure 2. K-RAS codon 12 GAT and GTT MF measurements by sample type and subject. (A) The average K-RAS GAT MFs (black circles) and K-RAS GTT MFs (grey circles) calculated from the three independent ACB-PCR measurements are plotted. Error bars denote standard deviation. The dashed line at a MF of 0.5 corresponds to the MF expected in monoclonal tumors initiated by a single K-RAS mutant cell. (B) MFs are plotted for the different tissue types (TDM: tumor-distal mucosa; TPM: tumor-proximal mucosa; adenoma; and carcinoma) measured in particular subjects (left panel) and for normal tumor adjacent (NTA), adenoma, and carcinoma samples collected from the CHTN (right panel). The dotted line at 10−5 corresponds to the limit of accurate ACB-PCR quantification.
The geometric mean and median GAT and GTT MFs for the different tissue types are given in . Many tissues, especially the pathological tissues, had measurable levels of both mutations (1/6 normal mucosa samples, 4/16 TDM samples, 2/15 TPM samples, 8/14 NTA samples, 12/15 adenomas, and 8/22 carcinomas carried both mutations). Only one of the three ACF analyzed had measurable K-RAS mutation, with MFs of 1 × 10⁻² and 2 × 10⁻² for the GAT and GTT mutations, respectively.
Table 2. Summary of K-RAS Mutant Fraction Measurements by Tissue Type
Within-subject measurements of K-RAS MFs in different tissue types are shown in (B). There does not appear to be a correlation between the tumor mutation and mutation with the highest level in the TPM or TDM. Most often, the K-RAS codon 12 GAT mutation was the more common mutation in the mucosa, even when the codon 12 GTT mutation was present in the subject's tumor. A carcinoma and an adenoma were obtained from one subject (7160–24). Both tumors were found to carry both mutations, with the codon 12 GAT mutation more abundant than the GTT mutation in the adenoma, and the reverse in the carcinoma. Box plots illustrating the distributions of K-RAS codon 12 GAT and GTT MFs observed in each type of tissue are shown in . Analysis of variance on ranks detected statistically significant differences in the median K-RAS GAT MFs among the different tissue types (analysis included normal, TDM, TPM, NTA, adenoma, and carcinoma, p = .045), but the differences were too small to identify any statistically significant differences in GAT MF between particular sample types using Dunn's method for multiple pair-wise comparisons. With respect to K-RAS GTT MF, analysis of variance showed there were statistically significant differences in the median K-RAS GTT MF between the different tissue types (p = .002) and multiple pair-wise comparison indicated the K-RAS GTT MF was significantly higher in adenomas than in either TPM (2–5 cm from tumor) or TDM (5 cm or more from the tumor) samples (p < .05). In 9/12 within-subject comparisons, a higher level of K-RAS GAT MF was present in TPM than TDM (see (B)). In 5/12 within-subject comparisons, a higher level of K-RAS GTT MF was observed in TPM than in TDM. In neither case, the relative distribution of mutation was statistically significant (Fisher's exact test, observed distribution was compared to the null hypothesis of equivalent distribution of high MFs between sample types, performed using a two-sided test, p = .2059 and p = .6820, respectively).
Figure 3. Box and whisker plots of the frequency distributions for the K-RAS codon 12 GAT and GTT MFs measured for each type of tissue. Whiskers denote the 10th and 90th percentiles of each distribution, with all outliers indicated by black circles. The dotted line corresponds to the limit of accurate ACB-PCR quantitation, a MF of 10−5.
Every human colonic mucosa sample had a measurable level of K-RAS codon 12 GAT mutation. Twenty of the 52 mucosa samples had measurable levels of the K-RAS codon 12 GTT mutation, including 4/6 normal, 4/16 TDM, 2/15 TPM, 3/5 mucosa samples of unknown distance from the tumor, and 7/10 tumor-adjacent samples. Levels of K-RAS codon 12 GAT mutation were significantly higher than the levels of K-RAS codon 12 GTT mutation within all classes of colonic mucosa except NTA samples (Mann-Whitney Rank Sum Test; normal mucosa, p < .001; TDM, p < .001; TPM, p < .001; mucosa of indeterminate distance, p = .008; and NTA, p = .121).
The K-RAS GAT or GTT MFs in colonic mucosa samples (normal, TDM, and TPM) were analyzed relative to subject's age and smoking history. No evidence of an association between subject's age and K-RAS codon 12 GAT or GTT MF was apparent from the data (see , Spearman rank order correlation, p = .1300 and p = .3043, respectively in one-tailed tests). No significant correlation was observed between smoking history and K-RAS codon 12 MF in colonic mucosa (Spearman rank order correlation of pack years of smoking as reported by subject in a single-tailed test; GAT, p = .2083; GTT, p = .2012).
Figure 4. K-RAS codon 12 GAT and GTT MFs are plotted as a function of subject age. (A) The average K-RAS codon 12 GAT MFs measured in individuals without a colon tumor, in tumor-distal mucosa samples, and tumor-proximal mucosa samples are plotted relative to subject's age. (B) The average K-RAS codon 12 GTT MFs measured in individuals without a colon tumor, in tumor-distal mucosa samples, and tumor-proximal mucosa samples are plotted relative to subject's age. Dashed lines indicate the limit of accurate ACB-PCR quantitation (10−5).
All tumors had measurable levels (≥10−5) of K-RAS codon 12 GAT mutation (see (A) and ). Twelve of the 15 adenomas and 8 of the 22 carcinomas had measurable levels of K-RAS codon 12 GTT mutation. The first-round PCR products generated from the DNAs of the 10 tumors with the highest K-RAS codon 12 MFs (see (A)) were analyzed by DNA sequencing. DNA sequencing results confirmed the mutation identified by ACB-PCR and were consistent with the ACB-PCR quantification of the mutations.
Since shows a difference in K-RAS codon 12 GTT MF between adenomas and carcinomas, the distribution of MFs above the geometric mean for all tumors was analyzed across the two tumor types. The K-RAS codon 12 GAT geometric mean MF for all tumors was 1.12 × 10⁻³. Five of the 15 adenomas and nine of the 21 carcinomas had a MF above the geometric mean GAT MF for all tumors, a nonsignificant distribution (Fisher's exact test, two-sided test, p = .7317). The K-RAS codon 12 GTT geometric mean MF for all tumors was 1.44 × 10⁻⁴. Ten of the 15 adenomas and five of the 21 carcinomas had MFs above the geometric mean MF for all tumors, which was a significant distribution (Fisher's exact test, two-sided test, p = .0167).
DISCUSSION
The rational use of K-RAS mutation as a cancer biomarker requires knowledge of the levels of K-RAS mutation in normal and pathological tissues. Therefore, this study ascertained K-RAS codon 12 GAT and GTT MF in colon tumor tissues and in normal appearing colonic mucosa. Because ACB-PCR is both sensitive and quantitative, this study provides a more detailed and precise understanding regarding the occurrence of K-RAS mutation in the human colon than previously available. To our knowledge, this is the first study employing statistical analyses based on the levels of K-RAS mutation (i.e., MF) in different types of colon tissues. This study had several key findings. First, it clarifies the conflicting literature regarding the presence of K-RAS mutation in normal colon and in subjects without colon cancer (Citation10–14, 19). Some studies have detected K-RAS mutation in normal appearing colon, while others did not, and only one study detected K-RAS mutation in control subjects (Citation12). Previously, the best quantification of K-RAS mutation in colonic mucosa was in a study conducted by Dieterle et al. (Citation19), who reported K-RAS codon 12 mutations (one each of GTT, GCT, and GAT) at mutant:wild-type ratio of 10−3 in 3/15 samples analyzed by PCR-RFLP. The current results show that when an assay with sufficient sensitivity is employed, K-RAS codon 12 GAT mutation is detected in all colonic mucosa samples. The background level of K-RAS codon 12 GAT mutation in normal appearing colonic mucosa should not be confused with the technical background of the assay. In each experiment the technical background of the assay is established by the internal no-mutant control (see ). Further evidence that the observed background level of mutation in colonic mucosa is not technical in nature comes from ACB-PCR analyses of rodent tissues, where similar analyses have identified tissue samples without measurable K-RAS mutation (unpublished observations). The background level of K-RAS mutation (∼10−4 for GAT and ∼10−5 for GTT) may explain why spiking one mutant copy per 103 colonic mucosa cells was necessary to see a discernable difference in mutated bands by PCR-RFLP assay, when, using the same technique, a discernable difference could be observed after spiking one mutant copy per 104 liver cells (Citation19).
The biological significance of low levels of mutant cells in normal appearing colonic mucosa is unclear. Ras transforms most immortalized cell lines, but does not transform primary cells, where instead it may cause cell cycle arrest and apoptosis (Citation22). Heterozygous K-RAS mutant mouse cells (expressing normal levels of K-RAS transcript) are phenotypically altered and have increased cell proliferation but do not grow in soft agar (Citation23). Transgenic mouse models have demonstrated that K-RAS mutation can initiate carcinogenesis, including colon carcinogenesis (Citation22, 24). Because mutant K-RAS cooperates with other genetic lesions, the biological consequences of low levels of K-RAS mutation may depend on whether additional genetic and/or epigenetic lesions are present. Also, cellular context is likely to influence the biological consequences of K-RAS mutation (Citation22). For example, a mutant crypt stem cell may develop into a tumor, whereas a mutant colonocyte about to be shed may not. The fact that K-RAS mutation was measurable in all mucosa samples analyzed suggests the presence of low levels of K-RAS mutation should not be interpreted as early detection of a disease state, as it seems exceedingly unlikely that a tumor would have developed within every mucosa sample that was collected. Instead, K-RAS should be interpreted as one factor contributing to the stochastic risk of tumor development.
provides the description of the population distribution of K-RAS MFs across a variety of different mucosa samples. Sample sizes were relatively small, yet proved sufficient to detect statistically significant differences across tissues types (adenoma versus TPM, adenoma versus TDM, and adenoma versus carcinoma, for the GTT mutation). Also, this study demonstrates that the GAT mutation is present at significantly higher levels than the GTT mutation. This is consistent with a previous study showing that the GAT mutation was detected more frequently than the GTT mutation in colonic mucosa (Citation14). A higher level of K-RAS GAT MF was detected in sigmoid colon than the left colon, which is consistent with the relatively high frequency of K-RAS mutant tumors observed in the sigmoid colon.
Another key finding of this study is that all the tumors examined had a measurable K-RAS MF. In most cases, the level of mutation was below that which could be explained as contamination with normal tissue or infiltration by inflammatory cells. A MF of 2.5 × 10⁻¹ is expected for a single mutant copy of K-RAS in a tumor mass where 50% of the cells are not “tumor cells.” Ten of the 37 tumors had K-RAS MFs plus one standard deviation (top error bar in ) as high as 2.5 × 10⁻¹. Another 19 of the 37 tumors had K-RAS MFs plus one standard deviation (top error bar) within the range of 10−3 to 10−1. These results are consistent with the earlier results reported by Dieterle et al. (Citation19), who reported 11/74 K-RAS-positive tumors had mutant:wild-type ratios >2.5 × 10⁻¹, but another 58/74 K-RAS-positive tumors had mutant:wild-type ratios within the range of 10−1 to 10−3. Thus, a significant number of colon tumors carry K-RAS mutation as a subpopulation of tumor cells. There are several potential explanations for K-RAS mutant subpopulations within tumors. K-RAS mutations could occur after a tumor mass has reached a certain size and then persist in a subset of tumor cells. Alternatively, K-RAS mutation could be an initiating event in the development of a tumor from more than one cell lineage (polyclonal tumor origin). Considerable evidence now exists that colon tumors are polyclonal in origin and that K-RAS mutation can be an initiating mutation in polyclonal tumor development (Citation25–31). However, the observed K-RAS MF distribution within tumors could be a consequence of both mutational pathways occurring in different tumors or even the same tumor. In this regard, it is important to note that many tumors carried more than one K-RAS mutation.
Establishing that K-RAS mutant subpopulations exist within tumors may have clinical significance. Currently, tumor tissues from colon cancer patients are being analyzed as a means to stratify patient prognosis and select therapeutic approach. Gefitinib, erlotinib, cetuximab, and panitumumab are therapies intended to reduce signaling through the epidermal growth factor receptor (EGFR). Because K-RAS is a downstream effector of EGFR signaling, K-RAS mutant tumors are not predicted to respond to these therapies and, indeed, K-RAS mutation has been associated with failure to respond to these therapies (Citation8, 32, 33). However, such studies generally report that a portion of patients characterized as being wild-type for K-RAS also do not respond to therapy. One potential explanation of this result is that some portion of patients classified as wild-type for K-RAS have low, but clinically significant, levels of K-RAS mutation. The current study, as well as the study by Dieterle et al. (Citation19), demonstrate that K-RAS mutations are often present at levels that will be missed by the approaches typically used, like DNA sequencing or even quantitative PCR. Currently, there is no evidence that small K-RAS mutant subpopulations are affecting clinical outcomes with respect to EGFR-directed therapies. However, it will be necessary to measure levels of K-RAS mutation in studies examining clinical responses to EGFR-directed therapies to determine what level of K-RAS mutation does predict failure to respond to therapies directed against the EGFR.
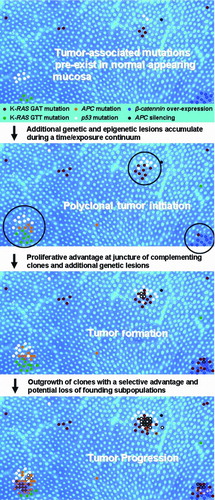
A third, somewhat unexpected, finding of this study is that carcinomas have lower levels of K-RAS codon 12 GTT mutation than adenomas (see ). The quantitative analysis demonstrated that the adenomas encompassed a larger proportion of the high (above the geometric mean for all tumors) K-RAS codon 12 GTT MFs than would be expected by chance. This distribution of higher MFs in adenomas compared to carcinomas is consistent with the greater prevalence of K-RAS codon 12 GTT mutation detection in adenomas as compared to carcinomas evident in the COSMIC database (Citation34). Specifically, the codon 12 GTT mutation has been detected in 43/381 (11.3%) adenomas, but in only 223/2,594 (8.6%) carcinomas (www.sanger.ac.uk/genetics/CPG/cosmic/, search parameters included all histologies for cecum, right, and left colon; accessed June 12, 2009). No decrease in the frequency of K-RAS codon 12 GAT MF was apparent by ACB-PCR, which is again consistent with the prevalence data in the COSMIC database (K-RAS codon 12 GAT mutation is detected in 43/281 (11.3%) adenomas and 371/2,594 (14.3%) carcinomas). There are at least two possible explanations for the observed decrease in K-RAS codon 12 GGT to GTT mutation. One potential explanation is that some K-RAS mutant carcinomas (carrying other than the K-RAS codon 12 GTT mutation) develop along the pathway that doesn't include adenoma, and these carcinomas decrease the apparent percentage of carcinomas carrying the K-RAS codon 12 GTT. The second explanation is that the K-RAS codon 12 GTT mutant subpopulation is lost during the adenoma to carcinoma progression of polyclonal tumors. A model describing polyclonal colon tumor development and progression in terms of the acquisition, accumulation, and loss of K-RAS and other mutations has been presented in . With the added characteristic of polyclonal tumor initiation, this model is otherwise consistent with documented pathways of lesion progression, including the heteroplastic ACF to adenoma to carcinoma sequence and the heteroplastic ACF to hyperplastic polyp/serrated adenoma to carcinoma sequence (Citation35).
Figure 5. A spatially based model of polyclonal colon tumor initiation and progression. The model is based on the concept of polyclonal tumor initiation and features of the model represent the ideas that (1) mutations and epigenetic lesions pre-exist within normal colonic mucosa (APC, adenomatous polyposis coli); (2) additional mutations (both spontaneous and chemically induced) occur over time, along with expansion of pre-existing lesions; (3) tumor initiation occurs when complementing mutant clones or epigenetic lesions arise within close proximity, creating a competitive advantage for cells at the boundary of the two or more cell lineages (a process that may be manifested in the appearance of ACF); (4) additional genetic lesions accumulate in these hyper-proliferating cells (subsequent mutations denoted by colored outline and cross-hatch); and (5) oncogene-induced senescence and/or cell selection may eventually lead to the loss of particular cell lineages during tumor progression (e.g., K-RAS GTT mutation during adenoma to carcinomas progression).
In conclusion, precise information regarding the occurrence of K-RAS mutation in normal and pathological human colon tissue samples was obtained. Such information is critical for using tumor-associated mutations in cancer screening strategies. Considerable efforts have been directed toward using K-RAS mutation as a cancer screening biomarker, including screening blood, plasma, serum, urine, stool, pancreatic juice, sputum, and bronchoalveolar lavage fluid (Citation36). Yet, in the analysis of stool DNA, K-RAS mutation was found to be the greatest contributor to apparent “false positive” results (Citation37). K-RAS mutation has been detected in blood, plasma, serum, and pancreatic juice samples from non-cancer control subjects, suggesting that the detection of K-RAS mutation cannot be equated with malignancy (Citation36). Consequently, the successful use of tumor-associated mutations (like K-RAS) as cancer screening biomarkers will require sensitive quantitative analyses and knowledge regarding levels in normal and pathological tissues. Because ACB-PCR is quite sensitive and quantitative, it is an excellent research tool. In its current format, however, it involves multiple procedures and requires strict quality controls, resulting in insufficient throughput for use in the clinical setting. Some promising quantitative approaches to mutation analysis have been described recently (Citation36). Work is in progress to streamline the ACB-PCR approach and to extend these analyses to additional colon tissue and tumor samples, to complementing mutations involved in colon carcinogenesis, and to investigations of other cancers where K-RAS is implicated in tumor etiology (e.g., lung and pancreatic cancer).
ACKNOWLEDGEMENTS
The authors thank Dr. Margie Scott, the CAVHS pathology staff, and Roberta Mittelstaedt for their assistance. The authors thank Drs. Robert Heflich and Fred Beland for their critical review of the manuscript. The contents of this manuscript do not necessarily reflect the views or policies of the US Food & Drug Administration, nor does the mention of trade names or commercial products constitute endorsement or recommendation for use. This material is the result of work supported with resources and the use of facilities at the Central Arkansas Veterans HealthCare System. Tissue samples were provided by the Cooperative Human Tissue Network, which is funded by the National Cancer Institute. Other investigators may have received specimens from the same subjects.
DECLARATION OF INTEREST
The authors report no conflicts of interest. The authors alone are responsible for the content and writing of the paper.
REFERENCES
- Lilleberg, S.L.; Durocher, J.; Sanders, C.; Walters, K.; Culver, K. High sensitivity scanning of colorectal tumors and matched plasma DNA for mutations in APC, TP53, K-RAS, and BRAF genes with a novel DHPLC fluorescence detection platform. Ann N Y Acad Sci 2004, 1022, 250–256.
- Bazan, V.; Bruno, L.; Augello, C.; Molecular detection of TP53, Ki-Ras and p16INK4A promoter methylation in plasma of patients with colorectal cancer and its association with prognosis. Results of a 3-year GOIM (Gruppo Oncologico dell’Italia Meridionale) prospective study. Ann Oncol 2006, 17(Suppl. 7), vii84–vii90.
- Ito, Y.; Kobayashi, S.; Taniguchi, T.; Kainuma, O.; Hara, T.; Ochiai, T. Frequent detection of K-ras mutation in stool samples of colorectal carcinoma patients after improved DNA extraction: comparison with tissue samples. Int J Oncol 2002, 20, 1263–1268.
- Lecomte, T.; Berger, A.; Zinzindohoue, F.; Detection of free-circulating tumor-associated DNA in plasma of colorectal cancer patients and its association with prognosis. Int J Cancer 2002, 100, 542–548.
- Andreyev, H.J.N.; Norman, A.R.; Cunningham, D.; Kirsten ras mutations in patients with colorectal cancer: the ‘RASCAL II’ study. Br J Cancer 2001, 85, 692–696.
- Font, A.; Abad, A.; Monzo, M.; Prognostic value of K-ras mutations and allelic imbalance on chromosome 18q in patients with resected colorectal cancer. Dis Colon Rectum 2001, 44, 549–557.
- Hassan, A.B.; Paraskeva, C. Colorectal cancer prognosis: is it all mutation, mutation, mutation? Gut 2005, 54, 1209–1211.
- Lievre, A.; Bachet, J.-B.; Le Corre, D.; K-RAS mutation status is predictive of response to cetuximab therapy in colorectal cancer. Cancer Res 2006, 66, 3992–3995.
- Han, S.W.; Kim, T.Y.; Jeon, Y.K.; Optimization of patient selection for gefitinib in non-small cell lung cancer by combined analysis of epidermal growth factor receptor mutation, K-ras mutation, and Akt phosphorylation. Clin Cancer Res (an official journal of the American Association for Cancer Research) 2006, 12, 2538–2544.
- Zhang, H.; Nordenskjold, B.; Dufmats, M.; Soderkvist, P.; Sun, X.-F. K-ras mutations in colorectal adenocarcinomas and neighbouring transitional mucosa. Eur J Cancer 1998, 34, 2053–2057.
- Yamada, S.; Yashiro, M.; Maeda, K.; Nishiguchi, Y.; Hirakawa, K. A novel high-specificity appraoch for colorectal neoplasia: detection of K-ras2 oncogene mutation in normal mucosa. Int J Cancer 2005, 113, 1015–1020.
- Ronai, Z.; Luo, F.C.; Gradia, S.; Hart, W.J.; Butler, R. Detection of K-ras mutation in normal and malignant colonic tissues by an enriched PCR method. Int J Onc 1994, 4, 391–396.
- Zhu, D.; Keohavong, P.; Finkelstein, S.D.; K-ras gene mutations in normal colorectal tissues from K-ras mutation-positive colorectal cancer patients. Cancer Res 1997, 57, 2485–2492.
- Kraus, M.C.; Seelig, M.H.; Linnemann, U.; Berger, M.R. The balanced induction of K-ras codon 12 and 13 mutations in mucosa differs from their ratio in neoplastic tissues. Int J Onc 2006, 29, 957–964.
- Imperiale, T.F.; Ransohoff, D.F.; Itzkowitz, S.H.; Turnbull, B.A.; Ross, M.E. Fecal DNA versus fecal occult blood for colorectal-cancer screening in an average-risk population. N Engl J Med 2004, 351, 2704–2714.
- Rennert, G.; Kislitsin, D.; Brenner, D.E.; Rennert, H.S.; Lev, Z. Detecting K-ras mutations in stool from fecal occult blood test cards in multiphasic screening for colorectal cancer. Cancer Lett 2007, 253, 258–264.
- Loktionov, A.; O’Neill, I.K.; Silvester, K.R.; Cummings, J.H.; Middleton, S.J.; Miller, R. Quantitation of DNA from exfoliated colonocytes isolated from human stool surface as a novel noninvasive screening test for colorectal cancer. Clin Cancer Res 1998, 4, 337–342.
- Yamada, S.; Yashiro, M.; Maeda, K.; Nishiguchi, Y.; Hirakawa, K. A novel high-specificity approach for colorectal neoplasia: detection of K-ras2 oncogene mutation in normal mucosa. Int J Cancer 2005, 113, 1015–1021.
- Dieterle, C.P.; Conzelmann, M.; Linnemann, U.; Berger, M.R. Detection of isolated tumor cells by polymerase chain reaction-restriction fragment length polymorphism for K-ras mutations in tissue samples of 199 colorectal cancer patients. Clin Cancer Res 2004, 10, 641–650.
- McKinzie, P.B.; Parsons, B.L. Detection of rare K-ras codon 12 mutations using allele-specific competitive blocker PCR. Mutat Res – Genet Toxicol Environ Mutagen 2002, 517, 209–220.
- Parsons, B.L.; McKinzie, P.B.; Heflich, R.H. ACB-PCR detection of rare point mutation. In Molecular Toxicology Protocols, Methods in Molecular Biology, P. Keohavong, (ed.). Totowa, NJ: Humana Press, 2005, pp. 235–245.
- Vitale-Cross, L.; Amornphimoltham, P.; Fisher, G.; Molinolo, A.A.; Gutkind, J.S. Conditional expression of K-ras in an epithelial compartment that includes the stem cells is sufficient to promote squamous cell carcinogenesis. Cancer Res 2004, 64, 8804–8807.
- Arena, S.; Isella, C.; Martini, M.; De Marco, A.; Medico, E.; Bardelli, A. Knock-in of oncogenic K-ras does not transform mouse somatic cells but triggers a transcriptional response that classifies human cancers. Cancer Res 2007, 67, 8468–8476.
- Janssen, K.P.; Abal, M.; El Marjou, F.; Louvard, D.; Robine, S. Mouse models of K-ras-initiated carcinogenesis. Biochim Biophys Acta 2005, 1756, 145–154.
- Novelli, M.R.; Williamson, J.A.; Tomlinson, I.P.; Polyclonal origin of colonic adenomas in an XO/XY patient with FAP. Science 1996, 272, 1187–1190.
- Merritt, A.J.; Gould, K.A.; Dove, W.F. Polyclonal structure of intestinal adenomas in APC min/ +mice with concomitant loss of Apc+ from all tumor lineages. Proc Natl Acad Sci USA 1997, 94, 13927–13931.
- Thliveris, A.T.; Halberg, R.B.; Clipson, L.; Polyclonality of familial murine adenomas: analyses of mouse chimeras with low tumor multiplicity suggest short-range interactions. Proc Natl Acad Sci USA 2005, 102, 6960–6965.
- Newton, M.A.; Clipson, L.; Thliveris, A.T.; Halberg, R.B. A statistical test of the hypothesis that polyclonal intestinal tumors arise by random collision of initiated clones. Biometrics 2006, 62, 1–7.
- Halberg, R.B.; Dove, W.F. Polyclonal tumors in the mammalian intestine: are interactions among multiple initiated clones necessary for tumor initiation, growth, and progression? Cell Cycle 2007, 6, 44–51.
- Humpfries, A.; Wright, N.A. Colonic crypt organization and tumorigenesis. Nat Rev Cancer 2008, 8, 415–424.
- Parsons, B.L. Many different tumor types have polyclonal origin: evidence and implications. Mutat Res – Rev Mutat Res 2008, 659, 232–247.
- De Roock, W.; Piessevaux, H.; De Schutter, J.; KRAS wild-type state predicts survival and is associated to early radiological response in metastatic colorectal cancer treated with cetuximab. Ann Oncol 2008, 19, 508–515.
- Lievre, A.; Bachet, J.-B.; Boige, V.; K-RAS mutations as an independent prognostic factor in patients with advanced colorectal cancer treated with cetuximab. J Clin Oncol 2008, 26, 374–379.
- Forbes, S.A.; Bhamra, G.; Bamford, S.; The catalogue of somatic mutations in cancer (COSMIC), unit 10.11. Curr Protoc Hum Genet 2008, 57, 10.11.11–10.11.26.
- Suehiro, Y.; Hinoda, Y. Genetic and epigenetic changes in aberrant crypt foci and serrated polyps. Cancer Sci 2008, 99, 1071–1076.
- Parsons, B.L.; Meng, F.K. RAS mutation in the screening, prognosis, and treatment of cancer. Biomarkers Med 2009, 3, 757–769.
- Osborn, N.K.; Ahlquist, D.A. Stool screening for colorectal cancer: molecular approaches. Gastroenterology 2005, 128, 192–206.