
Abstract
Little is known about the endocannabinoid (eCB) system in squamous cell carcinoma of the oral tongue (SCCOT). Here we have investigated, at the mRNA level, expression of genes coding for the components of the eCB system in tumour and non-malignant samples from SCCOT patients. Expression of NAPEPLD and PLA2G4E, coding for eCB anabolic enzymes, was higher in the tumour tissue than in non-malignant tissue. Among genes coding for eCB catabolic enzymes, expression of MGLL was lower in tumour tissue while PTGS2 was increased. It is concluded that the eCB system may be dysfunctional in SCCOT.
Introduction
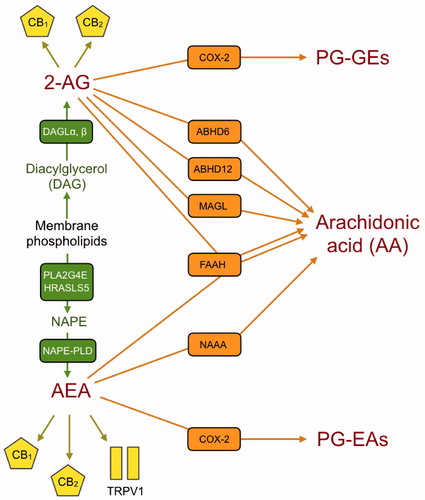
The endocannabinoid (eCB) system, comprising the cannabinoid (CB) receptors, their endogenous ligands anandamide (N-arachidonoylethanolamine, AEA) and 2-arachidonoylglycerol (2-AG) and their anabolic and catabolic enzymes, is involved in a wide range of activities in the body, varying from the regulation of neurotransmitter release to the regulation of bone turnover (Citation1). The eCB system as described above is in its simplest form, since other less-studied endogenous ligands, and other biologically active N-acylethanolamines (NAEs, i.e. AEA homologues) and monoacylglycerides (MAGs, i.e. 2-AG homologues) are produced using the same metabolic machinery (Citation1). Further, eCBs can interact with other non-CB receptors, notably the transient receptor potential V1 (TRPV1) in the case of AEA (Citation1). In , the eCB system is shown schematically to aid the reader as to the functions of the proteins coded by the genes investigated in the present study.
Figure 1. A schematic view of the eCB signalling system showing the protein targets for the genes studied in the present study. The corresponding gene names are shown in . Anabolic enzymes are shown in green, the target receptors are shown as yellow symbols, and the catabolic enzymes are shown in orange. Abbreviations: ABHD6/12: αβ/beta-hydrolase domain containing 6/12; CB1 and CB2: cannabinoid receptors 1 and 2; COX-2: cyclooxygenase-2; DAGL: diacylglycerol lipase; FAAH: fatty acid amide hydrolase; HRASLS5: phospholipase A and acyltransferase 5; MAGL: monoacylglycerol lipase; NAAA: N-acylethanolamine acid amide hydrolase; NAPE: N-acyl-phosphatidylethanolamine; NAPE-PLD: NAPE-phospholipase D; PLA2G4E: phospholipase A2 group IVE; PG-EAs: prostaglandin ethanolamides (prostamides); PG-GEs: prostaglandin glyceryl esters; TRPV1: transient receptor potential vanilloid 1.
There is good evidence that the eCB system is disrupted in cancer. Thus, for example, levels of AEA are higher in human colon tumours and polyps than in histologically normal tissue. This change is accompanied by an increase in the mRNA levels and activities of the NAE anabolic enzyme N-acyl-phosphatidylethanolamine phospholipase D (NAPE-PLD) and the NAE catabolic enzyme fatty acid amide hydrolase (FAAH), suggestive of an increased turnover of AEA and other NAEs (Citation2,Citation3). Increased NAPE-PLD mRNA levels have also been found in mantle cell lymphoma (N = 18) compared to normal B cells from six individuals (Citation4), and increased FAAH immunoreactivity is associated with disease severity in prostate cancer (Citation5) whereas reductions in NAPE-PLD and FAAH activity are seen in glioblastoma (Citation6). Given that the eCB system can regulate cancer cell proliferation, migration and invasion (for review, see Citation7), and that 2-AG and other MAGs can act as a precursor of free fatty acids via hydrolysis catalysed by monoacylglycerol lipase (MAGL) as a tumour energy source (Citation8), changes in the expression of eCB anabolic and catabolic enzymes may contribute to tumour pathogenesis.
Most work on the eCB system in tumours has focussed on glioma, prostate and colon cancer (see e.g. Citation2,Citation3, Citation5,Citation6, Citation9). In contrast to other cancer cell types, very little is known about the eCB system in oral squamous cell carcinoma (SCC), which is a very common cancer form, particularly in countries such as India, Sri Lanka, Bangladesh and Pakistan (Citation10). However, a meta-analysis (Citation11) of five separate array studies investigating SCC of the oral tongue (SCCOT, the most common site of the tumour in oral SCC) encompassing a total of 111 tumours and 79 non-malignant cases reported a decrease in MAGL expression; the MAGL change was one of the top 30 down-regulated genes. This finding motivates a more detailed investigation into the expression of genes related to the eCB system in SCCOT. In the present study, we have therefore investigated the expression of 12 genes involved in the eCB system using Illumina array data and qPCR experiments as an initial step in determining the extent to which the eCB system is dysfunctional in tongue SCCOT.
Methods
Patient characteristics
The samples were collected from tongue tissue from a series of patients prior to treatment for SCCOT (see Refs. Citation12–15 for previous studies undertaken using these samples). Samples were collected after informed consent, and the project was approved by the local Ethical Committee (dnr 03-201 and dnr 08-003 M). Where possible, both tumour and non-malignant tissue were collected from the patients. In these cases, the non-malignant samples were collected from the opposite side of the tongue to the tumour, but as far from the tumour as possible. We have separated the samples into three cohorts, based on the RNA extraction procedure used (see below): “Tri”, “Qia” and “Nor”. The fact that different extraction procedures were used is a reflection of the fact that SCCOT is an unusual cancer form in Sweden (although common in other countries), and so collection of the samples in Umeå, which is in the northern part of Sweden, where there is a low population densityFootnote1, was over a long period of time. During this time, new methods have been developed and adopted, not least to avoid the use of chloroform required in the Tri cohort. In the case of the “Nor” cohort, only one patient sample used this procedure for both array and qPCR but was used for the healthy controls reported here, and for additional cases where tumour tissue alone was available. Since the samples were consecutive, the location of the tumour was not predetermined, and thus the difference in tumour locations for the different extraction procedures is a random event. The age, gender and disease characteristics of the two cohorts investigated in the present study are summarised in . In addition, a set of samples taken from the border of the tongue from 14 healthy volunteers (9 female, 5 male, age range 25–59 years) were available. The biopsy samples were frozen in liquid nitrogen directly after collection and stored at −80 °C until used for RNA extraction.
Table 1. Age, sample location and TNM stages of the cohorts used in the present study.
RNA extraction
As alluded to above, three methods for RNA extraction were used for the samples (Citation12–15). In brief, the frozen biopsy was cut in small pieces and homogenised in either trizol (“Tri” cohort) or the lysis buffers provided in either the RNA/protein purification kit (Norgen, Canada, “Nor” cohort as well as all the samples from the healthy volunteers) or the AllPrep DNA/RNA/miRNA Universal Kit (Qiagen, Hilden, Germany; “Qia” cohort). Homogenisation was performed using a precellys (Bertin Technologies, Artigues-près-Bordeaux, France). After homogenisation, samples were treated according to protocols provided by the supplier. A DNase treatment step was not included at the time. For samples extracted with trizol, chloroform was added to the homogenised sample and the phases were separated, after which RNA was precipitated by adding isopropanol followed by wash in ethanol. All RNA samples were dissolved or eluted in water and the quality and quantity measured using nano-drop and Agilent RNA 6000 Nano kit (Agilent 2100 Bioanalyzer, Agilent Technologies, Santa Clara, CA, USA).
Illumina array data
The methodology involved has been described previously (Citation15). Briefly, RNA (200 ng) was labelled with TargetAmpTM-Nano Labelling Kit for Illumina Expression BeadChip (Epicenter) to produce cRNA, which was purified using a Qiagen RNeasy MinElute Cleanup kit (Qiagen). The purified cRNA (750 ng), was hybridised to an Illumina HumanHT-12 v4 bead chip and analysed with an iScan System, according to the manufacturer’s instructions. Raw data have been deposited at http://www.ebi.ac.uk/arrayexpress/help/FAQ.html#cite, ArrayExpress accession numbers E-MTAB-4678 (Tri cohort, cases 11, 14, 24, 29, 40, 42, 51, 56, 58, 59, 61, 65, 73, 79) and E-MTAB-5534 (Qia cohort, cases 20, 35, 49, 76, 98, 105, 111, 119, 124, 131, 137, 138). Illumina data for a Trizol sample from case 35 were also available, but only for the tumour sample, and so we elected not to use these data in order to keep the cohorts entirely separate. Array data retrieved from E-MTAB-4678 and E-MTAB-5534 were used as log2 of the neqc normalised data.
qPCR assays
A subset of the Tri and Qia cohorts (those where samples were still available) were investigated in qPCR assays. Reverse transcription was run in a Life Touch thermal cycler on 1 µg of total RNA using the GoScriptTM Reverse Transcription Mix from Promega (Madison, WI, USA). qPCR mixtures were prepared using qPCRBIO SyGreen Mix from PCR biosystems (PCR Biosystems Inc., Wayne, PA, USA) at a final volume of 20 µL. An Illumina Eco Real-Time PCR System (Illumina Inc., San Diego, CA, USA) was used to conduct qPCR with an initial holding time of 2 minutes at 95 °C, 45 cycles of 5 seconds at 95 °C and 30 seconds at 60 °C and melting curve cycle times of 15 seconds at 95 °C, 15 seconds at 55 °C and a final step of 95 °C for an additional 15 seconds. Primers () were synthesised at Integrated DNA Technologies (Coralville, IA, USA). For details as to primer efficiencies and specificities, see Supplementary Table S1. In general, 1:10 dilutions were used, although for three genes (CNR1, TRPV1, PTGS2) undiluted samples were required to obtain satisfactory melt curves. CNR2 was also investigated, but in almost all of the cases presented here, satisfactory melt curves were not obtained despite using undiluted samples.
Table 2. Primers used in the present study.
Three reference genes were used in the study to normalise the data: RPL13, RPL19 and RPS12. However, the primer for RPL13 targeted a region within a single exon (see Supplementary Table S1) and so we elected to normalise the data with respect to the average of the RPL19 and RPS12 housekeeping genes. Throughout, we have presented the data as ΔCt rather than 2−ΔΔCt as it allows comparison of mRNA levels for the different genes. A difference of +1 or −1 between two groups represents a difference of 50% or 200%, respectively, of the mRNA levels.
Statistical procedures
Data are presented as scatterplots in the figures and as means ± SD in the tables. For the patient characteristics data, Chi-square tests and Fisher’s exact test statistic were calculated using GraphPad Prism v 8.0.1 for the Macintosh (GraphPad Software Inc., San Diego, CA, USA). Mood’s median test was undertaken using the package mood.medtest in the RVAideMemoir package v 0.9-70 for the R statistical programme v 3.5.1 for the Macintosh (Citation16). For the array and qPCR data, partially overlapping t-tests (Citation17) were calculated using the function Partover.test in the package Partiallyoverlapping version 1.0 for R. Two-way mixed ANOVAs were calculated using the function ezANOVA in the ez package v 4.4-0 for R (Citation18). Critical values of p using 5% false discovery rates (Citation19) were calculated for the p values on Microsoft Excel® spreadsheets. Figures were drawn up in the GraphPad programme.
Results
Expression of the genes involved in eCB signalling in tissue from healthy volunteers
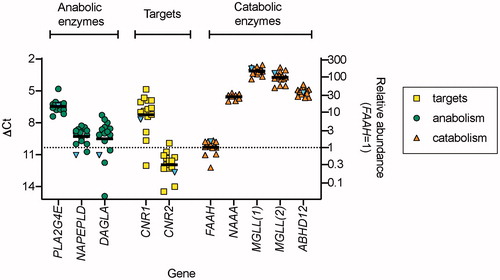
In order to assess the relative expression of eCB-related genes in tongue samples, qPCR was undertaken using 14 samples taken from the border of the tongue of healthy volunteers. The samples were extracted using the Norgen RNA/protein purification kit. Scatterplots of the data are shown in . Most noticeable was the high expression of the genes for the 2-AG hydrolytic enzymes MGLL and ABHD12 and of the AEA hydrolytic enzyme NAAA compared to FAAH. Note that two different primer pairs were used for MGLL. DAGLB, TRPV1, ABHD6 and PTGS2 only gave acceptable melt curves in 1–2 of the samples and so these data are not shown.
Figure 2. Expression of genes involved in the eCB signalling system in samples from 14 healthy volunteers: qPCR data. The blue inverted triangles in the figure show the ΔCt values for a single non-malignant tissue sample from a case with SCCOT where the Norgen extraction method was used. In all extracts except NAAA and CNR1, melt curves were deemed satisfactory. For NAAA, only seven extracts (for the controls) gave satisfactory melt curves, hence the smaller sample size in the figure. For CNR1, the control data are for the 12 extracts giving satisfactory melt curves. The right axis shows the geometric mean values relative to the mean geometric values for FAAH, i.e. 2−ΔΔCt with respect to this gene. MGLL(1) and MGLL(2) refer to the two different primer pairs used (see ).
Patient characteristics
The age, gender, tumour biopsy location and TNM stage for the SCCOT cases investigated in the study are summarised in . In general, the characteristics of the two cohorts did not differ significantly one from the other, with the exception of the tumour locations for the subsets used in the qPCR experiments, where the Qia cohort consisted predominantly of samples taken from the border of the tongue and the Tri cohort used samples taken from the tongue or the overgrowth into the floor of the mouth.
Illumina array data
From the array data available at ArrayExpress accession numbers E-MTAB-4678 and E-MTAB-5534, gene expression data for genes involved in the formation of eCBs (PLA2G4E, HRASLS5N, NAPEPLD, DAGLA, DAGLB), the targets of eCB action (CNR1, CNR2, TRPV1), genes involved in eCB catabolism (FAAH, NAAA, MGLL, ABHD6, ABHD12, PTGS2) were recovered. We also investigated CD36, which codes for fatty acid translocase, a gene product associated with the metastatic ability of tumour cells (Citation20) and FABP5, the gene product of which is involved in the intracellular trafficking of AEA among its actions (Citation21, for a list of the proteins coded by the genes and the abbreviations, see ).
The data are summarised in and , for the Tri and Qia cohorts, respectively, and examples of the data are shown as scatterplots in . Several effects were consistent for both cohorts. Thus, expression of NAPEPLD, PTGS2 and FABP5 were significantly increased in the tumour samples compared to the non-malignant samples, whereas expression of NAAA and ABHD12 were decreased. No significant differences between non-malignant and tumour tissue were seen for HRASLS5, CNR1, CNR2 or CD36. Finally, p values for DAGLA were <.05 in both cohorts, but the p value in the Qia cohort was higher than the critical value of p assuming a 5% false discovery rate. Other genes showed varying effects, but a two-way mixed ANOVA for the matched samples (9 Tri and 12 Qia) indicated no significant interaction cohort × tissue diagnosis (Supplementary Table S2). In other words, there is no significance of the difference in p values for any of the genes (see (Citation22) for a discussion as to the “significance of the difference” vs. “difference of the significance”).
Table 3. Illumina output data (log2 scale) for non-malignant and tumour samples from the Tri cohort of patients with SCCOT.
Table 4. Illumina output data (log2 scale) for non-malignant and tumour samples from the Qia cohort of patients with SCCOT.
The above discussion has focussed upon the p values, but the size of the change is extremely important. A useful visual way of showing array data is the Volcano plot, where the log2 fold change (i.e. the difference in the mean tumour − mean non-malignant tissue log2 scores) is plotted against log10 of the p value (Citation23). shows a Volcano plot for the 21 matched samples, where the vertical dotted lines represent a doubling (log2 fold change = 1) or halving (log2 fold change = −1) of the gene expression in the tumour tissue compared to the non-malignant tissue. The horizontal line represents the critical value of p assuming a 5% false discovery rate (data taken from Supplementary Table S2). Outside the boundaries are NAAA [10], ABHD12 [13] and PTGS2 [14] (numbers in square brackets refer to the numbers in ), but PLA2G4E [1], NAPEPLD [3] and FABP5 [16] are close enough to a doubling in expression boundary to be considered as potentially relevant changes in gene expression, as are DAGLA [4] and MGLL [11] to a halving in gene expression. The other genes fall within the rectangle formed by the dotted lines.
qPCR experiments
There is debate concerning the usefulness of confirming array data with qPCR (Citation24,Citation25). Nonetheless, we investigated gene expression using this technique from a subset of both cohorts. Data from the qPCR experiments are summarised in and , and example data as scatterplots are shown in . We did not compare the data with the healthy controls () since the latter were all worked up using the Norgen RNA/protein purification kit. However, two gene expression profiles stood out: CNR1 and CNR2. In the case of CNR2, most of the Tri and Qia cohort non-malignant samples gave unsatisfactory melting curves. There are differences in mRNA and genomic DNA recovery as well as mRNA quality with different extraction procedures (Citation26,Citation27). In order for the CNR2 primer pair to be intron skipping (to avoid contamination of the readout by DNA), the target region of the mRNA was nucleotides 57–132 (of a total of 5265 nucleotides; the two CNR2 exons are nucleotides 1–117 and 118–5265), i.e. near the 5′-end of the mRNA. Although mRNA has been shown to be stable during long-term storage (Citation28), it is possible that some degradation of the CNR2 mRNA starting at the 5′-end may have occurred in the samples, thereby accounting for the unsatisfactory outcome of qPCR with the primer pair used. Our other intron skipping primer pairs were further away from the 5′ end (see Supplementary Table S1).
Figure 3. Volcano plots of (A) the matched array data (21 pairs, 9 Tri and 12 Qia) and (B) matched qPCR data (11–15 pairs from the two cohorts). The p values (the ANOVA values for diagnosis as main effect) and log2FC (log2 fold change, defined as described in ) data are taken from Supplementary Tables 1 and 2. In the qPCR panel (B), the p value for DAGLB is from a two-tailed paired t-test (see Supplementary Table 3 for details). The numbers correspond to: 1, PLA2G4E; 2, HRASLS5 (array data only); 3, NAPEPLD; 4, DAGLA; 5, DAGLB; 6, CNR1 (array data only); 7, CNR2 (array data only); 8, TRPV1; 9, FAAH; 10, NAAA; 11, MGLL (in the qPCR panel, the MGLL primer pair is specified); 12, ABHD6; 13, ABHD12; 14, PTGS2; 15, CD36; 16, FABP5 (array data only). Vertical dotted lines show log2FC values of +1 and −1; horizontal lines show the critical values of p (∼.015, from Supplementary Tables 2 and 3).
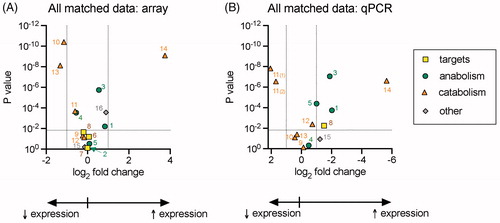
Figure 4. Scatterplots of the data for the expression of four genes investigated in the present study. The genes shown are examples of the expression data summarised in . Array data are shown in the left, and qPCR data to the right for the two cohorts. Unmatched samples in the Tri cohort are shown, when visible, in darker colours. Abbreviations: NM: non-malignant; T: tumour. Note that the axes for the qPCR are reversed. For MGLL, the two primer pairs are shown for the qPCR data. Sample sizes for NM and T, respectively, are array Tri, 11 and 12; array Qia, 12 and 12; qPCR Tri, 6 and 6; qPCR Qia, 9 and 9.
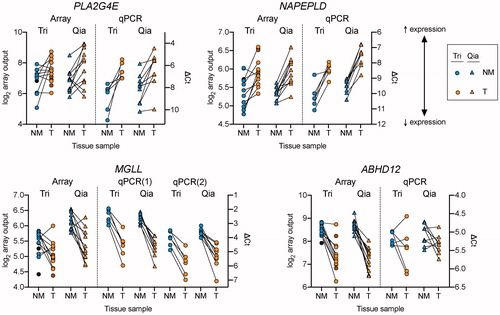
Table 5. qPCR data (ΔCt) for non-malignant and tumour samples from the Tri cohort of patients with SCCOT.
Table 6. qPCR data (ΔCt) for non-malignant and tumour samples from the Qia cohort of patients with SCCOT.
In the case of CNR1, the ΔCt values for both non-malignant and tumour samples and in both Tri and Qia samples were very much higher than seen in the Norgen control samples (and even in the single non-malignant sample extracted using this method, compare the blue inverted triangle in with the data in and ). This would suggest that the CNR1 data are highly sensitive to the extraction method used. In contrast to all the other eCB-related primer pairs used in the present study, the region of mRNA targeted by the CNR1 primer pair was within a single large exon, simply because design of exon-crossing primer pairs would have meant using many different primer pairs all targeting mRNA near the 5′-end (there are nine different transcript variants, see Supplementary Table S1). The only other primer pair we used that targeted mRNA within a single large exon was for the housekeeping gene RPL13. In this case, however, the ΔCt values (comparing to the average RPL19 and RPS12 values as reference) for the control samples and Tri non-malignant samples were very similar (0.63 ± 0.30, N = 6 and 0.63 ± 0.23, N = 6, respectively, mean ± SD) albeit lower than the Qia non-malignant samples (1.04 ± 0.30, N = 9) or either the Tri and Qia tumour samples (1.41 ± 0.21, N = 6 and 1.33 ± 0.33, N = 9, respectively), suggesting that DNA contamination alone is unlikely to explain the large difference in CNR1 expression seen in the cohorts. Whatever the explanation, we have elected not to interpret the CNR1 qPCR data.
In both Tri and Qia cohorts, expression of the genes coding for the 2-AG anabolic enzymes DAGLA and DAGLB was lower than the AEA anabolic enzymes PLA2G4E and NAPEPLD. Expression of the gene coding for the target receptor TRPV1 was very low. For the genes coding the eCB catabolic enzymes, expression of FAAH was much lower than of NAAA, while the 2-AG catabolic enzyme genes MGLL and ABHD12, had a much higher expression than ABHD6. In the non-malignant tissue, expression of PTGS2 was low.
With respect to the difference between tumour and non-malignant tissue, the consistent findings for the two cohorts were a significant increase in expression of PLA2G4E, NAPEPLD, TRPV1 and PTGS2 (note that in this case, a negative number for the tumour minus the non-malignant mean ΔCt scores indicates an increased expression), decreased expression of MGLL, and no significant differences in the expression of DAGLA, FAAH, NAAA, ABHD12 and CD36. ABHD6 expression was increased in the Qia cohort, but in the Tri cohort, only two of the non-malignant samples gave acceptable melt curves, thus precluding significance testing in this case. HRASLS5 and FABP5 were not investigated.
As with the array data, two-way mixed ANOVA was conducted on the qPCR data (Supplementary Table S2) and these were used to construct a Volcano plot (). In this case, a log2 fold change of −1 constitutes a doubled gene expression, and so the x-axis of the plot has been reversed to allow for direct comparison with the array plot in . As with the array data, there were no significant interactions cohort × tissue diagnosis (with the notable exception of CNR1, which we have excluded for the reasons described above). Outside the boundaries are MGLL [11], PLA2G4E [1], NAPEPLD [3], DAGLB [5], TRPV1 [8]. ABHD6 [12] is sufficiently close to a doubling in expression boundary to be considered as a potentially relevant change in gene expression. With the exception of CD36 [15], the other genes are within the rectangle formed by the dotted lines.
Discussion
The present study represents an initial investigation into the eCB system in SCCOT. At the outset, the two main limitations of the study should be mentioned: (1) The sample sizes are small, precluding investigation into the association between changes in expression and disease severity; (2) the focus has been upon mRNA expression rather than upon expression or activity of the proteins. Although the sample sizes are small, the use of two different cohorts with different mRNA extraction methods and the use of qPCR in subsets to confirm the array data allow reasonable confidence to be attached to the consistent changes in gene expression, i.e. those seen for NAPEPLD and PTGS2, and possibly also MGLL and PLA2G4E.
The greatest change, in terms of fold increase, was the expected (Citation29–31) increase for PTGS2, the gene coding for cyclooxygenase-2 (COX-2). The association between oral SCC and COX-2 appears to be fundamental to disease pathology, since (a) factors known to be involved in the pathogenesis of this disease such as benzo[a]pyrenes (constituents of cigarette smoke) induce COX-2 (Citation32–34); (b) COX-2-selective inhibitors reduce tumour development in animal models of oral SCC and decrease proliferation of oral SCC cell lines (Citation30,Citation35); and (c) overexpression of COX-2 in oral SCC cells or addition of prostaglandin E2 (PGE2) to the medium increases their migration across Transwells, an in vitro model of cell invasivity (Citation36). These observations considered COX-2 primarily as a supplier of PGs from arachidonic acid. However, COX-2 can also catalyse the formation of PG-ethanolamines and PG-glycerol esters from AEA and 2-AG, respectively (Citation37), and these compounds produce both pro- and anti-inflammatory effects in the body (Citation38). To our knowledge, there is little information on the roles of these compounds in the pathogenesis of cancer, but there are data demonstrating that COX-2 can mediate the endoplasmic stress-induced apoptosis in tumourigenic keratinocyte cells via an AEA → PGD2-ethanolamide → PG J-series prostamide pathway (Citation39).
With respect to eCB turnover, our finding of a robust increase in NAPEPLD is consistent with data from colon cancer and mantle cell lymphoma (Citation2–4). Changes in protein or activity do not always mirror changes in mRNA expression and this should be taken into account when discussing our findings. In colon cancer, the increased mRNA expression of NAPEPLD is accompanied by an increased catalytic activity of its gene product NAPE-PLD (Citation2,Citation3). Assuming for the sake of argument that the same is happening here, then our data would suggest an increased synthetic capacity of AEA and related NAEs in SCCOT. The increased PLA2G4E, which codes for a protein producing NAPEs from membrane phospholipids (Citation40) is also consistent with this suggestion.
With respect to 2-AG turnover, the report from a meta-analysis of five separate array studies indicating a decreased tumour MGLL expression was also seen in our qPCR data. The literature on MAGL has focussed upon potential benefits of its inhibition in cancer (see (Citation41)), not least since the enzyme can contribute to tumour pathogenicity by catalysing the production of free long-chain fatty acids from their corresponding monoacylglycerols (Citation8). However, epithelial cell MGLL is reduced in some tumours and the enzyme has been implicated in tumour suppression (Citation42,Citation43) and its role(s) may thus be dependent upon the tumour in question.
In addition to the above changes, there were changed expression profiles that were seen in the qPCR experiments (↑ DAGLA, ↑ TRPV1) but not in the array data, and vice versa (↓ NAAA, ↓ ABHD12). The reasons for this difference are not clear. However, for ABHD12, we compared our primer pair with the Illumina probe listed at (http://www.genomequebec.mcgill.ca/compgen/integrated_vervet_genomics/transcriptome/Illumina/index.html#). ABHD12 has two reported and verified transcript variants:1 [NM_001042472] and 2 [NM_015600], where variant 1 is the predominant transcript (https://www.ncbi.nlm.nih.gov/gene?Db=gene&Cmd=DetailsSearch&Term=26090#reference-sequences). Most studies examining mutations in ABHD12 in disease states use variant 1 as a base (see, e.g. (Citation44)). The primer pair used here for the qPCR recognised both transcript variants (see Supplementary Table S1), whereas the Illumina probe as reported on the McGill website (http://www.genomequebec.mcgill.ca/compgen/integrated_vervet_genomics/transcriptome/Illumina/index.html#) only recognises transcript variant 2 and is only on one exon. This may account for the different results, at least for ABHD12. With respect to TRPV1, the Illumina probe only recognises variant 3 [NM_080706.3] while our qPCR primer pair recognises all four transcript variants. This could explain the difference observed between the array data and the qPCR data, the latter being consistent with other studies. Indeed, Marincsák et al. (Citation45) reported that TRPV1 immunoreactivity was very low in the healthy tongue, but much increased in both SCC and in the epithelial tissue surrounding the tumour, and that this increase in the SCC, matched with an increase in mRNA for TRPV1, was not dependent upon the tumour grade. The increased mRNA for TRPV1 in SCC was confirmed by Sakakibara et al. (Citation46). TRPV1 receptor activation in non-neuronal tissue may be involved in cell proliferation (see (Citation45) for discussion). Although AEA is primarily considered as a ligand for CB receptors, it can also activate TRPV1, particularly under inflamed conditions (Citation47), and so an increase in both AEA formation and the accessibility of TRPV1 as a target in SCCOT may contribute to the tumour growth. With respect to DAGLA, the Illumina probe recognises the mRNA in the last exon alone, i.e. is not exon spanning as is the case with our qPCR primer pair. This could contribute to the difference observed between the array and qPCR data. In contrast, the probe for NAAA is similar to our primer pair in that it produces an amplicon that is intron skipping and recognises all three transcript variants. Finally, it was noted that the Illumina probe for MGLL only recognised two of the transcript variants (1 and 3), and in both cases, the probe–target was within a single exon (bases 509–558 of exon 1).
In conclusion, the present study has shown that at the mRNA level, the eCB system is disturbed in SCCOT compared to non-malignant tongue tissue. These findings motivate further investigations to determine (a) why there are differences between the array data and the qPCR data; (b) whether the changed expression is also seen in proteomic and enzyme activity studies; and (c) whether this change is involved in the pathogenesis of this cancer form.
Declaration of interest
The authors declare no conflict of interest.
Supplemental Material
Download MS Word (32.4 KB)Additional information
Funding
Notes
1 Västerbotten County, where Umeå is the largest town has an area of ∼55,000 km2 (i.e. about the same size as Croatia) and a current population of ∼268,000 individuals, so the catchment size of the University Hospital is small.
Related Research Data
References
- Ligresti A, De Petrocellis L, Di Marzo V. From phytocannabinoids to cannabinoid receptors and endocannabinoids: pleiotropic physiological and pathological roles through complex pharmacology. Physiol Rev. 2016;96(4):1593–659. doi:10.1152/physrev.00002.2016.
- Ligresti A, Bisogno T, Matias I, De Petrocellis L, Cascio MG, Cosenza V, et al. Possible endocannabinoid control of colorectal cancer growth. Gastroenterology. 2003;125(3):677–8. doi:10.1016/S0016-5085(03)00881-3.
- Chen L, Chen H, Li Y, Li L, Qiu Y, Ren J. Endocannabinoid and ceramide levels are altered in patients with colorectal cancer. Oncol Rep. 2015;34(1):447–54. doi:10.3892/or.2015.3973.
- Wasik AM, Nygren L, Almestrand S, Zong F, Flygare J, Wennerholm SB, et al. Perturbations of the endocannabinoid system in mantle cell lymphoma: correlations to clinical and pathological features. Oncoscience. 2014;1(8):550–7. doi:10.18632/oncoscience.77.
- Thors L, Bergh A, Persson E, Hammarsten P, Stattin P, Egevad L, et al. Fatty acid amide hydrolase in prostate cancer: association with disease severity and outcome, CB1 receptor expression and regulation by IL-4. PLoS One. 2010;5(8):e12275. doi:10.1371/journal.pone.0012275.
- Petersen G, Moesgaard B, Schmid P, Schmid H, Broholm H, Kosteljanetz M, et al. Endocannabinoid metabolism in human glioblastomas and meningiomas compared to human non-tumour brain tissue. J Neurochem. 2005;93(2):299–309. doi:10.1111/j.1471-4159.2005.03013.x.
- Hinz B, Ramer R. Anti-tumour actions of cannabinoids. Br J Pharmacol. 2019;176(10):1384–94. doi:10.1111/bph.14426.
- Nomura DK, Long JZ, Niessen S, Hoover HS, Ng S-W, Cravatt BF. Monoacylglycerol lipase regulates a fatty acid network that promotes cancer pathogenesis. Cell. 2010;140(1):49–61. doi:10.1016/j.cell.2009.11.027.
- Gustafsson SB, Palmqvist R, Henriksson ML, Dahlin AM, Edin S, Jacobsson SOP, et al. High tumour cannabinoid CB1 receptor immunoreactivity negatively impacts disease-specific survival in stage II microsatellite stable colorectal cancer. PLoS One. 2011;6(8):e23003. doi:10.1371/journal.pone.0023003.
- Warnakulasuriya S. Global epidemiology of oral and oropharyngeal cancer. Oral Oncol. 2009;45(4–5):309–16.
- Thangaraj SV, Shyamsundar V, Krishnamurthy A, Ramani P, Ganesan K, Muthuswami M, et al. Molecular portrait of oral tongue squamous cell carcinoma shown by integrative meta-analysis of expression profiles with validations. PLoS One. 2016;11(6):e0156582. doi:10.1371/journal.pone.0156582.
- Boldrup L, Bourdon JC, Coates PJ, Sjostrom B, Nylander K. Expression of p53 isoforms in squamous cell carcinoma of the head and neck. Eur J Cancer. 2007;43(3):617–23. doi:10.1016/j.ejca.2006.10.019.
- Boldrup L, Coates PJ, Hedberg Y, Sjostrom B, Dahlqvist A, Nylander K. Expression of p63, COX-2, EGFR and beta-catenin in smokers and patients with squamous cell carcinoma of the head and neck reveal variations in non-neoplastic tissue and no obvious changes in smokers. Int J Oncol. 2005;27(6):1661–7.
- Boldrup L, Coates PJ, Laurell G, Nylander K. Differences in p63 expression in SCCHN tumours of different sub-sites within the oral cavity. Oral Oncol. 2011;47(9):861–5. doi:10.1016/j.oraloncology.2011.07.002.
- Boldrup L, Gu X, Coates PJ, Norberg-Spaak L, Fahraeus R, Laurell G, et al. Gene expression changes in tumor free tongue tissue adjacent to tongue squamous cell carcinoma. Oncotarget. 2017;8(12):19389–402. doi:10.18632/oncotarget.14288.
- R Core Team. A language and environment for statistical computing. Vienna (Austria): R Foundation for Statistical Computing; 2019. Available from: https://www.r-project.org.
- Derrick B, Russ B, Toher D, White P. Test statistics for the comparison of means for two samples that include both paired and independent observations. J Mod App Stat Meth. 2017;16(1):137–57. doi:10.22237/jmasm/1493597280.
- Lawrence MA. ez: easy analysis and visualization of factorial experiments. R package version 4.4-0, published 2016 [cited 2019 Feb 8]. Available from: https://CRAN.R-project.org/package=ez.
- Benjamini Y, Hochberg Y. Controlling the false discovery rate: a practical and powerful approach to multiple testing. JR Statist Soc B. 1995;57(1):289–300. doi:10.1111/j.2517-6161.1995.tb02031.x.
- Pascual G, Avgustinova A, Mejetta S, Martín M, Castellanos A, Attolini CS, et al. Targeting metastasis-initiating cells through the fatty acid receptor CD36. Nature. 2017;541(7635):41–5. doi:10.1038/nature20791.
- Kaczocha M, Glaser S, Deutsch D. Identification of intracellular carriers for the endocannabinoid anandamide. Proc Natl Acad Sci USA. 2009;106(15):6375–80. doi:10.1073/pnas.0901515106.
- Nieuwenhuis S, Forstmann BU, Wagenmakers E-J. Erroneous analyses of interactions in neuroscience: a problem of significance. Nat Neurosci. 2011;14(9):1105–7. doi:10.1038/nn.2886.
- Cui X, Churchill GA. Statistical tests for differential expression in cDNA microarray experiments. Genome Biol. 2003;4(4):210. doi:10.1186/gb-2003-4-4-210.
- Rockett JC, Hellmann GM. Confirming microarray data – is it really necessary? Genomics. 2004;83(4):541–9. doi:10.1016/j.ygeno.2003.09.017.
- Allison DB, Cui X, Page GP, Sabripour M. Microarray data analysis: from disarray to consolidation and consensus. Nat Rev Genet.. 2006;7(1):55–65. doi:10.1038/nrg1749.
- Schagat T, Kiak L, Mandrekar M. RNA purification kit: comparison, yield, quality, and real-time, RT-PCR performance. Promega Notes 2008;99:12–15 [cited 2019 Apr 25]. Available from: https://promega.media/-/media/files/resources/promega-notes/99/rna-purification-kit-comparison-yield-quality-and-real-time-rt-pcr-performance.pdf?la=en.
- Tesena P, Korchunjit W, Taylor J, Wongtawan T. Comparison of commercial RNA extraction kits and qPCR master mixes for studying gene expression in small biopsy tissue samples from the equine gastric epithelium. J Equine Sci. 2017;28(4):135–41. doi:10.1294/jes.28.135.
- Ma W, Wang M, Wang ZQ, Sun L, Graber D, Matthews J, et al. Effect of long-term storage in TRIzol on microarray-based gene expression profiling. Cancer Epidemiol Biomarkers Prev. 2010;19(10):2445–52.
- Renkonen J, Wolff H, Paavonen T. Expression of cyclo-oxygenase-2 in human tongue carcinoma and its precursor lesions. Virchows Arch. 2002;440(6):594–7. doi:10.1007/s00428-002-0616-y.
- Minter HA, Eveson JW, Huntley S, Elder DJE, Hague A. The cyclooxygenase 2-selective inhibitor NS398 inhibits proliferation of oral carcinoma cell lines by mechanisms dependent and independent of reduced prostaglandin E2 synthesis. Clin Cancer Res. 2003;9(5):1885–97.
- Du Y, Zhang S, Wang Z, Zhou W, Luan M, Yang X, et al. Induction of apoptosis and cell cycle arrest by NS398 in oral squamous cell carcinoma cells via downregulation of E2 promoter-binding factor-1. Oncol Rep. 2008;20(3):605–11.
- Almahmeed T, Boyle JO, Cohen EG, Carew JF, Du B, Altorki NK, et al. Benzo[a]pyrene phenols are more potent inducers of CYP1A1, CYP1B1 and COX-2 than benzo[a]pyrene glucuronides in cell lines derived from the human aerodigestive tract. Carcinogenesis. 2004;25(5):793–9. doi:10.1093/carcin/bgh078.
- Sawhney M, Rohatgi N, Kaur J, Shishodia S, Sethi G, Gupta SD, et al. Expression of NF-κB parallels COX-2 expression in oral precancer and cancer: association with smokeless tobacco. Int J Cancer. 2007;120(12):2545–56. doi:10.1002/ijc.22657.
- Guttenplan JB, Kosinska W, Zhao Z-L, Chen K-M, Aliaga C, Del Tondo J, et al. Mutagenesis and carcinogenesis induced by dibenzo[a,l]pyrene in the mouse oral cavity: a potential new model for oral cancer. Int J Cancer. 2012;130(12):2783–970. doi:10.1002/ijc.26344.
- Yamamoto K, Kitayama W, Denda A, Morisaki A, Kuniyasu H, Kirita T. Inhibitory effects of selective cyclooxygenase-2 inhibitors, nimesulide and etodolac, on the development of squamous cell dysplasias and carcinomas of the tongue in rats initiated with 4-nitroquinoline 1-oxide. Cancer Lett. 2003;199(2):121–9.
- Yang S-F, Chen M-K, Hsieh Y-S, Chung T-T, Hsieh Y-H, Lin C-W, et al. Prostaglandin E2/EP1 signaling pathway enhances intercellular adhesion molecule 1 (ICAM-1) expression and cell motility in oral cancer cells. J Biol Chem. 2010;285(39):29808–16. doi:10.1074/jbc.M110.108183.
- Ueda N, Tsuboi K, Uyama T. Metabolism of endocannabinoids and related N-acylethanolamines: canonical and alternative pathways. FEBS J. 2013;280(9):1874–94. doi:10.1111/febs.12152.
- Alhouayek M, Muccioli GG. COX-2-derived endocannabinoid metabolites as novel inflammatory mediators. Trends Pharmacol Sci. 2014;35(6):284–92. doi:10.1016/j.tips.2014.03.001.
- Soliman E, Henderson KL, Danell AS, Van Dross R. Arachidonoyl-ethanolamide activates endoplasmic reticulum stress-apoptosis in tumorigenic keratinocytes: role of cyclooxygenase-2 and novel J-series prostamides. Mol Carcinog. 2016;55(2):117–30. doi:10.1002/mc.22257.
- Ogura Y, Parsons WH, Kamat SS, Cravatt BF. A calcium-dependent acyltransferase that produces N-acyl phosphatidylethanolamines. Nat Chem Biol. 2016;12(9):669–71. doi:10.1038/nchembio.2127.
- Grabner GF, Zimmermann R, Schicho R, Taschler U. Monoglyceride lipase as a drug target: at the crossroads of arachidonic acid metabolism and endocannabinoid signalling. Pharmacol Ther. 2017;175:35–46. doi:10.1016/j.pharmthera.2017.02.033.
- Sun H, Jiang L, Luo X, Jin W, He Q, An J, et al. Potential tumor-suppressive role of monoglyceride lipase in human colorectal cancer. Oncogene. 2013;32(2):234–41. doi:10.1038/onc.2012.34.
- Xiang W, Shi R, Kang X, Zhang X, Chen P, Zhang L, et al. Monoacylglycerol lipase regulates cannabinoid receptor 2-dependent macrophage activation and cancer progression. Nat Commun. 2018;9(1):2574. doi:10.1038/s41467-018-04999-8.
- Fiskerstrand T, H’Mida-Ben Brahim D, Johansson S, M’Zahem A, Haukanes BI, Drouot N, et al. Mutations in ABHD12 cause the neurodegenerative disease PHARC: an inborn error of endocannabinoid metabolism. Am J Hum Genet. 2010;87(3):410–7. doi:10.1016/j.ajhg.2010.08.002.
- Marincsák R, Tóth BI, Czifra G, Márton I, Rédl P, Tar I, et al. Increased expression of TRPV1 in squamous cell carcinoma of the human tongue. Oral Dis. 2009;15(5):328–35. doi:10.1111/j.1601-0825.2009.01526.x.
- Sakakibara A, Sakakibara S, Kusumoto J, Takeda D, Hasegawa T, Akashi M, et al. Upregulated expression of transient receptor potential cation channel subfamily V receptors in mucosae of patients with oral squamous cell carcinoma and patients with a history of alcohol consumption or smoking. PLoS One. 2017;12(1):e0169723. doi:10.1371/journal.pone.0169723.
- Singh Tahim A, Sántha P, Nagy I. Inflammatory mediators convert anandamide into a potent activator of the vanilloid type 1 transient receptor potential receptor in nociceptive primary sensory neurons. Neuroscience. 2005;136(2):539–48. doi:10.1016/j.neuroscience.2005.08.005.