
 ?Mathematical formulae have been encoded as MathML and are displayed in this HTML version using MathJax in order to improve their display. Uncheck the box to turn MathJax off. This feature requires Javascript. Click on a formula to zoom.
Abstract
Background: Non-small cell lung cancer (NSCLC) is the first cause of cancer-related mortality for men and women in the United States. In spite of curative resection in early-stage, patient survival is not optimal and recurrence rate is high. Consequently, early detection and staging is essential to increase the patient’s survival.
Methods: Copy number (CN) changes in cancer populations have been broadly investigated to identify CN gains and deletions associated with cancer. In contrast, in this research, we quantify the similarities and disparities between cancer and paired peripheral blood samples using maximal information coefficient (MIC). We then detect the spatial locations with substantially high and the spatial locations with very low MICs in each chromosome. These locations can potentially help with early diagnosis, treatment, and prevention of cancer by identifying the similarities and disparities between cancer and healthy tissues.
Results: Lung cancer data used in this project contains CN pairs for cancer and blood (non-involved) samples for 63 subjects. MIC was obtained to quantify the relation (linear or nonlinear) between cancer-blood pair samples for 63 subjects at each location for each chromosome. MIC values above a high threshold and MIC values below a low threshold were located. Among them top five (with lowest MIC’s and with highest MIC’s) were identified for each chromosome. For these identified locations, a high MIC score indicates high similarity between blood (non-involved) and cancer samples, while a low MIC score shows lack of similarity between the two samples.
Conclusions: The results showed that a few chromosomes have a large number of MICs exceeding a high threshold. These locations can potentially be used to identify early indicators of NSCLC. In contrast, second group of chromosomes have several locations with small MICs which are potential candidates to develop biomarkers for discriminating cancer from the matched blood sample. Moreover, there is a third group of chromosomes with a large number of MICs exceeding a high threshold and a large set of MICs below a low threshold. These locations can help with both finding early indicators of cancer and developing biomarkers for discriminating cancer from non-involved tissue.
1. Background
Gene-cancer mapping helps to discover genes that are associated with disease, such as cancer. With improvements in high-throughput genotyping in the past two decades, it is possible to screen for disease loci on a genome-wide scale. The recent improvement in high throughput genotyping has been a result of the development of computational methods for human gene-related diseases (Citation1–7). To this end, human gene-cancer mapping has been investigated intensively to address cancer association with single-nucleotide polymorphism (SNP) and copy number (CN) changes (Citation8–11). CN changes that can lead to cancer have been under investigation (Citation12–14) and discovery of correlation between cancer and healthy tissue is a subject of ongoing research.
In our previous works (Citation14–16), to discover population patterns, i.e., CN changes that are common among populations, we integrated the population summaries and located genes that have significant differences in the mean CNs between cancer and non-involved tissue (Citation15). We also identified regions with significantly amplified or deleted CNs (Citation14). In contrast, in this work, correlations between cancer and blood (non-involved) samples are measured at each individual location of each chromosome to identify the spatial locations with high and low correlations with regard to CN. Mapping these correlations is very useful, since identifying locations with high similarities in cancer and blood (non-involved) samples can potentially be used as early indicators of cancer in the non-involved cells. On the other hand, identifying locations with low similarities (disparities) in cancer and blood (non-involved) samples, can be used to discriminate cancer from healthy cells.
2. Data description
A set of 63 early stage (1–2) non-small cell lung cancer (NSCLC) patients were prospectively enrolled at the Massachusetts General Hospital (MGH), Boston, MA (Citation10, Citation11). A snap-frozen tumor sample was gathered for each patient during biopsy or surgery in addition to a blood sample. shows the structure of the data. The scores are related to CN changes which range from 1 to 3; values below two indicates deleted CNs while values above two indicates gained CNs.
Table 1. Structure of the data for chromosome 2 (as an example).
2.1. DNA quality, histopathology and genechip
DNA samples were extracted from tumor after manual microdissection of 5 µ histopathologic sections. A pathologist who had no knowledge of the clinical and genetic information reviewed section of each patient. Each specimen was evaluated for amount and quality of tumor cells and histologically classified using the WHO criteria. Specimens with lower than 70% cancer cellularity, inadequate DNA concentration (50 ng/µL), or a smearing pattern in gel electrophoresis were not included for genotyping. A total of 126 DNA samples (63 from tumors and 63 from paired blood) were hybridized onto Affymetrix 250 K Nsp GeneChipH, which contains 262,264 probes (256,554 probes on somatic chromosomes and 5710 probes on sex chromosome).
2.2. Data preprocessing
CNs were obtained with dChip software. The probe intensities were calculated by model-based expression after invariant set normalization. For each SNP in each sample, the raw CN was computed (mean signal of reference samples at this SNP) using blood samples as the referent. Inferred CNs were computed from the raw CNs by median smoothing with the window of 11 SNPs for each locus of 262,264 SNPs. Only 256,554 probes on somatic chromosomes were analyzed. The SNP probes were mapped to the RefSeq genes with 2 kb extension both upstream and downstream using the UCSC Genome Browser. Among the 256,554 probes on somatic chromosomes, 104,256 probes were mapped to 11,700 genes.
3. Methods
In order to discover locations with high similarities between cancer and blood samples as well as recognizing locations to discriminate cancer from blood (non-involved) samples, we compute maximal information coefficient (MIC) at each SNP location of each chromosome between cancer and blood samples for 63 patients. For example for chromosome 2, we will have 22,215 MIC values corresponding to each SNP location in this chromosome.
MIC takes a value between zero and one (Citation17) and can identify linear and nonlinear associations. MIC values above 0.5 demonstrate substantial correlation (similarities) while MIC values below 0.2 indicate low or no correlation (disparities) between the samples. MIC for the location for a typical chromosome is calculated by (Citation18):
(1)
(1)
where
(2)
(2)
where
is the joint probability distribution of
blood and
cancer samples, respectively,
and
are the marginal distributions of
blood sample and
cancer sample, respectively,
and
are the number of bins for the partition of the blood-axis and cancer-axis, respectively,
where
and
is the sample size
After calculating MIC values for all SNP locations in all chromosomes, we identify spatial locations with considerably high or notably low correlation scores between cancer and blood samples. To do this, we locate MIC values that are at least two standard deviations away from the mean MIC of the chromosome, i.e., [MICi < or
MICi] where
and
are the sample mean and standard deviation of MIC values of the chromosome, respectively. Estimated
for different chromosomes are about 0.3 and hence the lower threshold of
is below 0.2 for all chromosomes. MICs falling below this threshold indicate no or weak correlation between cancer and blood samples. In contrast, the upper threshold of
is about 0.4 which indicates moderate correlation and there are several MIC values that are above this threshold. In order to identify substantial correlations (MIC >0.5), we set the threshold value to 0.5, 0.55, and 0.6 and calculate the number of standard deviations that the set threshold is above the mean:
(3)
(3)
where
is the set threshold. MIC scores higher than these thresholds indicate high correlations (similarities).
4. Results
As previously mentioned, lung cancer data contains CN pairs for cancer and blood (non-involved) samples for 63 patients. The correlation measure, i.e., MIC, was obtained at each location for each chromosome, and MIC values above upper threshold and below lower threshold were located. Among them top five (lowest as well as highest) were identified for each chromosome. A high MIC score at an identified location indicates high similarity between blood (non-involved) and cancer samples, while a low MIC score shows lack of similarity between the two samples.
The results obtained for chromosomes 1–6 are depicted in , chromosomes 7–12 in , chromosomes 13–18 in , and chromosomes 19–22 in . A gray dot represents the calculated MIC value at a spatial location, the solid black line is the mean MIC value for the chromosome, the dashed black line is the lower threshold, and the dashed blue, green, and red lines show upper threshold of 0.5, 0.55, and 0.6, respectively.
Figure 1. MIC scores for chromosomes 1–6 (gray dots), mean MIC value (solid black line), lower threshold (dashed black line), and upper thresholds of 0.5, 0.55, and 0.6 (dashed blue, dashed green, and dashed red lines, respectively).
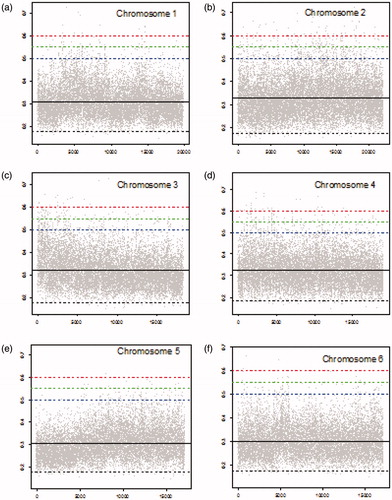
Figure 2. MIC scores for chromosomes 7–12 (gray dots), mean MIC value (solid black line), lower threshold (dashed black line), and upper thresholds of 0.5, 0.55, and 0.6 (dashed blue, dashed green, and dashed red lines, respectively).
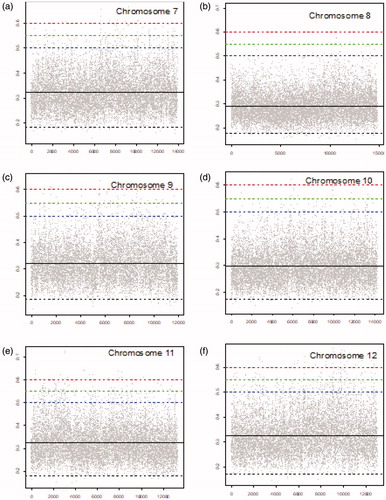
Figure 3. MIC scores for chromosomes 13–18 (gray dots), mean MIC value (solid black line), lower threshold (dashed black line), and upper thresholds of 0.5, 0.55, and 0.6 (dashed blue, dashed green, and dashed red lines, respectively).
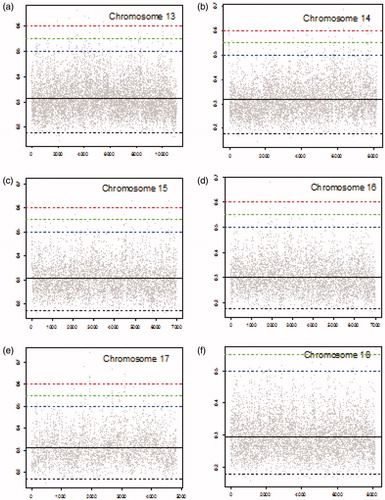
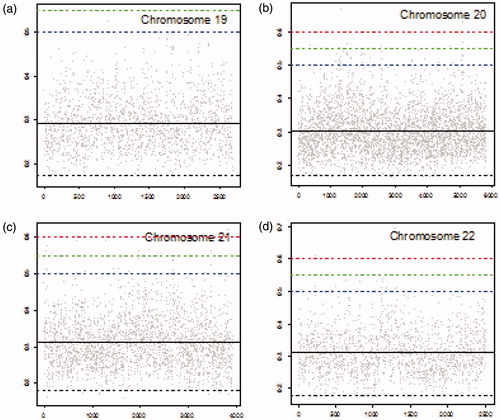
Figure 4. MIC scores for chromosomes 19–22 (gray dots), mean MIC value (solid black line), lower threshold (dashed black line), and upper thresholds of 0.5, 0.55, and 0.6 (dashed blue, dashed green, and dashed red lines, respectively).
4.1. Chromosomes with high similarities between cancer and blood
summarizes the number of locations with corresponding MIC values greater than specified threshold of 0.5, 0.55, or 0.6 for each chromosome. MIC values above 0.5 indicate substantial correlations (similarities) between the cancer and the blood sample which is potentially related to the early stage of cancer. We should point out that the numbers of locations with MIC values exceeding the thresholds are cumulative. That is the numbers of locations with MIC values higher than 0.55 contains numbers of locations with MIC values higher than 0.6, and similarly the numbers of locations with MIC values higher than 0.5 contains numbers of locations with MIC values higher than 0.55 and higher than 0.6. As shown in , chromosome 2 has the highest number of locations with MIC values exceeding all three thresholds. There are 594 locations with MICs above 0.5, among them 199 locations with MICs above 0.55 from which 58 locations with MICs above 0.6 in this chromosome. Chromosome 4 is in the second place with regard to the number of locations with MIC values exceeding 0.5. However, it is in the third place with regard to the locations with MIC values exceeding 0.55 and 0.6. Chromosome 3 is in the third place with 348 locations with MIC values exceeding 0.5. However, it has the second highest number of locations with MIC values exceeding 0.55. Chromosome 12 has the second highest number of locations with MIC values exceeding 0.6. In contrast with chromosomes 2, 3, 4, and 12, chromosome 19 has only 4 locations with corresponding MIC values greater than 0.5, none of them greater than 0.55.
Table 2. Number of locations with corresponding MIC values greater than thresholds for a = (0.5, 0.55, 0.6).
4.2. Top five locations with high similarities in each chromosome
The spatial locations and associated MIC values of top five MICs in descending order are listed in for each chromosome. For example, the locations in the chromosome 2 (with the highest number of locations with MIC values exceeding all three thresholds) associated with top five MIC values are 193.11, 98.29, 193.13, 193.13, and 98.36.
Table 3. Spatial locations in each chromosome associated with top five highest MIC values.
Number of standard deviations a set threshold (0.5, 0.55, and 0.6) is above the mean MIC is reported in for each chromosome. For instance, the upper threshold of 0.5 is 3.56 standard deviation (σ) away from the mean for chromosome 19 which is the highest number of standard deviations for threshold 0.5 among all chromosomes. That is, MIC values above 0.5 are at least 3.56σ higher than the mean MIC in chromosome 19 (). shows that only a few MIC values exceed the threshold of 0.5 in chromosome 19. In contrast, the threshold of 0. 6 has the smallest number of standard deviations above the mean (3.57σ) for chromosome 12 (). This is consistent with observing a high number of locations (38) with MIC values exceeding 0.6 in chromosome 12 ().
Table 4. Number of standard deviations that a set threshold is above the mean for a = (0.5, 0.55, and 0.6).
4.3. Chromosomes with low similarities between cancer and blood
shows the number of locations in each chromosome with corresponding MIC values below the specified threshold of MIC values below this threshold indicate weak or no similarities between the two samples (cancer and blood), and hence these locations can potentially help for discriminating cancer from non-involved that can be used for diagnosis. Chromosome 8 has the highest number of locations (62) with MIC values below the lower threshold. Chromosome 4 with 57 locations is the second, and chromosome 6 is the third with 54 locations with MIC values below the threshold. ), and Citation2(b) demonstrate the MIC values for these locations in chromosomes 4, 6, and 8. In contrast as shown in ) and , there are only a few locations with MIC values below threshold in chromosomes 15, 17, 19, and 22. It means there are fewer locations in these chromosomes that can be used to differentiate cancer from blood (non-involved) sample. Top five locations with regard to dissimilarities between cancer and blood, i.e., the locations in each chromosome with the smallest MIC values (below 0.17) are listed in ascending order in . These locations indicate low or very weak similarity between cancer and non-involved (blood) and can potentially be used for lung cancer diagnosis. Top five locations in chromosome 8 (with the highest number of such locations) are at 123.84, 41.17, 96.86, 83.97, and 78.06.
Table 5. Number of locations with corresponding MIC values less than the threshold of μ – 2σ (μ and σ are the MIC mean and standard deviation, respectively).
Table 6. Spatial locations in each chromosome associated with top five smallest MIC values.
4.4. Top 10 locations with high similarities among all chromosomes
Next, we identify top 10 locations with highest MIC values among all chromosomes (). We can see that top two highest MIC values of 0.750 and 0.749 are located in chromosome 4 at locations 46.18 and 16.94, respectively. As we saw earlier, chromosome 4 has the second highest number of locations with MIC values exceeding the upper threshold. It has also the second highest number of the locations with MIC values below the lower threshold. Therefore, chromosome 4 is a potential candidate for discrimination of cancer from blood (non-involved), and it could potentially contain lung cancer-related genes.
Table 7. Spatial locations among all chromosomes associated with top 10 highest MIC values.
Chromosome 11 has also several locations with MIC values above the threshold (). The top five MIC values in chromosome 11 are 0.724, 0.717, 0.701, 0.642, and 0.642 associated with spatial locations at 26.26, 26.26, 26.26, 42.15, and 5.05, respectively (). As shown in , two of them (0.724 and 0.717) are among the top 10 chromosome-wide MIC values (the sixth and the ninth highest MIC values). These MIC values locate positions with high similarities between the CN changes in cancer and blood samples. As a result, chromosome 11 can be a good candidate for early indicator of cancer in healthy tissues.
Chromosome 3 has 348 locations with MIC values exceeding 0.5 () including fifth and tenth highest MIC values (). As listed in , remaining top 10 locations with regard to MIC values are in chromosomes 17, 1, 5, and 2. Among them, chromosome 2 has the highest number of locations exceeding thresholds 0.5, 0.55, and 0.6. Hence, these chromosomes are potential candidates for early indication of cancer ().
4.5. Top 10 locations with low similarities among all chromosomes
summarizes the locations associated with top 10 locations among all chromosomes with lowest MIC values. Chromosome 5 has 45 locations with MIC values below threshold ( and ), two of them among top 10 smallest MIC values (0.127 and 0.145) at 121.80 and 163.29, respectively. The remaining locations among top 10 smallest values are in chromosomes 1, 4, and 6 (). Therefore, these locations are the possible candidates to discriminate cancer from peripheral blood samples and potentially can help with lung cancer diagnosis.
Table 8. Spatial locations among all chromosomes associated with top 10 lowest MIC values.
5. Discussion
We used MIC to identify the underlying relationships between CN’s of cancer-blood pairs regardless of whether the relation is linear or nonlinear. The results showed that Chromosome 12 has a large number of MICs exceeding the upper threshold. These locations can potentially be used to identify early indicators of NSCLC. In contrast, several locations in chromosomes 1, 5, 6, and 8 with small MICs are potential candidates to develop biomarkers for discriminating cancer from matched blood samples. Moreover, chromosome 2, 3, and 4 have a large number of MICs exceeding the upper threshold and a large set of MICs below the lower threshold. These locations can help with both finding early indicators of cancer and developing biomarkers for discriminating cancer from non-involved tissue. As a result, these chromosomes may contain lung cancer-associated genes. The results agree with previous research (Citation9, Citation10, Citation15). Our future work is focused on identifying the associated genes with the located peaks in each chromosome.
6. Conclusions
In our previous work, we investigated common CN changes among cancer population. In this work, we studied correlations between cancer and matched blood samples by measuring MIC at each spatial location of each chromosome. In this way, we generated MIC values for all chromosomes for a sample of 63 patients. In the next step, we set up thresholds to locate MIC values that exceed upper threshold or fall below the lower threshold. Finally, we identified top five highest and top five smallest MIC values in each chromosome as well as top 10 largest and top 10 smallest MIC values among all chromosomes. High MIC values demonstrate locations with potential similarities between CN changes in cancer and blood samples, while low MIC values point to locations with potential disparity between the two samples. Similarity between the samples can be used as early indicator of cancer in healthy tissues. In contrast, disparity between the samples can help with lung cancer diagnosis.
We should point out that in this study, the spatial locations with high similarities were observed in cancer and blood samples collected from early stage lung cancer patients where blood samples were considered as primary control. Further investigation will be conducted with a secondary control from matched healthy samples to narrow down the list of spatial locations with high similarities between cancer and blood samples. Moreover, future investigation can reveal the potential interactions between the spatial locations with high MIC values of cancer-blood pairs in a chromosome.
Acknowledgments
This work was partially supported by NIH grant: U01 CA209414 to Dr. David C. Christiani.
Disclosure statement
The authors report no conflicts of interest. The authors alone are responsible for the content and writing of the article.
Related Research Data
References
- Muggeo VM, Adelfio G. Efficient change point detection for genomic sequences of continuous measurements. Bioinformatics. 2011;27(2):161–166. doi:10.1093/bioinformatics/btq647.
- Wang Y, Wu C, Ji Z, Wang B, Liang Y. Non-parametric change-point method for differential gene expression detection. PloS One. 2011;6(5):e20060. doi:10.1371/journal.pone.0020060.
- Lai Y, Zhao H. A statistical method to detect chromosomal regions with DNA copy number alterations using SNP-array-based CGH data. Computat Biol Chem. 2005;29(1):47–54. doi:10.1016/j.compbiolchem.2004.12.004.
- Li W, Lee A, Gregersen PK. Copy-number-variation and copy-number-alteration region detection by cumulative plots. BMC Bioinformat. 2009;10(S1):S67. doi:10.1186/1471-2105-10-S1-S67.
- Takeuchi I, Tagawa H, Tsujikawa A, Nakagawa M, Katayama-Suguro M, Guo Y, Seto M. The potential of copy number gains and losses, detected by array-based comparative genomic hybridization, for computational differential diagnosis of B-cell lymphomas and genetic regions involved in lymphomagenesis. Haematologica. 2009;94(1):61–69. doi:10.3324/haematol.12986.
- Pollack JR, Perou CM, Alizadeh AA, Eisen MB, Pergamenschikov A, Williams CF, Jeffrey SS, Botstein D, Brown PO. Genome-wide analysis of DNA copy-number changes using cDNA microarrays. Nat Genet. 1999;23(1):41. doi:10.1038/12640.
- Carter NP. Methods and strategies for analyzing copy number variation using DNA microarrays. Nat Genet. 2007;39(S7):S16. doi:10.1038/ng2028.
- Kim TM, Yim SH, Lee JS, Kwon MS, Ryu JW, Kang HM, et al. Genome-wide screening of genomic alterations and their clinicopathologic implications in non–small cell lung cancers. Clin Cancer Res. 2005;11(23):8235–8242. doi:10.1158/1078-0432.CCR-05-1157.
- Weir BA, Woo MS, Getz G, Perner S, Ding L, Beroukhim R, Lin WM, Province MA, Kraja A, Johnson LA, et al. Characterizing the cancer genome in lung adenocarcinoma. Nature. 2007;450(7171):893. doi:10.1038/nature06358.
- Huang YT, Lin X, Liu Y, Chirieac LR, McGovern R, Wain J, et al. Cigarette smoking increases copy number alterations in nonsmall-cell lung cancer. Proc Natl Acad Sci. 2011;108(39):16345–16350. doi:10.1073/pnas.1102769108.
- Huang Y-T, Lin X, Chirieac LR, McGovern R, Wain JC, Heist RS, Skaug V, Zienolddiny S, Haugen A, Su L, et al. Impact on disease development, genomic location and biological function of copy number alterations in non-small cell lung cancer. PLoS One. 2011;6(8):e22961. doi:10.1371/journal.pone.0022961.
- Henrichsen CN, Chaignat E, Reymond A. Copy number variants, diseases and gene expression. Human Mol Gen. 2009;18(R1):R1–R8. doi:10.1093/hmg/ddp011.
- Bailey JA, Kidd JM, Eichler EE. Human copy number polymorphic genes. Cytogenet Genome Res. 2008;123(1–4):234–243. doi:10.1159/000184713.
- Kachouie NN, Lin X, Christiani DC, Schwartzman A. Detection of local DNA copy number changes in lung cancer population analyses using a multi-scale approach. Commun Stat. 2015;1(4):206–216. doi:10.1080/23737484.2016.1197079.
- Kachouie NN, Christiani DC. DNA copy number gain in lung cancer and non-involved tissue. J Bioanal Biostat. 2016;1(1):1–5.
- Kachouie NN, Lin X, Schwartzman A. FDR control of detected regions by multiscale matched filtering. Commun Statist. 2017;46(1):127–144. doi:10.1080/03610918.2014.957842.
- Reshef DN, Reshef YA, Finucane HK, Grossman SR, McVean G, Turnbaugh PJ, Lander ES, Mitzenmacher M, Sabeti PC. Detecting novel associations in large data sets. Science. 2011;334(6062):1518–1524. doi:10.1126/science.1205438.
- Zhang Y, Jia S, Huang H, Qiu J, Zhou C. A novel algorithm for the precise calculation of the maximal information coefficient. Sci Rep. 2015;4(1):6662.