
 ?Mathematical formulae have been encoded as MathML and are displayed in this HTML version using MathJax in order to improve their display. Uncheck the box to turn MathJax off. This feature requires Javascript. Click on a formula to zoom.
Abstract
Chronic inflammation promotes the development of pancreatic ductal adenocarcinoma (PDAC) and PDAC-related inflammatory tumor microenvironment facilitates tumor growth and metastasis. Thus, we aimed to study the association between inflammatory response and prognosis in patients with PDAC. We conducted the whole transcriptomic sequencing using tissue samples collected from patients diagnosed with PDAC (n = 106) recruited from Shandong Cancer Hospital. We first constructed a prognostic signature using 15 inflammation-related genes in The Cancer Genome Atlas (TCGA) cohort (n = 177) and further validated it in an independent International Cancer Genome Consortium (ICGC) cohort (n = 90) and our in-house cohort. PDAC patients with a higher risk score had poorer overall survival (OS) (P < 0.001; HR, 3.02; 95% CI, 1.94-4.70). The association between the prognostic signature and OS remained significant in the multivariable Cox regression adjusting for age, sex, alcohol exposure, diabetes, and stage (P < 0.001; HR, 2.91; 95% CI, 1.73-4.89). This gene signature also robustly predicted prognosis in the ICGC cohort (P = 0.01; HR, 1.94; 95% CI, 1.14-3.30) and our cohort (P < 0.001; HR, 2.40; 95% CI, 1.45-3.97). Immune subtype C3 (inflammatory) was enriched and CD8+ T cells were higher in patients with a lower risk score (P < 0.05). Furthermore, PDAC patients with higher risk scores were more sensitive to chemotherapy, immunotherapy, and PARP inhibitors (P < 0.05). In sum, we identified a novel gene signature that was associated with inflammatory response for risk stratification, prognosis prediction, and therapy guidance in PDAC patients. Future studies are warranted to validate the clinical utility of the signature.
Introduction
Pancreatic cancer is the seventh leading cause of cancer-related deaths worldwide, with a 5-year survival rate of 11% (Citation1, Citation2). Pancreatic ductal adenocarcinoma (PDAC) accounts for the majority (90%) of pancreatic neoplasms (Citation2). Surgical resection is the only curative treatment and significantly improves the 5-year survival rate to 20–30%. However, only less than 20% of patients are suitable for surgical resection, as most patients have advanced cancers at the time of presentation (Citation3). For metastatic disease, first-line treatment varies and is influenced largely by the Eastern Cooperative Oncology Group performance status (ECOG PS). For those with an ECOG PS of either 0 or 1, patients are typically offered either FOLFIRINOX or Gemcitabine plus Nab-Paclitaxel. For patients with an ECOG PS of 2, Gemcitabine is recommended in monotherapy, though agents such as Capecitabine can be offered in combination (Citation4). For more severely disabled patients with an ECOG PS of 3 or 4, or those with severe comorbidity, therapy is only offered on a case-by-case basis (Citation5). For BRCA-mutated patients, the PARP inhibitor Olaparib has shown significant efficacy as maintenance therapy, specifically for patients who had not progressed during first-line platinum-based chemotherapy (Citation6). In addition, there are some promising clinical trials and investigations ongoing, including inhibitors of protein phosphatase 2 A (LB-100) (Citation7), focal adhesion kinase (C4) (Citation8, Citation9), mitogen-activated protein kinase (CI-1040) (Citation10), proteasome (marizomib, NPI-0052) (Citation11, Citation12), and pyruvate dehydrogenase kinases-targeting derivatives (Citation13). Despite lots of improvements both in diagnosis and treatment modality, the prognosis of patients with PDAC remains unfavorable (Citation14). One of the reasons for the poor prognosis of PDAC is the lack of effective prognostic models to guide precision therapy.
The association between inflammation and cancer has been extensively studied. The first indication of a possible link between inflammation and cancer is provided by Rudolf Virchow, who observed the presence of leukocytes within tumors in the 19th century (Citation15). In recent decades, substantial progress has been made in elucidating the role of inflammation in tumorigenesis, providing clear evidence of molecular mechanisms to support this association (Citation16). In PDAC, only a minority of all cancers are caused by germline mutations, while the vast majority—about 90%, are related to somatic mutations and environmental factors. Chronic inflammation has emerged as a significant contributing factor in the development of PDAC (Citation17). Inflammation exerts a dual influence on cancers, demonstrating both anti-tumorigenic and pro-tumorigenic functions. Inflammation can impact the host immune response to tumors potentially enhancing the efficacy of cancer immunotherapy. However, in certain circumstances, inflammation may hinder or compromise the therapeutic benefits of treatment (Citation18, Citation19).
PDAC commonly arises in the setting of chronic pancreatitis and characterized by an inflammatory environment. In the context of pancreatitis, mutations in KRAS, the universal oncogenic driver of PDAC, play a crucial role in promoting accelerated tumor development and induce the appearance of neoplastic precursor lesions, such as acinar-to-ductal metaplasia and pancreatic intraepithelial neoplasia, which can evolve into invasive tumors (Citation20, Citation21). Additionally, IL-33-simulated macrophages promote the metastasis of PDAC through CXCL3-CXR2 axis (Citation22). Pro-tumorigenic inflammation promotes cancer by blocking anti-tumor immunity, transforming tumor microenvironment (TME) into a more tumor-permitting state, and directly releasing tumor-promoting signals (Citation23). A growing number of studies support the incorporation of various inflammatory markers to establish a comprehensive inflammatory prognostic score for cancers (Citation24–28). However, the relationship between genes associated with inflammatory response and prognosis of PDAC remains unclear.
Therefore, in the present study, we aimed to construct and validate a prognostic signature by utilizing differentially expressed genes (DEGs) associated with inflammatory responses. Additionally, we conducted further analyses to investigate the functional enrichment of these genes, elucidate the underlying mechanisms, and assess the relationship between gene expression patterns and various immune characteristics. These findings hold potential for their contribution towards personalized therapeutic strategies for PDAC patients in clinical practice.
Material and methods
Patient cohorts and study design
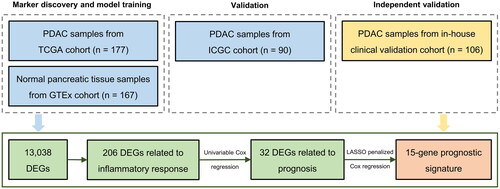
We enrolled patients with PDAC who underwent surgery at the Shandong Cancer Hospital, Jinan, P. R. China. Tissue samples from these patients (n = 106) were subjected to whole transcriptomic sequencing. RNA-seq data of 177 PDAC samples and 167 normal pancreatic tissue samples and the corresponding clinical information were retrieved from the UCSC Xena website (https://xenabrowser.net/datapages/). PDAC samples were derived from The Cancer Genome Atlas (TCGA) database, while the RNA-seq dataset of normal pancreatic samples was derived from the Genotype-Tissue Expression (GTEx) database. Another cohort consisting of RNA-seq data and clinical information of 90 tumor samples was downloaded from the International Cancer Genome Consortium (ICGC) website (https://dcc.icgc.org/projects/PACA-AU). TCGA, GTEx, and ICGC data are public, and the data access policies and publishing guidelines were followed. We first constructed an inflammatory signature using TCGA dataset and validated it in the ICGC cohort, and then independently validated the signature in our cohort ().
Figure 1. Flow chart of the study. Abbreviations: PDAC = pancreatic ductal adenocarcinoma, DEGs = differentially expressed genes.
This study was conducted in accordance with the Declaration of Helsinki and approved by the Institution Review Board of Shandong Cancer Hospital (approval no. SDZLEC2021-136). The written informed consents were obtained from all patients. The clinicopathologic characteristics of the three cohorts included in this study are summarized in .
Table 1. Clinicopathologic characteristics of the patients with PDAC in TCGA cohort, ICGC cohort, and our clinical validation cohort.
Data processing
A total of 1,153 genes related to inflammatory response were derived from the National Center for Biotechnology Information (NCBI) gene database (https://www.ncbi.nlm.nih.gov/gene).
Sequencing data of our cohort were filtered by Trimmomaticv 0.36. The cleaned sequencing data were aligned to the human reference genome (University of California, Santa Cruz or UCSC hg19 assembly) through a Spliced Trans Alignment to a Reference (STAR2, version: 2.7.3a). The cleaned sequence reads were then used for further qualification of gene expression and the transcripts per kilobase million (TPM) values for each gene were used in our study.
Functional enrichment analysis
Gene Ontology (GO) analysis is a premier bioinformatics tool for genes and their product annotation, including three categories: cellular component (CC), molecular function (MF), and biological pathway (BP). Kyoto Encyclopedia of Genes and Genomes (KEGG) is a collection of databases that contain information about genomes, biological pathways, diseases, and chemicals. The “clusterProfiler” package was used to perform GO functional enrichment analysis and KEGG pathway analysis for DEGs associated with inflammatory response.
Construction and validation of a prognostic gene signature associated with inflammatory response
DEGs between tumor and normal tissues were identified by “limma” R package in the TCGA cohort with the cutoff value determined as |log2 (fold change)| > 0.585 and adjusted P value < 0.05. Univariable Cox regression analysis was used to screen inflammatory response-related genes with prognostic value. The Least Absolute Shrinkage and Selection Operator (LASSO) penalized Cox regression analysis was used to construct a prognostic model to minimize the risk of overfitting. The LASSO algorithm selects and contracts the variables through “glmnet” R package so that some of the regression coefficients are strictly equal to zero, resulting in an interpretable model. The standardized expression matrix of candidate prognostic DEGs was set as the independent variables. The OS of patients and the corresponding status was set as the dependent variable in the LASSO regression. The risk score for each patient was calculated according to the expression value of genes associated with inflammatory response and their corresponding regression coefficients:
“n” is the number of prognostic genes, “expi” is the expression value of gene i, and “βi” is the regression coefficient of gene i
Patients were divided into high-risk and low-risk groups based on the median value of risk scores, and survival analysis was performed by “survival” R package to analyze OS in high-risk and low-risk groups. The “timeROC” R package was used for time-dependent receiver operating characteristic (ROC) curve analysis to evaluate the predictive value of the prognostic gene signature. In addition, univariable and multivariable Cox regression analyses were also performed to explore the independent prognostic value of the risk score. Finally, the same formula was used to calculate the risk score for the validation cohorts.
Comparison of immune characteristics between risk groups
Immune characteristic data of TCGA cohort was derived from Thorsson’s study (Citation29), which includes six pan-cancer immune subtypes, leukocyte fraction, stromal fraction, proliferation, wound healing, macrophage regulation, lymphocyte infiltration, INF-gamma response, TGF-beta response, angiogenesis, and tumor mutational burden (TMB). Comparison was performed between the high- and low-risk groups in the TCGA cohort.
Tumor microenvironment cell infiltration assessment
CIBERSORTx (https://CIBERSORTxx.stanford.edu/) web tool was used to calculate the infiltrating fraction of 22 types of immune cells both in the PDAC samples of TCGA cohort and our cohort. The default parameters were used.
Drug sensitivity analysis
The “pRRophetic” algorithm based on Genomics of Drug Sensitivity in Cancer (GDSC) database (https://www.cancerrxgene.org) was used, and the sensitivity of PDAC patients to anti-cancer drugs was evaluated by the log value of half maximal inhibitory concentration (IC50) in the TCGA cohort and our cohort. The correlation between the risk score and the IC50 of drugs was detected by Pearson correlation analysis.
Statistical analysis
R software (version 4.2.0; https://www.R-project.org) and SPSS (version 20.0) were used for all statistics. Wilcox test was used to screen DEGs and analyze the association between the inflammation-related gene signature and immune characteristics. Kaplan-Meier (KM) curves were drawn, and the difference in survival between risk groups was tested by the Log-rank test. Univariable and multivariable Cox proportional risk regression analyses were performed to assess the association between the risk score and OS. ROC analysis was used to evaluate the performance of the risk score in predicting prognosis, and the area under the ROC curve (AUC) was used to evaluate the accuracy of predicting. The Chi-square test was used to compare the difference in the composition of immune subtypes between risk groups. Pearson correlation analysis was used to assess the association between the prognostic genes, risk score, and the immune cells infiltration. P < 0.05 was considered statistically significant for all analyses.
Results
Identification of DEGs associated with inflammatory response in PDAC patients
We first compared 177 PDAC samples from the TCGA cohort and 167 normal pancreatic tissue samples from the GTEx database. Investigation of DEGs between the two groups yielded a total of 13,038 DEGs (), of which 206 genes were associated with inflammatory response. A heat map was generated to visualize the top 50 inflammation-related DEGs, clearly indicating their upregulation or downregulation in PDAC compared to normal pancreatic tissues (). Notably, the inflammation-related DEGs were distributed across all chromosomes except the Y chromosome (). Furthermore, an oncoprint was employed to highlight the inflammation-related DEGs with the top 20 somatic mutation frequencies and results disclosed that the frequencies of somatic mutations in TP53 and SMAD4 were the highest, 63% and 22%, respectively ().
Figure 2. DEGs associated with inflammatory response in PDAC patients. (A) Volcano map shows 13,038 DEGs between normal pancreatic tissue samples in GTEx cohort (n = 167) and PDAC samples in TCGA cohort (n = 177). (B) Heat map shows the top 25 upregulated genes and the top 25 downregulated genes. (C) Chromosomal distribution of up- and down-regulated inflammation-related DEGs in PDAC patients. The blue lines represent down-regulated DEGs; the red lines represent up-regulated DEGs; the blue squares represent down-regulated inflammation-related DEGs; the red circles represent up-regulated inflammation-related DEGs. (D) Oncoprint shows the inflammation-related DEGs with the top 20 somatic mutation frequencies. (E) Gene functional enrichment of 206 inflammation-related DEGs by Gene ontology (GO) analysis and Kyoto Encyclopedia of Genes and Genomes (KEGG) analysis. BP, CC, and MF represent biological processes, cellular components, and molecular functions, respectively.
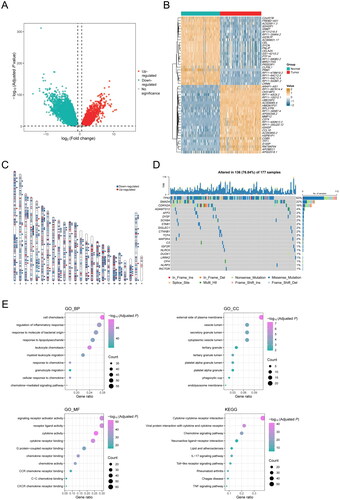
To gain insights into the potential biological characteristics of inflammation-related DEGs, we performed GO enrichment analysis, which displayed that these genes were mainly enriched in the external side of plasma membrane and vesicle lumen through binding to cytokine receptors, chemokine receptors, and G protein-coupled receptors. These genes were mostly involved in the biological processes including cell chemotaxis, regulation of inflammatory response, response to molecule of bacterial origin, etc. (). Additionally, KEGG enrichment analysis showed that these genes were mainly enriched in the signaling pathways including cytokine-cytokine receptor interaction, viral protein interaction with cytokine and cytokine receptor, chemokine signaling pathway, neuroactive ligand-receptor interaction, and lipid and atherosclerosis, etc. (). Taken together, our findings implied that these inflammation-related DEGs were involved in the TME and immune cell infiltration of PDAC, thereby potentially serving as prognostic indicators for PDAC patients.
Construction of a 15-inflammation-related gene prognostic signature for PDAC patients
To further explore the role of differentially expressed inflammation-related genes in predicting the clinical prognosis of PDAC, a univariable Cox regression analysis was performed, revealing a total of 32 genes that were associated with the OS of patients (P < 0.01; ). KM curves illuminated two of these genes—RIPK2 (P = 0.02; HR, 1.57; 95% CI, 1.04–2.37; ) and IL17D (P = 0.01; HR, 0.59; 95% CI, 0.39–0.90; ). These genes exhibited the most distinct HRs, with RIPK2 positively correlating and IL17D negatively correlating with survival. The above 32 genes were further included in LASSO penalized Cox regression analysis. According to the minimum criterion, a prognostic signature of 15 inflammation-related gene markers—RIPK2, PTGES, CXCL9, WNT7A, ADORA2B, HRH1, CCAT1, TNFSF9, KL, TERF2IP, GACAT3, FFAR3, AGT, MC1R, and IL17D, was established, and the risk score for each patient was calculated according to the expression level of each gene and its corresponding regression coefficient.
Figure 3. Construction of a 15-gene inflammation signature with prognostic value in PDAC patients. (A) Univariable Cox analysis displayed the hazard ratio (HR) value and 95% confidence interval (CI) of 32 inflammation-related DEGs for overall survival (OS). (B) Kaplan-Meier (KM) curve shows the OS of PDAC patients stratified based on the median expression level of RIPK2. (C) KM curve shows the OS of PDAC patients stratified based on the median expression level of IL17D. (D) KM curve shows the OS of PDAC patients stratified into the low- and high-risk groups based on the median risk score in the TCGA cohort. (E) Validation of the prognostic value of the gene signature by time-dependent receiver operating characteristic (ROC) curve in the TCGA cohort. (F) Heat map of expression level of each characteristic gene in the high- and low-risk groups.
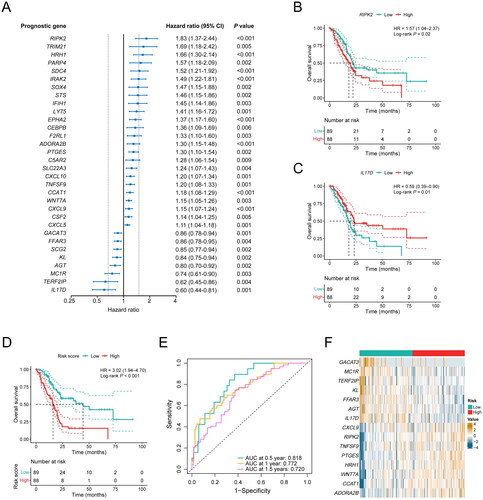
To assess the performance of the inflammation-related gene signature, PDAC patients from the TCGA cohort were divided into high-risk and low-risk groups based on the median risk score. KM curves showed that the OS of high-risk patients was significantly shorter than that of low-risk patients (P < 0.001; HR, 3.02; 95% CI, 1.94–4.70; ). To evaluate the prognostic accuracy of the gene signature at 0.5-years, 1-year, and 1.5-years survival rates, we performed ROC curve analysis, and the AUC was 0.818 at 0.5 years, 0.772 at 1 year, and 0.720 at 1.5 years, respectively, indicating a robust predictive capability of the model (). Moreover, the expression levels of RIPK2, TNFSF9, PTGES, HRH1, WNT7A, CCAT1, and ADORA2B, which were associated with poor survival, were significantly higher in the high-risk group. While the expression levels of GACAT3, MC1R, TERF2IP, KL, FFAR3, AGT, and IL17D, which were associated with favorable survival, were significantly lower in the high-risk group (P < 0.05, ).
Validation of the inflammation-related gene signature
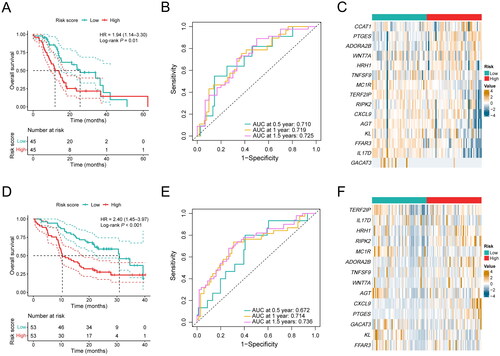
To validate the stability of the prognostic gene signature, the risk score of each patient was also calculated in the ICGC cohort and our cohort based on the same algorithm. PDAC samples were also stratified into a high-risk group and a low-risk group by the median risk score. Consistent with the results observed in the TCGA cohort, patients in the high-risk group showed a shorter OS compared with the low-risk group in the ICGC cohort (P = 0.01; HR, 1.94; 95% CI, 1.14–3.30; ). In addition, the AUC for prognosis prediction in the gene signature was 0.710 at 0.5 years, 0.719 at 1 year, and 0.725 at 1.5 years, respectively (). The expression of PTGES and ADORA2B were significantly higher in the high-risk group, and the expression of MC1R, TERF2IP, AGT, KL, FFAR3, IL17D, and GACAT3 were significantly lower in the high-risk group (P < 0.05, ). In our cohort, PDAC patients in the high-risk group also demonstrated a favorable prognosis compared with the low-risk group (P < 0.001; HR, 2.40; 95% CI, 1.45–3.97; ), and the AUC for prognosis prediction was 0.672 at 0.5 years, 0.714 at 1 year, and 0.736 at 1.5 years, respectively (). Additionally, the expression levels of PTGES, ADORA2B, WNT7A, RIPK2, and CXCL9 were significantly higher in the high-risk group (P < 0.05, ). Consequently, our results confirm the robustness of our inflammation-related gene signature in predicting prognosis in PDAC patients, indicating its potential utility in clinical decision-making.
Figure 4. Performance validation of the inflammation-related gene signature. (A) KM curve shows the OS of PDAC patients stratified into the low- and high-risk groups based on the median risk score in the ICGC cohort. (B) Validation of the prognostic value of the gene signature by time-dependent ROC curve in the ICGC cohort. (C) Heat map of expression level of each characteristic gene in the high- and low-risk groups in the ICGC cohort. (D) KM curve shows the OS of PDAC patients stratified into the low- and high-risk groups based on the median risk score in our clinical validation cohort. (E) Validation of the prognostic value of the gene signature by time-dependent ROC curve in our clinical validation cohort. (F) Heat map of expression level of each characteristic gene in the high- and low-risk groups in our clinical validation cohort.
Multivariable analysis of the prognostic value of the inflammation-related gene signature
To further evaluate the prognostic value of the gene signature, we performed univariable and multivariable Cox regression analysis on the clinical characteristics of PDAC patients. The univariable Cox analysis revealed that apart from the risk score, TNM stage (IIb-IV vs I-IIa) was also associated with poor prognosis in the TCGA cohort (P = 0.006; HR, 2.09; 95% CI, 1.24–3.52; ), while associations between other variable factors (e.g., age, sex, alcohol exposure, and diabetes) and OS were not observed in this cohort ().
Table 2. Univariable and multivariable Cox regression analysis of clinicopathologic factors and inflammation-related gene signature for OS in the TCGA cohort.
In addition, to determine whether the risk score was an independent prognostic factor of OS, we next performed a multivariable COX analysis with the risk score, incorporating the most pertinent clinicopathological variables related to PDAC. Results showed that the risk score as well as pathological stage remained significantly associated with the prognosis of patients in TCGA cohort (Risk score: P < 0.001; HR, 2.91; 95% CI, 1.73–4.89; Stage: P = 0.01; HR, 2.09; 95% CI, 1.16–3.78; ). The independent prognostic value of the risk score was also upheld in the multivariable Cox regression in the ICGC cohort (P = 0.01; HR, 2.10; 95% CI, 1.19–3.71; ), and our cohort (P = 0.002; HR, 2.37; 95% CI, 1.37–4.09; ). A nomogram and corresponding calibration curve integrating several prognostic variables in our cohort including smoking history, stage, and risk group showed a more readable and applicable model for predicting survival (Figure S1A and B). In summary, these results underscore the potential of the inflammation-related gene signature as a standalone prognostic indicator in PDAC patients, independent of other confounding factors.
Table 3. Univariable and multivariable Cox regression analysis of clinicopathologic factors and inflammation-related gene signature for OS in the ICGC cohort.
Table 4. Univariable and multivariable Cox regression analysis of clinicopathologic factors and inflammation-related gene signature for OS in our clinical validation cohort.
Association between the inflammation-related gene signature and immune characteristics
The aforementioned results suggest that inflammatory response-related genes might be involved in the immune microenvironment of PDAC. To explore whether the risk score could reflect the immune classification of PDAC, we delved deeper into the association between the high- and low-risk groups and the six pan-cancer immune subtypes (C1–C6; C1: wound healing, C2: IFN-gamma dominant, C3: inflammatory, C4: lymphocyte depleted, C5: immunological quiet, C6: TGF-beta dominant) in the TCGA cohort, which were previously reported (Citation29). Among the immune subtypes, PDAC was mostly clustered into C1, C2, C3, and C6. Subtypes C3 and C6 were related with better and inferior prognoses respectively, whereas C1 and C2 indicated moderate prognoses (Citation29). There were significant differences in immune typing between high-risk and low-risk groups by the Chi-Square test (χ2: 15.060; P = 0.005; ). Specifically, the low-risk group was mainly manifested as subtype C3 and had a better prognosis, while the high-risk group was mainly manifested as subtype C1 and C2 with a worse prognosis. The stromal fraction of the high-risk group was higher than that of the low-risk group, showing a more malignant phenotype (P = 0.02; ). We further evaluated the score of the six immune signatures between high- and low-risk groups. Consistent with their immune typing, the patients in high-risk group exhibited higher proliferation, wound healing, and IFN-γ response capabilities than those in low-risk group, while the proportions of macrophage regulation and lymphocyte infiltration in the low-risk group were higher ().
Figure 5. Association between the inflammation-related gene signature and immune characteristics. (A) Composition of C1–C6 immune subtypes in the low-risk (n = 67) and high-risk (n = 83) groups in the TCGA cohort. (B) Comparison of leukocyte fraction and stromal fraction between the low-risk (n = 89) and high-risk (n = 87) groups in the TCGA cohort. (C) Comparison of immune subtype-related signatures between the low-risk (n = 67) and high-risk (n = 83) groups in the TCGA cohort. (D) Correlation analysis between the 15 characteristic genes, risk score and the 22 immune cell subpopulations estimated by CIBERSORT. (E) The relative proportions of 22 immune cell subpopulations estimated by CIBERSORT were compared between the low-risk (n = 89) and high-risk (n = 88) groups in the TCGA cohort. *P < 0.05; **P < 0.01; ***P < 0.001; ****P < 0.0001.
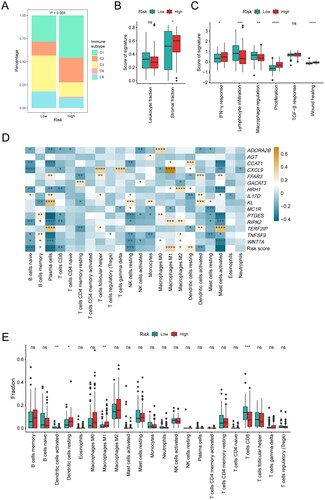
Therefore, we subsequently investigated the association between the risk score and relative immune cell frequencies in the TCGA cohort and our cohort. CIBERSORTx analysis was used to quantify different immune cell subsets. We specifically analyzed the correlation between 15 characteristic genes, the risk score, and the 22 kinds of immune cells. Our findings indicated that CD8+ T cells were negatively correlated with the expression of HRH1, RIPK2, PTGES, CXCL9, and ADORA2B. M1 macrophages were positively correlated with the expression of CXCL9, RIPK2, HRH1, and CCAT1. M2 macrophages were positively correlated with the expression of HRH1, RIPK2, TNFSF9, and WNT7A. Activated dendritic cells were positively correlated with the expression of KL, FFAR3, IL17D, and TERF2IP. Resting dendritic cells were negatively correlated with the expression of FFAR3, IL17D, and TERF2IP, and positively correlated with CCAT1. The risk score was negatively correlated with most immune cells, such as naive B cells, plasma cells, CD8+ T cells, resting natural killer cells, activated dendritic cells, activated mast cells. Conversely, it positively correlated to M1 macrophages, M2 macrophages, resting dendritic cells (). Furthermore, we also analyzed differences in immune cell signature between these two groups. It was found that the immune cell composition was significantly different among the subtypes. Notably, the infiltration degrees of CD8+ T cells and activated dendritic cells in the low-risk group were expressively higher than that in the high-risk group (P < 0.05, ), while M1 macrophages and resting dendritic cells showed significantly higher infiltration degrees in the high-risk group (P < 0.05, ). Similar results were observed in our cohort that more CD8+ T cells and activated dendritic cells, but less M1 macrophages were infiltrated in the TME of patients with low risk scores (Figure S2). Briefly, the risk score derived from the inflammation-related gene signature was positively correlated with the infiltration of immunosuppressive cells.
Association between the inflammation-related gene signature and drug sensitivity
We subsequently evaluated whether the inflammation-related gene signature could indicate the therapy of PDAC patients in the TCGA cohort and our cohort. The measurement of homologous recombination deficiency (HRD) in pancreatic cancer is vital before being treated with poly ADP-ribose polymerase (PARP) inhibitors (Citation30). In our study, we found higher HRD scores in the high-risk group, suggesting that the use of PARP inhibitors in this group might achieve better efficacy (P < 0.001; ). Partially due to the high stromal fraction, PDAC is not so sensitive to anti-angiogenic therapy (Citation31). Our results showed that the high-risk group with a higher stromal fraction had a lower angiogenesis score, indicating that anti-angiogenic therapy may not be appropriate in this subpopulation (P < 0.001; ). TMB is an emerging predictive biomarker in cancer therapy, potentially indicating a high rate of response to immunotherapy (Citation32, Citation33). We also compared the differences in somatic mutation profiles between the high-risk and low-risk groups. Our analysis revealed that the TMB of the high-risk group was higher than that of the low-risk group (P < 0.001; ).
Figure 6. Association between the inflammation-related gene signature and drug sensitivity. (A) Comparison of homologous recombination deficiency (HRD) score between the low-risk (n = 76) and high-risk (n = 80) groups in the TCGA cohort. (B) Comparison of angiogenesis score between the low-risk (n = 67) and high-risk (n = 83) groups in the TCGA cohort. (C) Comparison of tumor mutational burden (TMB) between the low-risk (n = 89) and high-risk (n = 86) groups in the TCGA cohort. (D–F) Correlation analysis between the gene signature and the log value of IC50 of three chemotherapeutic drugs: gemcitabine (D), paclitaxel (E) and cisplatin (F).
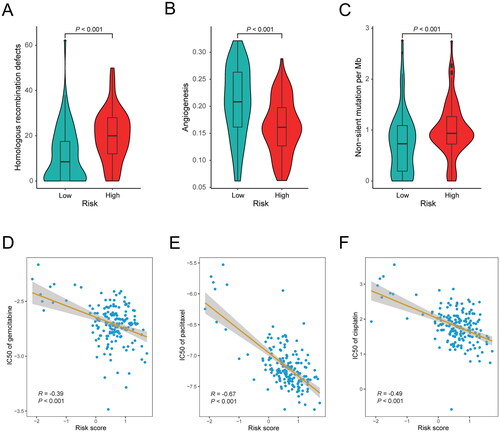
Furthermore, we investigated the association between the risk score and the sensitivity to anti-cancer drugs in the TCGA cohort and our cohort. The findings revealed a significant association between the risk score and sensitivity to chemotherapy drugs commonly utilized in the treatment of PDAC. Notably, the risk score was negatively correlated with the IC50 of gemcitabine (P < 0.001; R = −0.39; ), paclitaxel (P < 0.001; R = −0.67; ), and cisplatin (P < 0.001; R = −0.49; ). The negative correlations were also observed in our cohort (gemcitabine: P < 0.001, R = −0.37; paclitaxel: P = 0.003, R = −0.28; cisplatin: P < 0.001, R = −0.36; Figure S3A–C). In summary, these findings hinted that the high-risk group of patients might be more sensitive to chemotherapy and immunotherapy, as well as PARP inhibitors. Therefore, the inflammation-related gene signature could potentially serve as an indicator for guiding therapeutic strategies in PDAC patients.
Discussion
In our study, a series of DEGs associated with inflammatory response were discovered in the PDAC patients in TCGA cohort, among which, the expression levels of several inflammation-related genes were associated with the prognosis of PDAC patients. A total of 15 inflammation-related genes were further used to construct a gene signature to be negatively associated with the prognosis of PDAC patients. The prognostic effect was further verified in the ICGC cohort and our cohort. Furthermore, we also found that the inflammation-related gene signature was associated with multiple immune characteristics such as C1-C6 immune subtype, as well as immune cells infiltration—patients with higher risk scores had less infiltration of CD8+ T cells and activated dendritic cells, but more infiltration of resting dendritic cells and M1 macrophages. PDAC patients with higher risk scores might be more sensitive to chemotherapy, immunotherapy and PARP inhibitors. Altogether, the inflammation-related gene signature holds promise not only as a prognostic indicator for PDAC patients but also as a potential guide for clinical treatment strategies.
The gene signature that we constructed includes 15 inflammatory response-related genes, among which, it has been reported that CCAT1 (Citation34), CXCL9 (Citation35, Citation36), RIPK2 (Citation37), TNFSF9 (Citation38), and WNT7A (Citation39, Citation40), are upregulated in PDAC and associated with poor prognosis of patients. In particular, CXCL9 reduces CD8+ cytotoxic T lymphocytes in the TME of PDAC, which could attribute to the reduced CD8+ T cell proliferation, activation, and secretion of anti-tumor cytokines (Citation36). The results in our study showed consistency with these previous studies.
Many inflammatory components in the TME of PDAC—including macrophages, neutrophils, and damaged acinar cells, do not support anti-tumor immunity. Inflammation related-genes indirectly influence tumor progression by modulating tumor immune infiltrates, resulting in suppression of antitumor immunity (Citation41, Citation42). In our study, the inflammation-related gene signature serves as an indicator of distinct immune cell infiltration patterns both in the high-risk and low-risk groups. CD8+ T cells and activated dendritic cells execute surveillance and elimination of tumor cells, thus stimulating anti-tumor immunity. Notably, the infiltration levels of these two types of cells are significantly decreased in the high-risk group identified by our gene signature. While M1 macrophages and resting dendritic cells, which hinder anti-tumor immunity and promote tumor growth, are significantly elevated in the high-risk group. These findings align with the poorer prognosis observed in PDAC patients with a high-risk score.
In PDAC, there is a marked increase in the stromal composition such as extracellular matrix (ECM). ECM serves as a barrier to chemotherapy and therefore has been shown to associate with patient survival in pancreatic cancer (Citation31). In our study, an increased stromal fraction was found in the high-risk group, offering a partial explanation for their poorer survival rates. Besides, other findings in our study, for instance, there are more proliferation, wound healing, and IFN-γ response but less macrophage regulation and lymphocyte infiltration in the high-risk group, which also indicates poor prognosis in PDAC patients.
Early diagnosis of pancreatic cancer is tough as no significant sign of diseases could be easily observed, and therapy at the advanced stage is not desirable due to the primary resistance of pancreatic cancer cells to most drugs (Citation43). In our inflammation-related gene signature, patients with high-risk scores were more sensitive to chemotherapy drugs, suggesting that this group of patients may benefit from chemotherapeutic regimens based on gemcitabine, paclitaxel, and cisplatin. In addition, our findings suggested that patients with high-risk scores were more responsive to PARP inhibitors such as olaparib, which has been incorporated into the first-line treatment of PDAC as the only targeted therapy. The efficacy of immune checkpoint inhibitors in PDAC is limited, probably due to the stromal components in PDAC which have been shown to inhibit both spontaneous and therapeutically induced anti-tumor immunity (Citation44). Our results found that patients with high-risk scores had higher TMB, indicating that patients in the high-risk group may benefit from immune checkpoint inhibitors combined with effective stroma-targeted agents.
There are limitations in this study as well. Firstly, the samples size is not large enough, limiting the breadth of our findings. Secondly, the majority of PDAC samples from the TCGA database are from early-stage patients, with insufficient representation from late-stage cases. To compensate for this, we included an independent cohort from our hospital to strengthen the validation of our findings. The efficacy of this gene signature in late-stage samples needs to be verified further in a prospective study. Additionally, the ICGC cohort lacks comprehensive clinicopathologic information for analysis, hampering our ability to draw deeper insights. Lastly, the retrospective design of this study precludes our ability to assess the predictive potential of the gene signature in relation to treatment response.
In conclusion, our inflammation-related gene signature has demonstrated robustness in predicting prognosis in PDAC patients. Furthermore, this signature offers valuable insights into tumor heterogeneity and composition, potentially unlocking biological mechanisms and targets that could inform clinical decision-making and patient stratification. The clinical utility of the inflammation-related gene signature warrants further studies.
Ethics approval and informed consent
This study was conducted in accordance with the Declaration of Helsinki and approved by the ethics committee of Shandong Cancer Hospital and Institute, Shandong First Medical University and Shandong Academy of Medical Sciences (Approval No. SDZLEC2021-136). The written informed consents were obtained from all the participants.
Author contributions
Xiaofeng Sun: Investigation (lead); Methodology (equal); Visualization (equal); Writing-original draft (equal). Hao Song: Investigation (equal); Methodology (equal); Visualization (equal); Writing-original draft (equal). Xiaoran Sun: Investigation (supporting); Methodology (supporting); Writing-original draft (supporting). Chunhua Liao: Investigation (supporting); Visualization (supporting); Writing-original draft (supporting). Guoqiang Wang: Writing-original draft (supporting). Yu Xu: Writing-original draft (supporting). Leo Li: Writing-original draft (supporting). Yusheng Han: Writing-original draft (supporting); Funding acquisition (supporting). Chunwei Xu: Writing-original draft (supporting). Wenxian Wang: Writing-original draft (supporting). Shangli Cai: Writing-original draft (supporting). Hua Liang: Conceptualization (lead); Writing-original draft (supporting); Writing-review & editing (supporting). Hao Yu: Funding acquisition (lead); Conceptualization (lead); Writing-original draft (lead); Writing-review & editing (lead).
Supplemental Material
Download PDF (154.6 KB)Disclosure statement
No potential conflict of interest was reported by the author(s).
Data availability
The relevant data supporting the findings of this study are available within the paper. Due to ethical and privacy concerns, we are unable to publish the patient-level data in our study, of which readers may contact the corresponding authors for the access for non-commercial purposes.
Additional information
Funding
References
- Sung H, Ferlay J, Siegel RL, Laversanne M, Soerjomataram I, Jemal A, et al. Global Cancer Statistics 2020: GLOBOCAN estimates of incidence and mortality worldwide for 36 cancers in 185 countries. CA Cancer J Clin. 2021;71(3):209–249. doi:10.3322/caac.21660.
- Siegel RL, Miller KD, Fuchs HE, Jemal A. Cancer statistics, 2022. CA Cancer J Clin. 2022;72(1):7–33. doi:10.3322/caac.21708.
- Kamisawa T, Wood LD, Itoi T, Takaori K. Pancreatic cancer. Lancet. 2016;388(10039):73–85. doi:10.1016/S0140-6736(16)00141-0.
- Sohal DP, Mangu PB, Laheru D. Metastatic pancreatic cancer: American Society Of Clinical Oncology Clinical Practice Guideline Summary. J Oncol Pract. 2017;13(4):261–264. doi:10.1200/JOP.2016.017368.
- Principe DR, Underwood PW, Korc M, Trevino JG, Munshi HG, Rana A. The current treatment paradigm for pancreatic ductal adenocarcinoma and barriers to therapeutic efficacy. Front Oncol. 2021;11:688377. doi:10.3389/fonc.2021.688377.
- Golan T, Hammel P, Reni M, Van Cutsem E, Macarulla T, Hall MJ, et al. Maintenance olaparib for germline BRCA-mutated metastatic pancreatic cancer. N Engl J Med. 2019;381(4):317–327. doi:10.1056/NEJMoa1903387.
- Chung V, Mansfield AS, Braiteh F, Richards D, Durivage H, Ungerleider RS, et al. Safety, tolerability, and preliminary activity of LB-100, an inhibitor of protein phosphatase 2A, in patients with relapsed solid tumors: an open-label, dose escalation, first-in-human, phase I trial. Clin Cancer Res. 2017;23(13):3277–3284. doi:10.1158/1078-0432.CCR-16-2299.
- Schultze A, Fiedler W. Clinical importance and potential use of small molecule inhibitors of focal adhesion kinase. Anticancer Agents Med Chem. 2011;11(7):593–599. doi:10.2174/187152011796817727.
- Jiang H, Hegde S, Knolhoff BL, Zhu Y, Herndon JM, Meyer MA, et al. Targeting focal adhesion kinase renders pancreatic cancers responsive to checkpoint immunotherapy. Nat Med. 2016;22(8):851–860. doi:10.1038/nm.4123.
- Lorusso PM, Adjei AA, Varterasian M, Gadgeel S, Reid J, Mitchell DY, et al. Phase I and pharmacodynamic study of the oral MEK inhibitor CI-1040 in patients with advanced malignancies. J Clin Oncol. 2005;23(23):5281–5293. doi:10.1200/JCO.2005.14.415.
- Millward M, Price T, Townsend A, Sweeney C, Spencer A, Sukumaran S, et al. Phase 1 clinical trial of the novel proteasome inhibitor marizomib with the histone deacetylase inhibitor vorinostat in patients with melanoma, pancreatic and lung cancer based on in vitro assessments of the combination. Invest New Drugs. 2012;30(6):2303–2317. doi:10.1007/s10637-011-9766-6.
- Sun J, Russell CC, Scarlett CJ, McCluskey A. Small molecule inhibitors in pancreatic cancer. RSC Med Chem. 2020;11(2):164–183. doi:10.1039/c9md00447e.
- Carbone D, De Franco M, Pecoraro C, et al. Discovery of the 3-amino-1,2,4-triazine-based library as selective PDK1 inhibitors with therapeutic potential in highly aggressive pancreatic ductal adenocarcinoma. Int J Mol Sci. 2023;24(4)
- Kandimalla R, Tomihara H, Banwait JK, Yamamura K, Singh G, Baba H, et al. A 15-gene immune, stromal, and proliferation gene signature that significantly associates with poor survival in patients with pancreatic ductal adenocarcinoma. Clin Cancer Res. 2020;26(14):3641–3648. doi:10.1158/1078-0432.CCR-19-4044.
- Grivennikov SI, Greten FR, Karin M. Immunity, inflammation, and cancer. Cell. 2010;140(6):883–899. doi:10.1016/j.cell.2010.01.025.
- Karin M. Nuclear factor-kappaB in cancer development and progression. Nature. 2006;441(7092):431–436. doi:10.1038/nature04870.
- Aggarwal BB, Vijayalekshmi RV, Sung B. Targeting inflammatory pathways for prevention and therapy of cancer: short-term friend, long-term foe. Clin Cancer Res. 2009;15(2):425–430. doi:10.1158/1078-0432.CCR-08-0149.
- Ammirante M, Luo JL, Grivennikov S, Nedospasov S, Karin M. B-cell-derived lymphotoxin promotes castration-resistant prostate cancer. Nature. 2010;464(7286):302–305. doi:10.1038/nature08782.
- Ritter B, Greten FR. Modulating inflammation for cancer therapy. J Exp Med. 2019;216(6):1234–1243. doi:10.1084/jem.20181739.
- Luo Y, Yang Y, Liu M, Wang D, Wang F, Bi Y, et al. Oncogenic KRAS reduces expression of FGF21 in acinar cells to promote pancreatic tumorigenesis in mice on a high-fat diet. Gastroenterology. 2019;157(5):1413–1428 e1411. doi:10.1053/j.gastro.2019.07.030.
- Del Poggetto E, Ho I-L, Balestrieri C, Yen E-Y, Zhang S, Citron F, et al. Epithelial memory of inflammation limits tissue damage while promoting pancreatic tumorigenesis. Science. 2021;373(6561):eabj0486. doi:10.1126/science.abj0486.
- Sun X, He X, Zhang Y, Hosaka K, Andersson P, Wu J, et al. Inflammatory cell-derived CXCL3 promotes pancreatic cancer metastasis through a novel myofibroblast-hijacked cancer escape mechanism. Gut. 2022;71(1):129–147. doi:10.1136/gutjnl-2020-322744.
- Schreiber RD, Old LJ, Smyth MJ. Cancer immunoediting: integrating immunity’s roles in cancer suppression and promotion. Science. 2011;331(6024):1565–1570. doi:10.1126/science.1203486.
- Yamamoto T, Kawada K, Obama K. Inflammation-related biomarkers for the prediction of prognosis in colorectal cancer patients. Int J Mol Sci. 2021;22(15):8002. doi:10.3390/ijms22158002.
- Jiang Y, Xu D, Song H, Qiu B, Tian D, Li Z, et al. Inflammation and nutrition-based biomarkers in the prognosis of oesophageal cancer: a systematic review and meta-analysis. BMJ Open. 2021;11(9):e048324. doi:10.1136/bmjopen-2020-048324.
- Gallego A, Mendiola M, Hernando B, Berjon A, Cadiz A, Chaves-Urbano B, et al. Prognostic markers of inflammation in endometrioid and clear cell ovarian cancer. Int J Gynecol Cancer. 2022;32(8):1009–1016. doi:10.1136/ijgc-2022-003353.
- Ni X-C, Xu J, Yi Y, Fu Y-P, Cai X-Y, Liu G, et al. Inflammation-nutrition score predicts prognosis of patients with resectable hepatocellular carcinoma. Int J Clin Oncol. 2019;24(7):825–835. doi:10.1007/s10147-019-01402-4.
- Hirahara N, Matsubara T, Kaji S, Hayashi H, Sasaki Y, Kawakami K, et al. Novel inflammation-combined prognostic index to predict survival outcomes in patients with gastric cancer. Oncotarget. 2023;14(1):71–82. doi:10.18632/oncotarget.28353.
- Thorsson V, Gibbs DL, Brown SD, Wolf D, Bortone DS, Ou Yang T-H, et al. The immune landscape of cancer. Immunity. 2018;48(4):812–830 e814. doi:10.1016/j.immuni.2018.03.023.
- Cleary JM, Aguirre AJ, Shapiro GI, D'Andrea AD. Biomarker-guided development of DNA repair inhibitors. Mol Cell. 2020;78(6):1070–1085. doi:10.1016/j.molcel.2020.04.035.
- Hosein AN, Brekken RA, Maitra A. Pancreatic cancer stroma: an update on therapeutic targeting strategies. Nat Rev Gastroenterol Hepatol. 2020;17(8):487–505. doi:10.1038/s41575-020-0300-1.
- Jardim DL, Goodman A, de Melo Gagliato D, Kurzrock R. The challenges of tumor mutational burden as an immunotherapy biomarker. Cancer Cell. 2021;39(2):154–173. doi:10.1016/j.ccell.2020.10.001.
- Lawlor RT, Mattiolo P, Mafficini A, Hong S-M, Piredda ML, Taormina SV, et al. Tumor mutational burden as a potential biomarker for immunotherapy in pancreatic cancer: systematic review and still-open questions. Cancers (Basel). 2021;13(13):3119. doi:10.3390/cancers13133119.
- Liu S, Harmston N, Glaser TL, Wong Y, Zhong Z, Madan B, et al. Wnt-regulated lncRNA discovery enhanced by in vivo identification and CRISPRi functional validation. Genome Med. 2020;12(1):89. doi:10.1186/s13073-020-00788-5.
- Cannon A, Thompson CM, Maurer HC, Atri P, Bhatia R, West S, et al. CXCR3 and cognate ligands are associated with immune cell alteration and aggressiveness of pancreatic ductal adenocarcinoma. Clin Cancer Res. 2020;26(22):6051–6063. doi:10.1158/1078-0432.CCR-20-1359.
- Gao H-F, Cheng C-S, Tang J, Li Y, Chen H, Meng Z-Q, et al. CXCL9 chemokine promotes the progression of human pancreatic adenocarcinoma through STAT3-dependent cytotoxic T lymphocyte suppression. Aging (Albany NY)).). 2020;12(1):502–517. doi:10.18632/aging.102638.
- Li X, Li Z, Zhu H, Yu X. Autophagy regulatory genes MET and RIPK2 play a prognostic role in pancreatic ductal adenocarcinoma: a bioinformatic analysis based on GEO and TCGA. Biomed Res Int. 2020;2020:8537381. doi:10.1155/2020/8537381.
- Wu J, Wang Y, Jiang Z. TNFSF9 is a prognostic biomarker and correlated with immune infiltrates in pancreatic cancer. J Gastrointest Cancer. 2021;52(1):150–159. doi:10.1007/s12029-020-00371-6.
- Wu D-J, Jiang Y-S, He R-Z, Tao L-Y, Yang M-W, Fu X-L, et al. High expression of WNT7A predicts poor prognosis and promote tumor metastasis in pancreatic ductal adenocarcinoma. Sci Rep. 2018;8(1):15792. doi:10.1038/s41598-018-34094-3.
- Huang X, Zhang G, Tang T, Liang T. Identification of tumor antigens and immune subtypes of pancreatic adenocarcinoma for mRNA vaccine development. Mol Cancer. 2021;20(1):44. doi:10.1186/s12943-021-01310-0.
- Zheng L, Xue J, Jaffee EM, Habtezion A. Role of immune cells and immune-based therapies in pancreatitis and pancreatic ductal adenocarcinoma. Gastroenterology. 2013;144(6):1230–1240. doi:10.1053/j.gastro.2012.12.042.
- Chen DS, Mellman I. Elements of cancer immunity and the cancer-immune set point. Nature. 2017;541(7637):321–330. doi:10.1038/nature21349.
- Hidalgo M. Pancreatic cancer. N Engl J Med. 2010;362(17):1605–1617. doi:10.1056/NEJMra0901557.
- Balachandran VP, Beatty GL, Dougan SK. Broadening the impact of immunotherapy to pancreatic cancer: challenges and opportunities. Gastroenterology. 2019;156(7):2056–2072. doi:10.1053/j.gastro.2018.12.038.