
 ?Mathematical formulae have been encoded as MathML and are displayed in this HTML version using MathJax in order to improve their display. Uncheck the box to turn MathJax off. This feature requires Javascript. Click on a formula to zoom.
Abstract
This paper explores the quality of life of non-self-sufficient immigrants in Sweden, focusing on their residential patterns while controlling for individual characteristics. We find large differences in both individual and locational attributes across income levels and ethnic backgrounds, illustrating that the status of ‘immigrant’ is far from being a homogenous group. The results show that non-self-sufficient individuals, especially those from Africa and the Middle East, may face limitations in their life satisfaction as these groups are most likely to reside in socioeconomically weak neighborhoods. Additionally, the results show that the motivation for residential choices varies across ethnic backgrounds. For example, ethnicity rather than income level determines the neighborhood patterns of African immigrants, while non-self-sufficiency is the major determinant for Nordic immigrants residing in poor, ethnic neighborhoods. We thus argue that the location of residence and differences across ethnic backgrounds deserve more attention in research and policy discussions on quality-of-life issues.
1. Introduction
Among OECD member nations, Sweden is one of the countries with the highest employment gap between natives and immigrants (OECD, Citation2020).Footnote1 Many foreign-born are not established on the labor market, which typically leads to low incomes as well as social exclusion and low participation in society. Having an employment with a ‘high enough’ income is an obvious factor that determines welfare and consumption opportunities. It plays an essential part in an individual’s life satisfaction, i.e., the so-called quality-of-life factor. Previous studies show, for example, that education, region of origin, age at immigration, and time spent in the country go a long way to explain the employment and income patterns among immigrants (Gustafsson et al., Citation2017; Rooth, Citation1999; Wixe & Pettersson, Citation2020). Additionally, the existence of neighborhood effects on various economic and social outcomes is well-established in the literature (Cutler et al., Citation2008; Cutler & Glaeser, Citation1997; Orum & Manley, Citation2020; Ricciardi et al., Citation2020).
Compared to the overall geographic distribution of the population in Sweden, immigrants are overrepresented in areas characterized by low socioeconomic status, which includes high unemployment, low average income, low education levels, and cheap housing, as well as social exclusion, violence, and even criminality (Edling, Citation2015). Vogiazides and Chihaya (Citation2019) show that a majority of immigrants in Sweden consistently reside in deprived neighborhoods, although there is a large variation across ethnic groups. At the same time, previous research indicates that immigrants are employed to a lesser extent and have lower earnings than natives (Andersson & Hammarstedt, Citation2015; Grand & Szulkin, Citation2002; Hammarstedt, Citation2006; Hammarstedt & Shukur, Citation2007), which is explained by both individual heterogeneity and locational characteristics.
To summarize, previous studies show that neighborhood patterns differ between immigrants and natives as well as across ethnic groups and that these patterns affect labor market outcomes. Specifically, immigrants originating from non-European countries, in particular African and Middle Eastern regions, seem to face considerable challenges on the Swedish labor and housing markets (Backman et al., Citation2021; Hammarstedt, Citation2006; Klaesson & Wixe, Citation2023; Vogiazides & Chihaya, Citation2019). In this paper, we contribute to these previous studies by adding the element of non-self-sufficiency to the exploration of the residential choices of individuals, comparing across ethnic groups (including native Swedes) and income levels. Following Eklund and Larsson (Citation2020), we define non-self-sufficiency as earning a wage income less than four price base amounts, which in 2018 (our year of study) corresponds to a monthly income of approximately 1000 euros. This sets a measurable standard of income necessary to operate independently in society. Eklund and Larsson (Citation2020) argue that to understand immigrants’ labor market participation and social integration, it is necessary to move beyond simple employment measures. In their view, employment statistics are an insufficient indicator of a workforce’s economic activityFootnote2; rather, the degree of self-sufficiency gives a more correct picture of the economic integration of foreign born. After the ‘launch’ of this concept in 2020, it reached the attention of policy makers, public organizations, and media in Sweden with greater attention being paid to it. As a result, Statistics Sweden recently introduced a tool that aims to describe the population in Sweden by labor market status, including the degree of self-sufficiency based on individuals’ work-related income (Statistics Sweden, Citation2023).Footnote3 In total, there are almost 1.9 million individuals in Sweden who cannot sustain themselves through work. Immigrants are overrepresented in this group, constituting 37% of the non-self-sufficient while the total share of foreign born in Sweden is only half this figure.Footnote4
The main purpose of this paper is to explore (i) the individual characteristics including income, education level, family status, and health of non-self-sufficient immigrantsFootnote5 affecting their quality of life, and (ii) their locational characteristics with a focus on neighborhood quality. An additional purpose and a further contribution of this study is to analyze how these individual characteristics, particularly ethnic background and self-sufficiency, influence the type of neighborhood immigrants reside in. In this way, we seek to connect the variables explored through (i) and (ii) above. Our analysis thus addresses the endogeneity of residential choices, meaning that individuals self-select into various neighborhoods based on their socioeconomic background and ethnic preferences (Bergman et al., Citation2019; Schelling, Citation1971; Van Ham et al., Citation2018). Indeed, previous literature finds that the strength of residential self-selection varies across ethnic groups as well as income levels, mainly shown for the US (cf. Clark & Ledwith, Citation2007; Clark & Rivers, Citation2012; Lewis et al., Citation2011; Li et al., Citation2020), but also Europe (Coulter & Clark, Citation2019; Ibraimovic & Masiero, Citation2014), and Sweden specifically (Malmberg & Clark, Citation2021). While these studies are mainly conducted for a single city or a selection of (large) cities, and/or use survey data or aggregated data, our study is conducted at the individual level and covers the full population and all neighborhoods in the whole country. Furthermore, based on previous research and established quality-of-life indicators, we argue that the neighborhood of residence along with individual characteristics influence life satisfaction.
We connect the individual and the residential characteristics described in the paper to Eurostat’s quality-of-life indicators. However, the data behind those indicators are typically collected by questionnaires, which are self-reported and cover only a sample of the population. In contrast, our analyses are based on register data covering the full Swedish population in 2018. This allows us to provide an extensive empirical exploration of individual and residential characteristics that have been shown by previous research to influence individuals’ quality of life. Our results show large differences in both individual characteristics and locational choices across income levels and ethnic groups, leading to significant differences in potential life satisfaction. Additionally, we find that ethnic differences in neighborhood choices hold to a large extent when controlling for other individual characteristics. In particular, our results show that non-self-sufficient immigrants especially from Africa and the Middle East are most likely to reside in ethnically segregated and socioeconomically weak neighborhoods. The neighborhood patterns of African immigrants are mostly determined by ethnicity, while Middle Eastern immigrants are also influenced by their income levels.
The paper is organized as follows. Section 2 reviews the quality-of-life indicators that are of relevance to our study and that we can capture (directly or indirectly) by register data. Section 3 provides information on data, definitions, and method, while Section 4 is concerned with descriptive statistics on individual and neighborhood characteristics potentially affecting life satisfaction. Previous research is connected to quality-of-life indicators in Section 2 and the patterns we find in Section 4. In Section 5, we analyze how differences in neighborhood patterns can be explained by individual characteristics, focusing on ethnic groups and non-self-sufficiency. Section 6 summarizes and concludes the paper.
2. Quality of Life
In this part, we offer an overview of statistical quality-of-life indicators from Eurostat (2020) along with some previous research reflecting individual and neighborhood characteristics to demonstrate a first connection to the statistical material we present later in the paper. We use Eurostat’s study as well as previous literature in different research contexts as a framework for complementary information about the sense of life satisfaction among non-self-sufficient immigrants in Sweden. Note that in Eurostat’s study on ‘quality-of-life indicators’, the initiators of that research designed it as a complement to national statistics (Stiglitz et al., Citation2009). As stated, the data behind those indicators are collected by self-reported questionnaires and cover only a sample of the population.Footnote6 By contrast, our study (see Section 3 and after) is based on full population register data and thus provides a more solid ground for understanding the situation of non-self-sufficient immigrants in Sweden.
2.1. Individual Characteristics of Quality of Life
Individual characteristics have a potentially strong influence on quality of life, perhaps most notably an individual’s income and employment situation (cf. Russo, Citation2012; Tseng & Petrie, Citation2014). Several studies show a direct relationship between, for example, youth unemployment (and thus low income) and happiness later in life (Bell & Blanchflower, Citation2011), decreased life satisfaction directly after unemployment (Powdthavee, Citation2012), and between income and happiness from a macroeconomic perspective (Di Tella et al., Citation2001, Citation2003). In support of this, Eurostat (Citation2021a) states that ‘work generates an income, provides a sense of identity and also offers opportunities for social contact, to be creative, to learn new things and to engage in activities that give a sense of fulfilment and enjoyment’. These aspects are captured by Eurostat indicators on income, consumption, and material conditions.Footnote7
According to Eurostat (Citation2021b), the rate of severe material deprivation in Sweden is overall very low (below 3% in 2017). However, Eurostat provides further indicators on economic security and physical safety. Economic security is essential to guarantee the ability to plan and overcome a sudden deterioration of one’s economic or life environment. The Eurostat 2016 survey (Eurostat, Citation2021b) shows that 54% of the Swedish population below the poverty line cannot face unexpected financial expenses and more than 10% of the immigrants at risk of poverty experience financial trouble (in arrears on mortgage or rent payments, utility bills, or hire purchase payments). Hence, even the social benefits of Sweden’s relatively generous welfare system may not provide sufficient life support.
Eklund and Larsson (Citation2020) show that it takes 7–8 years on average for half of the immigrants in Sweden to obtain an employment. Studies by Aldén and Hammarstedt (Citation2016) and Hammarstedt and Skedinger (Citation2017) point in the same direction. Similarly, for one third of the non-Western immigrants in Sweden, it takes 9 years to reach a monthly income of 2000 euro (Bornhäll et al., Citation2019). It is thus not surprising that immigrants are overrepresented among the non-self-sufficient. To access the labor market and job opportunities in a knowledge-intensive economy, education is essential. Using register data, Eklund and Larsson (Citation2020) show a low level of educational attainment among non-self-sufficient immigrants compared to native Swedes. In the long term, low education, non-employment, and low incomes may lead to counter-productive or destructive activities (Baumol, Citation1990; Hallsten et al., Citation2013). However, there are strong variations in employment rates, income levels, and educational attainment across ethnic backgrounds. Several studies on Sweden show that refugees and/or non-European immigrants, particularly those originating from low-income African and Middle Eastern countries, struggle on the labor market (Backman et al., Citation2021; Hammarstedt, Citation2006; Klaesson & Wixe, Citation2023).
An individual’s quality of life is also determined by his or her social and family life, measured by Eurostat’s indicators for social interactions. In Sweden, 51% of the sample population aged 65 and above have family meetings (Eurostat, Citation2021b). Eurostat (Citation2021b)Footnote8 shows a low percentage, only 3%, who have nobody to turn to for non-material help or to discuss personal matters. In the lowest quintile of income groups, the corresponding figure is 6%, showing that social cohesion is high even at lower incomes.
The final individual characteristic relevant to both Eurostat and our study is health status. Eurostat’s indicators on health are survey-based (2021)Footnote9 and show that only 3% of the lowest income group report unmet medical care, which can probably be attributed to Sweden’s subsidized health care system.
2.2. Residential Characteristics of Quality of Life
The residential characteristics influencing quality of life include both housing conditions and neighborhood characteristics. Our full population study measures the socioeconomic and ethnic segregation of neighborhoods. As such, it touches upon several of the quality-of-life indicators brought up by Eurostat. However, we directly refer to the geographic perspective, which is only indirectly addressed by the Eurostat indicators. Several studies (Cutler et al., Citation2008; Cutler & Glaeser, Citation1997; Orum & Manley, Citation2020; Ricciardi et al., Citation2020) show the importance of local socioeconomic conditions as measured by the neighborhood composition on various economic and social outcomes. Other studies demonstrate a direct connection between residential location and (often subjective) life satisfaction (see, for example, Carr, Citation2013; Fernandez & Kulik, Citation1981; Ma et al., Citation2018; Shields et al., Citation2009; Sirgy & Cornwell, Citation2002). Of particular importance for our paper is the study by Santiago et al. (Citation2011), which shows that disadvantaged neighborhoods contribute to psychological problems among both adults and children, where poverty-related stress plays an important role.
The housing condition of individuals also has a clear geographic component, since cheap rental apartments are found in socioeconomically weak neighborhoods, whereas housing ownership is more prevalent in wealthier places. According to Eurostat (Citation2021b), Swedish households have very little low-quality housing. In our study, we capture the housing condition of non-self-sufficient individuals by their housing type and relate it to ‘asset-based welfare’ (Lowe et al., Citation2012). Home ownership, in contrast to rental agreements, is a more profitable financial investment that increases consumption and welfare opportunities. As such, it contributes to life satisfaction across the lifespan of individuals (Zhang et al., Citation2018).
Socioeconomic and ethnic segregation at the neighborhood level is related to the Eurostat indicator on physical safety, as this is influenced by the living environment (cf. Ma et al., Citation2018). Eurostat (Citation2021b)Footnote10 shows that the population below the poverty line suffers from perceived crime, violence, and vandalism in the area they live comparatively more than those living above the poverty threshold. Urban environments are twice as criminogenic as towns, suburbs, and rural areas. These results expand geographically other criminal studies done on Stockholm (Hallsten et al., Citation2013). Distressed or disadvantaged neighborhoods, which in Sweden are characterized by a high proportion of immigrants and low socioeconomic status, come with social unrest, violence, parallel societies, and criminal activity (Edling, Citation2015; Swedish Police, Citation2017), and thus higher levels of unsafety (BRÅ, Brottsförebyggande rådet [The Swedish National Council for Crime Prevention], Citation2018). Studies conducted beyond Sweden equally find that individuals residing in deprived areas face social exclusion, which affects their education prospects, opportunities to get a job, and health outcomes (Atkinson & Kintrea, Citation2001). Social stressors, together with higher levels of psychological distress, also contribute to increased drug use of residents in disadvantaged neighborhoods (Boardman et al., Citation2001), which is directly related to individuals’ quality of life (Ma et al., Citation2022).
A further characteristic of one’s living environment includes access to leisure activities, defined by the quantity of sport and cultural events attended.Footnote11 Sweden has a large percentage of its population engaged in leisure activities (85% compared to 60% in EU28), although it is lower in the lowest income quintile (78%) (Eurostat, Citation2021b). Studies on Malmö (Sweden’s third largest city) show a correlation between leisure-time physical activity and the quality of the neighborhood of residence, as well as ethnicity (Lindström & Sundquist, Citation2001; Lindström et al., Citation2003). Additional reports on youth in Sweden show that individuals brought up in disadvantaged areas are less likely to participate in leisure, sports, and cultural activities (Elofsson et al., Citation2020). Previous research shows that participation in leisure activities promotes individuals’ subjective well-being through, for example, opportunities to build social networks and to acquire new skills and knowledge (Brajša-Žganec et al., Citation2011).
Previous studies conducted in the Swedish context, both nationally and for specific cities, show that foreign-born individuals are more likely to reside in deprived areas than native Swedes, where immigrants especially from Africa and the Middle East are overrepresented in socioeconomically weak neighborhoods (Andersson, Citation2013; Bråmå, Citation2008; Vogiazides & Chihaya, Citation2019). A potential explanation for this pattern is the variation in ethnic preferences across immigrant groups, where some groups have stronger preferences to live in proximity to co-ethnics (Van Ham et al., Citation2018). Additionally, non-Western immigrants in particular have been found to have a strong preference to reside close to family members (Hedman, Citation2013). A further explanation is that some ethnic groups are stigmatized as, for example, ‘low achievers’ on both the labor market and the housing market, resulting in discrimination and social/economic exclusion (by natives) that prevents upward residential (and socioeconomic) mobility (cf. Vogiazides & Chihaya, Citation2019; Burnazoglu, Citation2023). Upward mobility may also be prevented by a lack of information and other barriers that individuals in disadvantaged neighborhoods face (Bergman et al., Citation2019), especially affecting ethnic groups who already face cultural and language barriers. Based on previous research, we thus expect residential patterns and, consequently, potential life satisfaction to differ across ethnic backgrounds.
3. Methodology
To track the quality of life of non-self-sufficient immigrants in Sweden, we use full population micro data for 2018 from Statistics Sweden.Footnote12 In our empirical approach, immigrants refer to individuals born in another country than Sweden. The data contain detailed information on individual characteristics, such as income, education, ethnic background,Footnote13 family, and housing status. The geo-coding of the data allows for aggregations at various spatial scales, such as neighborhoods. We focus on the working age population defined as 20–64 years old.
3.1. Non-Self-Sufficiency
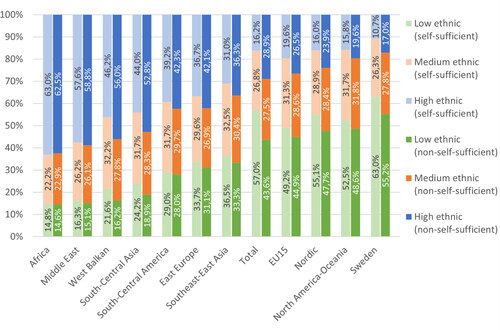
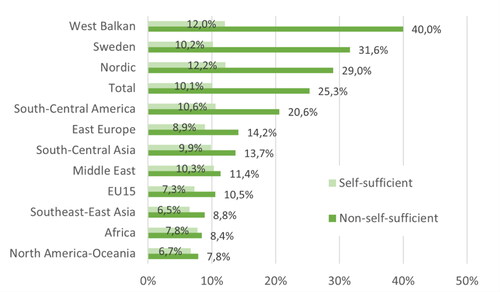
We follow Eklund and Larsson (Citation2020) and define non-self-sufficiency as having a wage income less than four price base amounts. In 2018, this corresponds to an annual gross income of 182,000 SEK, which gives a net monthly income of approximately 10,500 SEK (∼1000 EUR). This sets a level under which it is difficult to operate independently or without the support of others. As shown in , among individuals born in Sweden, approximately one out of four (26.4%) earns an income less than the level required for self-sufficiency. Meanwhile there is a great variation in the level of non-self-sufficiency across immigrant backgrounds, ranging from 36% for immigrants from West Balkan countries to 61% for persons born in the Middle East area.
Figure 1. Share of non-self-sufficient population per region of origin, 2018.
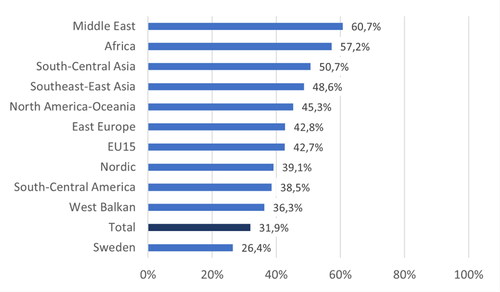
It is thus of importance to not treat immigrants as a homogenous group. In total (denoted as ‘Total’ in and the following figures in this section), 32% of the working age population in Sweden (no matter their region of origin and including native Swedes) are non-self-sufficient.
3.2. Neighborhood Segregation
Neighborhoods are defined according to Statistics Sweden’s geographic division of the country into 5984 demographic statistical areas (DeSO).Footnote14 This division is particularly suitable in the present case since the purpose of DeSO was to produce one nationwide classification of neighborhoods for statistical follow-up of socioeconomic segregation. The population of each DeSO area ranges from 654 to 4254 in 2018. The mean and the median populations are both approximately 1700.
We classify neighborhoods in terms of both socioeconomic status and ethnic segregation. To measure the former, we calculate the share of individuals at risk of poverty, which, following Eurostat, we identify as those having an equivalized disposable income below 60% of the corresponding national median. To measure ethnic segregation, we calculate the share of individuals in a neighborhood born in non-Nordic/EU15 countries.Footnote15 Neighborhoods with a share higher than 1.5 times the corresponding share for the country as a whole are classified as high poverty and high ethnic, respectively. Remaining neighborhoods where the share is at least 0.75 times the national share are classified as medium poverty and ethnic, while low poverty and low ethnic neighborhoods are the ones where the share is lower than 0.75 times the corresponding national share.Footnote16
and show the number of neighborhoods in each neighborhood type, as well as the type of region (metro, urban, rural) the respective neighborhoods are located in. The location quotient (LQ) in parenthesis shows the over- or underrepresentation of neighborhood types in each region type. For example, the LQ for low poverty neighborhoods in rural regions, 0.54, is calculated as the share of low poverty neighborhoods located in rural regions (244 divided by 2458) divided by the total share of neighborhoods located in rural regions (1092 divided by 5984). An LQ smaller (larger) than 1 indicates underrepresentation (overrepresentation) of the specific neighborhood type in the specific region type.
Table 1. Number of low, medium, and high poverty neighborhoods located in metropolitan, urban, and rural regions, respectively.
Table 2. Number of low, medium, and high ethnic neighborhoods located in metropolitan, urban, and rural regions, respectively.
As shown by the LQs in the two tables, rural regions have an overrepresentation of medium poverty and low ethnic neighborhoods, while low poverty and low ethnic neighborhoods are overrepresented in urban regions. Metropolitan regions have an overrepresentation of both low and high poverty neighborhoods, thus showing socioeconomic segregation, as well as medium and high ethnic neighborhoods, showing clustering of non-EU/Nordic immigrants into these regions. In total, 619 neighborhoods are classified as both high poverty and high ethnic, of which 33 are in rural regions, 275 in urban regions, and 311 in metropolitan regions.
3.3. Regression Analysis
We estimate the probability that individual i resides in a neighborhood classified as either high poverty or high ethnic, or both. The probability that yi = 1 is given by some function of the specified covariates. Since the dependent variable is binary and most of the predicted probabilities are below 0.2,Footnote17 we resort to logit estimation, using the cumulative density function of the logistic distribution. The empirical model to be estimated is:
where the main interest is how non-self-sufficiency, DNSS, and region of origin, BG, including their interaction, affect the probability that yi = 1. Xi is a set of control variables, including further individual characteristics and type of region, controlling for the fact that socioeconomically weak and/or ethnically segregated neighborhoods are more prevalent in certain regions (as shown above). ε is the error term. lists the variables used in the empirical estimations.
Table 3. List of dependent and independent variables.
Since the dependent variable does not vary across individuals residing in the same neighborhood, the standard errors are clustered on DeSO areas. To ease the interpretation of the results, we present the estimates in terms of average marginal effects, and, to illustrate the results on the interaction effects, we use predicted margins of the different groups and plot the results graphically. The relationship we seek to capture—how non-self-sufficiency interplays with location choice—can arguably run in both directions, and, therefore, we refrain from interpreting its results causally.
presents a correlation matrix for the variables utilized in the regression analysis. The bivariate correlations are relatively low overall, not indicating any issues with multicollinearity. This is further confirmed by low VIF-values (mean VIF < 2, and all individual VIFs < 3) obtained after estimating the equivalent linear probability models.
4. Quality of Life of Non-Self-Sufficient Immigrants
Before proceeding with the regression analysis, we present descriptive statistics on the individual and residential (neighborhood) characteristics related to the quality-of-life indicators reviewed in section 2. These statistics are useful as they give us an idea of the different life conditions that immigrants face across both ethnic backgrounds and self-sufficiency levels.
4.1. Disposable Income and Poverty
Sweden is generally known for being a welfare state with a high degree of social security, implying that individuals who cannot sustain themselves by working are typically eligible for various types of allowances. Additionally, income may come from previous capital investments. This implies that individuals who for various reasons do not work, or earn a low wage income, may still have a sufficient disposable income. Non-self-sufficient individuals are thus not necessarily poor. We follow Eurostat and define poor individuals as those having an equivalized disposable income below 60% of the corresponding national median, also denoted as being at risk of poverty. shows that in total (‘Total’), less than half of the non-self-sufficient in Sweden can be classified as being at risk of poverty. However, relative poverty levels vary substantially across regions of origin.
Figure 2. Share at risk of poverty among non-self-sufficient per region of origin, 2018.
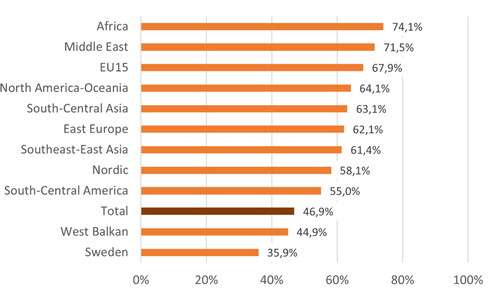
While almost three out of four (74.1%) non-self-sufficient Africans can be classified as poor, the corresponding number for West Balkans is less than half (44.9%). Among native Swedes, the share at risk of poverty is as low as 35.9%. These variations may be due to differences in the knowledge of the Swedish welfare system, which implies that native Swedes are better at maximizing the opportunities to obtain social and work-related benefits (Leão et al., Citation2009; Wiking et al., Citation2004). Meanwhile, immigrants from West Balkan countries typically arrived in Sweden in the beginning of the 1990s, such that they may have had a long enough time to ‘learn the system’ (Franzén, Citation1997, p. 293, 2001). Additionally, to be eligible for some types of socioeconomic benefits, especially work-related ones, certain requirements are related to time of residence.Footnote18
shows that among non-self-sufficient individuals, the mean disposable income is indeed higher (in dark orange) than the mean gross wage income (in dark blue), despite wage income being measured pre-taxes and disposable income post-taxes. This indicates that non-self-sufficient individuals’ means of living include social benefits. On the other hand, for self-sufficient individuals, mean disposable income (in light orange) is lower than mean gross wage income (in light blue). This is expected since wages are probably the main source of income upon which this group pay taxes.
Figure 3. Mean income levels (in thousand SEK) of self-sufficient and non-self-sufficient per region of origin, 2018.
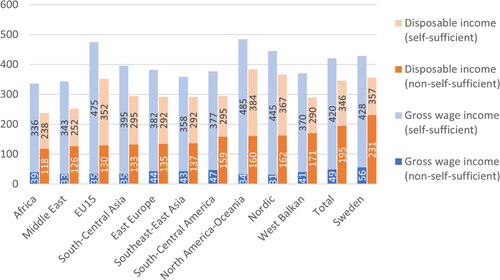
The disposable income of non-self-sufficient immigrants from West Balkan countries is on average 1.5 times higher than the income of immigrants from Africa, which is in line with . However, the mean disposable income of immigrants from Africa, Middle East, EU15, East Europe, and Asia is even lower than, or relatively close to, the net income level used to define self-sufficiency. This implies that there is a rather large group of non-self-sufficient immigrants who do not have a large enough disposable income to sustain themselves, even with the help of social benefits. Such a situation imposes large limitations on welfare and consumption opportunities (Franzén, Citation1997, Citation2001) such as, for example, housing choices, thereby affecting an immigrant’s quality of life. Additionally, a limited disposable income may induce participation in illegal activities that generate non-registered income (Hjerm, Citation2004; Vogel et al., Citation2002).
A further aspect not captured in the register data is that a part of immigrants’ (already relatively low) disposable income may be transferred out as remittances to family members and friends still residing in their country of origin (cf. Ivlevs et al., Citation2019; Toney & Hamilton, Citation2022). While this enhances the wellbeing of the loved ones staying behind (Ivlevs et al., Citation2019), it further decreases the quality of life of certain immigrant groups residing in Sweden since it poses additional limitations on their consumption and welfare opportunities.
4.2. Residential Patterns
Following from the differences in income levels across self-sufficient and non-self-sufficient individuals, as well as across regions of origin, we expect to find differences in residential patterns. Accordingly, shows the distribution of individuals across the three levels of neighborhood poverty (low, medium, and high).
Figure 4. Distribution of self-sufficient and non-self-sufficienct across socioeconomic neighborhood types, per region of origin, 2018.
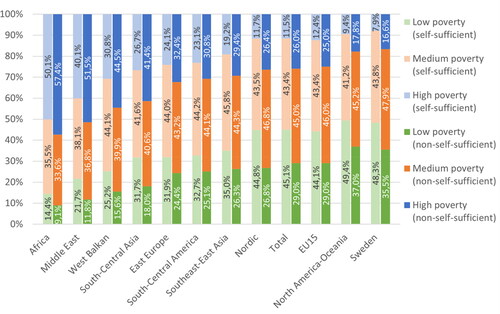
indicates that there are large variations across immigrant groups, where individuals especially from North America-Oceania, but also the Nordic and EU15 countries show similar neighborhood patterns as native Swedes. This contrasts with the relatively high share of poor among EU15 and North America-Oceania, shown in . On the other hand, immigrants from Africa and Middle East to a large degree reside in high poverty neighborhoods, which is in line with the high share of poor in these groups. These results are consistent with previous studies on Sweden (Andersson, Citation2013; Bråmå, Citation2008; Vogiazides & Chihaya, Citation2019), and may be explained by both individual characteristics (income, education, etc.), ethnic preferences, lack of information, discrimination, and social/economic exclusion of (certain) immigrant groups on the housing market (Bergman et al., Citation2019; Burnazoglu, Citation2023; Hedman, Citation2013; Vogiazides & Chihaya, Citation2019). There are also differences based on self-sufficiency, where the share residing in high poverty neighborhoods is consistently higher among non-self-sufficient immigrants. The difference ranges from 7.3%-points for Africans to 14.7%-points for South-Central Asia and Nordic countries. Surprisingly, despite having the lowest share at risk of poverty as well as the highest mean disposable income of non-self-sufficient immigrants, individuals from West Balkan countries are to a relatively large extent found in high poverty neighborhoods. Hence, for some immigrants, ethnic origin seems to be a stronger determinant for socioeconomic segregation than income, which supports Aldén and Hammarstedt (Citation2015).
shows the corresponding picture for neighborhood types concerning ethnicity, presenting a similar pattern to .
Figure 5. Distribution of self-sufficient and non-self-sufficienct across ethnic neighborhood types, per region of origin, 2018.
again shows that the geographic distribution of immigrants from North America-Oceania, the Nordic countries, and EU15 resembles the distribution of native Swedes. Meanwhile, immigrants from Africa, Middle East, and West Balkan are most frequently found in high ethnicity neighborhoods. Considering the definition of high ethnicity neighborhoods, it is expected that fewer Nordic/EU15 immigrants reside there. At the same time, there are large variations in residential patterns among non-Nordic/EU15 immigrants, showing that the patterns found are not only methodological constructs.
Like , confirms that the share of the population living in high ethnic neighborhoods is in most cases higher among non-self-sufficient than self-sufficient individuals. The largest difference is found for West Balkan immigrants, 9.8%-points, while the differences for African and Middle Eastern immigrants are negligible. A difference from is that the share living in high ethnicity neighborhoods is higher than the share living in high poverty neighborhoods. This indicates that immigrants from Africa and the Middle East to a very high degree reside in ethnically segregated neighborhoods, no matter whether they are self-sufficient or not.
The similarities between and point to a relationship between socioeconomic and ethnic segregation. Indeed, the bivariate correlation at neighborhood level between the share of the population at risk of poverty and the share of the population born in non-Nordic/EU15 countries is 0.74. This is in line with the results of Wixe and Pettersson (Citation2020), who also show that the correlation between socioeconomic and ethnic segregation in Sweden has grown stronger over time. This implies that ethnically segregated neighborhoods are becoming socioeconomically weaker, and vice versa.
As touched upon above, resource- and capital-weak individuals are often referred to areas with cheap housing opportunities. In Sweden, such housing is typically in the form of rental apartments in multi-dwelling buildings. The other available housing types in Sweden are tenant-owned apartments, often found in multi-dwelling buildings and owner-occupied houses that are typically one- or two-dwelling buildings. Indeed, shows that some immigrant groups, especially Africans, to a large extent reside in rental apartments. also shows that non-self-sufficient individuals are more frequent renters than self-sufficient. Among non-self-sufficient immigrants from Africa, only 13.3% own a house or an apartment. The corresponding figure for non-self-sufficient North America-Oceania immigrants is 62.4%, indicating large heterogeneity across immigrant groups. This is in line with previous studies on the Swedish housing market (Abramsson et al., Citation2002; Bråmå & Andersson, Citation2010).
Figure 6. Distribution of self-sufficient and non-self-sufficient across housing types, per region of origin, 2018.
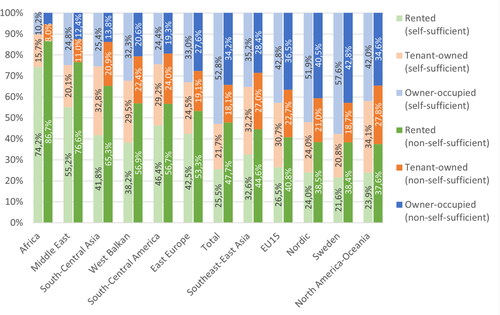
Buying a house or an apartment is a capital investment that typically increases in value over time. House and apartment owners thus have a capital asset that yields a financial return upon the point of selling, affecting their long-term disposable income. Capital assets also affect one’s current spending possibilities, since it can be used, for example, as collateral for bank loans. Home ownership can thus be viewed as a financial safety net that increases consumption and welfare opportunities across the lifespan, the so-called asset-based welfare (Lowe et al., Citation2012). Judging from , the potential for welfare and consumption opportunities, and quality-of-life improvements (Zhang et al., Citation2018), due to home ownership differs between immigrants and natives, across immigrant groups, and between self-sufficient and non-self-sufficient individuals.
Figure 7. Distribution of self-sufficient and non-self-sufficient across education levels, per region of origin, 2018.
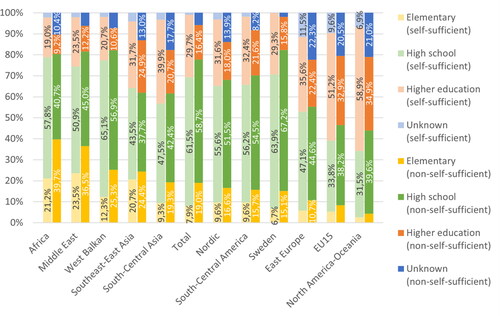
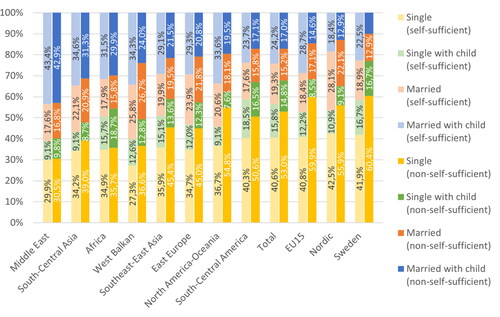
Figure 8. Distribution of self-sufficient and non-self-sufficient across civil statuses, per region of origin, 2018.
Neighborhoods with relatively cheap rental apartments are typically both ethnically and socioeconomically segregated. The self-selection of non-self-sufficient individuals, often immigrants, to neighborhoods with low socioeconomic status is thus partly involuntary, especially for those that have low disposable incomes. However, there may also be a voluntary aspect of the self-selection into socioeconomically weak neighborhoods, stemming from the high share of immigrants. Immigrants may thus choose socioeconomically weak neighborhoods since they experience higher utility and welfare from residing with neighbors sharing a similar background. This may be related to issues of, for example, higher trust and access to social networks in homogenous groups (Alesina & La Ferrara, Citation2002; Putnam, Citation2000).
At the same time, socioeconomically weak and ethnically segregated neighborhoods are typically characterized by bonding social capital (Putnam, Citation2000) and strong ties networks (Granovetter, Citation1973; Citation1983), which may lead to strong social norms and lock-in effects (cf. Boschma, Citation2005). In the classic sociological study by Park and Burgess (Citation1925), it was noted that newly arrived immigrants characterized themselves by their unfamiliarity to the host society versus their familiarity to their own language and socio-cultural customs, which often led them to recreate familiarity in dense ethnic housing concentrations. Those concentrations provide the newly arrived with practical, family-based social support (Halpern, Citation1993), which does not typically correspond to opportunities for upward housing and socioeconomic mobility. With time, immigrants living in neighborhoods characterized by high unemployment, and low education and income levels may create both productive and unproductive support networks. The productive ones are entrepreneurial and associative (Andersson, Citation2020; Andersson et al., Citation2020; Tavassoli & Trippl, Citation2019). However, the unproductive ones (Hallsten et al., Citation2013; Mezuk et al., Citation2019) may, for example, discourage engagement in higher education, lead to lower-quality employment (Deguilhem et al., Citation2019), or even jeopardize access to the labor market overall (Aron, Citation1967).
Additionally, immigrants may face discrimination as well as social and economic exclusion in the host country housing and labor markets, which likely reinforces the involuntary spatial sorting of immigrants to disadvantaged neighborhoods and may push them into unproductive activities (cf. Vogiazides & Chihaya, Citation2019; Burnazoglu, Citation2023). This has direct consequences for individual quality-of-life improvements as well as long-term effects on both individual and societal outcomes.
4.3. Additional Individual Characteristics
Since average income levels differ between self-sufficient and non-self-sufficient individuals, and across regions of origin, we expect differences in other individual characteristics. As shown in , such differences are seen for education levels. Non-self-sufficient individuals are more often low-educated (maximum elementary schooling) and less often highly educated (at least three years higher education). This is in line with Magnusson Turner and Hedman (Citation2014) who show substantial ethnic differences in housing careers that cannot be attributed to family composition or professional career alone. They identify education as an important factor that reduces the distance between native Swedes and immigrant groups in their access of housing ownership. An additional observation is that the share with unknown education is larger for non-self-sufficient than self-sufficient immigrants. ‘Unknown education’ means that the register data do not provide any information on an individual’s education level. Non-self-sufficiency may thus be a function of an actual low education level, or that the actual education level is not recognized/validated in Sweden.
shows that family status also differs across regions of origin, with native Swedes having the largest share of single households, while immigrants from the Middle East to a larger extent live in some family constellation. For most regions of origin, except Middle East and Africa, single households without children are more common among non-self-sufficient than self-sufficient. Non-self-sufficient are thus less likely to have children and are also less likely to be married. Having a family is typically perceived as improving well-being and a sense of belonging, which can be hypothesized to improve quality of life (Chetty, Hendren & Katz, Citation2016; Cramm, van Dijk & Nieboer, Citation2012; Ludwig, Duncan, Gennetian et al., Citation2012). At the same time, there may be negative effects on the children growing up with non-self-sufficient parents. Since this aspect is beyond the scope of the present paper, we refer to other studies (see, for example, Leventhal & Brooks-Gunn, Citation2003; Sampson, Citation2003; Schulz et al., Citation2000).
Finally, illustrates the health aspect of non-self-sufficient versus self-sufficient individuals. For all regions of origin, the share receiving some type of financial benefit due to sickness is larger among non-self-sufficient individuals, which points to the fact that illness is more prevalent for those who cannot sustain themselves. At the same time, illness may be the very reason for having a low wage income. Judging from , inability to work due to illness is likely to explain part of the non-self-sufficiency among native Swedes, as well as among immigrants from West Balkan and Nordic countries. On the other hand, there is little variation in sickness levels across self-sufficient and non-self-sufficient among immigrants from Africa and Middle East, as well as North America-Oceania. The variation across immigrant groups is strikingly larger for non-self-sufficient than self-sufficient individuals. The observed differences across regions of origin could also reflect variations in knowledge about the Swedish welfare and health care systems (Franzén, Citation2001; Mood, Citation2011; Vogel et al., Citation2002).
Figure 9. Share of self-sufficient and non-self-sufficient who receive sickness compensation, per region of origin, 2018.
5. Determinants of Neighborhood Patterns of Non-Self-Sufficient Immigrants
In the conceptual framework of the paper, we argue that the neighborhood of residence affects the quality of life of non-self-sufficient immigrants. Previous studies typically find that socioeconomically weak neighborhoods, which are often ethnically segregated (Malmberg et al., Citation2018; Nielsen & Hennerdal, Citation2017), have a negative impact on individual employment and health outcomes (Martens et al., Citation2014; Pickett & Pearl, Citation2001). In this part of the paper, we turn the question around: what determines the residential choices of immigrants?
The descriptive statistics provided above show that non-self-sufficient immigrants tend to live in socioeconomically weaker () and more ethnically segregated () neighborhoods to a larger extent than self-sufficient immigrants, and to a larger extent than native Swedes. At the same time, one sees a larger share of immigrants than natives who are at risk-of-poverty (). Immigrants also have on average lower wage incomes and disposable incomes (), as well as higher shares of low educated (). All these factors affect the possibility to choose one’s neighborhood of residence. The descriptive statistics cited above also show large differences across immigrant groups, both in terms of residential patterns and individual characteristics, suggesting that ethnicity plays a more or less important role depending on region of origin. The descriptive statistics show that even though income is likely to influence residential choices by, for example, limiting choices to neighborhoods with cheap rental apartments, the effect still differs across immigrant groups.
To further explore these issues, we regress neighborhood type (high poverty, high ethnic, high poverty and high ethnic) on the individual characteristics explored descriptively above.Footnote19 presents the results.
Table 4. Average marginal effects for the probability to reside in a high poverty (1), high ethnic (2), and high poverty and high ethnic (3) neighborhood.
shows that the probability to reside in a neighborhood classified as high poverty is 5.4%-points higher for non-self-sufficient individuals relative to self-sufficient individuals. Non-self-sufficiency seems to be less strongly associated to the probability to reside in a high ethnic neighborhood, the marginal effect being 2.4%-points. For neighborhoods classified as both high poverty and high ethnic, the marginal effect of being non-self-sufficient is in between, at 3.6%-points. Even though these marginal effects can be claimed to be not only statistically but also economically significant, the marginal effects of being from certain regions of origin are even larger in magnitude. The probability to reside in socioeconomically weak and/or ethnically segregated neighborhoods increases by 35–41%-points for immigrants born in Africa, a result in line with Vogiazides and Chihaya (Citation2019). Also individuals from the Middle East, West Balkan, and South-Central Asia have a high probability to reside in these types of neighborhoods. On the other hand, the marginal effects of being from North America-Oceania, the Nordic countries, and EU15 are relatively small, showing similar neighborhood patterns to native Swedes. Hence, the differences across regions of origin hold when controlling for individual characteristics and region type. As discussed above, this may be due to differences in preferences across ethnic groups, as well as information asymmetries and discrimination toward stigmatized groups (typically those of non-Western origin and of a lower average income) (Bergman et al., Citation2019; Burnazoglu, Citation2023; Hedman, Citation2013; Vogiazides & Chihaya, Citation2019).
All control variables show the expected sign and are in most cases statistically significant. Individuals with a higher disposable income and a higher education level have a lower probability to reside in socioeconomically weak and ethnically segregated neighborhoods. Females, older individuals, and those in some sort of family constellation (married and/or having children) are also less likely to reside in such neighborhoods. Living in a metropolitan region increases the probability that the neighborhood is classified as high ethnic by 27%-points, while the marginal effect on the probability that the neighborhood is high poverty is only 4.1%-points. These results reflect the stronger overrepresentation of high ethnic neighborhoods, as compared to high poverty neighborhoods, in metropolitan regions, as shown by and .
Since the binary measure of non-self-sufficiency is based on individuals’ disposable income, the two variables can be expected to be correlated. However, as shown by the correlation matrix in , the bivariate correlation is only −0.25, not indicative of any issues of multicollinearity. To ensure this, we have run additional estimations excluding disposable income, which produce somewhat larger estimates for, in particular, non-self-sufficiency and ethnic backgrounds. Since the continuous measure of disposable income captures more information (that is relevant for neighborhood choices) than the binary measure of non-self-sufficiency, we report the estimates from regressions including disposable income in order to avoid overestimating the importance of other variables.
5.1. Interaction between Non-Self-Sufficiency and Region of Origin
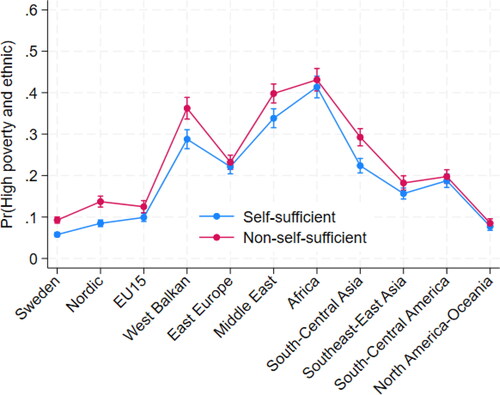
The logistic models, whose results are depicted in , are estimated with interaction effects between non-self-sufficiency and region of origin. These interaction effects are explored by contrasts, which estimate the marginal effect of being non-self-sufficient across regions of origin. shows the estimated predictive probabilities that individuals reside in a neighborhood classified as high poverty, comparing across self-sufficient and non-self-sufficient as well as regions of origin. and show the corresponding estimates for high ethnic neighborhoods and high ethnic and high poverty neighborhoods, respectively. The pattern of resembles that of , while is similar to . Hence, ethnic background seems to play a major role in individuals’ neighborhood choices even when controlling for income and other individual characteristics, as well as region type.
Figure 10. Predictive margins of non-self-sufficiency and regions of origin with 95% confidence intervals, for probability to reside in a high poverty neighborhood.
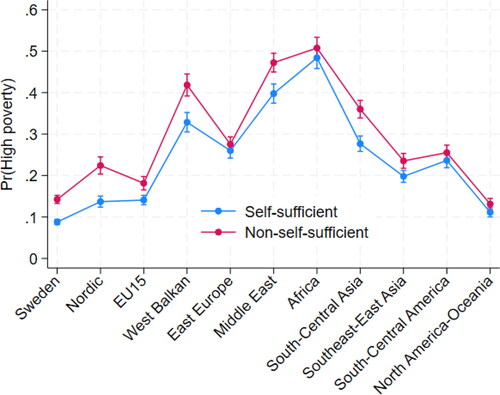
Figure 11. Predictive margins of non-self-sufficiency and regions of origin with 95% confidence intervals, for probability to reside in a high ethnic neighborhood.
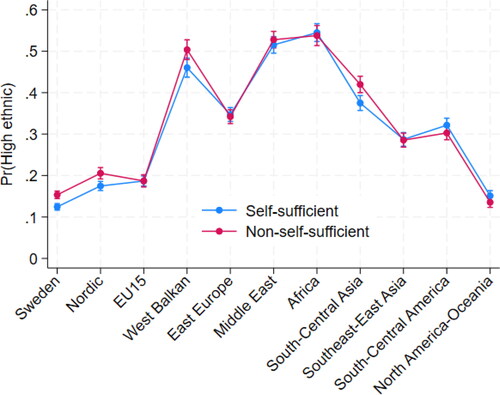
Figure 12. Predictive margins of non-self-sufficiency and regions of origin with 95% confidence intervals, for probability to reside in a high poverty and high ethnic neighborhood.
shows that the predictive probability to reside in a high poverty neighborhood is larger for individuals who are non-self-sufficient. This holds for all regions of origin but to varying degrees, which shows the existence of interaction effects between non-self-sufficiency and region of origin. Similar conclusions, though to a lesser extent, can be made for , as well as .
Hence, indicate that the marginal effect of being non-self-sufficient differs across regions of origin. The three figures also indicate that the statistical significance of that difference varies across regions of origin, shown by the variation in overlaps of confidence intervals. To explore this further, shows the estimated difference in the predicted probability of non-self-sufficient versus self-sufficient to reside in a socioeconomically weak and/or ethnically segregated neighborhood. The point estimates in thus represent the marginal effect of being non-self-sufficient for each region of origin. The magnitude and significance, and even sign, of the effect differ greatly across regions of origin, again showing that the effect of non-self-sufficiency is not constant.
Figure 13. Contrasts of predictive margins of non-self-sufficiency over regions of origin with 95% confidence intervals, for probability to reside in a high poverty neighborhood (top blue), a high ethnic neighborhood (bottom red), and a high poverty and high ethnic neighborhood (middle green).
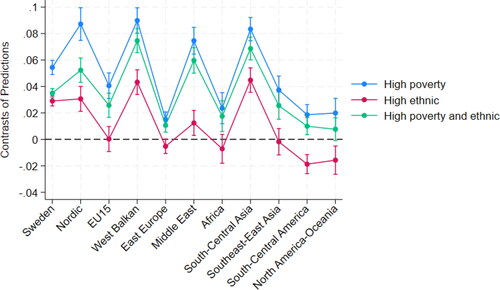
shows that for immigrants born in Nordic, West Balkan, and South-Central Asian countries, non-self-sufficiency is associated with a higher probability to reside in a high poverty neighborhood by 8–9%-points. The marginal effect of non-self-sufficiency is much lower, around 2%-points, for immigrants from East Europe, Africa, South-Central America, and North America-Oceania. Also, the marginal effects of just being from these regions, except for Africa, are relatively small (). Immigrants from Africa, on the other hand, have the highest probability to reside in high poverty neighborhoods (), which suggests that ethnic background rather than income determines neighborhood patterns of Africans. For Nordic immigrants, non-self-sufficiency seems to play a major role, while for West Balkan (and Middle East) immigrants, both ethnicity and income matter.
further shows that the story is somewhat different for high ethnic neighborhoods. The marginal effect of being non-self-sufficient is insignificant for EU15, East Europe, Africa, and Southeast-East Asia. For immigrants from South-Central America and North America-Oceania, the marginal effect of non-self-sufficiency is even negative, showing that self-sufficient individuals in these groups are more likely to reside in ethnically segregated neighborhoods. Again, immigrants from West Balkan countries, as well as South-Central Asia, are more likely to reside in high ethnic neighborhoods if they are non-self-sufficient, the marginal effect being just above 4%-points.
The pattern for the marginal effects of non-self-sufficiency on the probability to reside in a neighborhood classified as both high poverty and high ethnic falls, as expected, somewhere in between high ethnic and high poverty. These findings offer evidence that the way ethnicity or income determine neighborhood patterns differs across ethnic backgrounds. They are in line with Aldén and Hammarstedt (Citation2015), and are consistent with the conclusions drawn above, as well as with the descriptive parts of the paper. Immigrants from Africa reside in socioeconomically weak and ethnically segregated neighborhoods no matter whether they are self-sufficient or not. Also West Balkan, Middle Eastern, and South-Central Asian immigrants tend to live in segregated neighborhoods but for these groups, non-self-sufficiency plays a major role in the neighborhood selection. Immigrants from the Nordic countries are among the ones who are least likely to reside in high poverty and high ethnic neighborhoods, but they see a relatively large marginal effect of non-self-sufficiency. This is also the case for native Swedes, especially when it comes to ethnically segregated neighborhoods.
5.2. Robustness Tests
Previous studies show that the economic integration of immigrants increases by time spent in the host country, for example, by acquiring country-specific skills such as language skills and knowledge about the labor market and (formal and informal) institutions (Borjas, Citation1999; Chiswick, Citation1978; Sjaastad, Citation1962).Footnote20 This may also translate into improved residential integration (that is, less segregation) since higher income jobs and increased knowledge about Swedish systems and institutions, for example, regarding the housing market, increases the possibilities to choose one’s neighborhood of residence. The results shown above already control for disposable income, which is expected to increase with time spent in the country. As a robustness test, we perform additional estimations directly controlling for the time spent in Sweden, introduced as a proxy for the accumulation of country-specific skills potentially influencing residential choices. presents the results for the variables of main interest, while recreates , the only difference being that time spent in Sweden is added as a control variable.
Figure 14. Contrasts of predictive margins of non-self-sufficiency over regions of origin with 95% confidence intervals, for probability to reside in a high poverty neighborhood (top blue), a high ethnic neighborhood (bottom red), and a high poverty and high ethnic neighborhood (middle green). Underlying estimations include years in Sweden as additional control variable.
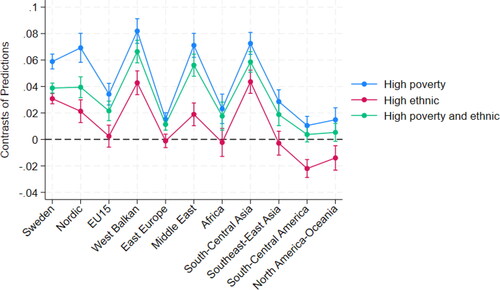
Table 5. Average marginal effects for the probability to reside in a high poverty (1’), high ethnic (2’), and high poverty and high ethnic (3’) neighborhood, including control for time spent in Sweden.
Comparing and , the average marginal effect of being non-self-sufficient is robust in terms of both sign, significance, and size. Additionally, the sign and significance for the ethnic backgrounds are in most cases robust when controlling for years in Sweden. The exceptions are the marginal effects for EU15, turning insignificant for neighborhoods defined as high poverty (1′) as well as high poverty and high ethnic (3′), and North America-Oceania, turning significantly negative in all three specifications. This implies that when controlling for time spent in the country, immigrants originating from North America and Oceania are, on average, less likely than native Swedes to reside in socioeconomically weak and ethnically segregated neighborhoods. Additionally, in all three specifications, the size of the marginal effects of ethnic background decreases in as compared to . For example, the marginal effect for African immigrants decreases from 35–41% points to 26–34% points. The overall results do however still hold; immigrants from Africa and the Middle East, followed by West Balkan and South-Central Asia have the highest probability to reside in neighborhoods of high poverty and high ethnic segregation.
Despite somewhat smaller marginal effects of non-self-sufficiency for some ethnic backgrounds, shows a familiar pattern to , reaffirming the main results regarding differences in neighborhood choices across ethnic groups.
Interestingly, the results for the time spent in Sweden () display a non-linear U-shaped pattern. Immigrants arriving within the last five years have a lower likelihood to reside in high poverty and/or high ethnic neighborhoods than immigrants having spent 6–15 years in Sweden. This may be attributed to Swedish displacement policies locating newly arrived immigrants in socioeconomically stronger and less ethnically segregated neighborhoods. After some years though, our results can be interpreted as if immigrants sort themselves to higher poverty and more ethnically segregated places, which may be due to ethnic preferences, information asymmetries, and/or discrimination (Bergman et al., Citation2019; Burnazoglu, Citation2023; Hedman, Citation2013; Vogiazides & Chihaya, Citation2019). Later on, 16 years and upwards, the residential patterns of immigrants again start to resemble more the patterns of native Swedes, although no matter their time spent in Sweden, the likelihood to reside in a high poverty and/or high ethnic neighborhood is significantly higher than for natives.
In the estimations above, ‘high poverty’ and ‘high ethnic’ neighborhoods are defined as those having a higher share than 1.5 times the corresponding share for the country as a whole. As a further robustness test, we change the cut-off point for ‘high’ poverty and ‘high’ ethnic neighborhoods according to the 75th, 90th, and 95th percentiles. Hence, neighborhoods with the 25% (10, 5) highest shares of population at risk of poverty and of population born in non-Nordic/EU15 countries are classified as high poverty and high ethnic, respectively. presents the results for the variables of main interest. presents the number of neighborhoods classified as ‘high’ given the various definitions, as well as the minimum share of population at risk of poverty and population born in non-Nordic/EU15 countries required to be classified as a high poverty and a high ethnic neighborhood, respectively.
Table 6. Average marginal effects for the probability to reside in a high poverty (1’’), and high ethnic (2’’) neighborhood, defined according to 75th. 90th, and 95th percentiles.
As shown by , also comparing with , the higher the cut-off point (that is, the population share), and thereby the fewer the neighborhoods classified as high poverty and high ethnic, respectively (), the smaller are generally the estimated marginal effects. The main patterns do however still hold; individuals who are non-self-sufficient are more likely to reside in socioeconomically weak and ethnically segregated neighborhoods. The marginal effect of being of certain ethnic backgrounds is, however, much larger. African and Middle Eastern immigrants are the most likely to reside in these types of neighborhoods, while immigrants from North America-Oceania, EU15 and Nordic countries show more similar (although in most cases still statistically different) residential patterns to native Swedes.
6. Conclusions
This paper promotes the neighborhood perspective in quality-of-life studies by describing and analyzing the locational (and individual) characteristics of low-income immigrants as compared to natives. This perspective follows from previous research showing a strong connection between local socioeconomic conditions and various economic and social outcomes. Based on Swedish register data, our descriptive statistics show that quality-of-life indicators/studies gain by distinguishing between various ethnic backgrounds and income levels. Our paper specifically adds to the previous literature by adopting the perspective of non-self-sufficiency in our descriptions of potential life satisfaction. The concept of (non-)self-sufficiency, brought forward by Eklund and Larsson (Citation2020), is argued to better capture the economic integration of immigrants than, for example, employment measures. It has received plenty of attention by policy makers, public organizations, and media in Sweden, yet its utilization in research has been limited to date.
We find that non-self-sufficient immigrants especially from Africa and the Middle East may face limitations in their life satisfaction due to their economic and locational conditions. Controlling for other individual factors determining their neighborhood of residence, these two immigrant groups are most likely to reside in ethnically segregated and socioeconomically weak neighborhoods. Such neighborhoods may, for example, suffer from crime and physical unsafety (cf. Ma et al., Citation2018, Edling, Citation2015, Swedish Police, Citation2017), have less access to leisure activities (Lindström & Sundquist, Citation2001; Lindström et al., Citation2003), and offer limited opportunities for employment and higher-income jobs (cf. Cutler & Glaeser, Citation1997, Wixe & Pettersson, Citation2020). All these factors are likely to contribute to psychological problems, often worsened by stress, and, consequently, a reduced quality of life (cf. Boardman et al., Citation2001; Brajša-Žganec et al., Citation2011; Ma, Citation2022; Santiago et al., Citation2011).
The results also show that for African immigrants, their ethnic background rather than income level determines their neighborhood patterns. Such locational patterns may indicate a strong internal-to-the community information flow influenced by the tradition of clan societies (Bratton, Citation1989; Ssereo, Citation2003). Immigrants from Nordic countries show similar neighborhood patterns to native Swedes, where economic conditions seem to dictate residence in neighborhoods characterized by high poverty and high ethnic segregation. For West Balkan and Middle Eastern immigrants, both ethnicity and income matter in their choice of neighborhood type.
As the supply of housing types and their prices/rents vary across neighborhoods, non-self-sufficient immigrants are constrained in their opportunities to choose in what type of neighborhood to reside. Indeed, we show that non-self-sufficient individuals have, on average, lower disposable income and are mainly accessing rental apartments that do not require capital investments. Additionally, immigrant groups with the lowest average income are taking the cheapest housing option.
Based on previous studies, we can discuss potential explanations for the large variations across ethnic groups, which hold after controlling for individual characteristics, including ethnic preferences, social/economic exclusion, and discrimination (Burnazoglu, Citation2023; Hedman, Citation2013; Vogiazides & Chihaya, Citation2019). However, with our quantitative approach, using register data, descriptive statistics, and regression analysis, we cannot explicitly test the mechanisms underlying our results. We thus encourage future qualitative studies with complementary approaches, such as surveys and interviews, to delve deeper into these issues. For example, what is the role of formal and informal institutions on the outcomes of immigrants in the Swedish labor and housing markets. Further research may also help explain whether and to what extent differences across ethnic groups are due to social stratification in relation to individual or group heterogeneity (cf. Burnazoglu, Citation2023; Parsons, Citation1940). Such heterogeneity may be due to variations in immigrants’ (group and individual) history in their countries of origin, which we cannot analyze explicitly using Swedish register data, but assume is embedded in their ethnic backgrounds. However, as discussed by Obeng-Odoom (Citation2022), immigrant groups bring institutional, economic, and political histories from their home countries, which have consequences for their outcomes in the host country (for example, due to strong path dependency). An additional topic of interest where register data are typically lacking is that of time poverty and how this relates specifically to the well-being of individuals who are non-self-sufficient (see, for example, Williams et al., Citation2016).
Our results and discussions in this paper are not only relevant for research on quality-of-life issues, but also from a policymaking perspective. The large differences in living conditions across ethnic groups, related to both self-sufficiency, income, and education, and the quality of the neighborhood, show the importance of improved integration strategies. The concept of integration needs to consider a social, a residential, and a labor market dimension, three dimensions which are interconnected and often strengthened by each other. Integration policies thus need to address all these aspects. At the same time, it should be noted that improved labor market integration may not lead to increased residential integration, and thereby increased social integration, for certain immigrant groups. The mechanisms of neighborhood self-selection seem to differ across ethnic backgrounds, and policies to decrease residential segregation need to adapt to this heterogeneity.
Data Availability Statement
The data that supports the findings of this study are available from Statistics Sweden. Restrictions apply to the availability of these data, which were used under license for this study.
Additional information
Funding
Notes
1 The data on employment shares of native-born and foreign-born in OECD countries are available via the following webpage (link Employment rates), https://www.oecd.org/els/mig/keystat.htm.
2 In Sweden, the employment statistics measure the share in the labor force of those who were employed at least one hour during the month of November.
4 Calculated based on 2018 data from Statistics Sweden on number of immigrants, https://www.scb.se/hitta-statistik/sverige-i-siffror/manniskorna-i-sverige/utrikes-fodda/, and total population in Sweden, https://www.scb.se/hitta-statistik/statistik-efter-amne/befolkning/befolkningens-sammansattning/befolkningsstatistik/.
5 In this paper, when discussing our empirical approach and empirical results, immigrants refer to individuals born in another country than Sweden. We thus use the terms ‘immigrant’ and ‘foreign born’ interchangeably.
6 Their questionnaires cover 9 parameters of quality of life: 1-material living conditions, 2-productive activity, 3-health, 4-education, 5-leisure and social interactions, 6-economic security and physical safety, 7-governance and basic rights, 8-natural and living environment and 9-overall experience of life.
8 The survey on quality of life in Sweden was completed with 2018 data. The Eurostat website of 2021 published the last survey per countries, so data and availability of data may differ. https://ec.europa.eu/eurostat/statistics-explained/index.php?title=Quality_of_life_indicators_-_social_interactions
9 The survey on health in Sweden was completed with 2018 data.
10 The survey on security and perceived crime and violence in Sweden was completed in 2019. See https://ec.europa.eu/eurostat/statistics-explained/index.php?title=File:Economic_security_2021_fig10.png
11 This part of the Eurostat survey is based upon EU-SILC 2015 survey. https://ec.europa.eu/eurostat/web/microdata/european-union-statistics-on-income-and-living-conditions
12 At the time of this study, 2018 was the most recent year of data availability. Considering the results of Vogiazides and Chihaya (Citation2019) that 81 percent of immigrants in Sweden consistently reside in the same type of neighborhood (in regard to poverty), we do not expect large variations in our results over the years.
13 Ethnic background is based on region of origin as country of origin is not available in the official statistics. See Appendix A for a list of countries included in each background region.
15 Immigrants from Nordic and EU15 countries are excluded in the measure of ethnic segregation since they are generally more ethnically and culturally similar to native Swedes than immigrants from other regions of origin.
16 As a robustness test, we use different cut-off points for high poverty and high ethnic neighborhoods, reported in Section 5.2.
17 With predicted probabilities between approximately 0.2 and 0.8, a linear probability model may have been preferred due to ease of interpretation. The linear probability model has also been run in the present case, with similar results. The logit model is also preferred to the probit model due to the large sample size (Cakmakyapan & Goktas, Citation2013). In practice, logit and probit estimations produce virtually identical average marginal effects.
18 For example, to be eligible for unemployment benefits, six months of previous employment in Sweden is required.
19 Housing type is not used as an explanatory variable in the estimations due to strong correlation with neighborhood type. We have run additional estimations on the probability to live in a rental apartment, which give very similar, or even stronger, results to the estimations on neighborhood types.
20 This is also in line with classical theories of the accumulation of human capital (Becker, Citation1964; Mincer, Citation1958).
21 • • •
References
- Abramsson, M., Borgegård, L. E., & Fransson, U. (2002). Housing careers: Immigrants in local Swedish housing markets. Housing Studies, 17(3), 445–464. https://doi.org/10.1080/02673030220134944
- Alesina, A., & La Ferrara, E. (2002). Who trusts others? Journal of Public Economics, 85(2), 207–234. https://doi.org/10.1016/S0047-2727(01)00084-6
- Aldén, L., & Hammarstedt, M. (2015). Boende med konsekvens: en ESO-rapport om etnisk bostadssegregation och arbetsmarknad [in Swedish]. Finansdepartementet, Regeringskansliet.
- Aldén, L., & Hammarstedt, M. (2016). Flyktinginvandring – Sysselsättning, förvärvsinkomster och offentliga finanser [in Swedish]. Report to Finanspolitiska rådet 2016/1.
- Andersson, H. (2020). Ethnic enclaves, self-employment, and the economic performance of refugees: Evidence from a Swedish dispersal policy. International Migration Review, 55(1), 58–83. https://doi.org/10.1177/0197918320912195
- Andersson, L., & Hammarstedt, M. (2015). Ethnic enclaves, networks and self‐employment among Middle Eastern immigrants in Sweden. International Migration, 53(6), 27–40. https://doi.org/10.1111/j.1468-2435.2011.00714.x
- Andersson, M., Larsson, J. P., & Öner, Ö. (2020). Ethnic enclaves and self-employment among Middle Eastern immigrants in Sweden: Ethnic capital or enclave size? Regional Studies, 55(4), 590–604. https://doi.org/10.1080/00343404.2020.1839638
- Andersson, R. (2013). Reproducing and reshaping Ethnic Residential Segregation in Stockholm: The role of selective migration moves. Geografiska Annaler: Series B, 95(2), 163–187.
- Aron, R. (1967). 18 Lectures on industrial society, translated by M.K. Bottomore. Weidenfeld and Nicolson.
- Atkinson, R., & Kintrea, K. (2001). Disentangling area effects: Evidence from deprived and non-deprived neighbourhoods. Urban Studies, 38(12), 2277–2298. https://doi.org/10.1080/00420980120087162
- Backman, M., Lopez, E., & Rowe, F. (2021). The occupational trajectories and outcomes of forced migrants in Sweden. Entrepreneurship, Employment or Persistent Inactivity? Small Business Economics, 56, 963–983.
- Baumol, W. J. (1990). Entrepreneurship: Productive, unproductive and destructive. Journal of Political Economy, 98(5, Part 1), 893–921. https://doi.org/10.1086/261712
- Becker, G. S. (1964). Human capital: A theoretical and empirical analysis, with special reference to education. University of Chicago Press.
- Bell, D., Blanchflower, D. (2011Youth unemployment in Europe and the United States. IZA Discussion Paper, No 5673, IZA, Bonn.
- Bergman, P., Chetty, R., DeLuca, S., Hendren, N., Katz, L. F., Palmer, C. (2019). Creating moves to opportunity: Experimental evidence on barriers to neighborhood choice. Working Paper, No 26164. National Bureau of Economic Research.
- Boardman, J. D., Finch, B. K., Ellison, C. G., Williams, D. R., & Jackson, J. S. (2001). Neighborhood disadvantage, stress, and drug use among adults. Journal of Health and Social Behavior, 42(2), 151–165.
- Boschma, R. (2005). Proximity and innovation: A critical assessment. Regional Studies, 39(1), 61–74. https://doi.org/10.1080/0034340052000320887
- Borjas, G. J. (1999). The economic analysis of immigration. In O. C. Ashenfelter & D. Card (Eds.), Handbook of labor economics (Vol. 3A, 1697–1760). Elsevier.
- Bornhäll, A., Daunfeldt, S.-O., & Westerberg, H. (2019). Less than 30 percent of non-western immigrants earn a monthly wage that exceeds 2,000 euro after nine years in Sweden. HFI notes no 1/2019.
- Brajša-Žganec, A., Merkaš, M., & Šverko, I. (2011). Quality of life and leisure activities: How do leisure activities contribute to subjective well-being? Social Indicators Research, 102(1), 81–91. https://doi.org/10.1007/s11205-010-9724-2
- Bratton, M. (1989). Beyond the state: Civil society and associational life in Africa. World Politics, 41(3), 407–430. https://doi.org/10.2307/2010506
- BRÅ, Brottsförebyggande rådet [The Swedish National Council for Crime Prevention]. (2018). Utvecklingen i socialt utsatta områden i urban miljö 2006–2017 [in Swedish]. Report 2018:9. Stockholm.
- Bråmå, Å. (2008). Dynamics of ethnic residential segregation in Göteborg, Sweden, 1995–2000. Population, Space and Place, 14(2), 101–117. https://doi.org/10.1002/psp.479
- Bråmå, Å., & Andersson, R. (2010). Who leaves rental housing? Examining possible explanations for ethnic housing segmentation in Uppsala, Sweden. Journal of Housing and the Built Environment, 25(3), 331–352. https://doi.org/10.1007/s10901-010-9179-4
- Burnazoglu, M. (2023). Stratification mechanisms in labour market matching of migrants. Cambridge Journal of Economics, 47(1), 67–89. https://doi.org/10.1093/cje/beac058
- Cakmakyapan, S., & Goktas, A. (2013). A comparison of binary logit and probit models with a simulation study. Journal of Social and Economic Statistics, 2(1), 1–17.
- Carr, M. D. (2013). Local area inequality and worker well-being. Review of Social Economy, 71(1), 44–64. https://doi.org/10.1080/00346764.2012.707399
- Chetty, R., Hendren, N., & Katz, L. F. (2016). The effects of exposure to better neighborhoods on children: New evidence from the Moving to Opportunity experiment. The American Economic Review, 106(4), 855–902. https://doi.org/10.1257/aer.20150572
- Chiswick, B. R. (1978). The effect of Americanization on the earnings of foreign-born men. Journal of Political Economy, 86(5), 897–921. https://doi.org/10.1086/260717
- Clark, W. A., & Ledwith, V. (2007). How much does income matter in neighborhood choice? Population Research and Policy Review, 26(2), 145–161. https://doi.org/10.1007/s11113-007-9026-9
- Clark, W. A., & Rivers, N. (2012). Community choice in large cities: Selectivity and ethnic sorting across neighbourhoods. In Understanding neighbourhood dynamics: New insights for neighbourhood effects research (pp. 255–279). Springer Netherlands.
- Coulter, R., & Clark, W. A. (2019). Ethnic disparities in neighbourhood selection: Understanding the role of income. International Journal of Urban and Regional Research, 43(5), 947–962. https://doi.org/10.1111/1468-2427.12697
- Cramm, J. M., van Dijk, H. M., & Nieboer, A. P. (2012). The importance of neighborhood social cohesion and social capital for the well being of older adults in the community. The Gerontologist, 53(1), 142–152. https://doi.org/10.1093/geront/gns052
- Cutler, D. M., & Glaeser, E. L. (1997). Are ghettos good or bad? Quarterly Journal of Economics, 112, 827–872.
- Cutler, D. M., Glaeser, E. L., & Vigdor, J. L. (2008). When are ghettos bad? Lessons from immigrant segregation in the United States. Journal of Urban Economics, 63(3), 759–774. https://doi.org/10.1016/j.jue.2007.08.003
- Deguilhem, T., Berrou, J.-P., & Combarnous, F. (2019). Using your ties to get a worse job? The differential effects of social networks on quality of employment in Colombia. Review of Social Economy, 77(4), 493–522. https://doi.org/10.1080/00346764.2019.1627573
- Di Tella, R., MacCulloch, R. J., & Oswald, A. J. (2001). Preferences over inflation and unemployment: Evidence from surveys of happiness. American Economic Review, 91(1), 335–341. https://doi.org/10.1257/aer.91.1.335
- Di Tella, R., MacCulloch, R. J., & Oswald, A. J. (2003). The macroeconomics of happiness. Review of Economics and Statistics, 85(4), 809–827. https://doi.org/10.1162/003465303772815745
- Edling, J. (2015). Förorterna som moder Svea glömde: En dokumentation av en obefintlig integrationspolitik [in Swedish]. Verdandi and Flexicurity.
- Eklund, J., & Larsson, J. P. (2020). När blir utrikes födda självförsörjande? [in Swedish]. Entreprenörskapsforum.
- Elofsson, S., Åkesson, M., & Blomdahl, U. (2020). Hur många deltar inte i det offentligt subventionerade fritids och kulturutbudet? - en studie av utomstående i åldersgruppen 10–19 år utifrån kön, ålder, socioekonomisk bakgrund och svensk/utländsk bakgrund [in Swedish]. Ung livsstil, Nr 30.
- Eurostat. (2021a). Eurostat Statistics explained, Quality of life indicators – productive or main activity, online publication. https://ec.europa.eu/eurostat/statistics-explained/index.php?title=Quality_of_life_indicators_-_productive_or_main_activity&oldid=539677.
- Eurostat. (2021b). Eurostat statistic explained, Quality of Life Indicators, online publication ISSN 2443-8219, last data extracted march 2021. https://ec.europa.eu/eurostat/statistics-explained/index.php?title=Quality_of_life_indicators.
- Fernandez, R., & Kulik, J. (1981). A multilevel model of life satisfaction: Effects of individual characteristics and neighborhood composition. American Sociological Review, 46(6), 840–850. https://doi.org/10.2307/2095082
- Franzén, E. (1997). Socialbidrag och invandrare [in Swedish]. Socialvetenskaplig Tidskrift, 4, 279–304.
- Franzén, E. (2001). Socialbidrag bland invandrare: erfarenheter från Sverige [in Swedish]. Sociologisk Forskning, 38(3-4), 9–39. https://doi.org/10.37062/sf.38.19458
- Grand, C. L., & Szulkin, R. (2002). Permanent disadvantage or gradual integration: Explaining the immigrant–native earnings gap in Sweden. LABOUR, 16(1), 37–64. https://doi.org/10.1111/1467-9914.00186
- Granovetter, M. (1983). The strength of weak ties: A network theory revisited. Sociological Theory, 1, 201–233. https://doi.org/10.2307/202051
- Granovetter, M. S. (1973). The strength of weak ties. American Journal of Sociology, 78(6), 1360–1380. https://doi.org/10.1086/225469
- Gustafsson, B. A., Mac Innes, H., & Österberg, T. (2017). Age at immigration matters for labor market integration—The Swedish example. IZA Journal of Development and Migration, 7(1), 1. https://doi.org/10.1186/s40176-017-0087-1
- Hedman, L. (2013). Moving near family? The influence of extended family on neighbourhood choice in an intra-urban context. Population, Space and Place, 19(1), 32–45. https://doi.org/10.1002/psp.1703
- Hallsten, M., Szulkin, R., & Sarnecki, J. (2013). Crime as a price of inequality? The gap in registered crime between childhood immigrants, children of immigrants and children of native Swedes. British Journal of Criminology, 53(3), 456–481. https://doi.org/10.1093/bjc/azt005
- Halpern, D. (1993). Minorities and mental health. Social Sciences and Medicine, 36, 597–607.
- Hammarstedt, M. (2006). The predicted earnings differential and immigrant self-employment in Sweden. Applied Economics, 38(6), 619–630. https://doi.org/10.1080/00036840500397069
- Hammarstedt, M., & Shukur, G. (2007). Immigrants’ relative earnings in Sweden–A quantile regression approach. International Journal of Manpower, 28(6), 456–473. https://doi.org/10.1108/01437720710819992
- Hammarstedt, M., & Skedinger, P. (2017). Minimilöner och integration av flyktingar på arbetsmarknaden – så kan experiment förbättra kunskapsläget [in Swedish]. Ekonomisk Debatt, 7(45), 30–40.
- Hjerm, M. (2004). Immigrant entrepreneurship in the Swedish welfare state. Sociology, 38(4), 739–756. https://doi.org/10.1177/0038038504045862
- Ibraimovic, T., & Masiero, L. (2014). Do birds of a feather flock together? The impact of ethnic segregation preferences on neighbourhood choice. Urban Studies, 51(4), 693–711. https://doi.org/10.1177/0042098013493026
- Ivlevs, A., Nikolova, M., & Graham, C. (2019). Emigration, remittances, and the subjective well-being of those staying behind. Journal of Population Economics, 32(1), 113–151. https://doi.org/10.1007/s00148-018-0718-8
- Klaesson, J., & Wixe, S. (2023). Place and immigrant labour market integration: A sequence analysis approach. European Urban and Regional Studies, 30(4), 404–429. https://doi.org/10.1177/09697764231166358
- Leão, T. S., Sundquist, J., Johansson, S.-E., & Sundquist, K. (2009). The influence of age at migration and length of residence on self-rated health among Swedish immigrants: A cross-sectional study. Ethnicity & Health, 14(1), 93–105. https://doi.org/10.1080/13557850802345973
- Leventhal, T., & Brooks-Gunn, J. (2003). Moving to opportunity: An experimental study of neighborhood effects on mental health. American Journal of Public Health, 93(9), 1576–1582. https://doi.org/10.2105/ajph.93.9.1576
- Lewis, V. A., Emerson, M. O., & Klineberg, S. L. (2011). Who we’ll live with: Neighborhood racial composition preferences of whites, blacks and Latinos. Social Forces, 89(4), 1385–1407. https://doi.org/10.1093/sf/89.4.1385
- Li, J., Auchincloss, A. H., Rodriguez, D. A., Moore, K. A., Diez Roux, A. V., & Sánchez, B. N. (2020). Determinants of residential preferences related to built and social environments and concordance between neighborhood characteristics and preferences. Journal of Urban Health: Bulletin of the New York Academy of Medicine, 97(1), 62–77. https://doi.org/10.1007/s11524-019-00397-7
- Lindström, M., & Sundquist, J. (2001). Immigration and leisure-time physical inactivity: A population-based study. Ethnicity & Health, 6(2), 77–85. https://doi.org/10.1080/13557850120068405
- Lindström, M., Moghaddassi, M., & Merlo, J. (2003). Social capital and leisure time physical activity: A population based multilevel analysis in Malmö, Sweden. Journal of Epidemiology and Community Health, 57(1), 23–28.
- Lowe, S. G., Searle, B. A., & Smith, S. J. (2012). From housing wealth to mortgage debt: The emergence of Britain’s asset-shaped welfare state. Social Policy and Society, 11(1), 105–116. https://doi.org/10.1017/S1474746411000455
- Ludwig, J., Duncan, G. J., Gennetian, L. A., Katz, L. F., Kessler, R. C., Kling, J. R., & Sanbonmatsu, L. (2012). Neighborhood effects on the long-term well-being of low-income adults. Science, 337(6101), 1505–1510. https://doi.org/10.1126/science.1224648
- Ma, J., Dong, G., Chen, Y., & Zhang, W. (2018). Does satisfactory neighbourhood environment lead to a satisfying life? An investigation of the association between neighbourhood environment and life satisfaction in Beijing. Cities, 74, 229–239. https://doi.org/10.1016/j.cities.2017.12.008
- Ma, Z., Liu, Y., Wan, C., Jiang, J., Li, X., & Zhang, Y. (2022). Health-related quality of life and influencing factors in drug addicts based on the scale QLICD-DA: A cross-sectional study. Health and Quality of Life Outcomes, 20(1), 109. https://doi.org/10.1186/s12955-022-02012-x
- Magnusson Turner, L., & Hedman, L. (2014). Linking integration and housing career: A longitudinal analysis of immigrant groups in Sweden. Housing Studies, 29(2), 270–290. https://doi.org/10.1080/02673037.2014.851177
- Malmberg, B., Andersson, E. K., Nielsen, M. M., & Haandrikman, K. (2018). Residential segregation of European and non-European migrants in Sweden: 1990–2012. European Journal of Population = Revue Europeenne de Demographie, 34(2), 169–193. https://doi.org/10.1007/s10680-018-9478-0
- Malmberg, B., & Clark, W. A. (2021). Migration and neighborhood change in Sweden: The interaction of ethnic choice and income constraints. Geographical Analysis, 53(2), 259–282. https://doi.org/10.1111/gean.12250
- Martens, P. J., Chateau, D. G., Burland, E. M., Finlayson, G. S., Smith, M. J., Taylor, C. R., Brownell, M. D., Nickel, N. C., Katz, A., & Bolton, J. M. (2014). The effect of neighborhood socioeconomic status on education and health outcomes for children living in social housing. American Journal of Public Health, 105(2), e2–2113. https://doi.org/10.2105/AJPH.2014.302460
- Mezuk, B., Ohlsson, H., Cederin, K., Sundquist, J., Kender, K. S., Sundquist, K. (2019). Immigrant enclaves and risk of drug involvement among asylum-seeking immigrants in Sweden: A quasi-experimental study. Drug and Alcohol Dependence, 205, 107666. https://doi.org/10.1016/j.drugalcdep.2019.107666
- Mincer, J. (1958). Investment in human capital and personal income distribution. Journal of Political Economy, 66(4), 281–302. https://doi.org/10.1086/258055
- Mood, C. (2011). Lagging behind in good times: Immigrants and the increased dependence on social assistance in Sweden. International Journal of Social Welfare, 20(1), 55–65. https://doi.org/10.1111/j.1468-2397.2009.00686.x
- Nielsen, M. M., & Hennerdal, P. (2017). Changes in the residential segregation of immigrants in Sweden from 1990 to 2012: Using a multi-scalar segregation measure that accounts for the modifiable areal unit problem. Applied Geography, 87, 73–84. https://doi.org/10.1016/j.apgeog.2017.08.004
- Obeng-Odoom, F. (2022). Global migration beyond limits: Ecology, economics, and political economy. Oxford University Press.
- OECD. (2020). International migration outlook 2020. OECD Publishing. https://doi.org/10.1787/ec98f531-en
- Orum, A. M., & Manley, D. (2020). Neighborhood effects. In A. M. Orum (Ed.), The Wiley Blackwell encyclopedia of urban and regional studies (pp. 1–9). Wiley Blackwell.
- Park, R. E., & Burgess, E. W. (1925). The city: Suggestions for investigation of human behavior in the urban environment. The University of Chicago Press.
- Parsons, T. (1940). An analytical approach to the theory of social stratification. American Journal of Sociology, 45(6), 841–862. https://doi.org/10.1086/218489
- Pickett, K. E., & Pearl, M. (2001). Multilevel analyses of neighbourhood socioeconomic context and health outcomes: A critical review. Journal of Epidemiology & Community Health, 55(2), 111–122. https://doi.org/10.1136/jech.55.2.111
- Powdthavee, N. (2012). Jobless, friendless and broke: What happens to different areas of life before and after unemployment? Economica, 79(315), 557–575. https://doi.org/10.1111/j.1468-0335.2011.00905.x
- Putnam, R. D. (2000). Bowling alone: The collapse and revival of American community. Simon and Schuster Paperbacks.
- Ricciardi, C., Williams, A., & Winsler, A. (2020). Neighborhood effects. In S. Hupp & J. Jewell (Eds.), The Encyclopedia of child and adolescent development (pp. 1–14). Wiley.
- Rooth, D.-O. (1999). Refugee immigrants in Sweden - Educational investments and labour market integration. Lund Economic Studies. Department of Economics, Lund University.
- Russo, G. (2012). Job and life satisfaction among part-time and full-time workers: The ‘‘identity’’ approach. Review of Social Economy, 70(3), 315–343. https://doi.org/10.1080/00346764.2011.632323
- Sampson, R. J. (2003). The neighborhood context of well-being. Perspectives in Biology and Medicine, 46(3), S53–S64. https://doi.org/10.1353/pbm.2003.0059
- Santiago, C. D., Wadsworth, M. E., & Stump, J. (2011). Socioeconomic status, neighborhood disadvantage, and poverty-related stress: Prospective effects on psychological syndromes among diverse low-income families. Journal of Economic Psychology, 32(2), 218–230. https://doi.org/10.1016/j.joep.2009.10.008
- Schelling, T. C. (1971). Dynamic models of segregation. Journal of Mathematical Sociology, 1, 143–186.
- Schulz, A., Williams, D., Israel, B., Becker, A., Parker, E., James, S. A., & Jackson, J. (2000). Unfair treatment, neighborhood effects, and mental health in the Detroit metropolitan area. Journal of Health and Social Behavior, 41(3), 314–332.
- Shields, M. A., Wheatley Price, S., & Wooden, M. (2009). Life satisfaction and the economic and social characteristics of neighbourhoods. Journal of Population Economics, 22(2), 421–443. https://doi.org/10.1007/s00148-007-0146-7
- Sirgy, M. J., & Cornwell, T. (2002). How neighborhood features affect quality of life. Social Indicators Research, 59(1), 79–114. https://doi.org/10.1023/A:1016021108513
- Sjaastad, L. (1962). The costs and returns of human migration. Journal of Political Economy, 70(5, Part 2), 80–93. https://doi.org/10.1086/258726
- Ssereo, F. (2003). Clanpolitics, clan‐democracy and conflict regulation in Africa: The experience of Somalia. Global Review of Ethnopolitics, 2(3–4), 25–40. https://doi.org/10.1080/14718800308405142
- Statistics Sweden (2023). Befolkningens arbetsmarknadsstatus (BAS) [in Swedish]. https://www.scb.se/hitta-statistik/statistik-efteramne/arbetsmarknad/sysselsattning-forvarvsarbete-och-arbetstider/befolkningensarbetsmarknadsstatus/ [accessed 2023-10-17]
- Stiglitz, J. E., Sen, A., & Fitoussi, J. P. (2009). Report by the commission on the measurement of economic performance and social progress. European Commission.
- Swedish Police (2017). Utsatta områden - Social ordning, kriminell struktur och utmaningar för polisen [in Swedish]. Nationella operativa avdelningen. Stockholm.
- Tavassoli, S., & Trippl, M. (2019). The impact of ethnic communities on immigrant entrepreneurship: Evidence from Sweden. Regional Studies, 53(1), 67–79. https://doi.org/10.1080/00343404.2017.1395007
- Toney, J., & Hamilton, D. (2022). Economic insecurity in the family tree and the racial wealth gap. Review of Evolutionary Political Economy, 3(3), 539–574. https://doi.org/10.1007/s43253-022-00076-5
- Tseng, F.-M., & Petrie, D. J. (2014). The implications for health, depression, and life satisfaction from a permanent increase in income for the disadvantaged elderly: Evidence from Taiwan. Review of Social Economy, 72(3), 311–336. https://doi.org/10.1080/00346764.2014.927725
- Van Ham, M., Boschman, S., & Vogel, M. (2018). Incorporating neighborhood choice in a model of neighborhood effects on income. Demography, 55(3), 1069–1090. https://doi.org/10.1007/s13524-018-0672-9
- Vogel, J., Hjerm, M., & Johansson, S. E. (2002). Integration till svensk välfärd. Om invandrares välfärd på 90 talet [in Swedish]. Levnadsförhållanden Rapport 96, Statistiska Centralbyrån, Arbetslivsinstitutet, 167.
- Vogiazides, L., & Chihaya, G. K. (2019). Migrants’ long-term residential trajectories in Sweden: Persistent neighbourhood deprivation or spatial assimilation? Housing Studies, 35(5), 875–902. https://doi.org/10.1080/02673037.2019.1636937
- Wiking, E., Johansson, S. E., & Sundquist, J. (2004). Ethnicity, acculturation, and self reported health. A population based study among immigrants from Poland, Turkey, and Iran in Sweden. Journal of Epidemiology & Community Health, 58(7), 574–582. https://doi.org/10.1136/jech.2003.011387
- Williams, J. R., Masuda, Y. J., & Tallis, H. (2016). A measure whose time has come: Formalizing time poverty. Social Indicators Research, 128(1), 265–283. https://doi.org/10.1007/s11205-015-1029-z
- Wixe, S., & Pettersson, L. (2020). Segregation and individual employment: A longitudinal study of neighborhood effects. Annals of Regional Science, 64, 9–36.
- Zhang, F., Zhang, C., & Hudson, J. (2018). Housing conditions and life satisfaction in urban China. Cities, 81, 35–44. https://doi.org/10.1016/j.cities.2018.03.012
Appendix A.
Table A1. List of countries included in each region of origin.
Appendix B.
Table B1. Correlation matrix.
Appendix C.
Table C1. Cut-off points (population shares) and number of neighborhoods for various definitions of high poverty and high ethnic neighborhoods, respectively.