

Abstract
Adipocyte characterization and assessing membrane proteins using flow cytometry has been proven to be challenging as adipocytes are fragile, especially in subjects with high BMI. We overcame these challenges through a protocol optimizing tissue digestion time by reducing intermediate steps to minimize adipocyte friction and breakage. We avoided requirement for specialized instrument configuration and used a modified gating strategy to prevent inclusion of lipid droplets during analysis. Up to 90% of the cell population were available in the gating area. We checked the expression level of ABCA1, a membrane protein reaffirming adipocyte selection. In summary, this protocol requires lesser tissue sample improving feasibility and cost efficiency. Thus, our flow cytometry method is an improvement for studying adipocyte membrane characteristics.
METHOD SUMMARY
Adipocyte characterization and assessing membrane proteins using flow cytometry has been challenging as adipocytes are fragile, especially in high BMI subjects. By lowering the adipocyte friction at multiple steps, the protocol significantly reduces the adipocyte breakage, which is a critical concern for the big and fragile adipocytes. We modified the standard adipocyte isolation and flow cytometry protocol on a flow analyzer. We reduced the number of steps and made it more user-friendly, without the requirement for any specific instrument add-ons.
1. Methodology
Flow cytometry is a sophisticated and versatile technique to measure the optical and fluorescent attributes of individual cells. The availability of a wide range of fluorescent dyes that can be tagged with antibodies against cellular proteins (including cell surface and intracellular proteins) [Citation1,Citation2] other user-friendly features like fast analysis, relatively higher throughput, lower sample requirements compared with conventional protein analysis techniques, availability of results in real-time and options for simultaneous multiple parameter analysis [Citation3] have resulted in flow cytometry making a significant contribution to advancements in clinical medicine [Citation4,Citation5].
The Adipose tissue is comprised of many different types of cells, with a preponderance of adipocytes [Citation6,Citation7]. The versatility of flow cytometry technique can be leveraged for analysing adipose tissue [Citation8]. However, analysis can be challenging due to adipocyte fragility that increases with expansion in adipocyte volume and due to the tendency of adipocytes to stick together [Citation9–11]. These can affect analytical interpretation and hinder instrument operations. The process is also time-consuming and specific instrument add-ons have been incorporated to avoid some of the pitfalls [Citation12]. So, a sufficient number of events may not be available for analysis due to issues discussed above.
We have developed a modified flow cytometry method for analysis of adipocyte membrane-bound proteins while decreasing sample requirement and breakage, without the need for specific instrument add-ons.
Ethical clearance (IECPG-15/23.01.2019, RT-26/28.02.2019) for the study under which the method was developed was taken from the Institutional Ethics Committee for Post graduate research (Basic Science) of the All India Institute of Medical Sciences, New Delhi, India. Participants were selected based on BMI with two groups: normal weight BMI (<24.9 kg/m2) and obesity BMI (≥30 kg/m2). Written consent was obtained from participants before the surgery.
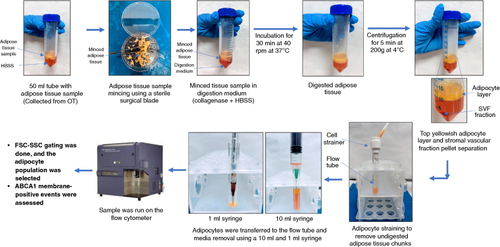
The chunk of visceral adipose tissue sample extracted by the operating surgeon was immediately placed in chilled 10 ml Hanks’ Balanced salt solution (HBSS), the tube sealed with parafilm and carried to the laboratory. The falcon was opened in a laminar flow cabinet and the tissue was taken out using wide-end forceps and weighed. Approximately 200 mg of the adipose tissue was placed in a chilled sterile Petri plate, washed twice with ice-cold phosphate-buffered saline solution to remove blood clots and transferred to a fresh Petri plate. HBSS (5 ml) was added, tissue minced and transferred to a 50 ml falcon tube and supplemented with 5 ml HBSS containing 100 ul of 0.1% collagenase solution. The solution was gently mixed using a microchannel pipette and the sealed Falcon was kept in the incubator shaker for 30 min at 40 rpm at 37°C. A fine yellowish layer was seen after incubation. If multiple undigested tissue fragments were observed after 30 min, the incubation time was increased to 40 min. Longer times or higher shaking speeds resulted in adipocyte breakage visible as an additional layer of oily film over the foamy adipocyte layer. The solution was then centrifuged at 200 g for 5 min at 4°C. Three layers were visible subsequently with the Stromal vascular fraction (SVF) fraction at the bottom, a middle layer containing the HBSS medium and a topmost yellowish foamy band containing adipocytes. The top layer was removed using a 1 ml pipette tip with the tip cut off. Adipocytes were passed through a 150 μm cell strainer in to a fresh 5 ml polystyrene round-bottom tube with a 12 × 75 mm style to remove undigested tissue. A layer of fresh butter-colored cells was obtained to which another one ml of fresh HBSS was added and centrifuged. A 10 ml (21 gauge) and 1 ml sterile syringe (26 gauge) was used to remove the medium from the bottom of the tube. To summarize, method modifications like using wide-end forceps, a larger Falcon tube to minimize friction, cutting the pipette tip to decrease shear and decreasing the amount of buffer for final washing decreased adipocyte breakage and cell loss. Substituting a syringe for plastic tips prevented adipocytes from sticking to the tips.
Staining cells for flow cytometry was done by adding 1 ml flow staining buffer (100 mM Tris [pH 7.4], 150 mM NaCl, 1 mM CaCl2, 0.5 mM MgCl2), to the adipocytes obtained. The sample was divided into one unstained and two stained aliquots to stain individually with DAPI (nuclear stain) and ABCA1 (membrane protein stain tagged with FITC (Alexa fluor 488). The positive control for ABCA1 was Breast cancer cell line MDA-MB-231. We increased the ratio of cells per unit buffer by using a lower amount of buffer to decrease the floating of adipocytes which necessitates regular vortexing for maintaining a single-cell suspension. Thus, lowering buffer amount decreased the vortexing frequency and duration and decreased adipocyte breakage.
The sample was incubated with anti-ABCA1 and DAPI for 1 h, at 4°C in the dark, covered with aluminium foil and gently tap-mixed every 10 min followed by the addition of paraformaldehyde (1% PFA) for cell fixation. Sample acquisition was done on the BD LSR Fortessa™ X-20 instrument. This machine has five lasers. DAPI is excited by the UV laser and the ABCA1 fluorochrome by the blue laser. The sample flow rate was maintained in the medium (35 μl/min), or low mode (12 μl/min) based on sample viscosity. The low mode was mostly run for adipose samples from the obese. Data management was done on the BDFACSDiva™ v8.0. In the cytometer settings for our analysis, areas of FSC, SSC, DAPI and Alexa Fluor 488 (for FITC) were selected and the rest were deleted from the software parameter settings. Data representation was done using dot plots and histograms. The first dot plot represented SSC-A and FSC-A to distinguish the intact adipocytes from the cell debris and lipid droplets. The second dot plot was drawn for FSC-A and FSC-H to remove the doublet population. The third plot i.e., the histogram, was to confirm the percentage of adipocytes with ABCA1 expression and DAPI-stained cells.
After setting the analysis parameters, the unstained tube was gently vortexed for 2–3 s before the acquisition to maintain the single-cell suspension. During acquisition, the FSC (235) - SSC (245) voltage was adjusted to ensure maximum events were inside the plot. Subsequently gating for adipocytes was done using a broad gating, as differential scattering of the events, the population was observed to be scattered and not compact. A total of 10,000 events were recorded per tube. These settings allowed the lipid droplets that otherwise form an S-shaped/spiral-like curve [Citation13] under default parameters, to condense into a compact area and be excluded from the analysis. In the second dot plot doublet population was selected using an extended rectangular gating. In the histogram for ABCA1, the voltage was adjusted accordingly to accommodate the autofluorescence to the left, preferably below the 103 log value .
Figure 1. Overview of adipocyte flow cytometry methodology.
In the stained sample run events were gated to accommodate all the adipocyte population in the first dot plot using DAPI. Singlet events were selected in the second plot. The third plot showed the percentage of DAPI-positive events, representing the percentage of the adipocytes (). The same approach was used to analyze the ABCA1 expression in both normal-weight and high BMI participants (n = 5). The ABCA1 positive cell population was higher in the normal-weight individuals compared with those who were obese. The primary use of ABCA1 was to check the protein level on the membrane but it also helped to distinguish the cells from lipid droplets since there would be no ABCA1 on the lipid droplets (, & ).
Figure 2. Selection of adipocyte population using DAPI as positive stain in unstained (A) and stained (B) sample.
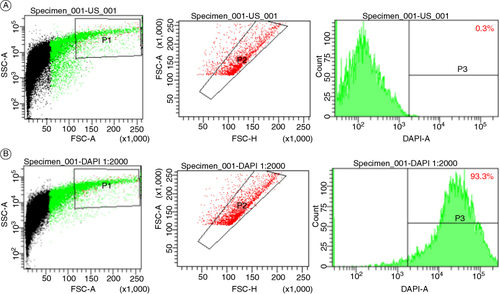
Figure 3. Selection of adipocyte population and assessment of membrane-bound ABCA1 in normal weight individuals in unstained (A) and stained (B) sample.
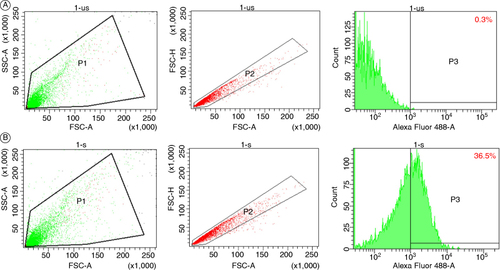
Figure 4. Selection of adipocyte population and assessment of membrane bound ABCA1 in high BMI individuals in unstained (A) and stained (B) sample.
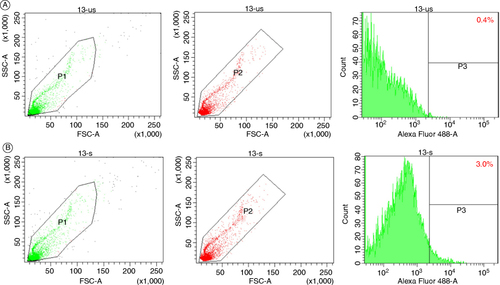
Table 1. (A) Summary of the % ABCA1 positive events in unstained and stained samples in normal weight participants.
The most recent protocol by Hagberg et al. [Citation11], used a specific MoFlo XDP FACS instrument equipped with the SmartSampler system, with an in-tube stirring feature to maintain the single-cell adipocyte suspension without adipocyte rupture. Additionally, a neutral density filter was inserted in front of the FSC detector to gate the adipocyte population and avoid lipid droplets. The FSC-SSC gating adjustments in our protocol are equally effective in the detection of adipocytes without the requirement of a neutral density filter and also accommodate the adipocyte size heterogeneity, thus precluding the requirement for specific instrument add-ons or system customization.
Flow cytometry experiments for freshly isolated adipocytes are more challenging than for other cell types, especially in participants with BMI more than 30 since these adipocytes have higher fragility [Citation14,Citation15].
2. Conclusion
In conclusion, the various modifications described above in the processing and particularly during flow cytometry analysis stages improved the efficiency of the method compared with previously described protocols making it feasible on regular flow cytometry instruments. We were able to get a detectable readout of a low-abundance protein like ABCA1 on adipocytes, justifying its use for studying other adipocyte membrane proteins. We thus provide an updated, improved flow cytometry protocol, adapted for wider use to investigate adipocyte characteristics. This is a relevant update given the intense interest in understanding adipose tissue biology in chronic diseases.
Author contributions
A Singh, S Aggarwal and S Shukla were responsible for the study design. S Shukla and A Bansal were involved in the data collection. S Shukla, A Bansal and A Singh conducted the formal analysis, investigation and methodology. A Singh, S Aggarwal and S Shukla were responsible for the project administration. A Singh and S Shukla did the writing (original draft preparation) and visualization. A Singh, S Shukla, S Aggarwal and A Bansal did the writing (reviewing and editing). All authors reviewed and approved the final manuscript.
Financial disclosure
Funding was provided by the SERB (Science and Engineering Research Board) project fund (EMR/2016/006018) and AIIMS (All India Institute of Medical Sciences), New Delhi intramural grant (A753). The authors have no other relevant affiliations or financial involvement with any organization or entity with a financial interest in or financial conflict with the subject matter or materials discussed in the manuscript apart from those disclosed.
Writing disclosure
No writing assistance was utilized in the production of this manuscript.
Ethical conduct of research
The authors state that they have obtained appropriate institutional review board approval (IECPG-15/23.01.2019, RT-26/28.02.2019) and/or have followed the principles outlined in the Declaration of Helsinki for all human or animal experimental investigations. In addition, for investigations involving human subjects, informed consent has been obtained from the participants involved.
Protocol.io reference link
The reference link for the protocol was added on the protocol.io with the reference DOI: 10.17504/protocols.io.36wgq3k7olk5/v1.
Supplementary Materials
Download MS Word (21.7 KB)Acknowledgments
We are extremely grateful to our laboratory technicians Ms Dolly and Mr Mudassir for their assistance. We would like to thank the resident and nursing staff of the Department of Surgical Disciplines, AIIMS, New Delhi for their assistance. We are indebted to the participants who agreed to participate in the study.
Supplemental material
Supplemental data for this article can be accessed at https://doi.org/10.1080/07366205.2024.2376466
Competing interests disclosure
The authors have no competing interests or relevant affiliations with any organization or entity with the subject matter or materials discussed in the manuscript. This includes employment, consultancies, stock ownership or options and expert testimony.
Additional information
Funding
References
- McKinnon KM. Flow cytometry: an overview. Curr Protoc Immunol. 2018;120(1):5.1.1–5.1.11. doi:10.1002/cpim.40
- Baumgarth N, Roederer M. A practical approach to multicolor flow cytometry for immunophenotyping. J Immunol Methods. 2000;243(1):77–97. doi:10.1016/S0022-1759(00)00229-5
- Cossarizza A, Chang HD, Radbruch A, et al. Guidelines for the use of flow cytometry and cell sorting in immunological studies*. Eur J Immunol. 2017;47(10):1584–1797. doi:10.1002/eji.201646632
- Manohar SM, Shah P, Nair A. Flow cytometry: principles, applications and recent advances. Bioanalysis. 2021;13(3):181–198. doi:10.4155/bio-2020-0267
- Edwards BS, Sklar LA. Flow cytometry: impact on early drug discovery. J Biomol Screen. 2015;20(6):689–707. doi:10.1177/1087057115578273
- Rosen ED, Spiegelman BM. What we talk about when we talk about fat. Cell. 2014;156(1):20–44. doi:10.1016/j.cell.2013.12.012
- Rutkowski JM, Stern JH, Scherer PE. The cell biology of fat expansion. J Cell Biol. 2015;208(5):501–512. doi:10.1083/jcb.201409063
- Robino J, Kim Y, Varlamov O. Single-cell sorting of non-human primate adipocytes with large-particle flow cytometry. Curr Protoc. 2021;1:e271. doi:10.1002/cpz1.271
- Lee Y-H, Chen S-Y, Wiesner RJ, et al. Simple flow cytometric method used to assess lipid accumulation in fat cells. J Lipid Res. 2004;45(6):1162–1167. doi:10.1194/jlr.D300028-JLR200
- Festy F, Hoareau L, B-Houtmann S, et al. Surface protein expression between human adipose tissue-derived stromal cells and mature adipocytes. Histochem Cell Biol. 2005;124(2):113–121. doi:10.1007/s00418-005-0014-z
- Hagberg CE, Li Q, Kutschke M, et al. Flow cytometry of mouse and human adipocytes for the analysis of browning and cellular heterogeneity. Cell Rep. 2018;24(10):2746–2756.e5. doi:10.1016/j.celrep.2018.08.006
- Majka SM, Miller HL, Helm KM, et al. Chapter fifteen - analysis and isolation of adipocytes by flow cytometry. in Methods Enzymol. 537. In: Macdougald OA, editor, Methods of Adipose Tissue Biology, Part A. 537. San Diego, CA: Academic Press; 2014. p. 281–296. doi:10.1016/B978-0-12-411619-1.00015-X
- Boumelhem BB, Assinder SJ, Bell-Anderson KS, et al. Flow cytometric single cell analysis reveals heterogeneity between adipose depots. Adipocyte. 2017;6(2):112–123. doi:10.1080/21623945.2017.1319536
- Richard AJ, White U, Elks CM, et al. Adipose Tissue: Physiology to Metabolic Dysfunction. [Updated 2020 Apr 4]. In Feingold KR, Anawalt B, Blackman MR, et al. , et al. editors, Endotext [Internet]. South Dartmouth (MA): MDText.com, Inc.; 2000. Available from: https://www.ncbi.nlm.nih.gov/sites/books/NBK555602/
- Stenkula KG, Erlanson-Albertsson C. Adipose cell size: importance in health and disease. Am J Physiol Regul Integr Comp Physiol. 2018;315(2):R284–R295. doi:10.1152/ajpregu.00257.2017

