

Abstract
Detecting glucose accurately and sensitively from clinical samples like tears and saliva is still difficult. We have created a sensor that can detect glucose with high sensitivity and accuracy by combining the use of glucose oxidase (GOx) to catalyze glucose, a pistol-like DNAzyme (PLDz) to transform the signal, gold nanoparticles (AuNPs) to enhance the optical properties and the exonuclease-III (Exo-III) to amplify the signal. As a result, the proposed method exhibits a low detection limit of 7.5 pM and a wide detection range covering seven orders of magnitude. The suggested dual-mode strategy provides a sensitive, precise and specific detection method for glucose. Another advantage is that the dual-mode technique significantly improves the precision and consistency of the measurements, demonstrating its immense potential for use in biomedical research and clinical diagnostics.
METHOD SUMMARY
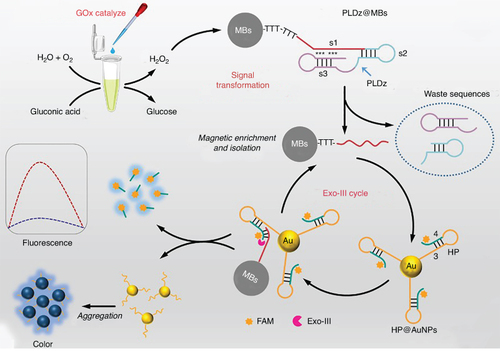
In brief, glucose oxidation, facilitated by GOx, results in the creation of H2O2. The self-cleavage function of PLDz is triggered upon detection of the generated H2O2. The two procedures initiated by GOx and PLDz are crucial in precisely detecting glucose and turning glucose signals into nucleic acid signals. The PLDz fragments obtained can facilitate Exo-III-assisted signal amplification, resulting in the release of fluorophores into the solution and the aggregation of AuNPs. The probes were intricately constructed to prevent hydrolysis by Exo-III under ideal conditions, resulting in a low background and high sensitivity.
Introduction
Gestational diabetes mellitus (GDM) is a condition characterized by a disruption in glucose metabolism.
There is a significant need to establish a technique that can precisely and effectively identify glucose in clinical samples.
Materials & methods
Chemical reagents and apparatus.
Glucose detection through the proposed strategy.
Results & discussion
The working principle of the proposed strategy for glucose detection.
Investigation of PLDz for H2O2 sensing and activating Exo-III assisted signal cycle.
Sensitivity analysis
Clinical application of the method.
Conclusion
This technique offers a sensitive, reliable and dual-mode approach to glucose detection.
1. Background
Gestational diabetes mellitus (GDM) is a condition characterized by a disruption in glucose metabolism [Citation1–3]. It is a global health concern, as it increases the possibility of developing Type II diabetes mellitus (DM) in the future [Citation4]. Prolonged deviations in blood glucose levels can lead to severe health consequences, such as organ impairment, loss of vision and epileptic episodes. An early diagnosis of DM is essential for promptly implementing self-management and long-term therapy [Citation5]. Currently, the diagnosis of diabetes relies mainly on analyzing blood samples to measure glucose levels. This method places a significant psychological invasion on patients, as they must undergo frequent intrusive procedures to monitor their daily diabetic fluctuations. Hence, there is a significant need to establish a technique that can precisely and effectively identify glucose in clinical samples.
As a result of the considerable endeavors of scientific researchers globally, numerous strategies have been suggested in conjunction with distinct signal amplification processes to detect glucose [Citation6–8]. These strategies include chemiluminescence [Citation9], electrochemistry [Citation10,Citation11], fluorescence assay [Citation12,Citation13] and colorimetric assay [Citation14,Citation15]. Chemiluminescence is a well-established method for detecting glucose, which involves using hydrogen peroxide (H2O2) and a suitable substrate to generate a measurable chemiluminescent signal. Chemiluminescence-based assays have gained popularity for their stability, reproducibility and high selectivity [Citation16]. However, they are also criticized for their poor sensitivity, as they are unable to promptly detect small variations in glucose levels. Fluorescent assays have gained popularity over chemiluminescence assays due to several advantages, including consistent signal production and simplified operation [Citation17]. Liu et al. introduced a glucose sensor that utilizes fluorescence-labeled DNA probes and cerium oxide nanoparticles [Citation18]. These approaches involve the substitution of the adsorbed fluorescence probes on the surface of cerium oxide nanoparticles with the released H2O2, resulting in the restoration of fluorescence. However, the methods above rely heavily on expensive and meticulously synthesized nanoparticles, which are susceptible to variation due to synthesis conditions and consequently add complexity to the experiments. Compared with fluorescence assays, colorimetric methods have attracted abundant attention due to their portability, rapid response, ease of preparation, low cost and naked-eye visibility.
While these methods demonstrated a notable capacity for detecting glucose, their practical implementation is impeded by inherent limitations, including expensive experiments, intricate designs, restricted selectivity resulting from certain enzymes and a single readout mode. Numerous pistol-like DNAzyme-based glucose detection strategies have been devised in research studies demonstrating the potential utility of pistol-like DNAzymes (PLDz) in glucose detection [Citation19]. For instance, Liu and colleagues created a glucose-oxidase-coupled DNAzyme sensor to detect glucose in tears and saliva [Citation20]. GOx facilitates the oxidation of glucose to produce H2O2, which can be detected by PLDz. The cleavage rate of PLDz is proportional to the concentration of glucose. However, the strategy becomes more complicated and unstable when the cleavage rate of PLDz is monitored for result readout. Therefore, there is an imperative need for the development of a reliable and sensitive method with a simple signaling mode. In recent years, there has been a significant interest in dual-mode sensors due to their ability to greatly enhance the resolving power, accuracy and reproducibility of analytical measurements [Citation21]. This is achieved by combining two different sensors and analyzing the data or data patterns using appropriate statistical models instead of a single analysis method.
In this paper, a novel colorimetric and fluorescent dual-mode strategy is constructed for sensitive glucose detection using GOx for glucose oxidation, PLDz for signal transformation and Exo-III assisted cycle for dual-mode signal output. In this process, glucose is converted into H2O2 by GOx, which subsequently facilitates the self-cleavage of PLDz. Ultimately, the PLDz fragments can initiate the Exo-III aided cycle to provide a signal output. Consequently, the presence of fluorescent signals is produced in the surrounding area, and the alteration in color caused by the clustering of gold nanoparticles (AuNPs) may be easily observed without the need for any further tools.
2. Materials & methods
2.1. Chemical reagents & apparatus
The specific information regarding the synthesized PLDz sequence and the probes may be found in the scheme and Supplementary Table S1. The nucleic acids mentioned were produced and purified by Sangon Biotech Co., Ltd (Shanghai, China). The nucleic acids recovered were subjected to centrifugation at a speed of 5000 rpm and then diluted to a concentration of 20 μM using diethylpyrocarbonate (DEPC) water. The GOx enzymes used for glucose oxidation were acquired from Yuanye Biotech Co., Ltd (Shanghai, China). The Exo-III enzyme was purchased from Sigma-Aldrich (Shanghai, China). All the other experimental reagents, including glucose and metal ions, were of analytical grade. The fluorescence spectrum was measured using a Hitachi F-7000 fluorescence spectrophotometer from Beijing, China. Further details on the preparation of PLDz@MBs and HP@AuNPs can be found in the electronic supporting information. Northwest Women's and Children's Hospital Ethics Committee approved this research (Approval Number: 2024-015).
2.2. Glucose detection through the proposed strategy
The glucose detection system contained GOx at a concentration of 0.1 U/l, PLDz@MBs at a concentration of 0.5 μM, and glucose at varying quantities. Initially, a mixture comprising 1 μl of glucose PLDz, 1 μl of glucose and 1 μl of GOx was prepared and then subjected to incubation at a temperature of 30°C for 1 hour. Following the process of magnetic enrichment and separation, the liquid supernatant was extracted and the sediment was separated. Subsequently, 1 μl of Exo-III enzyme and 1 μl of HP@AuNPs were introduced into the mixture. Following a 60-min incubation period, the amplification was analyzed using a Hitachi F-7000 fluorescence spectrometer and a BioSpec-nano UV-vis spectrophotometer to obtain UV-vis and fluorescence spectra. To assess the method's sensitivity, the glucose was diluted to various quantities and subsequently detected using the aforementioned approach. The correlation between the measured fluorescence intensity and the concentration was determined.
3. Results & discussion
3.1. The working principle of the proposed strategy for glucose detection
By employing GOx for glucose oxidation, PLDz for signal transformation and Exo-III for signal amplification, we present an ultra-sensitive glucose detection strategy (). To ensure precise glucose identification, GOx is employed to facilitate the conversion of glucose to gluconic acid and H2O2. This reaction then induces the self-cleavage of the PLDz in conjunction with divalent metal ions to facilitate the signal transformation. The initial configuration of PLDz, as illustrated in , comprises a central catalytic core (represented by the green letters) and substrate-binding appendages (consisting of a double-stranded helix and a triple helix; the triple helix protects the “s1” motif). The Exo-III-assisted signal cycle process is thus in the “OFF” state when the initial state of PLDz is recognized. Part s1, part s2 and part s3 of PLDz are separated via H2O2 catalysis at the major and minor sites of DNA cleavage. After magnetic enrichment, the “s1” segment, which is located on the surface of Magnetic Beads (MBs), is extracted. Following this, s1@MBs form a complex with the toehold of the “4” segment in the hairpin probe (HP), which is situated on the surface of AuNPs (HP@AuNPs). This interaction triggers the Exo-III-based digestion of the “4” segment. Consequently, the released “s1” was capable of quickly and continuously binding to additional HP@AuNPs, while the FAM moiety was liberated from the AuNPs' surface, thereby producing fluorescence signals. It initiated a subsequent series of cyclic target reactions involving hybridization, cleavage and release, which resulted in the liberation of additional fluorophores and an extraordinary recovery of fluorescence. As a result of the “s1” release, a multitude of short DNA-modified AuNPs were generated for colorimetric analysis. The short DNA-modified AuNPs' electrostatic repulsion could be mitigated, allowing for their aggregation in saline solution and concurrent transition from red to blue.
Figure 1. The working mechanism of the proposed method for sensitive and dual-mode glucose detection.
3.2. Investigation of PLDz for H2O2 sensing & activating Exo-III assisted signal cycle
Theoretically, the oxidation of glucose catalyzed by GOx can generate an equivalent quantity of H2O2, which subsequently stimulates the self-cleavage of PLDz with the aid of divalent metal ions. To determine the effect of varying concentrations of H2O2 (from 1 M to 100 mM) on the self-cleavage activity of PLDz, we monitored the cleavage rate of PLDz in the presence of Cu2+ (100 M). The findings presented in A demonstrate that the cleavage rate exhibited a progressive escalation as the concentration of H2O2 increased across a range of 1 μM to 100 mM. These results suggest that the catalytic activity of PLDz is dependent on the concentration of H2O2. Given that effective self-cleavage of PLDz is facilitated by the cooperation between H2O2 and divalent metal ions, we subsequently examined the cleavage efficacy of PLDz in the presence of various metal ions. Consistent with previous findings, the PLDz cleavage rates of the H2O2/Cu2+, H2O2/Mn2+ and H2O2/Co2+ groups were significantly higher than those of H2O2 alone (B). Therefore, H2O2/Cu2+ was chosen for the subsequent experiments. Supplementary Figure S1 shows the appearance of the obtained AuNPs.
Figure 2. Feasibility analysis of the method. (A) Cleavage rate of PLDz with different concentrations of H2O2. (B) Cleavage rate of PLDz with different metal ions. (C) SYBR Green I signals of the HP during the Exo-III assisted signal cycle. (D) Fluorescence intensity of the method when essential experimental components existed or not. (E) Absorbance intensity of the method when essential experimental components existed or not. **p < 0.05.
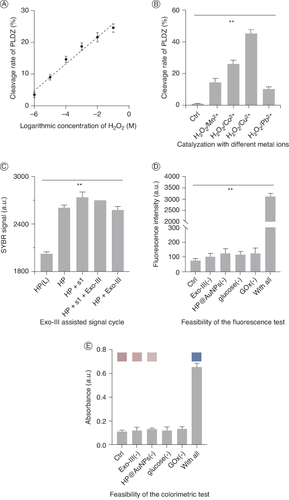
We examined the viability of the Exo-III assisted signal cycle using the generated “s1” sequence. SYBR Green I is a fluorescent dye that has a certain wavelength of light that causes it to emit a green color. This dye can attach itself to double-stranded DNA (dsDNA). SYBR Green I exhibits low fluorescence in its unbound form, but its fluorescence is significantly amplified upon binding to dsDNA. Based on the findings in C, the SYBR Green I signal is minimal when the HP is in a linear state. In contrast, the levels of SYBR Green I were observed to rise when the HP was formed into a hairpin structure. When the “s1” sequence forms a bond with the toehold of the “4” in HP, the signal of SYBR Green I increased. The introduction of Exo-III led to a substantial drop in the SYBR Green I signal, which can be attributed to the cleavage of the stem portion (“4”) of HP.
Based on our initial evaluation, the inherent condition of PLDz is a complex three-dimensional nanostructure with a central catalytic core and arms for binding substrates. The initiation of the Exo-III aided signal cycle by the “s1” is prevented because of the self-protective nature of the triple helix and double-stranded helix in the substrate-binding arms. To demonstrate our evaluation, we conducted a fluorescence experiment by subjecting the PLDz to the Exo-III facilitated signal cycle. When HP@AuNPs and Exo-III were incubated with PLDz in isolation, no significant increases in fluorescence intensity were observed; this suggests that the signal reaction cannot be induced by PLDz in its natural state. Conversely, a substantial increase in fluorescence intensity was observed when glucose oxidation products (H2O2) were catalyzed by PLDz (D). The alterations in color could also serve as evidence of the practicality of the technique (E).
3.3. Optimization of the assay conditions
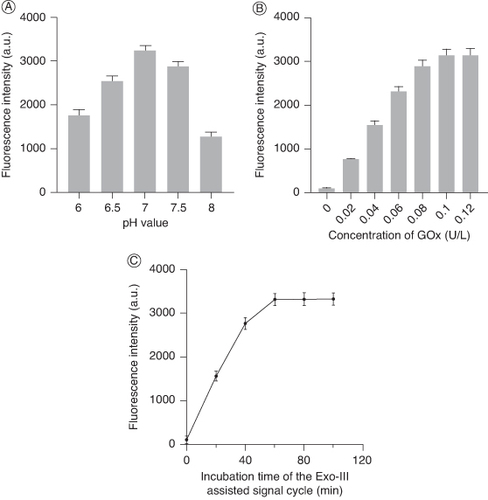
Several experimental parameters were subsequently optimized to enhance the performance of the detection. These parameters comprised the incubation duration, the concentration of GOx and the pH value of the buffer. A progressive elevation in fluorescence was observed as the pH was altered between 6.0 and 7.0 in the experiment aimed at determining the optimal pH for glucose oxidation (A). Following this, an increase in pH beyond 7.0 resulted in a decrease in fluorescence intensity, suggesting that a pH of 7.0 might be optimal for experimental performance. The phenomenon could be explained by that the pH value affects the cleavage rate of the PLDz, which determines the signaling process of the method. Following this, we investigated the concentration of GOx required for glucose oxidation; the acquired fluorescence intensity increased as the concentration rose to a maximum of 0.1 U/L, but stopped increasing thereafter (B). The optimal concentration of GOx was thus calculated to be 0.1 U/L. Based on the findings presented in C, the ideal incubation period for Exo-III was determined to be sixty min.
Figure 3. Optimization of experimental conditions. (A) Fluorescence intensity of the method with different pH values. (B) Fluorescence intensity of the method with different concentrations of GOx (U/L). (C) Fluorescence intensity of the method with different Exo-III incubation times (min).
3.4. Sensitivity analysis
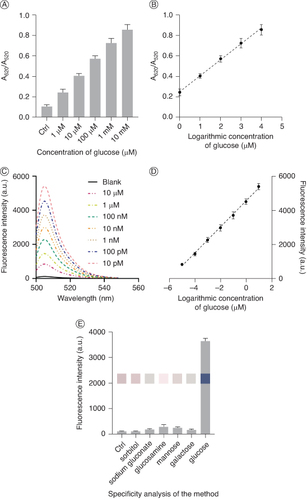
An investigation was conducted into the sensitivity of the dual-mode sensor under ideal conditions. The data presented in A demonstrates that the absorbance change of the HP@AuNPs solution could be directly observed as the concentration of glucose increased. Furthermore, as the glucose concentrations rose from 1 μM to 10 mM, the ratio of absorption intensities (A620/A520) progressively increased, demonstrating an exceptional linear correlation with the glucose concentration (B). With a correlation coefficient (R2) of 0.9885, the calibration equation was A = 0.1547 × lgC + 0.2504 (where A represents the A620/A520 value and C denotes the glucose concentration). Given that the colorimetric signal remained distinguishable from the background signal even at the minimum RNA concentration, 0.3 M was established as the LOD for the colorimetric method. For the fluorescence study, the fluorescence intensity went up dramatically as the glucose concentration went from 10 pM to 10 μM (C). D illustrates the variations in intensity that occur in response to distinct glucose concentrations. The calibration plots demonstrated a strong linear correlation between the intensity of fluorescence and different concentrations of glucose. The equation for calibration was F = 760.9 × lgC + 4558 (where R2 = 0.9943). The limit of detection of the method was determined 7.6 pM according to the 3δ rule. Subsequently, we assessed the method's selectivity by employing it to detect a variety of glucose analogs, including galactose, sorbitol, sodium gluconate, glucosamine and mannose. As shown in E, the method exhibited minimal response to the majority of these targets. Nevertheless, a marginal elevation in fluorescence intensity was observed when the method was combined with sodium gluconate, suggesting that the presence of sodium gluconate might generate an erroneous positive outcome. This is because GOx also detects β-d-glucose analogs. By its high specificity, GOx exhibits a distinct affinity for β-d-glucose and refrains from any action toward α-d-glucose. While the biosensor does exhibit reactions to galactose, glucosamine and mannose, their presence in trace amounts or absence from the samples results in a non-interfering assay.
Figure 4. Analytical performance of the method. (A) A620/A520 value of the method when different concentrations of glucose. (B) Correlation between the A620/A520 value and the concentration of glucose. (C) Fluorescence intensity of the method when detecting different concentrations of glucose. (D) Correlation between the fluorescence intensity and the concentration of glucose. (E) Fluorescence intensity of the method when detecting glucose and different glucose analogs.
3.5. Clinical application of the proposed strategy for glucose detection
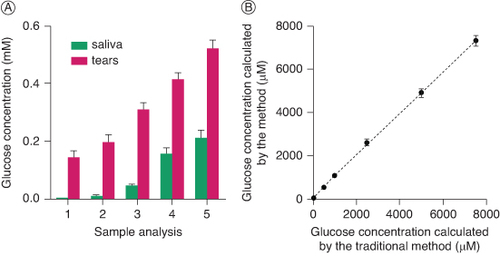
The utilization of non-invasive techniques, such as the detection of glucose levels in saliva or tears, has garnered significant interest in the field of GDM diagnosis and screening. The glucose concentrations in clinical samples vary; for instance, the glucose concentration in blood is 4–8 mM, whereas in saliva and tears, it is 0.008–0.21 mM and 0.1–0.6 mM, respectively. To directly detect glucose in saliva or tears, heightened sensitivity is necessary in comparison to the detection of glucose in blood. As a consequence, the method for detecting glucose in tears and saliva samples was implemented. Initially, saliva and tears induced by culinary vision and onion were collected from the participants. The collected samples were then centrifuged to eliminate potential impurities and heated to denature the proteins they contained. The results obtained from the analysis demonstrated effective glucose detection in both tears and saliva. In addition, it was observed that the fluorescence intensity in tears was marginally greater than that in saliva, suggesting that tears comprise a greater quantity of glucose than saliva. This finding aligns with the proposed theory (A). We then compared the detection performance of the proposed method with the traditional method. In this section, the glucose was diluted to different concentrations by the commercial serum solution. The proposed method and the traditional enzymatic method were applied to detect the glucose. As shown in B, the calculated glucose concentrations from the serum sample were highly consistent with those calculated by the traditional method.
Figure 5. Clinical application potential of the method. (A) Calculated glucose concentration (mM) from saliva and tears samples. (B) Calculated glucose concentrations by the method and by the traditional method.
4. Conclusion
The primary diagnostic indicator for GDM has historically been blood glucose testing. Nevertheless, there is a significant demand for a glucose monitoring method that does not require intrusive procedures, as repeated blood drawing tests impose substantial physical and psychological strain on patients. In this study, we present a very sensitive approach for detecting glucose by combining the self-cleavage of PLDz and the Exo-III-aided signal cycle. It was determined that the following characteristics of the method comprised its features: the self-cleavage of PLDz enables it to convert the H2O2 signal it receives during glucose oxidation into a nucleic acid signal; the dual-mode signal effectively mitigates environmental disturbances and enhances analysis precision, rendering it more suitable for intricate practical applications; and the developed sensor demonstrated elevated selectivity. Ultimately, we have proven the practicality of the suggested approach for glucose detection by both experimental and clinical tests. It has exhibited a detection limit that is comparable to certain previous methods but with the advantage of a streamlined process and consistent signal output (Supplementary Table S2). We are confident that this method, which combines colorimetric and fluorescence techniques and relies on the glucose oxidase-coupled pistol-like DNAzyme, will pave the way for glucose detection and make a valuable contribution to the non-invasive diagnosis of GDM.
5. Future perspective
Accurate and sensitive glucose detection from clinical samples, such as tears and saliva, is still a significant difficulty. In this article, we proposed a sensor for colorimetric and fluorescent dual-mode detection of glucose based on glucose oxidase-coupled pistol-like DNAzyme and exonuclease-assisted signal cycle. This method utilizes glucose oxidase (GOx) to catalyze glucose, a pistol-like DNAzyme (PLDz) to transform the signal, gold nanoparticles (AuNPs) to enhance the optical properties and the exonuclease-III (Exo-III) to amplify the signal. The probes used in this method were intricately constructed to prevent hydrolysis by Exo-III under ideal conditions, resulting in a low background and high sensitivity. Based on the elegant design, the suggested dual-mode strategy provides a very sensitive, precise and specific detection method for glucose. Another advantage is that the dual-mode technique significantly improves the precision and consistency of the measurements, demonstrating its immense potential for use in biomedical research and clinical diagnostics. In the future, we will integrate the whole sensing system into point-of-care testing, which would exhibit wider application sceneries.
Author contributions
X Wang is the supervisor of the team in all research steps including designing, data analysis and manuscript writing. H Lu has the main role for experimental data collection, data gathering, preparation of results and data analysis.
Financial disclosure
The authors have no financial involvement with any organization or entity with a financial interest in or financial conflict with the subject matter or materials discussed in the manuscript. This includes employment, consultancies, honoraria, stock ownership or options, expert testimony, grants or patents received or pending, or royalties.
Writing disclosure
No writing assistance was utilized in the production of this manuscript.
Ethical conduct of research
The authors state that they have obtained appropriate institutional review board approval (#2024-015) and/or have followed the principles outlined in the Declaration of Helsinki for all human or animal experimental investigations.
Supplementary Materials
Download MS Word (174.6 KB)Supplemental material
Supplemental data for this article can be accessed at https://doi.org/10.1080/07366205.2024.2381403
Competing interests disclosure
The authors have no competing interests or relevant affiliations with any organization or entity with the subject matter or materials discussed in the manuscript. This includes employment, consultancies, stock ownership or options and expert testimony.
References
- Chatzakis C, Cavoretto P, Sotiriadis A. Gestational diabetes mellitus pharmacological prevention and treatment. Curr Pharm Des. 2021;27:3833–3840. doi:10.2174/1381612827666210125155428
- Moon JH, Jang HC. Gestational diabetes mellitus: diagnostic approaches and maternal-offspring complications. Diabetes Metab J. 2022;46:3–14. doi:10.4093/dmj.2021.0335
- Szmuilowicz ED, Josefson JL, Metzger BE. Gestational diabetes mellitus. Endocrinol Metab Clin North Am. 2019;48:479–493. doi:10.1016/j.ecl.2019.05.001
- Dalfra MG, Burlina S, Del Vescovo GG, et al. Genetics and epigenetics: new insight on gestational diabetes mellitus. Front Endocrinol (Lausanne). 2020;11:602477. doi:10.3389/fendo.2020.602477
- Sacks DB, Arnold M, Bakris GL, et al. Guidelines and recommendations for laboratory analysis in the diagnosis and management of diabetes mellitus. Diabetes Care. 2023;46:e151–e199. doi:10.2337/dci23-0036
- Galant AL, Kaufman RC, Wilson JD. Glucose: detection and analysis. Food Chem. 2015;188:149–160. doi:10.1016/j.foodchem.2015.04.071
- Naveen Prasad S, Weerathunge P, Karim MN, et al. Non-invasive detection of glucose in human urine using a color-generating copper NanoZyme. Anal Bioanal Chem. 2021;413:1279–1291. doi:10.1007/s00216-020-03090-w
- Wang Q, Jiao C, Wang X, et al. A hydrogel-based biosensor for stable detection of glucose. Biosens Bioelectron. 2023;221:114908. doi:10.1016/j.bios.2022.114908
- Tong W, Shi J, Yu Z, et al. High sensitivity and automatic chemiluminescence detection of glucose and lactate using a spin-disc paper-based device. Lab Chip. 2024;24:810–818. doi:10.1039/D3LC00937H
- Hassan MH, Vyas C, Grieve B, et al. Recent advances in enzymatic and non-enzymatic electrochemical glucose sensing. Sensors (Basel). 2021;21(14):4672. doi:10.3390/s21144672
- Kang X, Wang J, Wu H, et al. Glucose oxidase-graphene-chitosan modified electrode for direct electrochemistry and glucose sensing. Biosens Bioelectron. 2009;25:901–905. doi:10.1016/j.bios.2009.09.004
- Pickup JC, Hussain F, Evans ND, et al. Fluorescence-based glucose sensors. Biosens Bioelectron. 2005;20:2555–2565. doi:10.1016/j.bios.2004.10.002
- Zhang X, Sun B, Zhang Y, et al. Portable smartphone-assisted ratiometric fluorescence sensor for visual detection of glucose. Anal Chim Acta. 2023;1260:341173. doi:10.1016/j.aca.2023.341173
- Kishnani V, Kumari S, Gupta A. A chemometric-assisted colorimetric-based inexpensive paper biosensor for glucose detection. Biosensors (Basel). 2022;12:1008. doi:10.3390/bios12111008
- Lee PC, Li NS, Hsu YP, et al. Direct glucose detection in whole blood by colorimetric assay based on glucose oxidase-conjugated graphene oxide/MnO(2) nanozymes. Analyst. 2019;144:3038–3044. doi:10.1039/C8AN02440E
- Calabria D, Pace A, Lazzarini E, et al. Smartphone-based chemiluminescence glucose biosensor employing a peroxidase-mimicking, guanosine-based self-assembled hydrogel. Biosensors (Basel). 2023;13:650. doi:10.3390/bios13060650
- Wang K, Zhang R, Yue X, et al. Synthesis of diboronic acid-based fluorescent probes for the sensitive detection of glucose in aqueous media and biological matrices. ACS Sens. 2021;6:1543–1551. doi:10.1021/acssensors.0c02217
- Liu B, Sun Z, Huang PJ, et al. Hydrogen peroxide displacing DNA from nanoceria: mechanism and detection of glucose in serum. J Am Chem Soc. 2015;137:1290–1295. doi:10.1021/ja511444e
- Zhang C, Yao H, Ma Q, et al. Ultrasensitive glucose detection from tears and saliva through integrating a glucose oxidase-coupled DNAzyme and CRISPR-Cas12a. Analyst. 2021;146:6576–6581. doi:10.1039/D1AN01385H
- Liu C, Sheng Y, Sun Y, et al. A glucose oxidase-coupled DNAzyme sensor for glucose detection in tears and saliva. Biosens Bioelectron. 2015;70:455–461. doi:10.1016/j.bios.2015.03.070
- Huang J, Shangguan J, Guo Q, et al. Colorimetric and fluorescent dual-mode detection of microRNA based on duplex-specific nuclease assisted gold nanoparticle amplification. Analyst. 2019;144:4917–4924. doi:10.1039/C9AN01013K

