
 ?Mathematical formulae have been encoded as MathML and are displayed in this HTML version using MathJax in order to improve their display. Uncheck the box to turn MathJax off. This feature requires Javascript. Click on a formula to zoom.
ABSTRACT
The AKUFVE techniques were developed by Rydberg and co-workers in the 1960s. The main aim was to be able to perform a series of liquid-liquid extraction data varying one or more parameters and at the same time achieve very pure phases. As such, this technique was later used for short-lived isotope studies in the SISAK system, but also as a standalone unit for a large number of thermodynamic studies of extraction systems both for fundamental understanding as well as more applied investigations. In this paper, the apparatus with modifications made over the decades is described. In addition, studies with stability constant determinations for the zirconium-water-acetylacetone system as well as lanthanide extraction using bromodecanoic acid are exemplified to demonstrate the potential use of the technique. The results shown clearly demonstrate the versatility and ability of the AKUFVE system.
Introduction
Stability constants play a fundamental role in quantitative solution chemistry investigations. Using them correctly, i.e. selecting the right value and correcting it in an appropriate way for chemical activities that describe the effects of solution (e.g. ionic strength and temperature etc.), often provides reasonable predictions for the complexes formed in a given solution. Thus, it is clear that determination of these fundamental constants is pivotal to be making accurate chemical predictions based on solution speciation. Measured stability constants are compiled in databases such as the NEA series[Citation1] and more specific reviews e.g. the one by Brown and Ekberg[Citation2] on the hydrolysis of metal ions. Several methods have been used for determining stability constants and several of these are described and summarised in reference.[Citation2] The cited references also describe methods for making corrections for chemical activities in aqueous solutions. Among the experimental techniques used with great success for determination of stability constants (mainly for metal ligand complexes) is solvent extraction. The process of shaking test tubes, i.e. batch extraction studies, is however, cumbersome, and therefore, the AKUFVEFootnote1 unit was created in the 1960s.[Citation3] The AKUFVE unit, as the Swedish acronym suggests, allows the user to continuously collect samples from a dynamic system where the two phases are in constant equilibrium. As the two phases are continuously separated and returned to the mixing stage, the AKUFVE unit could theoretically be fitted with detectors for direct on-line analysis of each phase. Various parameters affecting the chemistry can be controlled, for example, pH, ligand concentration, metal concentration etc., thereby providing smooth curves of species distribution ratios versus some parameter, which can then be evaluated using a systematized but consistent theoretical framework (see below). During the 1980s, the AKUFVE unit was developed further with a sample withdrawal AMX-pump (Automatic MiXing pump) fitted, for mixing in a scintillation cocktail for on-line liquid scintillation counting in flow cells or adding acidic solutions to the collected sample to minimise sorption that may otherwise affect detection.[Citation4] The development of the equipment continued and, for example, an AKUFVE unit able to handle redox equilibria was developed by Ekberg in the 2000s.[Citation5]
In addition to being used in continuous mode, the AKUFVE centrifuges were also used to study short lived isotopes[Citation6,Citation7] using the SISAK (Short lived Isotope Studies using the AKufve) technique which was developed for studies of super-heavy element chemistry.[Citation8,Citation9]
Theory
The principle of extracting an element or substance from one solution to another is well-established. Buchholz[Citation10] described experiments where the extraction of uranyl nitrate from a water to an ether phase was performed. He was also able to strip the uranium compound from the organic phase back to the water phase. Buchholz concluded that the extraction was dependent on the volume ratio between the organic and aqueous phase and the concentration of the element in the aqueous phase. Rydberg outlined the use of solvent extraction for determination of stability constants in the 1950s.[Citation11,Citation12] When the method was first developed, the expressions derived (see below) were often analysed graphically, but with the advent of computers, more sophisticated methods of fitting were applied such as the ground-breaking work by Rydberg and Sullivan.[Citation13] This paper even introduced a statistically sound method of estimation of uncertainties of the determined stability constants.[Citation13] Unfortunately, due to the relative complexity of computer systems at that time, and also the complexity of the code itself, the uncertainty methodology did not gain wide acceptance. It was not until the middle of the 1990s that stability constants determined by solvent extraction first received a thorough uncertainty analysis.[Citation14–Citation16]
The extraction system consists of two almost immiscible liquid phases and, in many cases, an extraction reagent. There exist several kinds of extraction reagents, e.g. chelating reagents, ion exchange reagents, etc. The extraction model varies for each type of reagent and knowledge of the mechanisms is essential for some investigations, e.g. determination of stability constants. The theories outlined below, however, deal mainly with acidic extraction agents since they are very useful in determining hydrolysis constants. There is similar reasoning for other extraction mechanisms, but there may be more factors and constants to take into account in these other evaluations.
The actual extraction process is usually done by contacting the desired phases in a test tube, e.g. shaking. The test tube is then often centrifuged to ensure good phase separation, thereafter samples are taken from each phase and analysed.
The main principle of extraction theory is that the desired element (usually in ionic form) can be bound to an organic or inorganic ligand giving an uncharged complex. The complex will be distributed between the two phases and the distribution is dependent on the hydrophilic/hydrophobic properties of the complex, i.e. the more hydrophobic the complex, the greater the concentration in the organic phase. In many studies, it is assumed that the organic and aqueous phases are completely immiscible, i.e. no mutual solubility exists. This is not generally true, but for the practical purposes discussed here, it is considered a valid assumption.[Citation4]
shows an example of an extraction system for a tetravalent ion (Th(IV)) extracted by an acidic extractant, acetylacetone (HAa), with competing complexation in the aqueous phase via hydroxide and phosphate complexes. Clearly, this system comprises many thermodynamic constants that need to be determined. Determination of the complexation of the deprotonated extraction agent, A–, can initially be considered, where it is assumed that the distribution of the uncharged extracting agent between the organic and aqueous phase is known, as described by Equation (1) (see also ).
Figure 1. A typical example of the chemical extraction system for a tetravalent metal and a monovalent acidic extraction agent. The reaction stability constant subscripts are in the order (metal, acetylacetonate, hydoxide, phosphate).
where the subscript ‘org’, or ‘o’ denotes a species in the organic phase, while ‘aq’ denotes a species in the aqueous phase. It can also be assumed that the deprotonation constant Ka, as described by Equation (2) (see ) and the dissociation constant of water, Kw, are known.
The distribution of the element of interest between the two immiscible liquids can be expressed in terms of a distribution ratio, D (or D value). Often radiotracers are used for determining the distribution ratio and by using the fact that the concentration of a radioactive element, M, is proportional to the specific radioactivity, Equation (3) is obtained.
where S denotes the specific radioactivity of the radiotracer used (Bq/ml). The distribution ratio, DM, is not a constant since it is dependent on, among other things, the ligand concentration, [L]. In extraction studies, the D value is used to determine the stability constants described by:
where i is the activity coefficient for species i.
For mono-acidic extraction reagents, it can be assumed that:
(i) only mononuclear species exist; and
(ii) only one species is extractable, i.e. the electroneutral complex MAn.
This assumption is generally not transferable to other extraction mechanisms. Then, the partitioning of the uncharged complex between the phases is given by:
It is now possible to derive an expression for the D-value using stability constants.
where β0 is equal to one by definition. The right-hand side of Equation (6) may be simplified by division of the activity of the free metal ion:
In a more general system, for example, where hydrolysis may be important, the hydroxide species are also in the aqueous phase together with other species of interest, as shown below.
To make the evaluation of stability constants a more straightforward process, e.g. to avoid using activity coefficients, some assumptions need to be made.
The activity coefficient for the uncharged complex in the organic phase is constant during the experiment. This condition may be obtained using tracer concentrations of the metal and reasonably high concentrations of the ligand.[Citation17] When this condition is met, the activity coefficient may be combined with λ, which can then be assigned as a system dependent constant.
The activity coefficients for the aqueous species are also assumed to be constant during the experiment, owing to utilisation of a high concentration of a background electrolyte, thus simplifying the evaluation.
It is clear that the stability constants obtained by the above reasoning will be system dependent, since what is actually determined is the quotient shown in Equation (8).
The only way to avoid this is to either calculate the activity coefficients or justify assumptions, as those listed above, that the activity coefficients are all equal to 1. With such assumptions, Equation (7) may be expressed as:
If the system is well represented by an equation such as (9), stability constants for the different species may be determined by fitting the equation to experimental data (see below). The challenge, however, is to determine the free ligand concentration, A–. This can be done using a measured value for the H+ concentration together with the Ka and kd constants described above. It should be noted that stability constants found in this manner are conditional given the assumption used and range of experimental conditions employed.
The AKUFVE
The main features of the AKUFVE system are shown in . Originally, the metallic parts of the AKUFVE system were made of Pd-passivated titanium, since this metal is reasonably inert and resistant against both acids and bases, with the exception of strong hydrochloric or sulfuric acids and hydrofluoric acid stronger than about 10−3 mol/L. Modifications, and alternative designs, of the AKUFVE have included fabricating the centrifuge, such that all parts in contact with the liquids are made of polyether ether ketone (PEEK). This minimises sorption (on chemical species on the walls of the apparatus) and increases chemical resistance (against chemicals such as corrosive acids). Similar centrifuges have previously been constructed and successfully applied in the SISAK system. Temperature and pH probes are also fitted in the flow circuit of the aqueous phase. The pH can be measured by a flow-through electrode on the aqueous phase side (generally the heavy phase). The two immiscible liquids are emulsified by a high-speed rotor and allowed to flow down to the centrifuge for separation (see ). The centrifuge works as a separator as well as a pump. The separated phases are subsequently pumped back to the mixing chamber and samples may be taken from the two flow loops in the AMX pumps (see ).
Figure 2. A modified AKUFVE unit. In the original configuration, there was no reduction cell or temperature sensor at the centrifuge. (from[Citation5]).
![Figure 2. A modified AKUFVE unit. In the original configuration, there was no reduction cell or temperature sensor at the centrifuge. (from[Citation5]).](/cms/asset/6b7095c9-2273-48ed-9250-4ccdeddea446/lsei_a_1639356_f0002_b.gif)
The temperature is controlled by the flow of circulating liquid, which exchanges heat with the experimental solutions in heat exchangers before the solution enters the mixing chamber. The temperature in the mixing chamber is monitored by a sensor as shown in (in this example a PT-100 sensor). In early experiments, only one sensor was used, however, the temperature at the separation point may not be the same as in the mixing chamber due to energy input from the centrifuge. Additionally, at higher temperatures, there may be loss of heat. Therefore, a second Pt-100 sensor can be placed at the outlet of the aqueous phase from the centrifuge (see ). For the water flow rates and centrifuge speeds used in a typical experiment at 25 C, the difference in temperature between the two sensors was less than 0.9 C. Even this relatively small difference is an undesirable feature when measuring reliable thermodynamic data. However, if the temperature is controlled in a way that the desired temperature is the average of the temperature in the mixer and the centrifuge, the uncertainties induced by this small deviation in temperature can be neglected compared to other uncertainties in, for example, evaluation of the extraction curves. Typical volumes of the liquids in this set-up of the AKUFVE system are 100 mL. However, this is not a general limitation since any size of mixing chamber may be used as well as different sizes of the centrifuge.
The ability to maintain reducing conditions within the AKUFVE unit is achieved by equipping the apparatus with a reduction cell and an additional H2 gas inlet. Furthermore, it is possible to ensure that the liquid is completely sealed from contact with air by plugging all ventilation holes and letting gas be removed only through a water filled flask.
The reduction cell consists of a number of compartments and tube sections according to . Each of the cells contain a coil of platinum wire (Aldrich, d = 0.076 mm, length 5 m) which has been coated by platinum black. This is performed by electrolysing the wire as a cathode in 0.1 mol/L platinum chloride and 2.3 mmol/L lead acetate in dilute HCl for a couple of minutes and then electrolysing it, again as the cathode, in 1 mol/L H2SO4. The anode is in both cases a thin plate of platinum.
Figure 3. Cut through sketch of one reduction cell. (from[Citation5]).
![Figure 3. Cut through sketch of one reduction cell. (from[Citation5]).](/cms/asset/cd24a2df-ffcd-4163-897c-316242af7265/lsei_a_1639356_f0003_b.gif)
Case studies of metal-ligand stability constant determination
Zirconium extraction by acetylacetone
The experiments presented here were a part of a larger study[Citation18] on the hydrolysis of zirconium, utilising solvent extraction and potentiometry as well as solubility experiments. However, in this paper, we will only discuss the solvent extraction part. For further details of the experiments, refer to the original paper.[Citation18]
Experimental procedure
Two separate sets of experiments were carried out at different total Zr concentrations, such that both polynuclear formation and mononuclear hydrolysis could be studied. One experiment utilized an AKUFVE made out of titanium and the second experiment used a PEEK centrifuge. To avoid carbonate in the system, all experiments were started at low pH (below pH 1) and were performed under a high purity nitrogen atmosphere achieved by introducing nitrogen into the mixing chamber as well as into the centrifuge ventilation tube. High purity NaOH was added to the AKUFVE by automatic burettes to obtain the desired pH. Acetylacetone decomposition was found to be negligible in the pH range of the experiments conducted in the study.[Citation16] The typical starting composition was for the organic phase about 130 mL of a 0.1 M solution of acetylacetone in toluene and the aqueous phase was 1.0 M in-house purified NaClO4. This meant that the data obtained will strictly be valid for 1 M NaClO4 electrolytes only, even if it is common to assume that they will be valid for most (1,1) electrolytes. For further discussion on this topic, refer to Brown and Ekberg.[Citation2]
In the titanium centrifuge experiments, a relatively high Zr concentration was used (about 0.1 mM). For these experiments, the concentration of zirconium was measured using an ICP-MS technique described previously.[Citation19] For the experiments in the PEEK centrifuge, the zirconium concentration was held at about 10−7 M. In this case, the radioactive tracer 95Zr was used together with a carrier of inactive zirconium. The analysis was made using a HPGE gamma detector. The resolution of this detector made it possible to clearly separate the activity of 95Zr from that of its daughter 95Nb. As such, no waiting period was necessary to allow for the solutions to reach radioactive equilibrium.
Results
A typical extraction curve for the low zirconium concentration experiment is given in ). Such a curve may be divided somewhere on the plateau (e.g. pH 5–9). The stability constants were obtained by fitting the distribution function, Equation (9), to the obtained data. To the left of the division line, zirconium hydrolysis is negligible, and thus, the distribution function is simplified, allowing the stability constants of ZrAa3+, Zr(Aa)22+, Zr(Aa)3+ and Zr(Aa)4 to be determined. After determining the stability constants of the Zr-Aa species, all the data were then used to determine the stability constants of Zr(OH)22+, Zr(OH)3+ and Zr(OH)4. The calculated stability constants, together with their concomitant uncertainties, of these hydrolysis species are given in . ) shows the extraction curve obtained using a higher concentration of zirconium.
Table 1. Stability constants obtained from fitting of the solvent extraction data from[Citation18], with some of the experimental conditions listed below shown in .
Figure 4. (a) Typical extraction curve for the case of low zirconium concentration (about 10−5 M). (b) Typical extraction curve for the case of high zirconium concentration (Two concentrations 10−3 and 4 × 10⁻³ M).
It was evident from experiments performed at differing Zr concentrations (see ), that when low Zr concentrations (e.g. 10−5 M) were used the extraction curves were not dependent on the Zr concentration. This indicates that neither polymeric species nor precipitation reactions occurred in the experimental solutions. However, the opposite was observed at high Zr concentrations i.e. the extraction curves were dependent on the Zr concentration. This is clearly one great advantage of the solvent extraction technique, particularly when using precise equipment like the AKUFVE that evidence for polynuclear formation is clear and unambiguous. No fitting is required to determine that polynuclear species form. However, a rather large series of experiments with various metal concentration may be needed to actually determine and fit the exact composition of the various species formed and their associated stability constants.
The experiments with low zirconium concentration were performed in triplicate at each of three selected temperatures (15, 25 and 35°C) with associated data evaluation. This, in turn, allowed for estimation of enthalpies and entropies of reaction for the studied reactions, i.e. acetylacetone complexation as well as hydrolysis (see ).
Table 2. Enthalpies and entropies of reaction for the zirconium acetylacetone and hydroxide complexation.
It is worth noting here that, as was the case for the thorium experiments described in a previous study[Citation20], the solvent extraction experiments did not allow for accurate determination of the first acetylacetonato complex. Thus, for the zirconium experiments, as was done for the thorium experiments, this constant was obtained using potentiometric titrations to allow for accurate determination of the subsequent stability constants. In the case of hydrolysis, only the later hydrolysis constants could be obtained using solvent extraction. However, their values are independent of the previous ones since their values will not affect the fitted values for the later constants (see ).
Lanthanide extraction by 2-bromodecanoic acid
The experiments presented here were carried out in an attempt to describe an extraction system studied at the Nuclear Chemistry Department of Chalmers University of Technology in the mid to late 1990s and early 2000s.[Citation21,Citation22] The synergic system of 2-bromodecanic acid and terpyridine was used to extract and separate trivalent actinides from lanthanides. The experiments outlined below were undertaken to find individual stability constants of the lanthanides, promethium and europium, with 2-bromodecanic acid. The experiments illustrate an important limitation of the AKUFVE technique where a system is prone to saponification.
Experimental procedure
Two separate experimental sets were undertaken. The first utilized a standard, stainless steel AKUFVE unit where a solution containing 0.5 M 2-bromodecanoic acid in tert-butyl benzene was contacted with a 1 M H/Na(ClO4) solution with containing trace amount of 147Pm. The initial pH of the aqueous phase was 1 and the pH was increased by additions of a mixture of NaOH and NaClO4 into the system. Samples were collected from both phases and the 147Pm was detected using liquid scintillation counting. The pH of the aqueous phase was monitored using a flow-through electrode as described above.
The second experiment was carried out using batch contacts with manual shaking of the two phases. A solution of 1 M 2-bromodecanoic acid in tert-butyl benzene was contacted with an aqueous phase containing 1 M NaClO4 with tracer amounts of 152Eu. A number of extraction experiments were carried out with alternating pH in the aqueous phase. Equal volumes of the two phases were placed in glass vials and contacted for 5 minutes of vigorous shaking followed by centrifugation for 15 minutes at ~2000 g to ensure phase separation. Samples were taken from each phase and measured on a NaI(Tl) detector for gross gamma counting.
Results
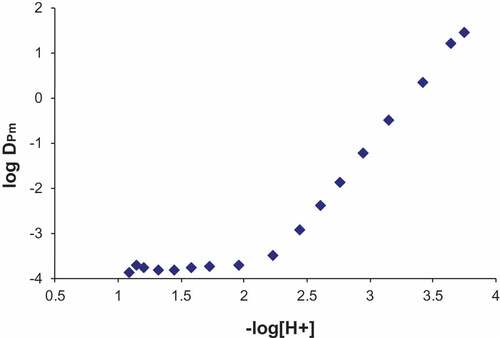
The extraction curve for promethium is shown in . It can be seen that the plateau, as shown in ), was never reached in this experiment. The reason for this was that the bromodecanoic acid started to deprotonate and distribute between the two phases. While this would be acceptable, as is the case for acetylacetonate described in the previous example, the bromodecanoic acid is a larger molecule and is less water soluble and therefore creates a large emulsion in a third phase that lies between the organic and aqueous phases. Essentially, this is a water in oil microemulsion and the volume of this emulsion increases with pH causing the volume of the organic phase to decrease by an equal amount. The volume of the aqueous phase remains relatively constant with some losses into the microemulsion. This saponification creates a problem for the AKUFVE system, in that a third phase may distribute between the heavy and light phases, and phase equilibria cannot be evaluated with this method. Hence, the experiment was aborted as the third phase was observed and only the rising slope of the extraction curve was collected.
Figure 5. Promethium extraction trend using 0.5 M 2-bromodecanoic acid in tert-butyl benzene.
Due to this problem, a second experiment with batch contacts using a europium tracer was carried out instead. Clean samples from each phase could be collected although a third phase was observed and a mass balance showed that the total amount of europium was accounted for.
The results from the batch contact experiment is shown in . It can be seen that the plateau of europium extraction was reached, although the distribution ratios are somewhat smaller compared to what was observed in the AKUFVE system. The downward trend in the distribution ratios, due to hydrolysis, was not achieved as the third phase formation was too extensive at the elevated pH required to observe this effect. Using the pKa, kd and dimerization constant for bromodecanoic acid, determined in a previous study by Nilsson et al.[Citation23], the bromodecanoate concentration in the aqueous phase [bdA−] can be calculated and the distribution ratios can be determined using equation 9. The value for lambda was not fitted, but determined from the distribution ratio at the plateau assuming only the 1:3 Eu:bdA complex was present. The fitted values are shown in . It was noticed that the model was not sensitive to the value of the first stability constant for the 1:1 Eu:bdA complex. The value of this stability constant could be varied between any low value up to a log β value of 2.68 before the sum of chi-square error doubled. Thus, a value of 1.34 ± 1.34 was assigned to this constant. However, on the basis of the other two constants shown in , the magnitude of β1 is unlikely as the stepwise constant K1 is usually greater than K2.
Table 3. Stability constants obtained for Eu-bromodecanoate by fitting the solvent extraction data from .
Figure 6. Distribution ratios of europium using 1 M 2-bromodecanoic acid in tert-butyl benzene as a function of pH. The line is calculated distribution ratios using Equation (9) and the constants in .
From a separate experiment where the distribution ratio of bromodecanoic acid was measured as a function of pH using the AKUFVE system[Citation23], D-values of bromine, DBr, can be superimposed on the distribution ratios of promethium from the AKUFVE. The two trends are shown in . Also shown in this figure is the calculated distribution ratios of Pm using the log β values from , but a λ3-value of 70. The calculated effect follows the experimental values to a reasonable extent and it would be expected that the stability constants for the Pm-bdA complexes are slightly different to those determined for europium. However, the large discrepancy in the lambda value would not be expected and may be due to the extensive third phase formation in the europium experiments or sampling difficulties.
Figure 7. Distribution ratios of promethium and bromodecanoic acid as a function of pH. Also shown is the calculated distribution ratios of Pm using β-values from and a λ3-value of 70.
Conclusion
It has been shown that the AKUFVE apparatus works very well for determining parameters describing a liquid-liquid extraction system. It should be noted that in the more complex determination of the hydrolytic behaviour of the zirconium system more techniques were used such as potentiometric titrations and solubility experiments to give a complete picture of the speciation. Clearly, the liquid-liquid extraction technique for determining stability constants is best at determining the higher complexes due to the fact that they are determined in the stripping part of the extraction curve. In the case of stability constant determination of extraction agents, the early complexes are typically better determined. Thus, a combination of techniques are usually needed but the importance of extraction techniques should not be underestimated.
Notes
1 The AKUFVE is a Swedish acronym for: Apparat för Kontinuerlig Utvärdering För Vätske-vätske Extraktion. This roughly translates to: apparatus for continuous evaluation of liquid-liquid extraction.
Related Research Data
References
- Grenthe, I.; Fuger, J.; Konigs, J. M.; Muller, A. B.; Nguyen-Trung, C.; Warner, H. Chemical Thermodynamics of Uranium; Amsterdan, The Netherlands, 1992; pp 715.
- Brown, P. L.; Ekberg, C. The Hydrolysis of Metal Ions; Weinheim, Germany: Wiley, 2016; pp 952.
- Rydberg, J.; Burger, W.; Nygren, M.; Smidsrød, O.; Lindberg, A. A.; Jansen, G.; Lamm, B.; Samuelsson, B. Solvent Extraction Studies by the AKUFVE Method. Acta Chem. Scand. 1969, 23, 647–659. DOI: 10.3891/acta.chem.scand.23-0647.
- Albinsson, Y. Development of the AKUFVE-LISOL Technique. Solvent Extraction Studies of Lanthanide Acetylacetonates, PhD-thesis, 1988, Dept. Nucl. Chem., CTH, s-412 96, Gothenburg, Sweden
- Ekberg, C.; Persson, H.; Ödegaard-Jensen, A.; Albinsson, Y.; Andersson, S. Redox Control in Solvent Extraction Studies Using a PEEK AKUFVE Unit. Solvent Extr. Ion Exch. 2006, 24, 1–7.
- Aronsson, P. O.; Johansson, B. E.; Skarnemark, R. J.; Alstad, G.; Bergersen, J.; Kvale, B.; Skarestad, E. SISAK–A New Technique for Rapid, Continuous (radio)chemical Separations. J. Inorg. Nucl. Chem. 1974, 36, 2397–2403. DOI: 10.1016/0022-1902(74)80446-X.
- Aronsson, T. N.; Bjørnstad, P. O.; Kaffrell, T.; Kvale, N.; Skarestad, E.; Skarnemark, M.; Stender, G. The Combination of the Gas Jet Recoil Technique with the Fast Chemical On-Line Separation System SISAK. Inorg. Nucl. Chem. Lett. 1975, 11, 729–735. DOI: 10.1016/0020-1650(75)80089-4.
- Omtvedt, J. P.; Bjørnstad, A. J.; Düllmann, T.; Gregorich, C. E.; Hoffman, K. E.; Nitsche, D. C.; Opel, H.; Polakova, K.; Samadani, D.; Schulz, F.; et al. Chemical Properties of the Transactinide Elements Studied in Liquid Phase with SISAK. Eur. Phys. J. D. 2007, 45, 91–97. DOI: 10.1140/epjd/e2007002146.
- Alstad, S. F.; Bjørnstad, J.; Stavsetra, T.; Omtvedt, L. Development of a SISAK Extraction System for Chemical Studies of Element 108, Hassium”. Radiochim. Acta. 2010, 98, 757–764.
- Bucholz, C. F. Verhalten Des Schwefeläthers Zu Einer Gesättigten Auflösung Des Salpetersauren Urans Und Des Wassers Zu Dem Uranhaltigen Schwefeläther. Neues Allgem. J. Der Chemie. 1805, 4, 157–160.
- Rydberg, J. Studies on the Extraction of Metal Complexes. X: Additional Results on the Complex Formation between Thorium and Acetylacetone. Arkiv För Kemi. 1953, 5, 39.
- Rydberg, J.; Sillen, L. G. Combination of Unit Process for Isolating Plutonium. Acta Chem. Scand. 1955, 9, 1241–1251. DOI: 10.3891/acta.chem.scand.09-1241.
- Rydberg, J.; Sullivan, J. C. Least Square Methods Computer Calculations of Stability Constants. Acta Chem. Scand. 1959, 13, 186–188. DOI: 10.3891/acta.chem.scand.13-0186.
- Ekberg, C.; Skarnemark, G.; Emrén, A. T.; Lundén, I. Uncertainty and Sensitivity Analysis of Solubility Calculations at Elevated Temperatures. Mater. Res. Soc. Symp. Proc. 1996, 412, 889. DOI: 10.1557/PROC-412-889.
- Meinrath, G.; Ekberg, C.; Landgren, A., .; Liljenzin, J.-O. Assessment of Uncertainty in Parameter Evaluation and Prediction. Talanta. 2000, 51(2), 231–246.
- Ekberg, C.; Campbell, L. J.; Jackson, C. L.; Ozelius, L.; Slaugenhaupt, S. A.; Stephenson, D. A.; Edwards, J. H.; Wiest, J.; Povey, S. Uncertainties in Actinide Solubility Calculations Using the Th-OH-PO4 System, PhD Thesis Chalmers University of Technology, Chalmers University of Technology: S-412 96, Göteborg, Sweden, 1999.
- Wingefors, S. Kompendium I Extraktionskemi; Department of Nuclear Chemistry, Chalmers University of Technology: S-412 96, Göteborg, Sweden, 1979.
- Ekberg, C.; Källvenius, G.; Albinsson, Y.; Brown, P. L. Studies on the Hydrolytic Behaviour of Zirconium. J. Solution Chem. 2004, 33(1), 47–79.
- Ekberg, C.; Brown, P. L.; Ödegaard-Jensen, A.; Hill, D. M.; Zawadzki, A. W. Detection of Zirconium in Organic and Aqueous Phases Using an Inductively Coupled Plasma – Mass Spectrometer Using the Same Aqueous Standards. Anal. Bioanal. Chem. 2002, 374, 1330–1334.
- Ekberg, C.; Albinsson, Y.; Comarmond, M.; Brown, P. Studies on the Complexation Behaviour of Thorium(IV). 1. Hydrolysis Equilibria. J. Solution Chem. 2000, 29(1), 63–85.
- Hagström, I.; Spjuth, L.; Enarsson, Ȧ.; Liljenzin, J.-O.; Skȧlberg, M.; Hudson, M. J.; Iveson, P. B.; Madic, C.; Cordier, P. Y.; Hill, C.; et al. Synergistc Solvent Extraction of Trivalent Americium and Europium by 2-bromodecanoic Acid and Neutral Nitrogen-Containing Reagents. Solvent Extr. Ion Exch. 1999, 17(2), 221–242.
- Enarsson, Ȧ.; Spjuth, L.; Liljenzin, J.-O.; Källvenius, G.; Hudson, M. J.; Iveson, P. B.; Russell, M. L.; Madic, C.; Cordier, P. Y. Separation of Trivalent Americium and Europium with Some Substituted Oligopyridines and Triazines in Synergy with 2-bromodecanoic Acid. Proc. International Solvent Extraction Conference, ISEC 1999; Barcelona, Spain, 1999.
- Nilsson, M.; Andersson, S.; Ekberg, C.; Liljenzin, J. O.; Skarnemark, G. The Chemical Properties of 2-bromodecanoic Acid. Solvent Extr. Ion Exch. 2006, 24(3), 407–418.