
 ?Mathematical formulae have been encoded as MathML and are displayed in this HTML version using MathJax in order to improve their display. Uncheck the box to turn MathJax off. This feature requires Javascript. Click on a formula to zoom.
ABSTRACT
Annular centrifugal contactors (ACCs) have appealing properties as counter-current multistage solvent extraction (SX) equipment, allowing high throughput at short residence times, small liquid hold-up, and small footprint. The number of commercial suppliers of laboratory-scale ACCs is limited, and their designs have restricted flexibility. Commercial 25 mm diameter ACCs were customized with transparent PMMA surroundings of the mixing zones, allowing visual process monitoring and identification of operational malfunctions. The separation zone of several rotors was lengthened compared to the factory design, which allows longer average residence times in the modified contactors, while keeping the organic flow rate constant in the bank of interconnected contactors. The Couette gap could be increased or decreased without affecting the mixing performance. A 3D-printed stator allows for more efficient draining of the light and heavy phases, and reduces liquid hold-up and volumes required to efficiently achieve steady-state conditions in the process. The hydrodynamic performance of the modified equipment was demonstrated by a SX process of uranium with TBP. First a literature data set of distribution ratios for uranium in HNO3 and 30% TBP diluted in dodecane was utilized to create an empirical model in SX Process simulation software. A flowsheet was designed to validate the model, and it provides an example of the methodology to progress from batch to multistage process. Online density measurements were used to monitor and control the uranium concentrations, and to achieve the desired high metal loading steady-state conditions. It was demonstrated that ruthenium decontamination from uranium could be improved in modified ACCs with longer residence time in the mixing zones of the scrubbing section.
Introduction
Annular centrifugal contactors (ACCs) are appealing equipment for counter-current multistage solvent extraction (SX), because they allow for high throughput at short residence times, have a small liquid hold-up, and a small footprint.[Citation1] Packed and pulsed columns are also efficiently used for SX processes, but their required height (associated with a lack of physical stage separation) necessitates a tall process facility and building infrastructure. Especially for R&D purposes this is not always practical nor cost-efficient. Mixer-settlers have the advantage of a good stage efficiency, scalability, flexibility and throughput, although they can have relatively large liquid hold-up, requiring larger volumes of liquids compared to ACCs, and longer running times to reach equilibrium or steady-state conditions.
Centrifugal contactors were developed at the Savannah River Plant (SRP) as centrifugal mixer-settlers for reprocessing of spent nuclear fuel, mainly to lower the footprint of the SX installation, to decrease the liquid hold-up in the settlers, permitting to operate at elevated concentrations of fissile material (235U,239Pu), and lower the contact time between organic and aqueous phase with the purpose to decrease solvent degradation.[Citation2] The first annular centrifugal contactor was designed at Argonne National Laboratory (ANL), with an annular mixing zone replacing the separate mixing chamber below the rotor, hereby greatly simplifying the contactor design.[Citation2] Further development led to the first miniature lab-scale contactors with a rotor diameter of 2 cm,[Citation3] which were further optimized and led to a more advanced design as described in reference.[Citation4] Applications of ACCs are not restricted to the nuclear field, and they can be utilized for other multistage SX applications.[Citation5] Detailed descriptions of the design and applications of ACCs can be found in the literature.[Citation1,Citation5–7]
In its basic arrangement, a continuous solvent extraction system typically consists of at least three sections: an extraction, scrubbing and back-extraction (or stripping) section (). Each section comprises multiple stages and the organic phase has a constant flow rate throughout all the sections of the SX system.
Figure 1. Schematic representation of the concept of counter-current multistage solvent extraction.
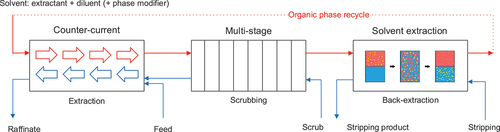
The organic-over-aqueous (O/A) flow ratios in the different sections of the process depend on the process requirements, e.g., envisioned recovery of the product of interest and decontamination factors of the unwanted impurities. As the scrubbing solution is combined with the feed solution at the inlet of the first extraction stage, the O/A flow ratio in the scrubbing section is always higher than the O/A ratio in the extraction section.
When identical multistage process equipment is used with the same mixing zone volumes for different sections of the process, the average residence time in the mixing zones is also different. In the case of fast extraction kinetics of the product of interest, but slow scrubbing kinetics of the co-extracted impurities, the average residence time in the mixing zone of the extraction section should preferably be as short as possible, while the residence time in the scrubbing section should be increased (alternatively, increasing the temperature also favors back-extraction when the extraction reaction is exothermic). While a pilot or production-scale installation can be easily engineered for this difference in required residence time, e.g., larger contactors for the scrubbing section, this type of flexibility is typically not present in laboratory-scale ACCs.
For the research and development of a novel SX process, typically first batch extraction experiments are performed to obtain the key parameters of the system: distribution ratios in function of acidity ([HX] or pH), free extractant concentration, temperature and contact time.[Citation8] Upscaling from small batch scale to a larger laboratory-scale multistage solvent extraction process is the next but significant step in the development of an SX process, before pilot-scale is envisioned.[Citation9–12] As described by Leonard,[Citation13] a few basic design rules can be followed to develop a flowsheet and determine optimal process conditions. The two primary requirements for developing any kind of SX process are: (1) a sufficiently short-phase disengagement time between the two immiscible phases and (2) the extraction of one key component relative to another key component to achieve the required separation in a reasonable number of stages.[Citation13]
The plutonium uranium reduction extraction (PUREX) process is the industry standard for the reprocessing of light-water reactor (LWR) uranium oxide (UOX) spent fuels.[Citation12,Citation14–17] U(VI) and Pu(IV) are efficiently separated from the fission products (FPs) and minor actinides (MAs), and consecutively Pu(IV) is reduced to Pu(III) to selectively strip it from the organic phase and separate plutonium from uranium. A 30 vol.% (1.1 M) solution of the solvating extractant tri-n-butyl phosphate (TBP) diluted in kerosene is used as the solvent, while the HNO3 concentration of the highly active feed (HAF) solution is typically in the range of 3 to 5 M. Reliable batch distribution data sets are readily available from the literature, and they can be used to create an empirical model for a U/TBP/HNO3 solvent extraction process.[Citation18] The PUREX process largely depends on the competition effect and near-complete saturation of the organic phase with U/Pu to obtain a sufficient decontamination from fission products (e.g., 106Ru, 95Zr) and other metallic impurities,[Citation19] making online process control indispensable to deal with small variations in flow rates and concentrations in a continuous process. The complexity of working with an SX system at the limit of saturation necessitates a predictive model.
This work describes the design of a basic empirical model for the U/TBP/HNO3 system based on available literature distribution data. The methodology is similar to what has already been described in literature with regard to the PUREX process,[Citation20–23] but using a different mathematical model to fit the data. A solvent extraction flowsheet was developed aiming at uranium purification with laboratory-scale ACCs, where uranium is quantitatively extracted, and saturation of the organic phase with uranium in the scrubbing section is maximized. Next, the objective was to run this SX process at very short residence times, in the range of seconds, and hereby utilize the advantageous properties of ACCs. The flexibility of the available laboratory-scale ACCs was increased by a few significant modifications, to allow future improvement of the purification process.
Removal of ruthenium from a feed solution of uranium and HNO3 was used to assess performance of the optimized system. It is known that ruthenium shows slow back-extraction kinetics,[Citation14,Citation17] has a complex speciation in HNO3 with varying affinity for TBP complexation,[Citation24–26] and therefore simulations based solely on batch distribution data would highly overestimate the decontamination performance in the scrubbing section.[Citation27] A complete process control methodology was worked out that allows researching these divergences in a multistage approach, meaning that steady-state uranium concentration profiles can be efficiently recreated and hereby also demonstrating the reproducibility. This approach can be followed in future research towards more innovative and complex SX systems.
Materials & Methods
Reagents
Tri-n-butyl phosphate (TBP, CAS: 126-73-8) from Sigma-Aldrich was used (pro synthesis > 99%; 1 L bottles) as extractant. Before usage, TBP was first washed with 1 M NaOH, followed by a second washing with Milli-Q H2O, to remove any degradation products that might have an influence on the extraction process (di-n-butyl phosphate, mono-n-butyl phosphate). Dodecane (CAS: 13475-82-6) from Thermo Scientific™ (mixture of isomers; 5 L drums) was used to dilute TBP without further purification. HNO3 65% from VWR® (AnalaR NORMAPUR®) was used to prepare feed and scrubbing solutions. Merck Milli-Q® IQ 7003 Type 1 high-purity water was used for dilutions and washings. Natural uranyl nitrate from legacy projects at SCK CEN was used, and each time recycled after solvent extraction purification. Ruthenium was acquired as ruthenium(III) nitrosylnitrate Ru(NO)(NO3)x(OH)y, x+y = 3 (CAS: 34513-98-9) from Alfa Aesar (Lot No. Y04F021).
Production of radiotracer 103Ru (t1/2 39.21 d)
1.906 grams of natural ruthenium (6.000 g of ruthenium(III) nitrosylnitrate) was irradiated in the BR1 research reactor at SCK CEN. The abundance of the stable isotope 102Ru in natural ruthenium is 31.6% and has a thermal neutron capture cross section σ of 1.2 barn. At a thermal neutron flux of approx. 3.5 × 10¹¹ neutrons.s−1.cm−2, and an irradiation time of 7 hours, an activity of 7.7 MBq 103Ru was calculated to be available at the end of irradiation. The production of short-lived 105Ru (t1/2 4.44 h) from the stable isotope 104Ru (abundance: 18.6%; σ = 0.49 barn), which decays to 105Rh (t1/2 35.4 h), was allowed to decay over the weekend to reduce the dose rate of the irradiated product, which caused only limited loss of 103Ru.
Analysis
A Thermo Scientific™ iCAP™ RQ ICP-MS was used to quantify uranium and ruthenium in aqueous and organic samples. Aqueous samples were diluted by at least 10,000 times using 2 vol% HNO3 from Fisher Chemical™ TraceMetal™ Grade purity. Organic samples were back-extracted twice with 0.01 M HNO3 for close-to-quantitative recovery, before further dilution and sample preparation for analysis. In the case of Ru and its complex speciation in HNO3 with varying affinity for TBP complexation, this can lead to a small underestimation of the reported organic concentration.
Gamma spectroscopy was performed to quantify 235U and 103Ru using a Canberra BE3830 HPGe detector with a DSA1000 multichannel analyzer and Genie™ 2000 software. 235U has a natural abundance of 0.72%, emitting a 185.7 keV γ photon with 57.2% emission probability. For 103Ru the 497.1 keV γ photon with 91% emission probability was used.
Online density measurements were performed with Anton Paar L-Dens 313 and 3300 models, typically with a flow rate of 0.12–0.15 L h−1, causing a holdup time typically in the range of 1 to 2 minutes, depending on the tube length.
HNO3 concentration in aqueous samples was measured with a Mettler Toledo T7 Titrator using a 0.5 M NaOH standard as titrant. An endpoint method with mathematical correction was used until pH = 2, which avoids interference or precipitation of uranium in the sample.
Solvent extraction setup
The solvent extraction setup consisted of 14 ACCs from Rousselet Centrifugation (BXP025). Each stage was interconnected using a linking piece with Kalrez seals and interstage sampling ports. Leak tightness was obtained by lateral pressing the contactors against each other. Process liquids were added using rotating piston pumps, with Ismatec Reglo Digital controller and pump drive, in combination with Fluid Metering Inc. (FMI) RH1 and RH0 pump heads. Calibration of the pumps was performed using a Bronkhorst mini CORI-FLOW™ mass flow meter and verified with volumetric glassware. First, 3D printed optimized prototypes of stator pieces were produced in laser-sintered polyamide (PA) and stainless steel by Materialise NV in Belgium. Gamma irradiations of PA samples were performed in BRIGITTE (Big Radius Installation under Gamma Irradiation for Tailoring and Testing Experiments) at SCK CEN using 60Co sources.
Design and operational parameters of annular centrifugal contactors
The design principles of ACCs are well described in the literature.[Citation1,Citation7,Citation28] A light phase and heavy phase are contacted in counter-current mode and flow into the annular mixing zone from opposite sides (in nearly all applications the light phase is the organic phase, while the heavy phase is the aqueous phase). One phase is dispersed into the other (aqueous continuous or organic continuous), typically resulting in a large interfacial area which is constantly renewed by the mixing force. Mass transfer occurs at the interface as the mixture is directed towards the bottom of the mixing zone by gravity and the pumping effect of the spinning rotor. The rotation of the dispersion is stopped by the bottom vanes below the rotor inlet, and the mixture in passed through the rotor inlet (orifice). Inside the spinning rotor, vertical vanes are present to ensure the liquid spins at the same rotational speed as the rotor. As the mixture flows over the diverter disk, the phase separation is effectively performed by the centrifugal force in the separating zone, typically exceeding a gravitational force of 100 g. The separated heavy phase is moving through several underflow holes, past the riser towards the upper weir. The light phase separates on the top and is directed towards the lower weir. Once the separated liquids pass their respective weirs, they are flung outside of the spinning rotor and collected into collector rings. These rings are again drained in counter-current mode and directed towards the mixing zone of the next stage.
As described in the literature,[Citation1] the spinning rotor acts as a pump with a defined liquid head, which can be calculated from Equation (S11) by solving for L (m) and filling in rotor inlet radius rRI (m), lower weir radius rLW (m), and rotational speed ω (rad s−1).
For most applications, it is recommended to obtain a liquid head higher than the length of the separation zone inside the rotor (fully pumping rotor). By adjusting the rotational speed, the liquid head can be increased or decreased.
The throughput or maximum flow rate of a contactor q (m3 s−1) can be calculated from Equation (S11) with NDi the dimensionless dispersion number (8.10−4 for solvents with linear or branched hydrocarbons), V (m3) the volume of the separation zone, ∆Z (m) the thickness of the dispersion band, and ravg (m) the average radius in the separation zone[Citation1]:
with
with rU (m) the underflow radius, and rLW* (in m) the inner radius of the dispersion band at the physical radius of the lower weir. This maximum flow rate (q) assumes the separation zone to be filled completely with the dispersion, while still maintaining phase separation. This boundary state requires the interface radius ri to be exactly positioned in between the underflow opening and the lower phase weir. As described in the literature,[Citation1] the radius is determined by the density difference of both phases, and the radii of the upper and lower weir, and can be calculated from EquationEquation (4)(4)
(4) .
With the density of the less-dense phase (ρLD) and more-dense phase (ρMD) being process dependent factors and the lower weir radius (rLW) being fixed by design, the radius of the interface (ri) can be positioned by proper choice of the upper weir radius (rUW). This is already an important consideration when selecting the process equipment to perform a separation experiment, as one size does not fit all applications.
The commercially available B×P025 centrifugal contactor from Rousselet Centrifugation SA (Annonay, France) is based on a miniature contactor design developed at CEA (Commissariat à l’Energie Atomique et aux Energies Alternatives),[Citation29] and is made from 316 L stainless steel. It features a 25 mm diameter rotor (radius of the four underflow holes is 12.5 mm) with phase separation length of approximately 63 mm. The width of the annular mixing zone is 4 mm. The light-phase weir diameter is 14 mm, while the heavy-phase weir diameter is typically 15.5 mm (but can be changed). The rotor is driven by a 40 W brushless DC motor, where the rotational speed can be adjusted for each contactor, limited to around 4000 rotations per minute (RPM). The volume inside the separation zone is approximately 19 mL, and the useful volume in the mixing zone approximately 14 mL. Operated at around 3000 RPM, the liquid head can be calculated from EquationEquation (1)(1)
(1) to be around 20 cm and this value greatly exceeds the length of the separation zone. The nominal flow rate is rated at 10 L h−1 by the manufacturer, while the maximum flow rate q is calculated from EquationEquation (2)
(2)
(2) to be around 23 L h−1 at 3000 RPM when the interface radius is at the most optimal location of 10 mm. This requires a density ratio of 1.277 according to EquationEquation (4)
(4)
(4) , or adaption of the radius of the heavy-phase weir.
Results & discussion
ACC design modifications
PMMA housings
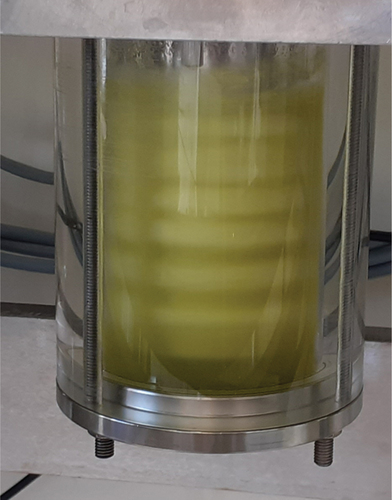
Commercially available 25 mm diameter annular centrifugal contactors model B×P025 from Rousselet Centrifugation were customized with transparent poly(methyl methacrylate) (PMMA) housings (more specifically the surroundings of the mixing zones), allowing visual process monitoring and identification of operational malfunctions, as seen in .
Figure 2. PMMA surrounding of the mixing zone of the Rousselet BXP025 centrifugal contactor (dimensions in mm).
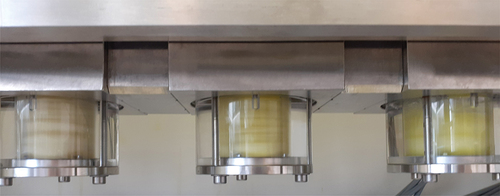
Typical process malfunctions in experimental situations are : (1) overflowing of the mixing zone into the light-phase collector ring; (2) nearly empty mixing zones and (3) interrupted rotor. Overflowing of the mixing zone can be caused by an abrupt change in the O/A flow ratio leading to a high apparent viscosity. This way both phases are collected in the (lower) light-phase collector ring, and the aqueous flow is completely interrupted. Clogging of the rotor due to crud formation, and this crud blocking the four underflow holes for the heavy phase, will have a similar effect that both aqueous and organic phase leave the rotor through the lower phase weir into the light-phase collector ring. These error modes should be detected early on in the process. Another advantage of PMMA housings is that color changes of the dispersion become visible throughout the stages, and visual process follow-up is even possible up to a certain degree. This is demonstrated in , where the extraction of uranium from a feed solution containing ruthenium can be visually detected. While both metals are present in the 1st extraction stage, the 2nd extraction stage has a significantly lower uranium concentration, while the 1st scrubbing stage has hardly any ruthenium left in the mixing zone.
Figure 3. Multistage setup with Rousselet BXP025 centrifugal contactors modified with PMMA lower rotor housing; in operation with simulated PUREX feed solution (left to right: 2nd extraction stage, 1st extraction stage, 1st scrubbing stage).
The radiation resistance of PMMA is rather low, mainly causing embrittlement and loss of mechanical strength, making this material not suited for prolonged use in a hot cell environment. Degradation of the PMMA could contaminate the process solutions during operation and cause a variety of problems (e.g., crud formation). Nonetheless, it is still well suited for laboratory experiments in a fume hood or glove box. It is a good practice to empty and clean the contactors after each solvent extraction experiment, to limit the prolonged exposure to the solvent and the acid, and one must avoid the use of acetone. The advantage of the B×P025 design is that the different parts are easily accessible and replaceable.
Length of the separation zone
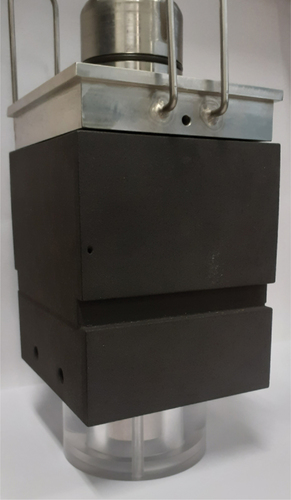
The length of the separation zone of several rotors was increased with 50 mm compared to the factory design to allow for longer average residence times in the modified contactors by increasing the volume of the mixing zone, while keeping the organic flow rate constant in the bank of interconnected contactors. This was a relatively straightforward modification, as this piece of the contactor is connected with a screw-thread to the lower weir part which connects to the rotor axle and upper weir part. Therefore, only the lower rotor part and the PPMA surrounding needed to be changed for this modification, illustrated in .
Figure 4. (Left) Design of elongated rotor (1) with vertical vanes insert (2); (right) elongated PMMA rotor housing.
At a typical rotational speed of 3000 RPM, the height in the mixing zone is only between 2.0 and 3.5 cm at a combined (O+A) flow rate of several L h−1 regardless of the length of the rotor (see also at a flow rate of about 6.5 L h−1), which is well below the liquid head of the rotor. By lowering the rotational speed to 1700–1800 RPM, the mixing zone fills up to a larger capacity, and average residence time is increased, as can be seen in . The rotor now acts as a partially pumping rotor, where the gravitational force in the mixing zone is needed to pass the liquid inside the separation zone of rotor above the height of the heavy-phase weir.
Figure 5. Rousselet BXP025 centrifugal contactor modified with a 50 mm elongated rotor in operation with simulated PUREX feed solution (middle scrubbing stage).
In , the contactor with increased rotor length is operated in the scrubbing section of a uranium extraction process, where a density ratio of approximately 1.16 is present. According to EquationEquation (4)(4)
(4) , the percentage of the aqueous phase inside the phase separation zone is lower than 30%, meaning an interface radius of approximately 23 mm, close to the underflow holes for the heavy phase. When the flow rates are too high, and the rotational speed becomes too low, this can cause the maximum flow rate q to be exceeded, and unwanted-phase entrainment to occur. It is therefore important to mention that increasing length of the rotor and reducing the RPM of the rotor to fill up the mixing zone can also cause process malfunctions.
Width of the mixing zone
The width of the mixing zone (Couette gap) can also be increased or decreased without significantly affecting the hydrodynamic performance, just by replacing the PMMA surrounding of the mixing zone. It is an effective and relatively economical way to increase or decrease the liquid hold-up in the mixing zone. When decreasing the annular gap to 9% of the rotor diameter, i.e., 2.25 mm (optimal value according to Leonard[Citation1]), liquid hold-up in the mixing zone is significantly reduced, but also the height inside the mixing zone can be increased because the dispersion has to pass a smaller annular gap size. Decreasing the annular gap size was stated by Leonard[Citation1] to improve the performance of the contactor at different O/A flow ratios (10–0.1), and its ability to deal with phase inversions due to changing process conditions, however this has never been an issue with BXP025. When working with the smaller CEA-based B×P012 model, these phase inversions can be a concern.[Citation29] Achieving steady state in a multistage B×P012 setup is a greater challenge, as these unwanted-phase inversions can be triggered by the slug flow regime at lower flow rates, typically in the contactors where the O/A ratio is the highest.
3D-printing optimization
Additive manufacturing technologies can be used to create complex mechanical components with a high level of design freedom. A 3D-printed stator allows more efficient draining of the light and heavy phases, as collector rings can be angled towards the exits. This way it reduces slug flow patterns, liquid hold-up and the volumes required to achieve steady-state conditions in the SX process. Also, the inter-stage length can be decreased this way, and the manufacturing process of this complex piece can be simplified. Moreover, the voids present in the stator can be used for heating or cooling applications. The optimized design of the BXP025 stator is illustrated in .
Figure 6. Optimized design of the stator.
The first prototype in laser-sintered polyamide (PA) is depicted in . PA is relatively inexpensive and compatible with many chemicals, but it was experimentally demonstrated to be less resistant against prolonged contact times with elevated nitric acid concentrations, as confirmed by the literature.[Citation30] Porosity can be an issue in 3D printing of plastics, and in some cases can be solved by surface treatments.[Citation31] Resistance to gamma irradiation was assessed on 3D-printed PA samples with and without glass fiber-reinforcement up to 100 kGy. No signs of degradation could be observed, indicating that it can at least be used for experimental work in nuclear glove box applications.
Figure 7. 3D-printed PA upper rotor housing with PPMA lower rotor housing.
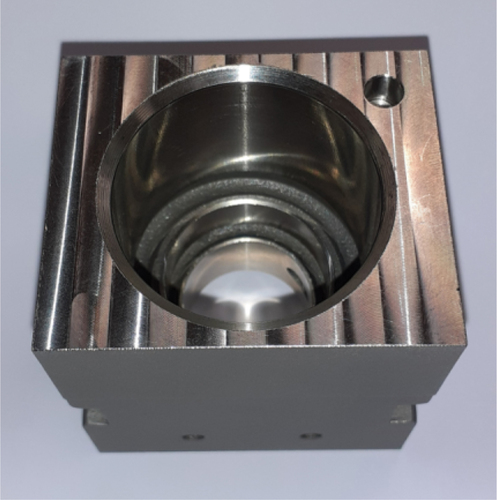
For more demanding applications, also 316 L stainless steel, titanium or high nickel alloys can be 3D printed. Especially in the nuclear field, and challenging process conditions, the use of corrosion and radiation-resistant metals is preferable. A stainless steel stator is depicted in .
Figure 8. 3D-printed stainless steel stator.
Solvent extraction modelling
Uranium extraction with tri-n-butyl phosphate (TBP)
One of the most researched solvent extraction processes is the PUREX process, where in the first cycle uranium and plutonium are co-extracted from a nitric acid feed solution.[Citation11,Citation14,Citation17,Citation19,Citation32,Citation33] A large quantity of reliable literature distribution data is available.[Citation18,Citation19]
Two TBP molecules are involved in the extraction of one uranyl nitrate species from the nitric acid feed solution.[Citation33] One of the key aspects of the PUREX process is to obtain a high saturation of the organic phase with uranium and plutonium and to obtain by this competition effect the decontamination from fission products.[Citation19] This high level of saturation and associated risk of addition of more uranium (from the aqueous feed solution) than the organic phase can carry away makes process control essential. Especially in short-residence-time annular centrifugal contactors with a small liquid hold-up, this is important to rapidly detect, because once a fully saturated organic phase is obtained, the surplus uranium will quickly accumulate in the extraction section and eventually end up in the raffinate if it is not detected.
SX Process simulation
Simulation software is an invaluable tool when researching solvent extraction processes. Many different models have been used to simulate PUREX-type flowsheets. The PAREX code was developed by CEA and AREVA to model and simulate the PUREX process and used for safety demonstration analysis and operational assistance (e.g., process malfunctions).[Citation14,Citation34] Other noteworthy models are AMUSE developed at Argonne National Laboratory,[Citation35,Citation36] MIXSET-X in Japan,[Citation32,Citation37,Citation38] and SEPHIS at Oak Ridge National Laboratory.[Citation39,Citation40] To support the R&D on actinide partitioning in Europe, the SX Process software was developed at ITU by Magnusson and Malmbeck.[Citation41] While originally just having a D ratio and kinetic model, an interface was added and the calculations were simplified in the most recent version.[Citation42] A function description of the distribution ratio for each element is used as input for the model. When using experimental data (e.g., from batch extraction data), an empirical model can be created.
Function descriptions are required to describe the distribution isotherms, where the distribution ratio is highest at low metal concentrations, and ultimately reaching a point where the solvent is completely saturated and the concentration in the organic phase cannot increase further. A useful model to describe this kind of saturation effect is the Langmuir 2nd order non-linear function which can also describe adsorption isotherms in extraction chromatography or ion-exchange.[Citation43]
The distribution ratio of uranium is given by Equation (S11)
The Langmuir 2nd order nonlinear function is adapted for this SX system and can be found in Equation (S11) where two parameters are present: [U]org,sat and k.
Experimental flow sheet design
Designing of a flow sheet is typically an iterative process, where many interrelated factors come into play. In case experimental validation is intended, one could start from determining how many contactor stages are available in the experimental setup, and if these are estimated to be sufficient to perform the complete SX process. The extraction and scrubbing processes have to be operated simultaneously, as the aqueous phase exiting the scrubbing section is typically combined with the feed solution in the extraction section. In laboratory experiments, the loaded organic phase exiting the scrubbing section can be collected separately in case the total number of contactor stages is limited, and can be back-extracted afterward (after thoroughly cleaning the contactor setup). In this case, it is important to separately collect a large enough fraction of the organic phase after steady state is achieved.
Next, it is needed to define the desired end point specifications of the process liquids. In the PUREX process, high recovery of uranium (and plutonium) is required (>99.9%),[Citation14] therefore a suitable HNO3 concentration for the feed solution needs to be chosen, and an O/A ratio in the extraction and scrubbing section that is capable of extraction of all U from the feed solution in steady-state conditions of the process. A number of extraction stages need to be defined on which the uranium concentration in the aqueous raffinate is, e.g., <1 mg L−1. It has to be evaluated if additional extraction stages are needed as a precaution to meet the end point specifications for recovery in case of process malfunctions. Also, the influence of the HNO3 concentration on the (unwanted) extraction of fission products needs to be well understood. Moreover, the influence of the concentration of uranium in the organic phase on the extraction of fission products is essential, as this saturation effect lowers the distribution ratio for the most troublesome elements.
The number of scrubbing stages is then chosen. The higher the number of scrubbing stages, the better the decontamination of fission products, but the lower the concentration of uranium in the organic phase leaving the scrubbing section. Similarly, the higher the flow rate of the aqueous scrubbing solution, the lower the concentration of uranium in the organic phase leaving the scrubbing section, but also the higher the volume of the aqueous raffinate. In case the HNO3 concentration of the feed solution and scrubbing is different, it is also important to assess the final HNO3 concentration in the extraction section.
This complex combination of parameters illustrates why it is an iterative process, as typically it is desirable to achieve a maximum decontamination of fission products, a minimum amount of aqueous raffinate waste solution, a minimum number of stages, and a maximum throughput and saturation of the organic phase in the scrubbing section. Therefore, a model allowing calculation of the parameters of the process is a great tool, while a number of experiments are typically still needed to fine-tune a flow sheet concept. In the Supporting Information of this article, the construction of an empirical mathematical model is elaborated, of which the simulations are further used to compare with experimental data.
Flowsheet simulation
After obtaining the mathematical functions for DU and DHNO3, as described in detail in the Supporting Information, a flowsheet can be simulated and optimized based on an iterative process, where the model can be compared to experiments with the ACCs. As a practical flow rate limit for the B×P025 contactors, lower than 10 L h−1 is recommended. The combined flow rate of the aqueous and organic phases is the highest in the back-extraction section, therefore the O/A ratio in this section sets a limit on the organic-phase flow rate throughout the entire SX process. 4 L h−1 is chosen for the organic-phase flow rate. The maximum achievable concentration of uranium in the organic phase exiting the scrubbing section is approximately 90 g L−1. Therefore, a throughput of 360 g uranium h−1 is achievable, and hence the flow rate of the feed solution can be adjusted to this value when the uranium concentration is known.
Fourteen stages are available for the combined extraction and scrubbing sections, and the first goal is to obtain a raffinate with < 10−5 M uranium. Five extraction stages should be sufficient for this purpose according to simulations and earlier experiments, leaving nine stages available for scrubbing. For the flow rate of the scrubbing, a compromise was made between increasing the volume of raffinate, and maximizing the decontamination of FPs; hence, a value of 0.9 L h−1 was chosen. The resulting flowsheet in would extract uranium very closely to the maximum throughput of the system.
Figure 9. Flowsheet design of the uranium extraction process. Flow rates are comparable with values used in the experiments.
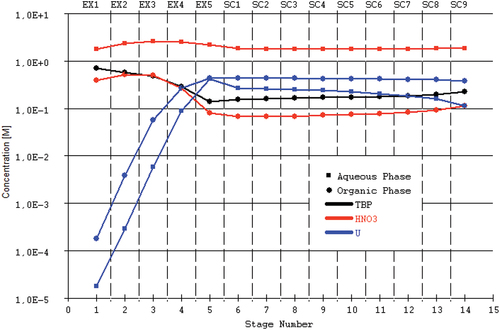
This flowsheet was introduced in the SX Process simulation software, with the functions obtained from the mathematical modelling (see supplementary information), and the B×P025 equipment properties. The SX Process simulation as described above in detail was performed for 10,000-second process time. The raffinate (aqueous exit EX1) has a uranium concentration close to 10−5 M, indicating a near quantitative recovery. At the same time, a large saturation of the organic phase with uranium is obtained, with an concentration of the exit stream from SC9 of 0.378 M−1 (90.0 g uranium L−1), indicating that the simulation reached a steady-state condition. The output of the model is shown in .
Figure 10. SX Process simulation software. Visual output of the uranium extraction model.
Short-residence time and process follow-up
In lab-scale experiments with centrifugal contactors, it is challenging (if not impossible) to obtain these results solely based on the flow rates of the process liquids and the uranium concentration of the feed, due to the accumulation of various uncertainties, and online measurements are indispensable to bring the system into the appropriate equilibrium conditions. Sources of uncertainty are, e.g., the extractant concentration, HNO3 concentration, temperature, and the uranium concentration in the feed solution. But also, the uncertainties associated with the model itself cannot be neglected, which are volume- and concentration-based, not taking into account the small changes in density/volume when extracting/back-extracting the metals. Online density measurements have been found to be particularly interesting in a PUREX type process[Citation14]; more information and experimental validation on this subject are provided in the supplementary information.
When working with short residence time annular centrifugal contactors, the flow rates should be high enough to avoid near-empty mixing zones, as the pumping rotor can easily remove all liquid from the mixing zone, and therefore strongly reduce the efficiency of the process. For this reason, the 3D-printed housings are recommended when average residence times inside the mixing zones exceed tens of seconds. In this case, slug flow pattern, where instead of a continuous flow a larger slug of liquid is passed from stage to stage at larger intervals, can also be avoided as they will further reduce the efficiency of the process due to strong variations in residence time and O/A ratio, and also limit the availability of sufficient sample volume for online measurements.
Comparison between model and experiments
The flowsheet depicted in was run with the B×P025 setup in a 1st experiment, using online density measurements as process control to fine-tune the flow rate of the feed solution. Inter-stage samples were taken after steady state was reached. The obtained experimental results and the calculated results from the model are compared in : Comparison between SX Process simulation and experimental extraction data (Experiment No.1).
Figure 11. Comparison between SX Process simulation and experimental extraction data (Experiment No.1).
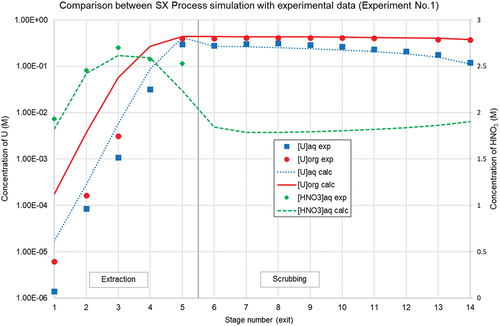
Although there is a small underestimation of uranium extraction performance in the extraction section and a small underestimation of the aqueous uranium concentrations in the scrubbing section, the mathematical model is performing satisfactorily. The target value of < 10−5 M uranium in the raffinate was achieved. The divergence between experiment and simulation is mainly caused by underestimation of the performance of the 1st extraction stage, where the uranium concentration in the aqueous phase exiting the contactor was lower than the model predicted. The deviation is also partially caused by the Langmuir 2nd order non-linear model underestimating DU in the low concentration region, while slightly overestimating DU in the highest concentration region. In multistage solvent extraction at close-to-maximum organic loading conditions, a small difference of D (and the flow rates) becomes noticeably more pronounced.
The HNO3 pinching effect (build-up) on the uranium edge is also in line with the simulation. The reproducibility of this experiment is further demonstrated in the supplementary information. The high level of process control and repeatability of multistage experiments enable to study the more complex behavior of fission products in the scrubbing section in a multistage process.
Ruthenium decontamination in PUREX type flow sheet
Ruthenium decontamination was additionally investigated during the experiment in the previous section (Experiment No.1). In the mixing zone of the 1st extraction stage (stage No.5), the feed is combined with the aqueous phase exiting the scrubbing section (Stage No.6) and the organic phase from the 2nd extraction stage (Stage No.4). In this stage No.5, the saturation level of uranium in the organic phase has reached its operational maximum, and the lowest distribution ratio for ruthenium is typically found due to the presence of the large quantity of ruthenium present in the feed solution. The multistage profile is depicted in .
Figure 12. Ruthenium decontamination in Experiment No.1.
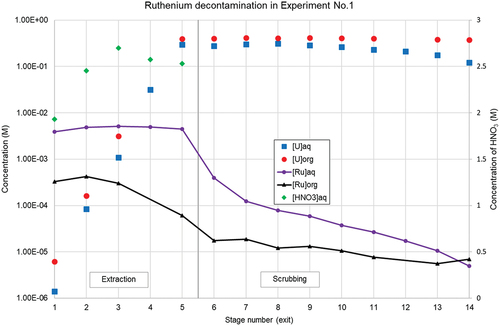
In this experiment, DRu of stage No.5 is found to be 1.36 × 10⁻². In stage No.2 (the 4th extraction stage), with a comparable HNO3 concentration in the aqueous phase, DRu is already six times higher due to the absence of the competition (saturation) effect of uranium. However, based on the experimental result of the 1st extraction stage, a value that would also be typically obtained in a batch-type experiment, the decontamination of ruthenium in the scrubbing section would be largely overestimated. This was also illustrated in the work of Moeyaert et al.,[Citation27] and highlights the importance of multistage experiments on laboratory scale to observe effects that are not always visible in batch experiments (e.g., due to speciation and difference in extraction behavior or back-extraction kinetics).[Citation10] As [Ru]org concentrations in this experiment were determined by ICP-MS using a back-extraction method in 0.01 M HNO3 (as described in the Materials & Methods section), it could have led to a small underestimation of the Ru concentrations in the organic phase.
As can be seen from , the further decontamination of ruthenium from the organic phase in the scrubbing section is only limited. With an average residence time of approx. 10 seconds in the mixing zone of the scrubbing section, it is observed that the stage efficiency is drastically lowered, moreover DRu increases along the scrubbing stages. One of the possible ways to obtain a better decontamination of ruthenium, would be to increase the residence time (only) in the scrubbing stages, by using the adapted elongated rotors in partially pumping operation mode as described earlier.
A new experiment (Experiment No.2) was performed, where stage No. 8–9–10–11–12 was adapted to the new elongated rotor design. A similar feed solution was prepared, however with 103Ru added as a radiotracer to increase the accuracy of the concentration determination. Inter-stage samples were collected when steady-state was reached, and measured with gamma spectroscopy (Experiment No.2 Part A). After completion of the sampling, the experiment was continued with 50% reduced flow rates (Experiment No.2 Part B), and the organic phase exiting the scrubbing section was again sampled after approx. 20 minutes. The use of a radiotracer allowed for a direct measurement of the organic phase by gamma spectroscopy, without the need for back-extraction or dilution. The results are shown in and compared to the results of Experiment No.1.
Figure 13. Ruthenium decontamination comparison between Experiment No.1 and No.2.
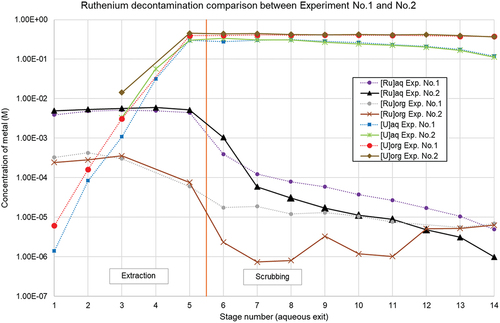
It can be seen that the uranium profiles between both experiments are comparable, again demonstrating reproducibility, with a slightly higher build-up of uranium in the extraction section of the 2nd experiment, and a marginally higher aqueous ruthenium concentration in the extraction section. The aqueous exit of the scrubbing section (stage No.6) reveals an unexpectedly high ruthenium concentration, which can be explained by (unwanted) carry-over of approximately 7.5% of the aqueous phase with organic phase of the 1st extraction stage. This carry-over is no longer present in the 1st scrubbing stage, as can be seen from the aqueous exit concentration from the 2nd scrubbing stage (stage No.7). In Experiment No.1, this phase carry-over was calculated to be lower than 1%.
The fluctuations in the measurement results for [Ru]org in the scrubbing section are still under investigation, but were possibly caused by the presence of dead volumes in the stainless steel tubes of the inter-stage sampling points at high organic flow rates during operation, in combination with low activity samples (<0.5 Bq 103Ru mL−1) requiring a long measurement time. To exclude inaccuracies related to the inter-stage sampling, the Ru concentrations in the organic phase exiting the scrubbing section (Stage No.14) are typically used as the reference sample for the Ru decontamination performance of an experiment. The ratio between the ruthenium concentration in the aqueous phase exiting the first extraction stage and the organic phase exiting the scrubbing section is calculated, and shown in : Comparison of ruthenium decontamination between experiments:
Table 1. Comparison of ruthenium decontamination between experiments.
When comparing the two experiments, and the effect of five longer residence time rotors, one can determine that the decontamination of ruthenium is improved by 28%. Additionally, when further reducing the flow rates of the entire experiment with 50%, the ruthenium concentration in the organic phase is again lowered with a factor of 2. When comparing the aqueous inter-stage data of the two experiments, it is also possible to assess the influence of longer residence time, see .
Table 2. Ruthenium decontamination performance throughout the scrubbing section.
The aqueous ruthenium concentration exiting the last scrubbing section of longer rotors is 34% lower compared to the standard rotors. It also indicates that the aqueous phase can still be a good indicator for ruthenium removal from the organic phase of the scrubbing section.
Conclusion
Commercially available annular centrifugal contactors (ACCs) can be modified for more flexibility and improved performance, making them excellent equipment for laboratory-scale multistage counter-current solvent extraction research and development. A predictive model of uranium extraction from HNO3 in 30 vol% TBP in dodecane was created from batch distribution data, while multistage experiments confirmed the performance of the ACCs and the model. Reproducibility of multistage experiments was demonstrated in high organic-phase loading conditions, by using online density measurements as a mean for process control. Ruthenium decontamination from uranium was improved in modified ACCs with longer residence time in the mixing zones of the scrubbing section.
Supplemental Material
Download Zip (664 KB)Acknowledgments
The authors would like to thank Dr. Daniel Magnusson for providing a copy of the SX Process software, Jolan De Peuter for assistance in performing the SX experiments, Ir. Bart Van Houdt for producing 103Ru at the BR1 research reactor, and Jef Leysen for design and engineering work on the ACC.
Disclosure statement
No potential conflict of interest was reported by the author(s).
Supplementary material
Supplemental data for this article can be accessed online at https://doi.org/10.1080/07366299.2023.2239882
References
- Leonard, R. A. Design Principles and Applications of Centrifugal Contactors for Solvent Extraction. In Ion Exchange and Solvent Extraction - a Series of Advances; Moyer, B. A., Ed.; CRC Press, 2010; Vol. 19, pp. 563–616. DOI: 10.1201/9781420059700-c10.
- Bernstein, G. J.; Grosvenor, D. E.; Lenc, J. F.; Levitz, N. M. A High-Capacity Annular Centrifugal Contactor. Nucl. Technol. 1973, 20(3), 200–202. DOI: 10.13182/NT73-A31358.
- Leonard, R. A.; Bernstein, G. J.; Ziegler, A. A.; Pelto, R. H. Annular Centrifugal Contactors for Solvent Extraction. Sep. Sci. Technol. 1980, 15(4), 925–943. DOI: 10.1080/01496398008076278.
- Leonard, R. A. Recent Advances in Centrifugal Contactor Design. Sep. Sci. Technol. 1988, 23(12–13), 1473–1487. DOI: 10.1080/01496398808075643.
- Meikrantz, D. H.; Meikrantz, S. B.; Macaluso, L. L. Annular Centrifugal Contactors for Multiple Stage Extraction Processes. Chem. Eng. Commun. 2001, 188(1), 115–127. DOI: 10.1080/00986440108912900.
- Duan, W.; Zhao, M.; Wang, C.; Cao, S. Recent Advances in the Development and Application of Annular Centrifugal Contactors in the Nuclear Industry. Solvent Extr. Ion Exch. 2014, 32(1), 1–26. DOI: 10.1080/07366299.2013.833741.
- Baker, A.; Fells, A.; Carrott, M. J.; Maher, C. J.; Hanson, B. C. Process Intensification of Element Extraction Using Centrifugal Contactors in the Nuclear Fuel Cycle. Chem. Soc. Rev. 2022, 51(10), 3964–3999. DOI: 10.1039/d2cs00192f.
- Modolo, G.; Asp, H.; Schreinemachers, C.; Vijgen, H. Development of a TODGA Based Process for Partitioning of Actinides from a PUREX Raffinate Part I: Batch Extraction Optimization Studies and Stability Tests. Solvent Extr. Ion Exch. 2007, 25(6), 703–721. DOI: 10.1080/07366290701634578.
- Magnusson, D.; Christiansen, B.; Glatz, J. P.; Malmbeck, R.; Modolo, G.; Serrano‐Purroy, D.; Sorel, C. Demonstration of a TODGA Based Extraction Process for the Partitioning of Minor Actinides from a PUREX Raffinate. Solvent Extr. Ion Exch. 2009, 27(1), 26–35. DOI: 10.1080/07366290802544726.
- Modolo, G.; Asp, H.; Vijgen, H.; Malmbeck, R.; Magnusson, D.; Sorel, C. Demonstration of a TODGA‐Based Continuous Counter‐Current Extraction Process for the Partitioning of Actinides from a Simulated PUREX Raffinate, Part II: Centrifugal Contactor Runs. Solvent Extr. Ion Exch. 2008, 26(1), 62–76. DOI: 10.1080/07366290701784175.
- Baron, P.; Boullis, B.; Germain, M.; Gue, J. P.; Miquel, P.; Poncelet, F. J.; Dormant, J. M.; Dutertre, F. Extraction Cycles Design for La Hague Plants; CEA-CONF–11650: France, 1993. http://inis.iaea.org/search/search.aspx?orig_q=RN:25027578.
- Rydberg, J.; Cox, M.; Musikas, C.; Choppin, G. R. Solvent Extraction Principles and Practice, 2nd; New York: Marcel Dekker, Inc., 2004. DOI: 10.1201/9780203021460.ch1.
- Leonard, R. A. Design Rules for Solvent Extraction. Solvent Extr. Ion Exch. 1999, 17(3), 597–612. DOI: 10.1080/07366299908934629.
- Baron, P. The Nuclear Fuel Cycle: 2 - the PUREX Process. In Fuel Cycle Back-End and Reprocessing; Marcoule: INSTN, 2013.
- Abonneau, E.; Baron, P.; Berthon, C.; Berthon, L.; Beziat, A.; Bisel, I.; Bonin, L.; Bosse, E.; Boullis, B.; Broudic, J. C., et al. Treatment and Recycling of Spent Nuclear Fuel Actinide Partitioning - Application to Waste Management. CEA and Editions du Moniteur. 2008.
- Nash, K. L.; Nilsson, M. 1 - Introduction to the Reprocessing and Recycling of Spent Nuclear Fuels. In Reprocessing and Recycling of Spent Nuclear Fuel; Taylor, R. Ed.;Woodhead Publishing, 2015; pp. 3–25. DOI: 10.1016/B978-1-78242-212-9.00001-0.
- Herbst, R. S.; Baron, P.; Nilsson, M. 6 - Standard and Advanced Separation: PUREX Processes for Nuclear Fuel Reprocessing. In Advanced Separation Techniques for Nuclear Fuel Reprocessing and Radioactive Waste Treatment; Nash, K. L., and Lumetta, G. J. Eds.;Woodhead Publishing, 2011; pp. 141–175. DOI: 10.1533/9780857092274.2.141.
- Petrich, G.; Kolarik, Z. The 1981 Purex Distribution Data Index; KfK 3080; Kernforscungszentrum Karlsruhe, 1981. https://inis.iaea.org/search/search.aspx?orig_q=RN:12624382
- O’Neill, G. L. Aqueous Separation - 4.4.2 Purex Process. In Reactor Handbook, Stoller, S. M., and Richards, R. B., Eds.; New York: Fuel Reprocessing; Interscience Publishers, Inc, 1961; Vol. II, pp. 146–179.
- Kolarik, Z.; Petrich, G. A Mathematic Model of Distribution Equilibria in the Extraction of U(VI), U(IV), Pu(IV), Np(VI), Np(iv), and Nitric Acid by 30% Tributyl Phosphate (TBP) in Aliphatic Diluents. Berichte der Bunsengesellschaft für physikalische Chemie. 1979, 83(11), 1110–1113. DOI: 10.1002/bbpc.19790831113.
- Sagar, V.; Chetty, K. V.; Sood, D. D. Extraction of Plutonium (III) by TBP in Presence of Uranium. Solvent Extr. Ion Exch. 2000, 18(2), 307–317. DOI: 10.1080/07366290008934683.
- Kumar, S.; Koganti, S. B. Empirical Modeling of U(IV) Distribution in a Nitric Acid-Water-30% Tbp/n-Dodecane Biphasic System in the Presence of U(VI), Pu(III), and Hydrazine Nitrate. Nucl. Technol. 1998, 123(1), 116–119. DOI: 10.13182/NT98-A2885.
- Kumar*, S.; Koganti, S. B. An Empirical Correlation for Pu(III) Distribution Coefficients in 30% Tbp/n‐Dodecane PUREX System in the Presence of U(VI), U(IV), Pu(IV), Pu(III), and Hydrazine Nitrate. Solvent Extr. Ion Exch. 2003, 21(3), 369–380. DOI: 10.1081/SEI-120020216.
- Boswell, G. G. J.; Soentono, S. Ruthenium Nitrosyl Complexes in Nitric Acid Solutions. J. Inorg. Nucl. Chem. 1981, 43(7), 1625–1632. DOI: 10.1016/0022-1902(81)80350-8.
- Moeyaert, P.; Dumas, T.; Guillaumont, D.; Solari, P. L.; Lefebvre, C.; Thevenet, A.; Sorel, C.; Moisy, P. Modeling and Speciation Study of Uranium(VI) and Technetium(VII) with TBP. Solvent Extr. Ion Exch. 2021, 39(3), 305–327. DOI: 10.1080/07366299.2020.1834979.
- Natarajan, R.; Dhamodharan, K.; Sharma, P. K.; Pugazhendi, S.; Vijayakumar, V.; Pandey, N. K.; Rao, R. V. S. Optimization of Flowsheet for Scrubbing of Ruthenium During the Reprocessing of Fast Reactor Spent Fuels. Sep. Sci. Technol. 2013, 48(16), 2494–2498. DOI: 10.1080/01496395.2013.807828.
- Moeyaert, P.; Miguirditchian, M.; Masson, M.; Dinh, B.; Heres, X.; De Sio, S.; Sorel, C. Experimental and Modelling Study of Ruthenium Extraction with Tri-N-Butylphosphate in the Purex Process. Chem. Eng. Sci. 2017, 158, 580–586. DOI: 10.1016/j.ces.2016.10.035.
- Duan, W.; Cao, S. Determination of the Liquid Hold-Up Volume and the Interface Radius of an Annular Centrifugal Contactor Using the Liquid-Fast-Separation Method. Chem. Eng. Commun. 2016, 203(4), 548–556. DOI: 10.1080/00986445.2015.1048802.
- Rivalier, P.; Lanoë, J.-Y. Development of a New Miniature Short-Residence-Time Annular Centrifugal Solvent Extraction Contactor for Tests of Process Flowsheets in Hot Cells. In ATALANTE 2000, Avignon, FR, 2000.
- Baur, E.; Ruhrberg, K.; Woishnis, W. Chapter 7 - Polyamides. In Chemical Resistance of Engineering Thermoplastics; William Andrew Publishing, 2016; pp. 357–634 .
- Holländer, A.; Cosemans, P. Surface Technology for Additive Manufacturing. Plasma Processes Polym. 2020, 17(1), 1900155. DOI: 10.1002/ppap.201900155.
- Nakahara, M.; Nomura, K. Extraction and Stripping of Actinide Elements with Changes in Supply Flow Rate and Nitric Acid Concentration Using Centrifugal Contactors in Single Cycle Solvent Extraction System. Chem. Eng. Sci. 2011, 66(4), 740–746. DOI: 10.1016/j.ces.2010.11.036.
- Irish, E. R.; Reas, W. H. The PUREX Process - a Solvent Extraction Reprocessing Method for Irradiated Uranium; HW-49483 A; United States, 1957. DOI: 10.2172/4341712.
- Sorel, C.; Montuir, M.; Balaguer, C.; Baron, P.; Dinh, B.; Hérès, X.; Pacary, V.; Roussel, H. The PAREX Code: A Powerful Tool to Model and Simulate Solvent Extraction Operations. In ISEC 2011 - the 19th International Solvent Extraction Conference, Santiago, Chile; 2011.
- Law, J.; Rutledge, V.; Pereira, C.; Copple, J.; Frey, K.; Krebs, J.; Maggos, L.; Nichols, K.; Wardle, K.; Sadasivan, P., et al. Requirements for a Dynamic Solvent Extraction Module to Support Development of Advanced Technologies for the Recycle of Used Nuclear Fuel. United States. 2011. DOI: 10.2172/1027938.
- Frey, K.; Krebs, J. F.; Pereira, C. Time-Dependent Implementation of Argonne’s Model for Universal Solvent Extraction. Ind. Eng. Chem. Res. 2012, 51(40), 13219–13226. DOI: 10.1021/ie301421d.
- Shida, M.; Naito, M.; Suto, T.; Omori, E.; Nojiri, T. A Development and an Application of MIXSET-X Computer Code for Simulating the PUREX Solvent Extraction System. 2001.
- Ishida, M.; Naito, M.; Suto, T.; Omori, E.; Nojiri, T. A development and an application of MIXSET-X computer code for simulating the PUREX solvent extraction system. 2001.
- Groenier, W. S. Calculation of the transient behaviour of a dilute-PUREX solvent extraction process having application to the reprocessing of LMFBR fuels; ORNL-4746; United States: 1972. DOI: 10.2172/4679651.
- Watson, S. B.; Rainey, R. H. Modifications of the SEPHIS computer code for calculating the Purex solvent extraction system; ORNL-TM-5123; United States, 1975. DOI: 10.2172/4167160.
- Magnusson, D.; Malmbeck, R. Development of a Solvent Extraction Model for Process Tests in Short Residence Time Centrifugal Contactors. Solvent Extr. Ion Exch. 2012, 30(2), 115–126. DOI: 10.1080/07366299.2011.581085.
- Magnusson, D.; Geist, A.; Malmbeck, R. SX Process-A Code for Solvent Extraction Processes in Centrifugal Contactors Simulation. Chem. Eng. Sci. 2013, 99, 292–297. DOI: 10.1016/j.ces.2013.06.008.
- Foo, K. Y.; Hameed, B. H. Insights into the Modeling of Adsorption Isotherm Systems. Chem. Eng. J. 2010, 156(1), 2–10. DOI: 10.1016/j.cej.2009.09.013.