
ABSTRACT
This article presents an experimental investigation on transport of methylhydroxyethylcellulose (MHEC) during drying of a model porous material. Nuclear magnetic resonance imaging and thermogravimetric analysis are used to measure water and MHEC transport, respectively. MHEC is added to glue mortars to increase open time, i.e., the time period during which tiles can be applied with sufficiently good adhesion. Previous work showed that MHEC promotes a receding front during drying and therefore leads to differences in the degree of hydration throughout the mortar sample, i.e., the top surface shows poor hydration and the bottom surface shows good hydration. In this study, we investigate the transport of MHEC during drying of a model porous material, consisting of packed glass beads saturated with an aqueous MHEC solution. At MHEC concentration less than 1.3 wt%, homogeneous drying is observed, enabling advective transport of MHEC toward the drying surface. In this case, accumulation of MHEC may form a skin at the top surface and below this skin layer, a gel zone may form, which allows migration of water toward the evaporation surface. When the MHEC concentration is above 1.3 wt%, front receding drying is observed, which prevents transport of MHEC, resulting in a more homogeneous distribution of MHEC.
Introduction
Methylhydroxyethylcellulose (MHEC) is added to glue mortar to control open time. Open time is the time period during which a tile can be applied with sufficiently good adhesion. MHEC is said to retain water enabling sufficient adhesion.[Citation1,Citation2] During drying, a skin may form that influences open time. The skin can be considered a surface layer ranging from micron to tens of micron thickness and having different properties compared to the bulk material. Different processes are reported to contribute to skin formation, such as evaporation, densification through transport of smaller inorganic mortar components, hydration, carbonation, and accumulation of polymeric materials.[Citation3]
Drying of porous media is a complex process.[Citation4,Citation5] In most studies, drying in porous media focuses on low-viscous fluids (e.g., water). In most cases, a porous material dries homogeneously with a constant drying rate until critical moisture content is reached.[Citation6] In the first stage, drying is dominated by the external mass transfer (e.g., evaporation). At the critical moisture content, the fluid path is no longer continuous and drying no longer homogeneous. From this point onward, the drying process takes place by transport of vapor and/or liquid films. In this stage, drying is dominated by internal mass transfer (e.g., internal vapor transport). Different transport processes inside porous materials may result in similar drying behavior. In the latter case, the drying behavior is almost similar to that observed in case of drying of squared or other shaped capillaries in which liquid films are present in the corners of the capillaries.[Citation7,Citation8]
The evaporation rate at early stages largely depends on the external conditions, such as air flow and humidity. Very fast drying may lead to the formation of a dry skin. A skin can also be the result of densification of the mortar by inorganic mortar components. During drying, concentration of reactive cement particles at the top surface of mortar may occur, where their rapid hydration could contribute to the reduction of open time by reducing the free water content and stiffening of the paste.[Citation9] Also carbonation can generate a skin, typically consisting of a 10-µm-thick layer of CaCO3 formed during the first 30 min of air exposure. Finally, the flow of water during drying may transport MHEC to the mortar surface, where it may deposit. This skin formation at the drying surface is suggested to be the key process that determines the open time.[Citation3]
Only limited knowledge exists on the transport of polymers toward the drying surface and skin formation during drying. Jenni et al.[Citation9] investigated the skin formation of cellulose ether (CE) and polyvinyl alcohol-modified mortar during open time and considered that skin formation is a key factor that determines adhesion. The authors showed that both organic and inorganic substances can transport toward the drying surface along with the water flux. Bentz et al.[Citation10] investigated the skin formation and observed the transport of cellulose ether and small cement particles during drying. Zurbriggen et al.[Citation11] investigated skin formation by investigating the interface between mortar and a glass plate to visualize the skin formation. When the glass plate is illuminated from the side, the location where skin formed and appears dark prevented wetting, whereas the fresh mortar that wetted the glass appears bright. Gasparo et al.[Citation12] reported a higher enrichment of CE at the mortar surface and a skin formation at the mortar/air interface. They suggest that evaporation and corresponding water flow is the reason for the observed CE enrichment. Unfortunately, their investigation does not provide detailed explanation of the transport processes.
Mortars are complex and the identification of polymer in a mortar matrix is difficult, especially in commercially formulations with low concentrations of 0–1 wt%. Our aim is to understand the contribution of transport processes of MHEC on drying mortar, which is driven by water transport. In previous studies, we have studied transport processes in reactive media,[Citation2] which make interpretation quite challenging. To only investigate the effect of transport process of MHEC on the distribution, a nonreactive model is needed. Consequently, to unravel hydration effect from evaporation effect, packed glass beads were chosen as a nonreactive model material. We have chosen packed glass beads as the model porous media, instead of other materials such as sintered Al2O3, because the pore size of the packed glass beads can be easily manipulated by changing bead size, and MHEC can be easily extracted from the bead surface. Glass beads with three different diameters were used to understand the influence of pore size and structure on the MHEC distribution during drying. Some 2D model porous systems consisting of glass beads exist, allowing imaging the drying process using a camera.[Citation13Citation14Citation15] To measure fluid distributions inside 3D porous materials, techniques like synchrotron X-ray tomography[Citation16] and nuclear magnetic resonance (NMR) imaging[Citation17Citation18Citation19] allow noninvasive probing of moisture with a sufficiently high spatial and time resolution. For this study, NMR imaging was used to monitor the moisture distribution during drying process. Unfortunately, NMR is not able to determine the MHEC distribution. Consequently, thermogravimetric analysis (TGA) was chosen as an analysis technique for MHEC distribution.
The goal of this study is to understand the transport behavior of MHEC during drying in a model porous media saturated with an MHEC solution. For the first time, an attempt is made to link MHEC to the transport processes during the drying process using NMR and correlate final distribution of MHEC to the drying processes. The following specific research questions are addressed. (1) How does the pore size influence the drying behavior of porous media saturated with MHEC? (2) How does the pore size influence the transport of MHEC?
Materials and methods
Methylhydroxyethylcellulose
Methylhydroxyethylcellulose is water-soluble cellulose ether, synthesized from cellulose by substituting methyl and ethylene oxide groups by an etherification process. A commercial-grade MHEC (Tylose MHS 6000 P6), provided by SE Tylose GmbH & Co.KG, Germany, with a degree of substitution (DSME, ME = Methyl) of 1.3 and a molar degree of substitution (MSHE, HE = Hydroxyethyl) of 0.3, we chose this MHEC as a model system being the most standard modified cellulose being commonly used for influencing drying properties for cementitious materials, such as glue mortar. The MHEC solutions were prepared by heating 200 ml of water to 80°C allowing the dissolution of MHEC. The solution was homogenized by stirring the solution with a magnetic stirrer at 500 rpm for 2 days. Finally, the solution was cooled to room temperature.
The dynamic viscosity of MHEC solutions was measured with a TA-Instruments AR-1000 rheometer. To investigate the effect of viscosity, a concentration range of MHEC was selected. shows the dynamic viscosity for different MHEC concentrations. Obviously, the viscosity value of 4.3 wt% MHEC varies four orders of magnitude compared to 0 wt% MHEC.
Table 1. Experimental parameters used to calculate the capillary number and Bond number.
The surface tension as a function of MHEC concentration is shown in . A conventional pendant drop technique was used to measure the surface tension of MHEC solutions (DSA 100 Drop Shape Analyzer). The surface tension of MHEC solutions was determined by fitting the drop shape to Young–Laplace equation, which relates the interfacial tension to drop shape. The table shows a decrease in surface tension with the increasing MHEC concentration, wherein the most pronounced decrease is observed at low MHEC concentrations.
The contact angle for different MHEC concentrations () is determined on silica glass. The contact angle was determined using a data physics OCA-20 contact angle instrument and using the sessile drop method. In both cases, an increase in contact angle is observed with the increasing MHEC concentration.
NMR imaging and setup
Nuclei with a net magnetic moment will start to process, when placed in a magnetic field with a resonance frequency, called the Larmor frequency given by:
The sum of all individual magnetic moments of the spins is the so-called net macroscopic magnetization and can be manipulated by applying an oscillating magnetic field at the resonance frequency of nuclei. The intensity of the resulting spin echo signal is proportional to the density of the magnetic moment and thus the hydrogen density. The hydrogen density is directly connected to the local water content.
The experiments were performed with a home-built NMR setup with a static magnetic field of 0.7T, resulting in a resonance frequency of 31 MHz and a gradient of 400 mT m−1. In this configuration, a spatial resolution of 0.8 mm was obtained. shows the schematic diagram of the NMR setup designed to measure moisture profile of cylindrical sample during drying. Moisture profiles were obtained with a Hahn spin echo sequence with an echo time of 150 µs, window width 100 µs, repetition time of 2.5 s at different sample positions divided by a reference sample (containing water) of equal volume.
Figure 1. Schematic diagram of NMR set-up. The step motor is used to position the sample in the NMR set up.
Drying experiments
The bead diameters used for this study are 1 mm, 500, and 50 µm, respectively. The different bead diameters were used to make model porous media with different pore sizes to investigate the influence of pore size, and corresponding capillary forces, on drying and transport of MHEC. The beads are cleaned with demineralized water and an acetone solution. After oven-drying, the beads are put in a cylindrical glass sample holder with a diameter of 18 mm and a length of 10 mm for an NMR drying measurement. The samples were first packed with beads and each sample was vacuum saturated with pure water and increasing concentrations of MHEC solution, namely, 0.4, 1.3, 2.1, and 4.3 wt%. Each sample was vacuum saturated for 3 days to ensure full saturation. The drying was performed using an air flow of 1 l min−1, with a close to zero relative humidity on the top of the sample. The experiments were performed at room temperature (20°C), although the authors are aware that the temperature is influencing, especially the evaporation process, this was beyond the scope of this study.
TGA measurement on MHEC dried bead
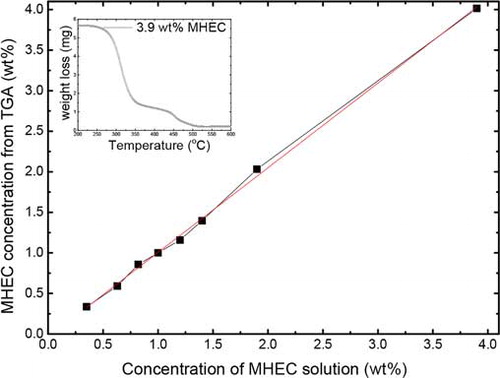
At the end of the drying experiments, the final MHEC distribution was determined with TGA. After drying, five layers of sample beads of 2 mm layer thickness were taken off sequentially along the vertical profile from the drying surface to the bottom of the sample holder. The MHEC weight loss of each layer of beads is measured and compared to the initial weight of MHEC inside the beads. Before starting a TGA measurement on MHEC dried bead sample, the applicability of the method needs to be investigated in terms of accuracy, reproducibility, and sensitivity. For these reasons, we measured samples containing different amounts of MHEC to construct a calibration curve. To do this, different concentrations of MHEC solution were prepared and poured in TGA crucibles. The TGA measurements of these samples were performed from 25 to 600°C at 5°C min−1 with an air flow of 50 ml min−1. The corresponding calibration curve of the initial MHEC content as a function of TGA weight loss is shown in . The inset in shows the TGA weight loss of 3.9 wt% MHEC solution as a reference. We see 4% unburned residue inside the crucible at the end of the measurement. This is expected, since MHEC is known to contain salts as a result of production. This indicates that MHEC can be accurately quantified through the weight loss by thermal decomposition of MHEC.
Figure 2. This figure shows (a) TGA curve for different weight percentage MHEC and (b) corresponding calibration curve plotted for different weight percentage MHEC solution.
Results and discussion
Moisture profiles during drying of packed beads with different pore sizes
We aim to understand the transport behavior of MHEC during drying of randomly packed beads. First, the influence of MHEC on the drying behavior of a model porous media is investigated. With NMR imaging, the moisture distributions in drying bead samples were obtained.
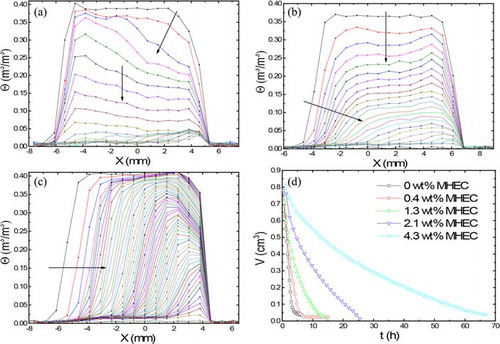
shows the moisture distribution of 1-mm bead samples saturated with different concentrations of MHEC during drying. The top and bottom sides of the samples are located on the left and right sides of the profiles, respectively. shows the moisture distribution in case of 0 wt% MHEC. The first curve represents the profile at 35 min after the start of the experiment. The profiles are acquired and plotted every 35 min. Inhomogeneous drying is observed, as indicated by the inclined arrow and continues till a critical saturation θc (θc ≈ 0.05 m3 m−3) is reached, indicated by the vertical arrow. After the critical saturation has been reached, a homogeneous drying is observed till the end of the drying process. With the increasing MHEC concentration ( and ), the drying behavior becomes more inhomogeneous, and a receding drying front is observed from the start of the drying process, as indicated by the horizontal arrow.
Figure 3. Moisture profiles of the 1 mm bead as a function of position during drying. (a) 0 wt% MHEC profiles plotted every 35 min, (b) 1.3 wt% MHEC, (c) 4.3 wt% MHEC profiles plotted every 68 min, and (d) total volume of water as function of MHEC concentration. The dotted line shows the shift from an inhomogeneous to homogeneous drying.
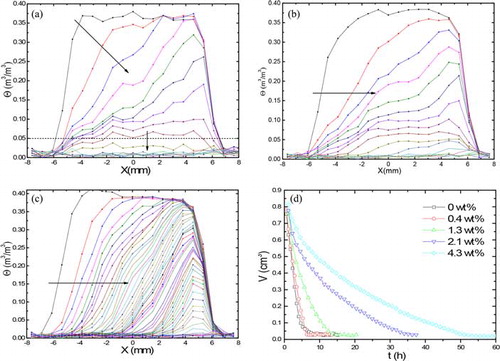
The total moisture content is plotted against time for different weight percentage of MHEC in . In the first stage of 0 and 0.4 wt% MHEC drying, the overall curve is decreasing linearly. In the last period of drying, the moisture decrease is nonlinear and the evaporation rates decrease. This corresponds to the period in which a receding front moves inside the material and which is dominated by an internal evaporation process, followed by vapor diffusion. From , one can clearly see a decrease in the initial drying rate with the increasing MHEC concentration. We return to the interpretation after presenting the drying behavior of all bead sizes.
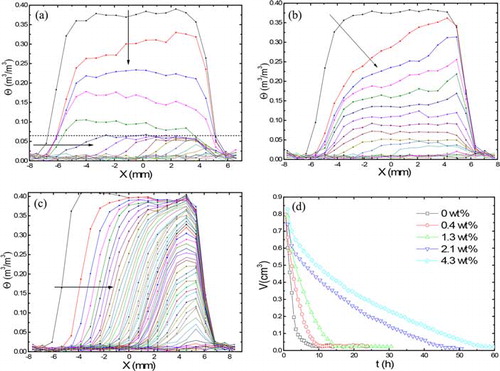
Nuclear magnetic resonance moisture profiles of the 500-µm-sized bead samples with different MHEC concentrations during drying are shown in . shows the drying in case of 0 wt% MHEC. Homogeneous drying is observed for water-saturated beads till a critical saturation θc (θc ≈ 0.07 m3 m−3), after which a front receding drying is observed. With an increase in MHEC concentration, the drying behavior becomes more inhomogeneous ( and ). For 1.3 wt% MHEC, a transition from homogeneous to inhomogeneous drying is observed. In the case of 4.3 wt% MHEC, a moving front is observed, as indicated by the horizontal arrow. shows the total moisture content against time for different weight percentage of MHEC. Again a decrease in the initial drying rate with the increasing MHEC concentration is observed.
Figure 4. Moisture profiles of the 400–600 µm bead as a function of position during drying. (a) 0 wt% MHEC profiles plotted every 35 min, (b) 1.3 wt% MHEC, (c) 4.3 wt% MHEC profiles plotted every 68 min, and (d) total volume of water as function of MHEC concentration. The dotted line shows the shift from homogeneous to inhomogeneous drying.
Nuclear magnetic resonance moisture profiles of the 50-µm-sized bead samples with different MHEC concentrations during drying are shown in . shows the drying in case of pure water. An inhomogeneous drying is seen at the bottom of the sample (indicate by the inclined arrow at the right side of the plot), whereas homogeneous drying is expected. Even in a second experiment, the same behavior was observed. The reason for this drying behavior may be due to the floating and rising of fine beads toward the top, which may result in a more dense packing at the top. In such a case, a higher density will result in a higher capillary pressure forcing the water to the top. This will cause a reversed inhomogeneous drying. After this, the drying becomes homogeneous. The moisture profile for 1.3 wt% () shows a front receding drying, indicated by the horizontal arrow. In addition, we see a homogeneous drying at the back of the sample indicated by the vertical arrow. Front drying is also observed for 4.3 wt% MHEC as shown in . A front is seen at the beginning of the drying process, moving inside the sample, as indicated by the horizontal arrow. shows the total moisture content against time for different weight percentage of MHEC. Again here, a decrease in the initial drying rate with the increasing MHEC concentration is observed.
Figure 5. Moisture profiles of the 50 µm bead as a function of position during drying. (a) 0 wt% MHEC profiles plotted every 18 min, (b) 1.3 wt% MHEC profiles plotted every 35 min, (c) 4.3 wt% MHEC profiles plotted every 68 min, and (d) total volume of water as function of MHEC concentration.
Forces determining the drying behavior
In this section, we focus on the forces determining the drying behavior. This is achieved by investigating the capillary and Bond number (Bo) dependence on the addition of MHEC. With these numbers, a phase diagram is constructed that is used to explain the experimental findings.
One can characterize the drying inside a porous material using the capillary number (Ca). The capillary number can be considered a ratio of length scales L and ξ, (Ca = L/ξ), where L is the size of the sample and ξ represents the width of the observed drying front. One can rewrite the capillary number, using Darcy’s law and Young–Laplace equation pc = 2γcosθ/r to obtain[Citation1]
For large pore size materials, the effect of gravitational force on the drying cannot be neglected. In that case, the effect on drying inside a porous material can be characterized using the Bond number. The Bond number is the ratio between gravitational forces and capillary forces.
To parameterize Ca and Bo, both the physical property values of liquid and the properties of model porous media are required. The parameters determining the capillary number and Bond number are given in for all bead sizes. The physical properties of liquid, such as viscosity, surface tension, and contact angle are given in “Methylhydroxyethylcellulose”. The other parameters to be determined for the model systems are porosity, pore radius, and permeability. The porosity of a packed bed determines the saturation level, which can be easily obtained from the NMR experiment. The saturation level is the result of the type of packing. For all bead sizes, our NMR experiments show a saturation value of ≈0.37, which corresponds to close random packing. The typical highest form of dense packing is a tetrahedral packing that exhibits the smallest void space. As such, this results in the highest obtainable capillary pressure. Therefore, we chose tetrahedral voids packing to calculate the pore radius, r ≈ 0.225R, where R is the diameter of the bead.
The permeability of the porous medium is the ability of fluid flowing through a porous media caused by a pressure difference. There are several approaches reported in the literature to calculate the permeability of porous media.[Citation20Citation21Citation22Citation23] Each of them has their own accuracy and assumptions and some models are for mortars and concrete only since those models are being used for pore size distributions. However, in our study, we have chosen Carman–Kozeny model,[Citation24] as this model is often applied on packed beads and powders. In the so-called “Carman and Kozeny” model, or “hydraulic diameter” model the packed beads of porous media can be considered as a parallel sequence of pores of which the cross-sectional area has a complicated shape. The assumed laminar flow through such a medium of parallel pores is described by the Hagen–Poiseuille law, giving a relation for the interstitial velocity and the cross-sectional shape, based on the hydraulic diameter. Based on these starting points, Carman and Kozeny[Citation24] derived their equation to calculate the permeability of such packed beds,
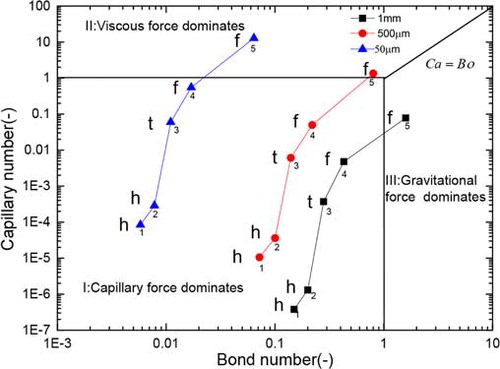
Figure 6. Capillary number vs. bond number as a function of MHEC concentration. The labels h, t, and f represent homogeneous, transition and front receding drying of the corresponding sample, respectively. The numbers 1, 2, 3, 4, 5 represent 0, 0.4, 1.3, 2.1, and 4.3 wt% of MHEC, respectively.
The initial pore velocity for all bead size was determined from the decrease in the total moisture content plotted in , , and , wherein the value was determined from the initial slope of the curve at t = 0.
On the basis of parameterization that was previously outlined, a phase diagram can be constructed (), wherein the capillary number against Bond number for all bead samples is presented. The horizontal and vertical lines represent the dominance of capillary, viscous, and gravitational forces, i.e., at Ca = 1 and Bo = 1 (transition lines), respectively. The third diagonal line represents Ca = Bo. For all points in , a label is given indicating the type of drying behavior. These labels are h, t, and f corresponding to homogeneous drying, transition, and front drying, respectively. In this Ca–Bo phase diagram, one can distinguish the dominating force. In region I, the gravitational forces and viscous forces are negligible and the dominating force is the capillary force. In this regime, homogeneous drying is expected. In zones II and III, the viscous and gravitational forces dominate, respectively. In these cases, a drying front is expected.
In , the Bond number decreases one order of magnitude with a decrease in bead size and corresponding decrease in pore radius, whereas the capillary number increases one order of magnitude with a decrease in bead size. The reason for the observed increase in the capillary number is due to the squared value dependence of the permeability on pore radius, k ∼ r2, which results in an increase in capillary number with a decrease in pore radius. In the case of smaller beads, capillary forces dominate over gravitational forces, and homogeneous drying is observed. In the case of large beads, the gravitational force dominates over the capillary force, and inhomogeneous drying is observed. For all bead sizes, a change of capillary number of several orders of magnitude is observed with the increasing MHEC concentration. This implies that viscous forces dominate over capillary forces and gravitational forces. The capillary force is no longer sufficient to cause the flow. Consequently, a front receding drying is observed. Note that only for the large bead sizes the effect of gravity is of any importance. Only for the high viscous fluid and large bead sizes, gravity becomes more of importance, this is the result of the fact that the capillary forces decrease as a result of a decrease in surface tension.
Note that shows the initial value and that later stage during drying the curve may shift, resulting in a different picture. At later stages, the contact angle and surface tension increase due to an increase in MHEC concentration. In addition, at the same time, the viscosity increases considerably for the same reason. Furthermore, the permeability will drop since less fluid is available (and connections might be lost). Taking into account that the evaporation rate remains constant (obtained from the plots of the total moisture content), the decrease in saturation results in an increase in pore velocity and an increase in capillary number. All these effects work in the same direction, and which increases the capillary number over time as such the curve shift toward the viscous zone.
MHEC transport
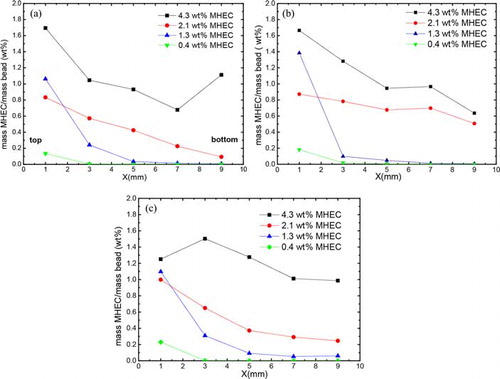
In this section, we aim to understand the MHEC transport during drying of glass beads saturated with an MHEC solution. This is achieved on the basis of MHEC distribution in the samples after drying in the NMR setup. For the TGA measurements, the samples were split in five separate, originally stacked, layers. Using this method, the average concentration distribution along the package of layers can be determined quantitatively. shows the MHEC distribution curve for 1-mm, 500, and 50-µm bead samples saturated with different weight percentage of MHEC solution after drying. The MHEC distribution as given in is calculated from the mass of MHEC divided by the mass of the beads plotted against the position. For the samples at low concentration (with 0.4 and 1.3 wt%) an increased concentration is seen at the top layer. In the case of a 2.1 wt% MHEC concentration, the distribution shows a gradient in concentration increasing toward the top. At this concentration, the high viscosity of pore solution seems to inhibit transport of water and MHEC toward the top. As a consequence, the deposition of MHEC at the surface is no longer possible and the MHEC is deposited more homogeneously throughout the material compared to the 0.4 and 1.3 wt% MHEC-saturated samples. In the case of 4.3 wt% MHEC, also this concentration shows a gradient but smaller than the sample with 2.1 wt% MHEC.
Figure 7. MHEC distribution in mass of MHEC per mass of beads for (a) 1 mm bead, (b) 400–600 µm bead, and (c) 50 µm saturated with different mass weight percentage of the original solution as function of sample position.
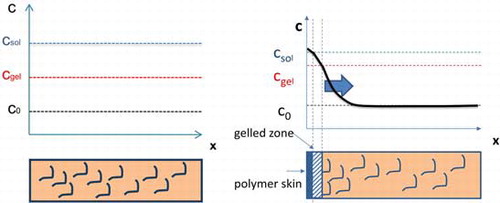
shows the schematic representation of MHEC concentration inside a bead sample before and after drying process. At the start of the drying process, a homogeneous distribution of MHEC exists throughout the sample, given by c0. Upon drying, an enrichment of MHEC at the top surface is observed. This may be explained by the initial low viscosity of the pore solution, wherein advection causes MHEC to transport and subsequently deposit at the drying surface. It is known that CE forms a gel at a certain concentration, which we will refer to as gel concentration cgel. During drying, the water can transport through the gel, as shown schematically in .[Citation29]
Figure 8. Schematic representation of MHEC concentration inside bead samples before and after drying process.
The key processes that determine the transport of MHEC are diffusion and advection. In the case of 0.4 wt% MHEC, all the MHEC are transported to the surface, which may be a result of advection of cellulose molecules. In the case of 1.3 wt% MHEC, the fact that not all the MHEC is transported to the surface, which may be a result of restricted advection or back diffusion. At these concentrations, the long polymer chains may attach to the bead surface, which prevents MHEC to transport along with the water. To analyze whether advection or diffusion drive the transport, the Peclet number (Pe) for the MHEC solution and film thickness calculation may be used.[Citation30] The Peclet number is a dimensionless number that is the ratio of advection and diffusion (the diffusion equations have been discussed in detail in our previous article[Citation1]), given by:
Table 2. Peclet number calculated from the NMR moisture profiles for all bead samples and 0.4 and 1.3 wt% MHEC, respectively.
In the low MHEC concentration profiles (especially 1.3 wt%), the presence of MHEC in the second layer is clearly observed (positioned at 3 mm in ). The question is whether this results from the formation of a deposited or gelled region, or limited advection, or both. To answer this question, the critical concentration for MHEC deposition or gelation should be known. This can be obtained from the evaporation of an MHEC solution. From bulk evaporation measurements with different weight percentage MHEC, we found that the evaporation rates drop when a critical concentration, csol ≈ 10 wt% was reached, see . We are convinced that this concentration is csol, since in the case of a gel, the evaporation will remain constant, which is experimentally confirmed in , in which the 6.5 wt% MHEC solution (which is a gel at this concentration) shows evaporation speeds equal to the lower concentration. This supported by the fact that the water diffusion is same at small concentration.[Citation32] Assuming full advection at lower saturation levels (0.4 and 1.3 wt% MHEC), at this concentration, deposition of hydrophobic MHEC film may occur, forming a barrier for vapor transport. In such a case, the thickness of the surface layer (δ) formed by the transported MHEC is given by:
Figure 9. Total volume of water as function of time during bulk evaporation of different weight percentage MHEC solution.
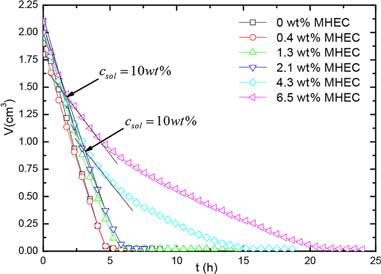
Table 3. MHEC layer thickness calculated for low concentration of MHEC.
Summarizing, we have shown that advection is dominating as transport process over diffusion and the results indicate not all MHEC are transported by advection to the surface.
Conclusion
This article presents an experimental investigation on the transport behavior of MHEC in a model porous media made of packed glass beads. NMR imaging and TGA are used to measure water and MHEC transport, respectively.
When drying at low concentration of MHEC, the NMR profiles show a homogeneous drying for all bead sizes, whereas with an increase in MHEC concentration, we observe a front receding dying behavior.
Our experimental result of the MHEC distribution shows that for all bead sizes filled samples that have a low MHEC concentration ≤1.3 wt%, a higher enrichment of MHEC toward the drying surface is observed. At these MHEC concentrations, the homogeneous drying, which indicates a liquid path all the way to the surface of the sample, allows advective transport of MHEC toward the drying surface. At high MHEC concentration above 1.3 wt%, more or less homogeneous MHEC distribution is observed. At these concentrations, front receding drying is observed, which inhibits transport of MHEC due to advection. Our results show that the pore diameter does not have any significant influence on the drying behavior. This is corroborated by , which shows that although the curves shift the measured concentration points that are positioned as such that they roughly maintain their drying pattern. A larger shift in pore size would be required to change the drying pattern as we observed an inhomogeneous drying for 1-mm beads at low weight percentage of MHEC due to gravitational force. However, with an increase in MHEC concentration, the gravitational force become negligible and viscous force leads a receding front drying behavior. In general, homogenous becomes more a front-like drying pattern.
Further, analysis on the transport of MHEC by analyzing the MHEC distribution of dried samples saturated at low MHEC concentration (1.3 wt% and lower) shows that not all MHEC are transported to the surface, in other words, no full advection has taken place. Furthermore, based on Peclet number, we showed that diffusion is too small to be of any influence. At higher concentrations a layer-by-layer deposition is observed, which is because of the observed front-like drying. In fact, the beads do not seem to directly influence the transport of MHEC rather than changing the drying behavior.
Acknowledgment
This research was performed under the project number M81.6.08315 in the framework of the Research Program of the Materials innovation institute (M2i) (www.m2i.nl). The authors thank C.J. Haecker from SE Tylose GmbH & Co, Wiesbaden, Germany, for providing the cellulose ether samples and for helpful discussion in an early phase of the project. The authors would also like to thank Hans Dalderop and Jef Noijen for their technical assistance.
Related Research Data
References
- Faiyas, A.P.A.; Erich, S.J.F.; van Soestbergen, M.; Huinink, H.P.; Adan, O.C.G.; Nijland, T.G. How methylhydroxyethylcellulose influences drying in porous media. Chemical Engineering Science 2015, 23, 620–628.
- Faiyas, A.P.A.; Erich, S.J.F.; van Soestbergen, M.; Huinink, H.P.; Adan, O.C.G.; Nijland, T.G. Effect of MHEC on evaporation and hydration characteristics of glue mortar. Cement and Concrete Research 2016, 83, 97–103.
- Buhler, T.; Zurbriggen, R.; Pieles, U.; Huwiler, L.; Raso, R.A. Dynamics of early skin formation of tiling mortars investigated by microscopy and diffuse reflectance infrared Fourier transformed spectroscopy. Cement and Concrete Composites 2013, 37, 161–170.
- Le Bray, Y.; Prat, M. Three-dimensional pore network simulation of drying in capillary porous media. International Journal of Heat and Mass Transfer 1999, 42, 4207–4224.
- Metzger, T.; Tsotsas, E. Influence of pore size distribution on drying kinetics: A simple capillary model. Drying Technology 2005, 23, 1797–1809.
- Prat, M.; Veran-Tissoires, S.; Vorhauer, N.; Metzger, T.; Tsotsas, E. Fractal phase distribution and drying: Impact on two-phase zone scaling and drying time scale dependence. Drying Technology 2012, 30, 1129–1135.
- Chauvet, F.; Duru, P.; Geoffroy, S.; Prat, M. Three periods of drying of a single square capillary tube. Physical Review Letters 2009, 103, 124502.
- Prat, M. On the influence of pore shape, contact angle and film flows on drying of capillary porous media. International Journal of Heat and Mass Transfer 2007, 50, 1455–1468.
- Jenni, A.; Holzer, L.; Zurbriggen, R.; Herwegh, M. Influence of polymers on microstructure and adhesive strength of cementitious tile adhesive mortars. Cement and Concrete Research 2005, 35, 35–50.
- Bentz, D.P.; Haecker, C-J.; Peltz, M.A.; Snyder, K.A. X-Ray Absorption studies of drying of cementitious tile adhesive mortar. Cement and Concrete Composites 2008, 30, 361–373.
- Zurbriggen, R.; Herwegh, M.; Pieles, U.; Buhler, Th.; Huwiler, L. A new laboratory method to investigate skin formation and open time performance. Drymix Mortar Yearbook, idmmc three, Nuremberg 2011, 3, 28–29.
- De Gasparo, A.; Herwegh, M.; Zurbriggen, R.; Scrivener, K. Quantitative distribution patterns of additives in self-leveling flooring compounds (underlayments) as function of application. formulation and climatic conditions. Cement and Concrete Research 2009, 39, 313–323.
- Horgue, P.; Augier, F.; Duru, P.; Prat, M.; Quintard, M. Experimental and numerical study of tow-phase flows in arrays of cylinders. Chemical Engineering Science 2013, 102, 335–345.
- Vorhauer, N.; Tran, Q.T.; Metzger, T.; Tsotsas, E.; Prat, M. Experimental investigation of drying in a model porous medium: Influence of thermal gradients. Drying Technology 2013, 31, 920–929.
- Lu, T.X.; Biggar, J.W.; Nielsen, D.R. Water movement in glass bead porous media: 1. Experiments of capillary rise and hysteresis. Water Resources Research 1994, 30, 3275–3281.
- Shokri, N.; Sahimi, M. Structure of drying fronts in three-dimensional porous media. Physical Review E 2012, 85, 066312.
- Kopinga, K.; Pel, L. One-dimensional scanning of moisture in porous materials with NMR. Review of Scientific Instruments 1994, 65, 3673–3681.
- Pel, L.; Kopinga, K.; Brocken, H. Moisture transport in porous building materials. Heron 1996, 41, 95–105.
- Pel, L.; Brocken, H.; Kopinga, K. Determination of moisture diffusivity in porous media using moisture concentration profiles. International. Journals of Heat and Mass Transfer 1996, 39, 1273–1280.
- Olivier, J.P.; Massat, M. Permeability and micostructure of concrete: A review of modeling. Cement and Concrete Research 1992, 22, 503–514.
- Van Brakel, J.; Heertjes, P.M. Analysis of diffusion in macroporous media in terms of a porosity, a tortuosity and a constrictivity. International Journal of Heat and Mass Transfer 1975, 17, 1093–1103.
- Aït-Mokhtar; Amiri, A.; Sammartino, O. Analylitic modelling and experimental study of the porosity and permeability of a porous medium – application to cement mortars and granitic rock. Magazine of Concrete Research 1999, 51, 391–396.
- Aït-Mokhtar; Amiri, A.; Dumargue, P.; Sammartino, S. A new model to calculate water permeability of cement-based materials from MIP results. Advance in Concrete Research 2002, 14, 43–49.
- Kaviany, M. Principles of Heat Transfer in Porous Media, 2nd ed.; Springer: New York.
- Dudgeon, C.R. An experimental study of the flow of water through coarse granular media. La Houille Blanche 1996, 7, 785–800.
- Kozicki, W.; Hsu, C.; Tiu, C. Non-Newtonian flow through packed beds and porous media. Chemical Engineering Science 1967, 22, 487.
- Kulicke, W.; Haas, R. Flow behaviour of dilute polyacrylamide solutionsthrough porous media. 1. Influence of chain length, concentration and thermodynamic quality of solvent. Industrial and Engineering Chemistry Fundamentals 1984, 23, 308.
- Scherer, P.G.; Swiatek, R. Measurement of permeability II silica gel. Journals of Non Crystalline Solids 1989, 113, 119.
- Philipse, A.P.; Pathmamanoharan, C. Liquid permeation (and sedimentation) of dense colloidal hard-sphere packings. Journal of Colloids and Interface Science 1993, 159, 96.
- Gupta, S.; Huinink, H.P.; Pel, L.; Kopinga, K. How ferrocyanide influences NaCl crystallization under different humidity conditions. Crystal Growth and Design 2014, 14, 1591–1599.
- Nyden, M.; Soderman, O. An NMR self diffusion investigation of agglomeration phenomena in solution of ethyl (hydroxyethyl) cellulose. Macromolecules 1998, 31, 4990–5002.
- Hirrien, M.; Chevillard, C. Thermogelation of methylcelluloses: New evidence for understanding the gelation mechanism. Polymer 1998, 39, 6251–6259.