
 ?Mathematical formulae have been encoded as MathML and are displayed in this HTML version using MathJax in order to improve their display. Uncheck the box to turn MathJax off. This feature requires Javascript. Click on a formula to zoom.
Abstract
This work investigates the evenness of fabric drying in a household heat pump tumble dryer. The evenness of drying was defined as the standard deviation of the fraction of water, evaporated from each fabric item. Drying experiments were performed according to the IEC 61121 standard, which was also followed to determine quantities and types of cotton fabric items (towels, pillowcases and sheets) within each load. Regression analysis was performed to develop models for evenness of drying as a function of load mass and drum speed. Similarities between the tumble dryer energy efficiency parameters and the evenness of drying were analyzed. A high level of agreement was determined between responses of energy efficiency, drying time and evenness of drying to changes in drum speed. Effects of load mass were however more complex and were reflected in a non-linear response of evenness of drying to changes in load mass – the best evenness of drying could be obtained at 2 kg load, followed by 6 kg and 4 kg load. Load composition was determined as an important factor affecting the evenness of drying. At larger loads, a sheet or a pillowcase in average contributed more to the un-evenness of drying than a towel. The presence of sheets and probably the ratio of sheets to other item types in the load were determined as the most probable factors that negatively affected the evenness of drying.
Introduction
Tumble dryers are essential appliances in modern households as they provide a fast and convenient way of drying clothes, independent of weather conditions. More than 5 million tumble dryers were sold across the EU in 2016. The market share of heat pump tumble dryers has reached 51% in 2016[Citation1] and is steadily increasing due to their superior energy efficiency compared to conventional dryers. Besides energy efficiency, the most exposed performance parameters (mandatory on the EU energy label for tumble dryers) are drying time, noise and condensation efficiency. Less exposed, but also important to consumers, are parameters that describe quality of drying, such as evenness of drying, dimensional stability, wrinkling and appearance of fabrics after drying.
Tumble dryers have been studied widely in the literature especially from a perspective of optimizing energy efficiency and drying time. The mentioned parameters were investigated also within the current study. Bassily and Colver[Citation2] evaluated the energy performance of a venting dryer under various heater power, fan speed, drum speed, weight, and initial moisture of the clothes. They also developed a correlation for the area-mass transfer coefficient to investigate the mass transfer process inside the drum.[Citation3] Yadav and Moon[Citation4] conducted a theoretical analysis of the drying process in a venting dryer to determine the effects of the inlet air relative humidity, mass per unit area of clothes, bone-dry mass of clothes, and water content lost on the energy consumption. Wei et al.[Citation5] built a multi-sensor computer-controlled venting dryer platform that enabled the real-time control and recording of key drying parameters including heater power, airflow velocity, drum rotating speed, and drying cycle time. They developed a drying model by dividing the drying process into 4 stages based on the exhaust air relative humidity in order to increase the energy saving. Novak et al.[Citation6] examined the influence of the drum inlet air temperature, relative humidity, and flow rate on the drying process in an open-cycle tumble dryer through measurements and modeling. They developed correlations for determination of the total drying time, moisture evaporation rate, and area-mass transfer coefficient. Gluesenkamp et al.[Citation7] presented a definition of dryer drum heat and mass transfer effectiveness. They conducted dimensional analysis to establish a functional relationship between the dependent variable effectiveness and the independent variables of load size, drum volume, air flow rate, and drum moisture content. Stawreberg and Nilsson[Citation8] established a statistical model from experiments in a condensing dryer to find the optimal settings for the heater power supply, the internal airflow, and the external airflow to reach a high SMER and a low leakage ratio of the water vapor. Stawreberg et al.[Citation9] estimated the leakage from a condensing dryer through measurements and modeling using energy and mass balances. The leakage in heat pump dryers was also investigated by Bansal et al.[Citation10] who developed a method for quantifying leakage and determination of specific leakage locations within the air circulation system. Similar approach that included air leakage measurements into and from the segments of two venting and one ventless dryer was recently reported by Boudreaux et al.[Citation11]
A great proportion of tumble dryer research is still performed in vented tumble dryers, however, heat pump tumble dryers and tumble dryers with novel concepts are gaining in research interest. This research is also highly relevant for the presented study, which employed a heat pump tumble dryer. The benefits of integrating a heat pump into clothes dryer were first calculated by Braun et al.[Citation12] using simple performance equations and thermodynamic relations. Further research in the field of heat pump tumble dryers was focused on effects of using CO2 as a refrigerant,[Citation13,Citation14] studying of system performance and costs of the components,[Citation15] and investigating influence of the compressor cylinder volume and the total condenser heat transfer dryer performance.[Citation16] Most recent studies include modeling of a heat pump dryer by considering transient conditions of both air and refrigerant side and geometrical variation of the heat exchangers.[Citation17] Modeling of a heat pump dryer by regression analysis was done by Gatarić et al.[Citation18] where energy consumption and drying time was related to operating parameters including fan speed, drum speed, and mass load. Some studies also presented concepts that could outperform the state-of-the-art heat pump technology. A hybrid clothes dryer, consisting of a recuperative heat exchanger, an electric element and a vapor-compression heat pump was investigated by TeGrotenhuis et al.[Citation19] Junior et al.[Citation20] and Patel et al.[Citation21] introduced a thermoelectric heat pump dryer without using a harmful refrigerant as an alternative to substitute the compression heat pump. Most recently, Gluesenkamp et al.[Citation22] analyzed performance of several evaporative clothes drying technologies. They quantified relationship among drying efficiency, drying rate, and ambient conditions and provided a comparison between efficiency limits and state-of-the-art device performance.
In recent years, there has been an increasing number of research studies that analyzed fabric motion in the rotating drum and related it to different characteristics of the tumble-drying process. Since distribution of fabric items in the drum and their interaction with the drying air has a decisive influence on homogeneity of transfer processes in the drum, these studies are of great importance when considering the evenness of drying. Wei et al.[Citation23] analyzed fabric motion in a venting dryer using a high-speed camera and determined its impact on the performance under various conditions including the type of textile material, drying load, fabric size, and drum rotating speed. Similar approach using a high-speed detection system for tracking a single fabric as it was tumbled amongst other fabrics of the same type and size was recently reported by Yu et al.[Citation24,Citation25] They defined two main fabric motion regions, the bulk region and the disperse region. Increasing the size of the disperse region, where fabrics are projected into the air by the drum, enhances the fabric mixing motions, which increases the contact area between the fabric and the surrounding air and contributes positively to the mass and heat transfer, and to the prevention of wrinkling.[Citation24] Furthermore, they evaluated 10 different fabrics for characterizing fabric dynamics during the drying cycle. Based on the observation of motion trajectory, velocity profile and residence time distribution, the fabric motion was divided into four categories including sliding, sliding with falling, rotating with falling and rotating.[Citation25] In contrast, Novak et al.[Citation26] observed and statistically evaluated motion and distribution of the entire drying load composed of different fabric items. They used a high-speed camera to determine the relation between the fabric motion and the drying performance parameters. The regression models were developed for prediction of the condensate mass flow rate as a function of the load mass, drum speed, and drying stage. It was determined that improved moisture transfer rates from the fabric to the drying air can be associated with homogenous fabric distribution and reduced local fabric accumulation and formation of areas with no fabric in the drum. Wrinkling behavior of woven cotton fabrics was investigated by Yu et al.[Citation27] Results showed that fabric characteristics such as thickness, density and weight have a negligible impact on the fabric smoothness appearance.
The evenness of drying has at present not been widely addressed in open literature. Gluesenkamp[Citation28] reported an evaluation of the remaining moisture content for individual cloths (RMCi) that was measured at the end of drying in a vented tumble dryer. Though not aimed at detailed analysis of parameters affecting the evenness of drying, the study demonstrated that the RMCi distribution for a 3.83 kg load depended on the types of cloths in the load. A more detailed study of evenness of drying was conducted by Yu et al.[Citation29] in a commercial air vented tumble dryer with a rated capacity of 10 kg. The drying experiment was performed at different drum motor speeds (800, 1000 and 1200 rpm), air velocities (4.8, 7.8 and 10.8 m/s) and constant heater power 3000 W. Three cotton loads of 1, 3 and 5 kg according to the GB/T 8629[Citation30] were used. The size and weight of each fabric item in the load was 92 × 92 cm ± 2 cm and approximately 130 g, respectively. The initial moisture content of clothes for each drying test was 70% ± 5%. The duration of each drying test was controlled manually, and the drying test was stopped when the load mass reached the conditioned dry weight, or if a change in the mass was less than ± 10 g within approximately 10 minutes. By performing regression analysis, the authors determined that the most influential parameters that affected the evenness of drying were the drum motor speed and the load mass. The authors concluded that drying at a medium drum motor speed resulted in smaller evenness of drying compared to a low- and high-speed level. Load mass showed both positive and negative effects on the evenness of drying when drum motor speed was set at a low- and high-speed, respectively. It was concluded that the interaction between the drum motor speed and the load mass had a significant impact on the fabric mixing motions, which affect the contact between the drying air and fabrics and thus the evenness of drying. In statistical terms, the most influential factors affecting evenness of drying were determined to be the square of the drum motor speed and the product of the drum motor speed and the load mass.
The aim of this paper is to determine relations between the evenness of drying and the relevant operating parameters in a household heat pump tumble dryer. As evident from the literature review, the key operating parameters that affect fabric motion and consequently the evenness of drying include drum speed and load mass, therefore these two parameters were varied for the tests. In contrast to previous studies, test loads of 2, 4 and 6 kg were composed of different cotton fabric items according to the IEC 61121[Citation31] in order to obtain drying loads that are representative of the actual household drying loads. The initial (60% ± 1%) and final moisture content of clothes (12% ± 2%) met the IEC 61121[Citation31] requirements for assessing the evenness of drying. The evenness of drying was defined as the standard deviation of the fraction of water, evaporated from each fabric item. Such definition differs from the definition according to the IEC 61121,[Citation31] where evenness of drying is determined as the standard deviation of the final moisture content of each fabric item, independent from the initial moisture content. Statistical evaluation of results indicated that properties and number of various item types in the load could be an important factor affecting the evenness of drying, similar to the drum speed and load mass. The findings of this study can help engineers to determine conditions for improving the evenness of drying and consequently the energy efficiency and the drying time of the tumble-drying process.
Materials and methods
Experimental setup
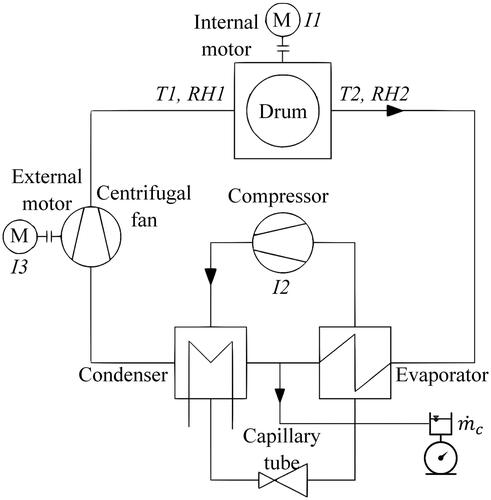
The experimental setup was built using a household heat pump tumble dryer with 8 kg rated capacity, which contains a drum of 570 mm diameter and 465 mm length, fitted with two lifters. A cross section of the drum with main dimensions is given in . The tumble dryer was equipped with an additional brushless DC electric motor of the same type as in the existing appliance to drive centrifugal fan and drum separately. In this way, the pressure and flow characteristics of the closed-air circuit remained the same as in the existing appliance. The fan rotating speed was held constant during the experiment at 2900 rpm. The heat pump with a capillary tube was powered by a single-phase induction motor of the compressor, therefore its operating conditions could not be controlled or maintained constant during the drying cycle. More detail about the heat pump dryer used for the study is given in.[Citation26] The setup employed sensors for electric power and mass measurement as presented schematically in . The electrical currents of compressor (I1), internal (I2) and external electric motor (I3) were measured using current clamps PNA-CLAMP-5 (Dewetron, Austria), with an input range from 0,04 A to 6 A and accuracy of ± 0,5%. The electrical power was calculated by a software power module, which provides power measurement and analysis. Integration of electrical power was used to determine the energy consumption. A scale FCB 30K1 (Kern, Germany), with a resolution of 1 g and accuracy of ± 3 g was used for weighing fabrics after conditioning and before and after each drying test. Drum rotating speed settings were checked with a contact tachometer DT-2268 (Lutron, Taiwan), with a resolution of 1 rpm and accuracy of ± 0,05%.
Figure 1. Simplified drum cross section with main dimensions in millimeters.
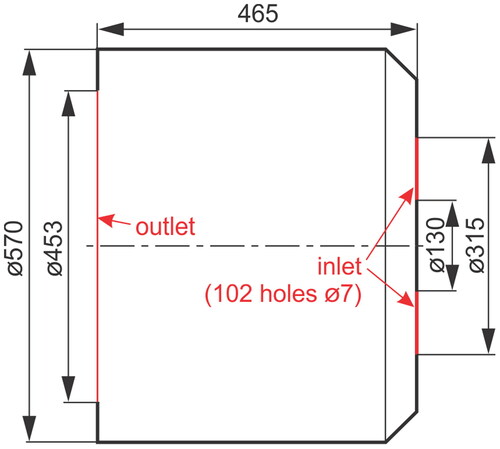
Figure 2. Schematic of the heat pump tumble dryer with locations of sensors.
Experimental procedure
The drying experiment was carried out in an ambient controlled room according to the IEC 61121[Citation31] procedure for measuring the performance of household tumble dryers. Three different test loads of long staple pure cotton[Citation32] were used: 2, 4 and 6 kg. Each test load was composed of a certain number of sheets, pillowcases and towels. presents information on each fabric item, such as mass per unit area, length, width and weight, while shows composition of each test load.
Table 1. Fabric characteristics.
Table 2. Test load composition.
In order to assess the evenness of drying, the standardized cotton iron dry program was selected for all test runs, where final moisture content is allowed at 12% ± 4% relative to the conditioned test load mass.[Citation31] Conditioning of loads was carried out at a constant temperature of 20 °C ± 2 °C and relative humidity of 65% ± 5%. In this method, load fabrics are first dried in a tumble dryer to a final moisture of each single item −3%. Then fabrics are stretched or flattened by hand and placed in ambient controlled room to reach the equilibrium moisture content. Fabrics are left in a room until their mass have changed by less than 0,5% for two successive measurements, which are carried out at intervals of at least 2 hours.[Citation31] Each individual fabric of each test load was marked (S-sheet, P-pillowcase and T-towel) and numbered. The weight of each fabric was measured and recorded after conditioning and before and after each drying test.
When assessing the evenness of drying for the cotton iron dry program, it is important to ensure that the final moisture content is in a smaller range than is defined for the energy efficiency testing. In general, the drier the load, the better the evenness of drying. Independent tests have shown that the relationship between the evenness of drying and the final moisture content differs between tumble dryers, therefore it is not possible to define a single correction formula for correcting the evenness of drying according to the final moisture content. To enable measuring of evenness of drying and its comparison in a reproducible way, it is necessary to reduce the tolerance of the final moisture content of 12% from ± 4% to ± 2%. In this case, comparable results are ensured.[Citation31]
The test loads were wetted in a washing machine to a moisture content of 60% ± 1%[Citation31] and inserted into the drum piece by piece according to the tumble dryer manufacturer’s internal proprietary procedure, which aims at providing a homogenous distribution of different fabric items over the entire drum volume. The drying cycle ended automatically when fabrics reached the target moisture content, detected by a humidity sensor in the drum. If the initial or final moisture content of each test run exceeded the required range, the test run was considered not valid and was repeated.
The total energy consumption E (Wh) and drying time t (min) were corrected for the actual measured initial and final moisture content of the fabrics and calculated as:
(1)
(1)
(2)
(2)
where Em (Wh) and tm (min) are measured energy consumption and drying time, μi0 is the nominal initial moisture content, μf0 is the target final moisture content, Wi (kg) is the mass of the fabrics after wetting, Wf (kg) is the mass of the fabrics after drying and c (kg) is the load mass.[Citation31] The corrected energy consumption and drying time were divided by load mass to define the energy efficiency (Wh/kg) and the specific drying time (min/kg).
The evenness of drying was evaluated as shown below using the measurements from valid test runs. The fraction of evaporated water from each individual fabric was defined as a ratio between the evaporated and added water mass:
(3)
(3)
where Wik is the mass of the fabric item k after wetting, Wfk is the mass of the fabric item k after drying and W0k is the mass of the fabric item k after conditioning.[Citation31] The average fraction of evaporated water from all fabrics in the test load Xav was calculated as:
(4)
(4)
where N is the total number of items in the test load. The evenness of drying sX was defined as the standard deviation of Xk and was calculated as:
(5)
(5)
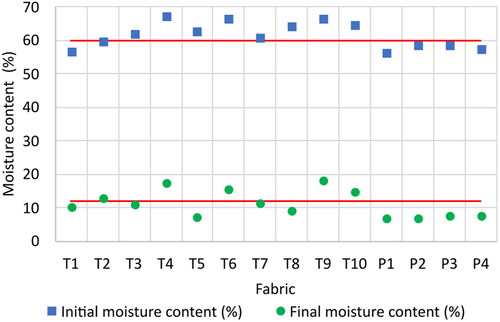
Such definition of evenness of drying is different from the definition according to the IEC 61121,[Citation31] where evenness of drying is determined as the standard deviation of the final moisture content of each fabric item. The purpose for using a modified definition for the evenness of drying is a significant variation in the initial moisture content of the individual fabrics around the nominal value of 60% as shown in for a selected test run. Similar variations in the initial moisture content were measured for most test runs, despite efforts to achieve a uniform initial wetting of fabrics in the washing machine. Study[Citation24] has shown that the initial moisture content has a negligible influence on the fabric motion inside the drum, however, it affects the duration of the constant rate drying stage.[Citation2] The higher the initial moisture content of particular fabrics, the longer will be the evaporation of the water from these fabrics, which increases the drying time and energy consumption of the drying process.[Citation2] Considering the close relationship between the energy efficiency and the evenness of drying (will be demonstrated within results of this study), it was decided that the initial moisture of each individual fabric is important also when assessing the evenness of drying. Thus, the modified definition of the evenness of drying was employed.
Figure 3. Variability of initial and final moisture content of each fabric item in the test run at 2 kg load and 58 rpm drum speed (T – towels, P – pillowcases, horizontal red line – nominal moisture contents for complete load).
To estimate how much each item type contributes to variability of evaporated water, or the evenness of drying, the mean absolute deviation (MAD) was calculated. The mean absolute deviation, or the average distance from mean, serves as a measure of dispersion or variability of a sample around its mean.
(6)
(6)
where Ni is the number of items of the selected type (towels, pillowcases or sheets) within the test load.
Regression analysis
Both independent variables (load mass and drum speed) were considered at three levels: low, intermediate and high, as shown in . A full factorial design was selected for the experiment which means that all possible combinations of levels for all independent variables were measured. A total number of 32 = 9 operating points were therefore defined according to , where each operating point was measured twice in order to ensure repeatability of results.
Table 3. Measured operating points.
The regression analysis was used to model the relationship between various response and independent variables. The linear regression laws were developed on a purely statistical basis with the drying process treated as a black box. At first, models were developed to relate the evenness of drying (sX) to drum speed n (rpm). Here, simple polynomial regression was used to fit either linear or quadratic curves to measured points, separately for each load mass c (kg). The quadratic model is in this case defined as:
(7)
(7)
where y is a response variable, β’s are unknown regression coefficients and ε is a statistical error, which represents the difference between the measured and the exact value of y. The regression coefficients were estimated using the method of least squares, which minimizes the sum of squared errors.
Further regression analysis was used to relate the evenness of drying to both drum speed and load mass. The developed model that included data for all operating points was determined to be too complex, mainly due to the nonlinearity of response with respect to load mass. Considering results from this and previous research[Citation26] it was decided to model data for 2 kg load separately from other loads (4 and 6 kg). Such treatment is based on the analysis of drying performance parameters (), which clearly indicates quadratic relations at 2 kg load and linear relations at higher loads, as well as analysis of measured evenness of drying (), as explained in section Results. The stepwise regression method[Citation33] was employed to fit linear models to measured data at 4 and 6 kg loads. The algorithm starts from the initial model and then adds or removes predictors from the model by evaluating a chosen statistical criterion. In this case, the criterion was based on the p-value for the F-test[Citation33] of the change in the sum of squared error that results from adding or removing the term. The threshold p-value for inclusion and removal of the term was set at 0.05 and 0.1, respectively. The obtained linear models include two independent variables (n, c) that always appear in linear and interaction terms. EquationEquation (8)(8)
(8) represents the model for the evenness of drying at 4 and 6 kg loads. The model for 2 kg load was determined separately as a simple quadratic function (EquationEquation (7)
(7)
(7) ).
(8)
(8)
Figure 4. (a) Energy efficiency and (b) specific drying time as a function of drum speed and load mass.
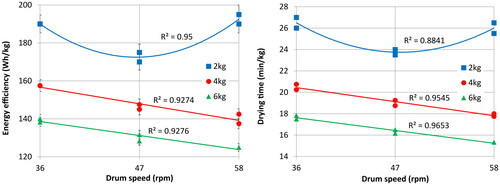
Figure 5. Measured evenness of drying with models, specific to each load mass.
Results
Energy efficiency and specific drying time
The presented drying experiments initially served for a study of relations between the tumble dryer operating conditions (drum speed, load mass) and its performance in terms of energy efficiency and specific drying time. Some of the results of this study, which was in detail reported in a previous paper,[Citation26] are crucial for interpretation of the results related to the evenness of drying and are therefore briefly repeated in the present paper. presents the energy efficiency and specific drying time for the entire range of tested conditions. Markers represent the measured values while curves are regression models determined for each load mass separately. It is evident that the relationship between the drying performance parameters and the drum speed is linear at 4 and 6 kg load while at 2 kg load it is quadratic. The possible grouping of performance curves for larger load masses (4 kg and 6 kg) or, in other words, different performance curves at the lowest load mass (2 kg), turned out to be relevant also for the analysis of the evenness of drying.
Evenness of drying
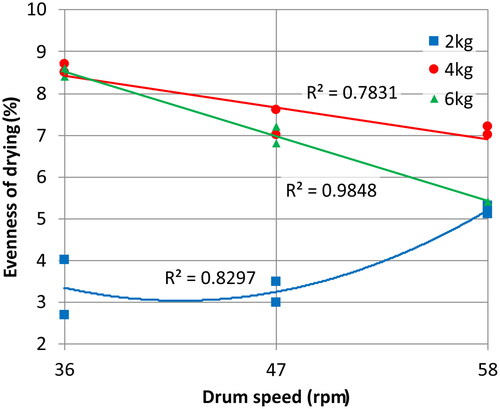
Evenness of drying sX as a function of drum speed is presented in . Markers represent the measured values and curves the regression models for each load mass. At 6 kg load an excellent fit to data was provided by a linear function, whereas at 2 kg load the model had to include the quadratic term to achieve a reasonably high R2 value, as indicated next to the curve. At 4 kg load the data is represented by a linear function, although the quadratic function provided a better fit (R2 = 0.9234). The linear representation is in the case of 4 kg load justified by choosing simplicity over complexity and has no major implications for further analysis of data. It has to be noted though, that the linear representation of evenness of drying at 4 kg load is in agreement with the dryer energy efficiency and specific drying time (), where linear trends were established for both 4 and 6 kg load.
Similarity between the 4 and the 6 kg load is evident also in the case of evenness of drying () – it improves with increasing drum speed. The difference between the 4 and the 6 kg load is in fact very small at lower drum speeds but becomes significant at drum speeds of 47 rpm and above. In contrast, at 2 kg load the best evenness of drying is achieved between 36 and 47 rpm and worsens as drum speed is increased. Irrespective of drum speed, the best results were always obtained at 2 kg load. For larger loads, it was possible to achieve better evenness of drying at 6 kg load than at 4 kg load, most notably at 58 rpm drum speed. Possible reasons for the nonlinear relation between the load mass and the evenness of drying are discussed later.
Models
The presented diagrams for the tumble dryer energy efficiency and specific drying time () indicate two groups of relationships relative to drum speed. At 2 kg load the curves are quadratic whereas at larger loads (4 and 6 kg) they are linear. Similar observation can be made with respect to the evenness of drying (), where trends at 4 and 6 kg load show some agreement while the trend at 2 kg load is distinctive. Furthermore, the effect of load mass is not linear – the evenness of drying both increases and decreases as load mass is increased at given drum speed. For example, at 47 rpm drum speed, the evenness of drying responds positively to an increase of load mass from 2 to 4 kg and negatively to a further increase from 4 to 6 kg load. According to these observations and in line with the already determined relations from previous research[Citation26] it was decided to develop common models for evenness of drying at 4 and 6 kg load mass and to treat the 2 kg load mass separately.
The models were developed according to the procedure, outlined in section Regression analysis. At 4 and 6 kg load, the model for evenness of drying is given by EquationEquation (9)(9)
(9) .
(9)
(9)
At 2 kg load, the model for evenness of drying is given as a quadratic function of drum speed:
(10)
(10)
presents plots of EquationEquations (9)(9)
(9) and Equation(10)
(10)
(10) (curves) and the measured evenness of drying (markers). The curve for 2 kg load is not altered compared to the already presented curve in , since the 2 kg model remains a separate model for the given load mass. Accordingly, the R2 value is also identical, that is 0.8297. At larger load masses, the displayed model (EquationEquation (9)
(9)
(9) ) is characterized by new curves, where the R2 value was calculated to be 0.9280. The lack of quadratic terms in EquationEquation (9)
(9)
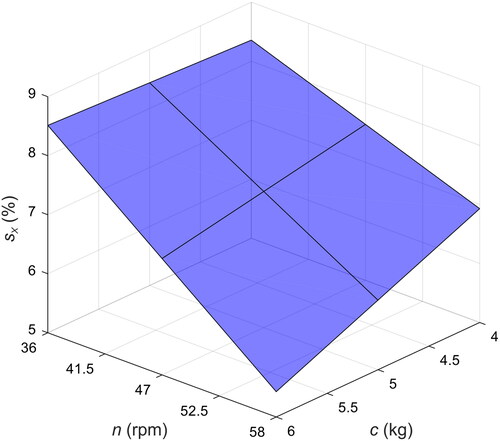
(9) is clearly reflected in linear representation of the model in . The same relations are visible in , which also presents the modeled evenness of drying at larger loads, but in form of a surface that covers the complete range of modeled load masses and drum speeds.
Figure 6. Measured and modeled evenness of drying.
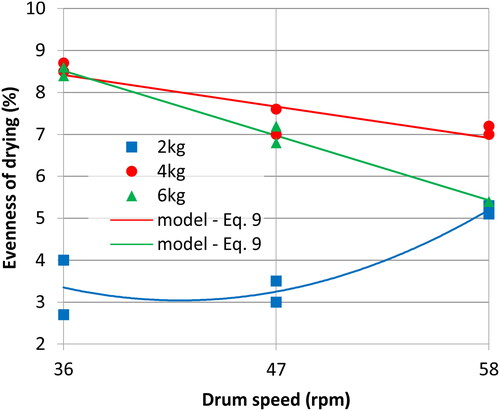
Figure 7. Modeled evenness of drying.
Effect of load composition
As explained in more detail in section Experimental procedure, each test load was composed according to standard[Citation31] by including various counts or towels, pillowcases and sheets. Each item type has specific physical characteristics () that affect fabric motion patterns in the drum and transfer of heat and moisture between the fabrics and the drying air. It is therefore expected that the drying process and the evenness of drying is affected also by load composition and fabric characteristics. To investigate these effects, the data on evenness of drying was analyzed separately for each item type. Distributions of deviation of evaporated water share (Xk – Xav) were plotted for all operating conditions in form of histograms (). Each operating condition is represented by values computed from the corresponding two valid test runs. By presenting deviation (Xk – Xav) instead of absolute values (Xk) it is possible to easily compare various tests with different average evaporated water share (Xav). The deviation value of zero presents the Xav, while negative and positive deviation values present items with less and more evaporated water than average, respectively. The histograms in all have a common bin size of 2.5% and are color coded according to item type (see legend).
Figure 8. Histograms of deviation of evaporated water share for all operating conditions.
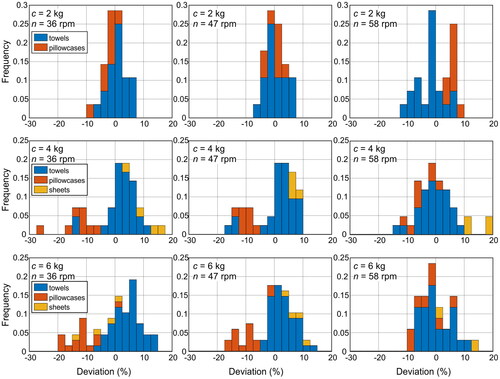
Dispersion of distributions shown in is directly related to the evenness of drying and reflects data that was already presented in and . Relatively small dispersion of data at 2 kg load and 36 and 47 rpm drum speed was associated with the best evenness of drying (sX = 3.4 at 36 rpm and sX = 3.3 at 47 rpm) while highest dispersion of data, seen at 36 rpm at both 4 and 6 kg load, translates to the worst evenness of drying (sX = 8.6 at 4 kg and sX = 8.5 at 6 kg). The histograms however reveal additional information when analyzed with respect to different item types. It is evident that towels are most centrally located while pillowcases and sheets are often seen at higher deviations from the mean and therefore contribute more to the un-evenness of drying of the complete load. Pillowcases tend to be located at negative deviation values, especially at smaller drum speeds (36 and 47 rpm) and higher load masses (4 and 6 kg), where they form a separate peak. At 58 rpm the separation between towels and pillowcases is reduced and remains evident only in case of 2 kg load. On the other side, sheets are always located at positive deviations (except at 6 kg load and 36 rpm drum speed), which means that a higher percent of water was evaporated from sheets compared to other item types. This is most obvious in case of 4 kg load, where sheets tend to form a group at high positive deviations.
The deviation in evaporated water was further evaluated by calculating the mean absolute deviation (MADi) for each item type within a given load (EquationEquation (6)(6)
(6) ). This further data reduction enables analysis of mean dispersion magnitude (irrespective of sign), similar as in case of computing the evenness of drying (EquationEquation (5)
(5)
(5) ). Results, presented in , indicate similar relationships to those in . Smallest variation between item types is evident in case of 2 kg load, which consisted of only towels and pillowcases, while larger variations are present in case of larger loads that included sheets. At both 4 and 6 kg load the lowest MADi was always obtained for towels, while characteristically higher MADi values were obtained for pillowcases and/or sheets. At 36 and 47 rpm drum speed the highest MADi values correspond to pillowcases while at 58 rpm to sheets. Here, the difference between towels and pillowcases becomes relatively small. Another general observation, applicable to both 4 and 6 kg load, is that the MADi for pillowcases is decreasing monotonously with drum speed. Effect of drum speed on both towels and sheets is on the other hand not represented by any consistent trends.
Figure 9. Mean absolute deviation of evaporated water share for different item types.
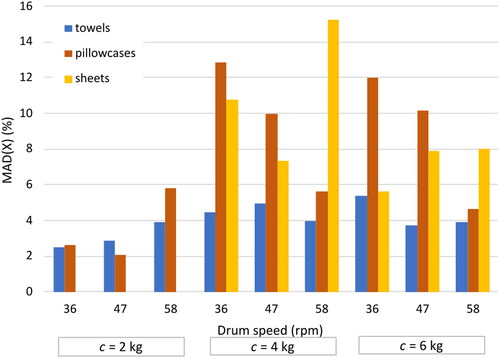
The main purpose of is to present water evaporation differences between item types within a selected operating condition. For example, at 6 kg load and 36 rpm drum speed, deviation of water evaporation from pillowcases was on average twice as high than from towels and sheets. Such comparison of averaged items can show relative differences between them, but does not present their entire contribution to the evenness of drying of the complete load. The actual contribution of each item type to total dispersion also depends on the share of particular items within the total item count (Ni/N, ).
Discussion
The tumble dryer performance parameters (energy efficiency and specific drying time) and the quality of drying, expressed as the evenness of drying, are essentially a reflection of fabric motion and heat and mass transfer processes that take place primarily in the drum, but also in other elements of the dryer. Evenness of drying and energy efficiency are therefore expected to respond in a similar way when operating parameters (drum speed and load mass) are varied. The presented measurements in fact indicate similar trends between energy characteristics and evenness of drying, but with important differences that depend on load mass.
At 2 kg load, the energy efficiency, the specific drying time and the evenness of drying are all presented by parabolas that have an optimal value close to the intermediate drum speed of 47 rpm. This could be explained by coincidence of highest energy efficiency and augmented mixing of fabrics, which results in an increased effective contact between the fabrics and the drying air and thus improved evenness of drying. At 4 and especially 6 kg load, similarity between the energy efficiency and the evenness of drying remains in relation to drum speed – both energy efficiency and evenness of drying improve as the drum speed is increased. Some similarity is also maintained when comparing 4 and 6 kg load – better results are obtained for both energy efficiency and evenness of drying at 6 kg load. However, when data for all load masses is considered, it is evident that the evenness of drying is best at 2 kg, followed by 6 kg load and 4 kg load. Such trend is especially noticeable if drum speed is selected at optimal value (considering the investigated range of drum speeds) for individual load mass. In this respect, the similarity between evenness of drying and energy efficiency (or specific drying time), where higher load mass always resulted in better performance, is lost. The reason for this behavior can be related to specifics in fabric motion and distribution in the drum, which influence the evenness of drying and the energy efficiency in a different way. The fabric motion and its effect on energy efficiency was analyzed in more detail in previous research;[Citation26] here some findings are repeated and further related to the evenness of drying. As shown in,[Citation26] fabrics on average occupied a smaller portion of the drum volume when drying 2 kg load, compared to larger loads. Consequently, void in the drum was especially evident when drying low load masses. The void represents an open path for the drying air to flow through the drum, thus reduces interaction of drying air and fabrics and negatively impacts energy efficiency of the process. However, the abundance of air relative to the mass of fabrics and probably improved mixing of fabrics could have a positive impact on the evenness of drying, which was in fact determined to be best at 2 kg load. At higher load masses, especially as the fabrics get dryer and stiffer, the filling of drum volume with fabrics is much higher, which forces most of the drying air to a closer interaction with fabrics. Accordingly, the energy efficiency of the drying process is improved. On the other hand, mixing of fabrics (relocation of each fabric item across the drum volume) could be impeded by the higher concentration of fabrics in the drum, which results in reduced evenness of drying. In fact, the evenness of drying was determined to deteriorate as the load mass was increased past 2 kg. This complex interplay of various effects of fabric distribution and motion could be seen as an explanation for positive correlation between the load mass and the energy efficiency and negative correlation between the load mass and the evenness of drying. However, the actual response of the evenness of drying to load mass was not always negative – it improved as the load mass was increased from 4 to 6 kg. To explain this phenomenon, the composition of load (types and counts of different fabric items in the load) has to be considered, as discussed below.
The most significant difference between the composition of 2 kg load and larger loads is the presence of sheets (). Such composition was not selected arbitrarily but is defined by the standard[Citation31] that was followed for the measurements. This in fact turned out as a constraint and therefore allowed only basic analysis of load composition related effects on evenness of drying. Nevertheless, the results clearly indicate that at larger loads, evaporated water share from pillowcases and sheets tends to deviate more from the mean than towels. In other words, a sheet or a pillowcase in average tends to contribute more to the un-evenness of drying than a towel (see ). A possible explanation is that the presence of sheets (by far the largest item type) has a negative impact on mixing of items in the drum and consequently causes less even contact between fabrics and air. This could explain why the worst evenness of drying was measured at 4 kg load, namely, this load has the highest proportion of sheets in total load.
As shown in previous research,[Citation26] the fabric kinematics is a function of load mass and drum speed, and there are several indications that it is also a function of fabric properties, such as size, weight and thickness.[Citation23,Citation25] Drum size could also be taken as an independent variable when analyzing fabric motion and drying process. Drum scaling effects have not yet been systematically measured and analyzed in open literature; however, they were approached indirectly through dimensional analysis. Studies[Citation7,Citation29] have shown that drum dimensions (radius, volume) are relevant in many non-dimensional groups that can be used to model the tumble dryer energy efficiency. Furthermore, drum radius together with drum speed defines the centrifugal force acting on fabrics, which is one of key factors that affects the fabric motion patterns.[Citation23] It is therefore expected that the drum size, or the ratio of drum size to other parameters (load mass, drum speed, fabric size, etc.), is an important variable also in relation to evenness of drying. These effects were not examined in the present work, therefore further generalization of results to different types and sizes of tumble dryers has to be approached with caution. Nevertheless, irrespective of the tumble dryer type and size, the main factor contributing to improved evenness of drying remains to be good mixing of fabrics and an even contact with drying air. Therefore, further understanding of fabric motion mechanisms, also in relation to properties and counts of items that constitute a load, should contribute to development of optimized operating regimes that result in improved quality of clothes drying.
Conclusions
The study demonstrated influence of load mass, drum speed and load composition on evenness of fabric drying in a household tumble dryer. Regression analysis was employed to develop models that relate evenness of drying to load mass and drum speed. Similarities were determined between the energy efficiency, the specific drying time and the evenness of drying, which was attributed to similar response of these parameters to the effects of fabric motion and distribution in the drum. However, when interpreting the complete data in relation to load mass, the mentioned similarity was lost – energy efficiency was clearly improving with load mass, while evenness of drying was best at 2 kg load, followed by 6 kg and 4 kg load. These trends were explained by effects of fabric distribution and motion in the drum as well as effects of different load composition (proportion of towels, pillowcases and sheets in the complete load) at each load mass. There are indications that the presence of sheets and probably the ratio of sheets to other item types in the load are negatively affecting the evenness of drying.
Acknowledgments
The authors acknowledge the financial support from the Slovenian Research Agency (research core Funding No. P2-0401). The article is in part the result of work in the implementation of the Operation entitled SPS – IQDOM, co-financed by the Republic of Slovenia and the European Union under the European Regional Development Fund (OP20.00376).
Disclosure of interest statement
The authors report no conflicts of interest. The authors alone are responsible for the content and writing of the paper.
Additional information
Funding
References
- Maya-Drysdale, L.; Iversen, N. H.; Gydesen, A.; Skov Hansen, P. M. Review Study on Household Tumble Driers – Final Report; European Union, Brussels, 2019.
- Bassily, A. M.; Colver, G. M. Performance Analysis of an Electric Clothes Dryer. Drying Technol. 2003, 21, 499–524. DOI: https://doi.org/10.1081/DRT-120018459.
- Bassily, A. M.; Colver, G. M. Correlation of the Area-Mass Transfer Coefficient inside the Drum of a Clothes Dryer. Drying Technol. 2003, 21, 919–944. DOI: https://doi.org/10.1081/DRT-120021692.
- Yadav, V.; Moon, C. G. Fabric-Drying Process in Domestic Dryers. Appl. Energy 2008, 85, 143–158. DOI: https://doi.org/10.1016/j.apenergy.2007.06.007.
- Wei, Y.; Gong, R. H.; Ning, L.; Ding, X. Enhancing the Energy Efficiency of Domestic Dryer by Drying Process Optimization. Drying Technol. 2018, 36, 790–803. DOI: https://doi.org/10.1080/07373937.2017.1356329.
- Novak, L.; Gatarić, P.; Širok, B. Influence of Drum Inlet Air Conditions on Drying Process in a Domestic Tumble Dryer. Drying Technol. 2019, 37, 781–792. DOI: https://doi.org/10.1080/07373937.2018.1461111.
- Gluesenkamp, K. R.; Boudreaux, P.; Patel, V. K.; Goodman, D.; Shen, B. An Efficient Correlation for Heat and Mass Transfer Effectiveness in Tumble-Type Clothes Dryer Drums. Energy 2019, 172, 1225–1242. DOI: https://doi.org/10.1016/j.energy.2019.01.146.
- Stawreberg, L.; Nilsson, L. Modelling of Specific Moisture Extraction Rate and Leakage Ratio in a Condensing Tumble Dryer. Appl. Therm. Eng. 2010, 30, 2173–2179. DOI: https://doi.org/10.1016/j.applthermaleng.2010.05.030.
- Stawreberg, L.; Berghel, J.; Renstrom, J. Energy Losses by Air Leakage in Condensing Tumble Dryers. Appl. Therm. Eng. 2012, 37, 373–379. DOI: https://doi.org/10.1016/j.applthermaleng.2011.11.051.
- Bansal, P.; Mohabir, A.; Miller, W. A Novel Method to Determine Air Leakage in Heat Pump Clothes Dryers. Energy 2016, 96, 1–7. DOI: https://doi.org/10.1016/j.energy.2015.12.051.
- Boudreaux, P.; Gluesenkamp, K. R.; Patel, V. K.; Shen, B. Measurement and Analysis of Clothes Dryer Air Leakage. Drying Technol. 2020, in press. DOI: https://doi.org/10.1080/07373937.2020.1753765.
- Braun, J. E.; Bansal, P. K.; Groll, E. A. Energy Efficiency Analysis of Air Cycle Heat Pump Dryers. Int. J. Refrig. 2002, 25, 954–965. DOI: https://doi.org/10.1016/S0140-7007(01)00097-4.
- Mancini, F.; Minetto, S.; Fornasieri, E. Thermodynamic Analysis and Experimental Investigation of a CO2 Household Heat Pump Dryer. Int. J. Refrig. 2011, 34, 851–858. DOI: https://doi.org/10.1016/j.ijrefrig.2010.12.012.
- Erdem, S.; Heperkan, H. Numerical Investigation of the Effect of Using CO2 as the Refrigerant in a Heat Pump Tumble Dryer System. Drying Technol. 2014, 32, 1923–1930. DOI: https://doi.org/10.1080/07373937.2014.924524.
- Ganjehsarabi, H.; Dincer, I.; Gungor, A. Exergoeconomic Analysis of a Heat Pump Tumbler Dryer. Drying Technol. 2014, 32, 352–360. DOI: https://doi.org/10.1080/07373937.2013.829853.
- Bengtsson, P.; Berghel, J.; Renström, R. Performance Study of a Closed-Type Heat Pump Tumble Dryer Using a Simulation Model and an Experimental Set-Up. Drying Technol. 2014, 32, 891–901. DOI: https://doi.org/10.1080/07373937.2013.875035.
- Lee, B.-H.; Sian, R. A.; Wang, C.-C. A Rationally Based Model Applicable for Heat Pump Tumble Dryer. Dry. Technol. 2019, 37, 691–706. DOI: https://doi.org/10.1080/07373937.2018.1454940.
- Gatarić, P.; Širok, B.; Hočevar, M.; Novak, L. Modeling of Heat Pump Tumble Dryer Energy Consumption and Drying Time. Dry. Technol. 2019, 37, 1396–1404. DOI: https://doi.org/10.1080/07373937.2018.1502778.
- TeGrotenhuis, W.; Butterfield, A.; Caldwell, D.; Crook, A.; Winkelman, A. Modeling and Design of a High Efficiency Hybrid Heat Pump Clothes Dryer. Appl. Therm. Eng. 2017, 124, 170–177. DOI: https://doi.org/10.1016/j.applthermaleng.2017.05.048.
- Junior, C.; Chen, G.; Koehler, J. Modeling of a New Recuperative Thermoelectric Cycle for a Tumble Dryer. Int. J. Heat Mass Transf. 2012, 55, 1536–1543. DOI: https://doi.org/10.1016/j.ijheatmasstransfer.2011.11.008.
- Patel, V. K.; Gluesenkamp, K. R.; Goodman, D.; Gehl, A. Experimental Evaluation and Thermodynamic System Modeling of Thermoelectric Heat Pump Clothes Dryer. Appl. Energy 2018, 217, 221–232. DOI: https://doi.org/10.1016/j.apenergy.2018.02.055.
- Gluesenkamp, K. R.; Patel, V. K.; Momen, A. M. Efficiency Limits of Evaporative Fabric Drying Methods. Drying Technol. 2020, 39, 104–124. doi:https://doi.org/10.1080/07373937.2020.1839486.
- Wei, Y.; Su, Z.; Zhang, Y.; Li, P.; Yuan, H. The Effect of Fabric Movement on Drying Performance of the Domestic Drum Dryer. J. Text. Inst. 2019, 110, 1059–1071. DOI: https://doi.org/10.1080/00405000.2018.1537104.
- Yu, X.; Ding, X. The Transverse Motion of Fabrics in Domestic Tumble Dryers under Different Drying Conditions. Dry. Technol. in press. 2020, 39, 35-51. DOI: https://doi.org/10.1080/07373937.2019.1693398.
- Yu, X.; Cao, W.; Ding, X. The Effects of Fabric’s Mechanical Properties on Its Motion and Drying Performance in a Domestic Tumble Dryer. Drying Technol. 2021, 39, 528–547. doi:https://doi.org/10.1080/07373937.2020.1711523.
- Novak, L.; Širok, B.; Hočevar, M.; Gatarić, P. Influence of Load Mass and Drum Speed on Fabric Motion and Performance of a Heat Pump Tumble Dryer. Drying Technol. 2021, 39, 950–964. doi:https://doi.org/10.1080/07373937.2020.1734608.
- Yu, X.; Wei, C.; Wei, Y.; Ding, X. Wrinkling Mechanism of Woven Cotton Fabrics during Domestic Tumble Drying. Drying Technol. 2018, 36, 1098–1106. DOI: https://doi.org/10.1080/07373937.2017.1382504.
- Gluesenkamp, K. R. Residential Clothes Dryer Performance under Timed and Automatic Cycle Termination Test Procedures; Oak Ridge National Laboratory: Oak Ridge, TN, 2014.
- Yu, X.; Li, Y.; Ding, X. Relationship between Drying Parameters and Drying Performance in Domestic Tumble Dryers. Text. Res. J. 2020, 90, 2674–2689. DOI: https://doi.org/10.1177/0040517520925559.
- GB/T 8629:2001. Textiles – Domestic Washing and Drying Procedures for Textile Testing; AQSIQ, Beijing, China, 2001.
- IEC 61121. Tumble Dryers for Household Use - Methods for Measuring the Performance; IEC, Geneva, Switzerland, 2013.
- IEC 60456. Clothes Washing Machines for Household Use - Methods for Measuring the Performance; IEC, Geneva, Switzerland, 2010.
- MATLAB 2019a and Statistics and Machine Learning Toolbox 11.5; The MathWorks, Inc.: Natick, MA, 2019.