
 ?Mathematical formulae have been encoded as MathML and are displayed in this HTML version using MathJax in order to improve their display. Uncheck the box to turn MathJax off. This feature requires Javascript. Click on a formula to zoom.
Abstract
Solid-state properties of dried protein formulations are important for stability and functionality of the product. This study investigates how different drying technologies (freeze-drying with and without annealing, spray drying and spray-freeze drying) affect the structure and solid-state properties of a set of matrix formulations composed of trehalose (glass former) and mannitol (scaffolding agent) in five ratios. The dried materials were characterized using differential scanning calorimetry, thermogravimetric analysis, x-ray diffraction and scanning electron microscopy. The morphology of the dried matrix is determined by the drying technology and the composition. In all mixtures, mannitol partially dissolved in the amorphous trehalose, resulting in reduced glass transition temperature. At least 50% mannitol is required to achieve a scaffolding effect through crystallized mannitol. At 25% mannitol poor structural stability is obtained regardless of drying technology. Despite the vast differences in drying kinetics, all drying technologies resulted in similar amorphous content in the dried material.
Introduction
The structure of a solid protein formulation is affected by the drying technology and the presence of crystalline or non-crystalline excipients. Amorphous components act as a protective matrix by preventing detrimental reactions due to exposure to humidity and oxygen.[Citation1] Further, interactions between the protein and the excipient molecules in close proximity of the protein contribute to stabilizing the protein structure e.g., through hydrogen bonds.[Citation2]
Disaccharides such as sucrose and trehalose are commonly employed as amorphous matrix formers in the solid formulations. Trehalose is often preferred due to its high glass transition temperature (Tg) (100–115 °C) compared to sucrose (60–70 °C), providing a more stable glassy matrix. Trehalose also shows increased resistance toward acid hydrolysis, which may create reducing sugars.[Citation2,Citation3]
Bulking agents such as sugar alcohols (e.g., mannitol) may also crystallize during manufacturing, still acting as structuring components, although not delivering the same stabilizing effects for proteins or other biologics as an amorphous carbohydrate matrix could provide. Mannitol is commonly used as a scaffolding agent that acts by crystallizing within the amorphous matrix, thereby providing resistance toward macroscopic collapse during drying. Mannitol appears in at least four known crystalline solid forms exist, namely anhydrous α-, β-, and δ-mannitol and mannitol hemihydrate.[Citation4,Citation5] β-Mannitol is the most stable polymorph at ambient temperature. Previous studies have shown that the crystalline form of mannitol in the final dried material can be affected by drying technique, processing conditions and presence of other materials.[Citation6–8] For example, in freeze-drying under different processing conditions results in formation of various solid state forms of mannitol.[Citation7] Different spray drying conditions may also result in mixtures of mannitol polymorphs.[Citation6] Polymorphic mixtures of mannitol can result in heterogeneous structural and material properties which are disadvantageous for product stability and quality.[Citation9] Mannitol hemihydrate (MHH) is often obtained as a consequence of drying at a low temperature process, typically from freeze drying.[Citation7,Citation8,Citation10] MHH is stable below −20 °C,[Citation11] although the decomposition kinetics is slow at ambient temperature and to fully eliminate the MHH during the secondary drying temperatures of at least 50 °C may be required.[Citation12] Thus, MHH tends to slowly transform into more stable polymorph during storage, releasing crystal water and compromising the stability of the final material.[Citation13]
Different drying processes allow for different temperature and time trajectories which influence the crystallization of water as well as any crystallization of the matrix components. Freeze-drying is widely used for manufacture of dry protein formulations. By freezing and subsequent drying through sublimation a solid formulation with very low water content is obtained. Annealing involves increasing the target freezing temperature above the glass transition of the freeze-concentrate (Tg’), but below the melting point of the freeze concentrate to allow softening of the freeze concentrate, but keeping the majority of the water as ice. The aim of this procedure is to promote ice crystal growth, which is expected to provide a more porous cake, thereby faster drying. Spray-freeze drying utilizes atomization of dissolved material in a very cold medium, instantly generating frozen droplets. These frozen droplets are placed in a pre-cooled freeze dryer for drying under conventional freeze-drying conditions, thus the kinetics in the freezing process is different to freeze-drying. The structure of the material is small particles with high porosity. In spray drying the dissolved material is sprayed into hot air to generate droplets that very rapidly dry into particles by rapid evaporation. The spray dried particles are typically much denser than spray-freeze dried particles.
Abdul-Fattah et al., investigated and systematically described the effects of freeze-drying, annealing freeze-drying, foam drying and spray drying on protein formulations with a sucrose-based matrix. Increasing levels of sucrose preserved the protein structure and prevented surface accumulation of protein.[Citation14,Citation15] The different drying technologies have been studied extensively in separate studies, but systematic studies with a focus on side-by-side comparison of different drying technologies’ effects on matrix properties in relation to its composition lack in the literature.
The objective of this study is to investigate the effect of freeze-drying, annealing freeze-drying, spray-freeze drying and spray drying on the solid placebo matrix. It is hypothesized that the structure and solid-state properties of the matrix components are influenced by the drying kinetics and the thermal trajectory associated with each technique. The model matrix system was chosen as mixtures of trehalose and mannitol. Trehalose having a strong tendency to remain amorphous while mannitol tends to crystallize after drying. The principle of using mannitol as scaffolding agent is well proven for freeze-drying (within a certain ratio range) and here we explore if a similar scaffolding effect can be achieved for spray-freeze drying and spray drying.
The material properties in focus were morphology and the presence of crystalline phases in the solid-state. Thermal Gravimetric Analysis (TGA), Differential Scanning Calorimetry (DSC) and Powder X-Ray Diffraction (PXRD) were utilized to determine residual moisture content, glass transition temperatures and any differences in crystal structures, as well as potential diversity in mannitol polymorphism. Furthermore, Scanning Electron Microscopy (SEM) was used to image morphological variations and to compare characteristics of each dehydration mechanism on each trehalose-mannitol series.
Materials and methods
Materials
The excipients used in the dried mixtures were Mannitol (Microbiology grade. Merck, KGaA, Germany) and trehalose (Ph. Eur. Merck, KGaA, Germany).
Methods
Preparation of solutions
Trehalose and mannitol were prepared in five mixtures with the total solid content kept at 10% (wt/wt). Solutions was prepared in trehalose/mannitol (TRE/MAN) ratios 100/0, 75/25, 50/50, 25/75, 0/100 (wt/wt, dry weight), using deionized water as solvent for all systems.
Freeze-drying
Solutions were freeze-dried using an Epsilon 2-4 LSCplus (Martin Christ GmbH, Germany). Freeze drying was carried out in clear tubing glass vials of 6 mL volume and 22 mm inner diameter (Schott, Germany) filled in with 2 mL Solution. Solutions were first frozen by placing the filled vials on shelves at 20 °C and decreasing the temperature to −45 °C at a rate of 0.54 °C/min and holding at −45 °C for 4 h. The primary drying was performed by decreasing the chamber pressure to 10 Pa followed by raising the shelf temperature to −10 °C, at a rate of 0.5 °C/min, and holding for 16 h. The secondary drying was initiated by lowering the chamber pressure to 0.5 Pa and then heating the shelf temperature at a rate of 0.25 °C/min to 20 °C and holding for 6 h.
After freeze drying the vials were manually filled with nitrogen gas, enclosed in the freeze dryer using freeze drying stoppers of bromobutyl rubber (Fluoro Tec, West, USA), crimped with an aluminum seal and placed in a −20 °C freezer for later use.
Annealing freeze-drying
Filled vials were placed on the freeze-drying shelf and cooled from 20 °C to −45 °C at a rate 0.54 °C/min and held at −45 °C for 2 h. The annealing step was introduced by raising the temperature to −10 °C (above Tg’ for all series, see supplementary information), at a rate of 0.92 °C/min and holding for 2 h. Shelf temperature was decreased again to −45 °C, at a rate of 0.92 °C/min and held at this temperature for 4 h prior to primary drying. Conditions for primary drying and secondary drying were the same as under “Freeze drying.”
Spray-freeze drying
Freeze granulation was performed using a PowderPro freeze granulator (Powderpro, Sweden) and a Harvard apparatus PHD 2000 syringe pump (Holliston, Massachusetts, USA). 20 mL of dissolved material was withdrawn using a 20 ml syringe. A two-fluid nozzle (nozzle orifice 1 mm) was used to produce the sprayed material. Sprayed material was atomized into a beaker pre-filled with 500–600 mL of liquid nitrogen (N2(l)) (−196 °C) and agitated using a magnetic stirrer. Nitrogen gas was used as atomizing gas. The liquid feed rate and nozzle pressure were set at 10 mL/min and 0.5 bar over pressure respectively. After spray-freezing the formed granules were collected by slowly pouring off the N2(l) in a glass jar, covered with one Precision Wipe from Kimtech Science (Kimberly Clarck, Dallas, USA) and a rubber band. The glass jar with the frozen granules was submerged in ice and N2(l) and stored in a −86 °C freezer while the other samples were prepared.
Drying of the spray-freeze granules were completed by placing the frozen material on a pre-cooled shelf at −45 °C by using an Epsilon 2-4 LSCplus (Martin Christ Gmbh, Germany). The drying of the frozen granules was subjected to the same freeze-drying parameters as described in the freeze-drying section.
Spray-drying
A laboratory spray dryer built at RISE (Research Institutes of Sweden) was used to spray-dry the solutions. The dryer operates in a co-current mode with a jacketed two-fluid nozzle operating with pressurized air. The dimensions of the drying chamber are 0.75 × 0.15 m. The nozzle orifice diameter is 1.5 mm. The feed rate used was 7.5 mL/min. The inlet temperature of the drying air was 150 °C, and the outlet temperature was kept at 80 °C by adjusting the airflow (between 0.80 and 0.85 m3/min). The powder was collected in a cyclone, and only the powder collected from the receiving vessel below the cyclone was used for further analyses. After drying, the powder was stored at −20 °C for later analyses.
Scanning electron microscopy
Small amounts of spray-dried and spray-freeze dried powders were placed on a double-sided carbon tape adhered on an aluminum holder. Freeze dried cakes were also evaluated by carefully cutting out a piece of interest and placing it on a double-side carbon tape adhered on an aluminum holder. All samples were analyzed using a FEI-XL 30 series scanning electron microscope. The samples were placed in the chamber and the images were taken at low-vacuum mode with a Large Field Detector (LFD) at an accelerated voltage of 5 kV under 60 Pa pressure.
The SEM images shown in this study are representative from a set of 20–40 images collected at magnifications 100x, 500x and 1000x from at least two different spots on the sample.
Powder X-ray diffraction
Powder from each binary mixture and drying technique was used and smeared to cover the center piece of Zero Background Holders (ZBH:s), mounted in stainless steel holders and placed in the diffractometer. No baseline correction was needed for this type of holders. A PANalytical X’Pert PRO diffractometer, equipped with a Copper (Cu), long fine focus X-ray tube (CuKα; λ = 1.5418 Å) and a PIXcel detector. Automatic divergence and anti-scatter slits were used together with 0.02 rad soller slits and a Ni-filter. The scan length was approximately 17 min, measurements were performed at room temperature (approximately 22 °C). To increase the randomness samples were spun during the analysis. The samples were analyzed between 2 and 40° in 2θ using 255 detector channels. All measurements were later evaluated using the XPert HighScore software.
Differential scanning calorimetry
Differential scanning calorimetry was conducted with a Mettler Toledo DSC 1 STARe system. Calibration checks were performed prior measurements with indium and zinc as reference materials. The reference material checks (Tm and ΔH) were within acceptable limits. Samples were evaluated with a material weight of range 1–5 mg. The materials were weighed in an aluminum pan sealed with lid and an empty aluminum sealed pan was used as a reference. Two different programs were used depending on the nature of the sample. Tg’ was determined from liquid solutions by cooling from 20 °C to −80 °C with a cooling rate of 10 °C/min. The final temperature was held at −80 °C for 2 min before raising the temperature to 30 °C with a heating rate of 20 °C/min. Tg for powder samples were evaluated by holding the material for 1 min at 20 °C before heating to 90 °C with a heating rate of 10 °C/min, followed by cooling to 20 °C at 10 °C/min. The sample was then heated up to 130 °C with a heating rate of 10 °C/min. The first segment was used to assess material properties, whilst the cooling and second heating were used to gain further insight in the material behavior. An additional program was added to measure the melting enthalpy ™ of mannitol. Tm for powder samples were evaluated by holding the material for 1 min at 20 °C before heating to 220 °C with a heating rate of 10 °C/min. All the measurements were performed under a nitrogen gas flow of 50 mL/min and evaluated in duplicates.
Crystallinity of mannitol
The degree of crystallinity of mannitol was characterized using the melting enthalpy of mannitol in the sample and normalize it to the mass fraction of mannitol:
(1)
(1)
is the melting enthalpy of the sample,
is the melting enthalpy of crystalline mannitol and
is the mass fraction of mannitol in each mixture, respectively.
Thermal gravimetric analysis
A Mettler Toledo thermogravimetric analyzer, TGA2, was used to perform the thermogravimetric measurements. The calibration of the instrument was conducted by using isotherm, nickel and trafoperm with a magnet placed on the sample to detect the temperature at which their magnetic properties change upon heating. Amounts between 1 and 5 mg of powder material was placed and weighed in a sample crucible. Before measurements crucibles were cleansed in a high temperature oven for 1 hour at 900 °C, ramp rate 4 °C/s up to 900 °C—all crucibles during the cleaning program were exposed to air. For sample evaluation the temperature was held at 25 °C for 1 min then increased to 250 °C with a heating rate of 10 °C/min followed by isotherm at 250 °C for 1 min. A nitrogen gas flow of 50 mL/min was set during the measurement. Each sample was measured in duplicates.
Results
Trehalose/mannitol mixtures in five different rations were dried using the drying technologies described in the introduction, and the dried materials were characterized for morphology, mannitol polymorphism, residual moisture, glass transition and crystallinity. All binary mixtures were successfully dried and later analyzed. The only exception was spray dried trehalose/mannitol ratio 75/25 (wt/wt), which resulted in no powder collected from the collection vessel, but inside the spray dryer a sticky layer of material was observed especially in the drying chamber and cyclone parts.
The effects of drying technology on the morphology of dried formulations
The structure and morphology of the materials and powders prepared using the different drying technologies were investigated using SEM. Representative SEM images are shown for freeze-dried, annealed freeze-dried, spray freeze-dried and spray dried samples in . Moreover, from , and summarizes and, when possible, quantifies important morphological features detected for all dried samples and mixtures.
Figure 1. SEM images of freeze-dried trehalose/mannitol series (100/0—a and b; 75/25—c and d; 50/50—e and f; 25/75—g and h; 0/100—i and j) depicting cake surface morphology (a), c), e), g), i)) as well as inner structure (b), d), f), h), j)). SEM pictures taken from the middle part of the cake pieces. The scale bars correspond to 100 µm.
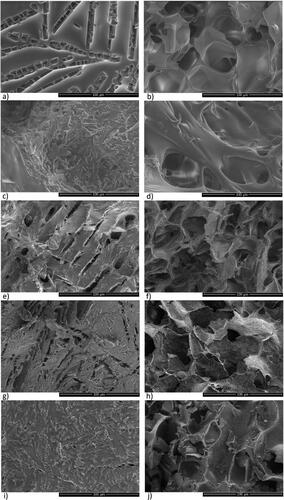
Figure 2. SEM images of annealing freeze-dried trehalose/mannitol series (100/0—a and b; 75/25—c and d; 50/50—e and f; 25/75—g and h; 0/100—i and j) depicting cake topography (a, c, e, g, i)) as well as inner structure (b, d, f, h, j)—SEM pictures taken from the middle part of the cake pieces. The scale bars correspond to 100 µm.
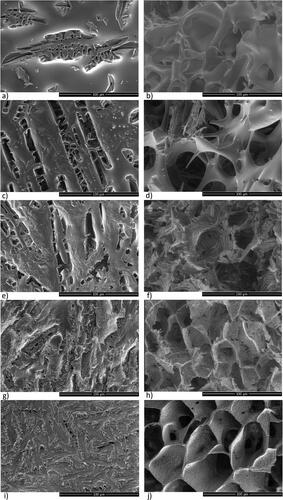
Figure 3. SEM images of spray-freeze dried trehalose/mannitol series (100/0—a; 75/25—b; 50/50—c; 25/75—d; 0/100—e) illustrating powder surface characteristics. The scale bars correspond to 100 µm.
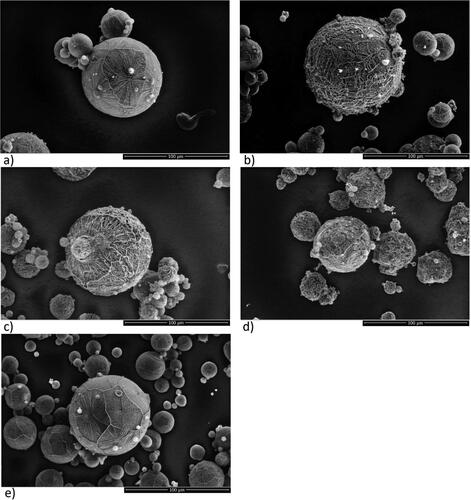
Figure 4. SEM images of spray dried trehalose/mannitol series (100/0—a; 75/25—b; 50/50—c; 25/75—d; 0/100—e) illustrating powder surface characteristics. The scale bars correspond to 50 µm.
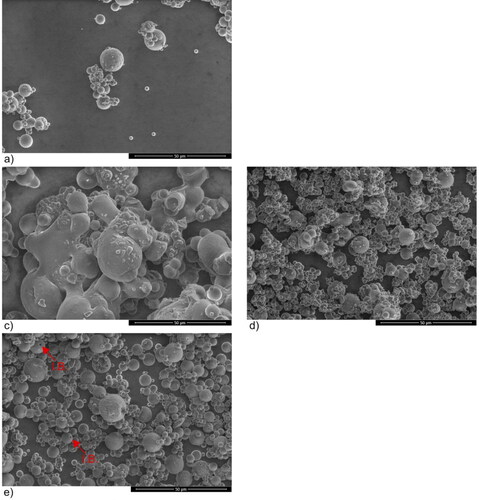
Table 1. Particle morphology summary of freeze-dried and annealing freeze-dried trehalose/mannitol series.
Table 2. Particle morphology summary of spray-freeze dried and spray dried trehalose/mannitol series.
Freeze-dried samples
Freeze-dried samples appear as a porous cake with, a more or less, pronounced upper dense surface layer, here described as crust. The freeze-dried samples were cut into sections traversing the full height of freeze-dried cake whereupon one such section was analyzed from above (“upper crust”) and in the center (“inner structure”).
Upper crust morphology
A common surface characteristic on all the cakes (freeze dried and freeze dried with annealing) was a continuous crust with rectangular, or elongated, or rounded pores occupying between 10 to 70% of the surface. The porosity was created by rupture of the top layer by ice sublimation—with a pore size ranging from 2 to 250 µm. Samples 75/25 showed a completely different surface structure, where the pores were rounded and up to 1000 µm in diameter.
Neat, freeze-dried trehalose ( and supplementary information ) demonstrates an upper crust of continuous structure with pores typically elongated and rectangularly shaped with smooth corners, of size 100–200 µm. Voids interconnected by each other are visible through the pore openings. By adding mannitol, the upper crust of 75/25 presented few longer linear ridges on a continuous structure, . The pores appear softened, enlarged and very few, therefore, challenging to capture and estimate pore size at higher magnification. The upper crust of 50/50 showed a continuous structure with a secondary structure of ridged appearance (), whilst 25/75 exhibited less frequent continuous structure in favor of straight and curled ridges (). Besides short, elongated pores 50/50 and 25/75 ( and g and ), of size 25–200 and 10–200 µm, respectively. The pores are segmented. The coverage of the pores is reduced to about 10% at 50/50, 25/75, and 0/100.
Inner structure and surface morphology
Images of the freeze-dried pores in cross-sections of middle section of the cake are shown in and . Regular, rounded pores that are slightly tilted upward indicate the flow direction of solvent sublimation and subsequent pore solidification. The pores are surrounded by thin walls.
For neat, freeze-dried trehalose the pores are smooth, oval shaped and of size 50–70 µm. Clear walls are observed with an approximate thickness of 1–6 µm. The surface morphology presents a continuous overall structure. Binary mixture 75/25 demonstrated pores of wide size range, lack of symmetry, and somewhat branched network of size 500–5000 µm (see supporting information ). Strings attached to a branch display bent tips as well as few linear ridges of various size (). By adding more mannitol, pore structure and symmetry resume for 50/50 with pore size 40–60 µm. 50/50 also show tightly packed parallel, longer ridges of wave-like character, with wall thickness of size 1–2 µm (). 25/75 shows pores with a size of 50–70 µm and walls of 1–4 µm. The wall structure is more irregular on the flaky surface—where 50/50 displayed tightly packed ridges, 25/75 presents non-parallel shorter rides of flower-like appearance and the walls replaced with sharp edges (). Moreover, 0/100 demonstrated oval shaped pores with a size of 40–60 µm and walls of 1–2 µm. The pore surface presents much irregularity seen as non-parallel very short ridges of grain-like structure.
Annealing freeze-drying
The solution was annealed in the frozen state prior to primary drying to investigate the impact on mannitol crystallization in the dried cakes. The addition of an annealing step, compared to conventional freeze-drying, displayed differences in terms of upper crust morphology for all compositions, except for neat mannitol where both the upper crust and inner surface structure were similar. Moreover, the inner structure morphology of the dried cakes demonstrated no obvious difference for trehalose/mannitol series compared to the samples dried without an annealing step.
Upper crust and inner structure surface morphology
Neat, annealed freeze-dried trehalose demonstrated a continuous solid surface () with elongated segmented pores with length size 50–250 µm. In the binary mixtures, for 75/25 and 50/50 () the surfaces display elongated, segmented pores of 50–200 µm on an overall smooth surface. Beneath the pore surface, heterogeneous distribution of cavities, 50–250 µm, was observed in a poorly developed cell structure. For 75/25, , instead of walls thread-like structures were observed. Moreover, observations of these short needlelike structures are seen for all binary mixtures (), escalating with increased addition of mannitol. The crust of 25/75, , displays a large fraction, 70%, of pores, 50–200 µm. The crust surface is disturbed by short needles. The internal structure displayed a more regular cell structure with cavities of 25–50 µm and walls with a non-oriented flower-like pattern of ridges. The crust of the 0/100 sample has about 20% of segmented surface pores, 50–150 µm. The internal cell structure is very regular, of 40–60 µm. The walls appear granular, and 1–6 µm thick
Spray-freeze dried powder
Representative SEM images of the spray-freeze dried samples are presented in (and supplementary information Figure S3). The images show individual, spherical, highly porous particles, with a wide size distribution in the range of 1–100 µm. The particles demonstrated no crust, thus the surface is highly porous (>50%). Pore length/width, ridge length and thickness were evaluated for particles > 60 µm. The pores are small, about 1–2 µm, rectangular or almost quadratic. The walls are thin, 0.1–1 µm. Typically ridges of different shape can be seen well distributed for all series. Straight ridges of size 15–30 µm surrounding an area with pores are observed in the neat trehalose and the neat mannitol system (). Moreover, the regions of pores are surrounded by raised, thicker, somewhat curved ridges. The trehalose/mannitol ratio has an impact on the particle morphology. The binary mixtures are characterized by curved ridges, of size 5–20 µm (). 75/25, 50/50 and 25/75 have an overall larger pore-heterogeneity were smaller and bigger pores are in conjunction of each particle. Parts of the pores are blocked.
Spray dried powder
Typically, the spray dried powders showed spherical particles fully covered by a smooth crust. Particle size, percentage particles with a single dent and an inward implosion burst, respectively, were evaluated for particles > 6 µm. The particle size is in a size range of 2–15 µm, except for 50/50 where individual particles are fused together to form larger agglomerates in size range 10–1000 µm (). No powder was obtained for 75/25 due to losses in the dryer. 25/75 and neat mannitol exhibited spherical particles, frequently with a single dent (0.1%–1.5% of particles), sometimes with an inwards implosion burst (“I.B.,” depicted in ) (1%–2% of particles). The crust displayed weak, somewhat needle like, ridges ().
Crystallinity and polymorphism of dried formulations
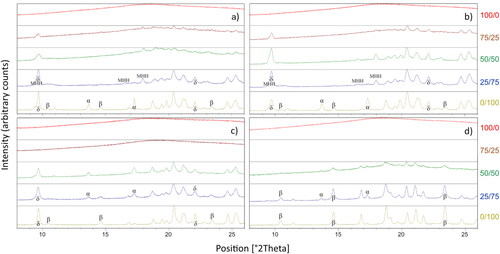
X-ray diffraction was used for dried powders to distinguish between the amorphous and crystalline states. Regardless of drying technique a sharp scattering decay with a weak halo (2θ between 12 and 25°) pattern and absence of any sharp peaks was observed from the X-ray diffractograms of neat trehalose, characteristic for an amorphous material. A similar scattering pattern was observed for spray-freeze dried trehalose/mannitol 75/25 (wt/wt). For all other binary mixtures and neat mannitol dried with different techniques sharp peaks of various intensity were discovered. The mannitol polymorphs, α-polymorph, β-polymorph, δ-polymorph, and mannitol hemihydrate (MHH) are distinguished using their respective characteristic peaks.[Citation6,Citation13,Citation16–18] The intensity of the peaks can be intuitively related to the amount of a specific polymorph present in the sample even though this could be partially misleading, since the peak intensity is also determined by the crystal size, orientation of the crystals and the amount of sample.
Freeze-dried and annealing freeze-dried
Annealing freeze-dried displayed similar diffractogram pattern as the freeze-dried materials. Peaks can be observed for freeze dried and annealing freeze-dried () mixtures (75/25–25/75). Besides peaks the diffractogram displays an otherwise halo pattern. As the mannitol fraction in the mixtures increase the peaks clarifies and becomes sharper whilst the halo pattern decreases. This indicates presence of both amorphous and crystalline states in the binary mixtures. The polymorphism of mannitol in all binary mixtures were identified as a mixture consisting of characteristic peaks corresponding to MHH (9.6, 16.5 and 17.9°2θ) and δ-mannitol (9.7 and 22.1°2θ), whilst neat freeze-dried and annealing freeze-dried mannitol was observed with sharp peaks identified as δ- and α-polymorph with less intense peaks identified as the β-polymorph and absence of MHH (no peaks visible at 16.5 and 17.9°2θ).
Figure 5. XRPD diffractograms of freeze-dried (a), annealing freeze-dried (b), spray-freeze dried (c) and spray dried (d) for trehalose/mannitol mixtures 100/0 (red), 75/25 (brown), 50/50 (green), 25/75 (blue) and 0/100 (olive). Spray dried trehalose/mannitol 75/25 yielded no powder but is still included in the figure.
Spray-freeze dried
Spray-freeze dried samples 100/0 and 75/25 showed no evidence of peaks in the diffractograms but a pronounced halo, hence these materials were amorphous. δ-mannitol (9.7 and 22.1°2θ) can be seen for all other. Besides δ-mannitol, 50/50 showed presence of α-mannitol (13.6 and 17.2°2θ), whilst 25/75, observed from the X-ray diffractogram, exhibited existence of α- and δ-mannitol together with an additional polymorph. With peaks at 10.5, 14.6 and 23.4°2θ the polymorph was attributable to that of β-mannitol. Neat spray-freeze dried mannitol also demonstrated peaks resembling polymorphs δ- and β-mannitol.
Spray dried
Spray dried binary mixtures (50/50 and 25/75) showed peaks corresponding to α-mannitol (13.6 and 17.2°2θ) and β-mannitol (14.6 and 23.4°2θ) on one hand, whilst 50/50 also showing a halo pattern, indicating presence of amorphous material, on the other. For neat, spray dried mannitol clear peaks distinguished as characteristic for the β-mannitol (10.5, 14.6 and 23.4°2θ) are observed, whilst representative peaks indicating presence of α-mannitol (13.6 and 17.2°2θ) can be seen, however, not as defined compared to trehalose/mannitol mixtures 50/50 and 25/75.
Solid state material properties
The materials were characterized based on residual moisture content, glass transition temperature (Tg), degree of mannitol crystallization (normalized to mannitol content) and mannitol melting point (peak-value). Thermal gravimetric analysis (TGA) was used to evaluate the residual moisture content (RMC) seen as a decrease in mass content in between 70 and 130 °C. The glass transition of the dried formulations was associated as an endothermic enthalpic step, whilst mannitol crystallization (enthalpic heat of fusion) and mannitol melting point were also seen as an endothermic event and were analyzed by DSC. The results from DSC and TGA measurements are presented in . Generally, the RMC values were the greatest for 75/25, whilst neat mannitol regardless of drying method generated very low RMC. The Tg was divided into two classes: the glass transition of the mixture (Tg1) and glass transition of trehalose in the mixture (Tg2). The Tg1 values ranged from 36 to 90 °C, whilst Tg2 demonstrated values in the spectrum of 82–110 °C. Spray dried mixtures only exhibited Tg1 values. The mannitol melting enthalpy values (ΔHm) typically increased with more mannitol in the mixtures. Typically, DSC thermograms of mannitol showed one sharp and narrow peak in the range of 135–167 °C. Some of the thermograms demonstrated two peaks alternatively hinted two peaks, mainly freeze-dried, and annealed freeze-dried 50/50 and 25/75, whilst other showed one broad peak (spray dried and spray-freeze dried 50/50 and 25/75). All trehalose/mannitol mixtures that demonstrated or hinted two peaks also manifested two glass transition events. Moreover, the relative crystallinity of mannitol generally increased with more added mannitol and was calculated by EquationEquation (1)
(1) Equation(1)
(1)
(1) . Melting enthalpy and melting temperature of reference mannitol corresponds well with literature values.[Citation4,Citation19]
Table 4. Summary of solid-state properties for dried TRE/MAN materials.
Tg’ of the frozen systems has also been determined using DSC. The results are shown in and displayed a falling trend from −39 °C for neat trehalose to −54 °C for neat mannitol. Litterature data on Tg’ trehalose-water varies between −40 and −30 °C,[Citation20] whilst litterature values on Tg’ mannitol-water varies between −27 and −35 °C.[Citation12,Citation18] This article presents Tg’-value of mannitol-water system at −54 °C, see supporting information S4.
Discussion
In this paper we investigate and compare four drying methods, their corresponding associated time scales, and temperature ranges on placebo formulations. Five different systems composed of trehalose and mannitol have been dried by freeze-drying, annealing freeze-drying, spray-freeze drying and spray drying. The particle morphology, mannitol polymorphism, residual moisture content and glass transition temperature has been examined and will now be discussed.
Drying technology’s effect on particle morphology
In , the principal drying trajectories of the different drying methods (time, temperature, and water content in the freeze concentrate) are outlined. The initial concentration of water in the solution to be dried is given by the concentration of the sample. The following moisture contents are based on the Tg line in the state diagram of water and trehalose (). The initial freezing temperatures and the initial temperature jump are taken from typical freezing curves. The freeze-drying temperature is taken from the sublimation temperature as long as free ice is remaining. The temperature is assumed to approach the shelf temperature during the secondary drying step.
Figure 6. Conceptual drawings showing the drying trajectories of the different drying methods and the state diagram of trehalose and water. The percentages just over the drying trajectories shows the water content in the original solution, the freeze concentrate (according to the state diagram of trehalose and water, ) and in the dry structure in the beginning of the secondary drying and after the secondary drying (from ).
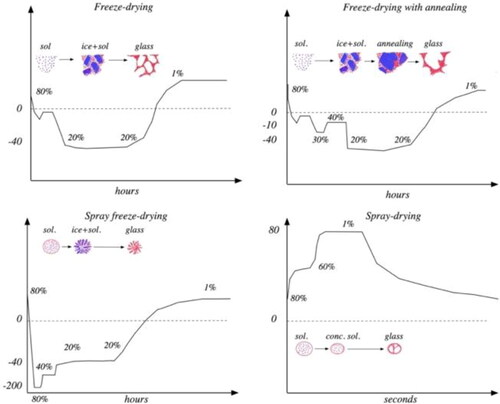
Figure 7. a) The state diagram is redrawn and modified after Chen, using a Tg of trehalose from Drake et al.,.[Citation20,Citation23] b) The estimated Tg curves for trehalose-mannitol systems and water obtained by using EquationEquations (2)
(2) Equation(2)
(2)
(2) and Equation(3)
(3)
(3) using constants from Kim et al.[Citation18] Tg’ is estimated assuming a constant C’ of 0.816.[Citation21]
![Figure 7. a) The state diagram is redrawn and modified after Chen, using a Tg of trehalose from Drake et al.,.[Citation20,Citation23] b) The estimated Tg curves for trehalose-mannitol systems and water obtained by using EquationEquations (2) Tg,s=Tg,1·w1+K1,2·Tg,2·w2w1+K1,2·w2(2) Equation(2)(2) Tg,s=Tg,1·w1+K1,2·Tg,2·w2w1+K1,2·w2(2) and Equation(3)(3) K1,aq=Tg,1·a+b(3) using constants from Kim et al.[Citation18] Tg’ is estimated assuming a constant C’ of 0.816.[Citation21]](/cms/asset/90eaeaf5-6514-49c6-a856-7df967dc9673/ldrt_a_2103564_f0007_b.jpg)
In the freeze-dried system the ice starts to form after a few degrees undercooling. The frozen water-trehalose system is a metastable two-phase system of solid ice in equilibrium with a viscous liquid freeze concentrate surrounding the ice crystals. The temperature is lowered during the drying at 10 Pa to about −42 °C (the dew point at 10 Pa partial water pressure). In the trehalose water system this is below the Tg’ and the freeze concentrate can thus be expected to remain as a stable glassy structure. The drying process is driven by heat reaching the sample by conduction from the shelf as well as by radiation from the surroundings (including the shelf). However, conduction in the ice-rich part of the sample is high, and thus the temperature remains close (up to 5–10 °C higher) to the temperature given by the drying pressure. This continues until the primary drying is over. At that moment all ice crystals have sublimated while the remaining water (about 20%) is in the non-frozen structure (according to the ice-glassy state equilibrium line at −40 °C in the state diagram in ). During the secondary drying the evaporation is slower and the temperature is much closer to the temperature of the shelves. The shelf temperature is also slowly raised to speed up the process. The process is finalized at room temperature with a remaining humidity of about 1%–3% (measured in ). For the trehalose-water system, it can be expected that the conditions during the drying in close to the boundary of the glassy state and the rubber state, allowing the structure to be more or less templated by the ice crystals structure of the frozen system.
In the annealing freeze-drying the system is allowed to ripen at −10 °C, i.e., above the Tg’ but below the melting point, to allow the ice crystals to grow and thereby increase the permeability of the structure during the primary drying.
In the spray-freeze drying the system is quench frozen at −196 °C. This is below the Tg of water (−135 °C[Citation21]), and it can be expected that the system solidifies as a glass. When the temperature is raised to −80 °C the ice crystals will grow (above the Tg of water) and a freeze concentrate with about 40% water will remain (according to the ice-glassy state equilibrium line at −80 °C in the state diagram in ). When the sample is transferred to the freeze dryer the sample temperature will be about −42 °C and the concentrate will remain in a glassy state until the primary drying has been finalized. The secondary drying follows the same trajectory as for the regular freeze-drying.
In the spray drying process the temperature is higher but the time scale much shorter compared to the time scale for freeze-drying. The sprayed droplets meat the hot air (150 °C) and the drying process is very fast, and the particles solidifies, possibly, when still about 60% water remains, forming a particle with a crust surrounding an interior of a single or several vacuoles at a temperature corresponding to the outlet temperature of the spray dryer (80 °C) . The water continues to evaporate, but the crust reduces the evaporation rate due to mass transfer limitations. Finally, a moisture content of typically 2%–4% is reached (). In the trehalose-water system the solid remains amorphous until it reaches the stable glassy state at low humidity.
The Tg line of a saccharide-water system can be described using the Gordon-Taylor equation.[Citation21](2)
(2)
Where, Tg,1 and Tg,2 are the glass transition temperature (in K) of component 1 and 2, w1 and w2 are the mass fraction of component 1 and 2 and K1,2 is a constant defined for the particular system.
The constant, K1,2, in the equation is fitted to the experimental results. Roos has also shown that K1,aq of sugars and sugar alcohols can be predicted from the Tg of the dry material[Citation21] by using:
(3)
(3)
where
is the Gordon Taylor constant for a system where substance 1 is a saccharide or sugar alcohol and substance 2 is water, a is a fitting constant, if Tg is expressed in °C or K it is equal to 0.0293 and b is −4.39 if Tg is expressed in K.
The study is focused on a combination of trehalose and mannitol. Dry trehalose has a high Tg, different measurements range between 100 and 130 °C,[Citation22] here is a Tg of dry trehalose of 117 °C, from Drake et al[Citation23] used as a representative value of the literature. The Tg of dry mannitol is lower, a Tg of 13 °C has been reported.[Citation18]
It has been shown that the addition of mannitol to lactose leads to a reduction of the Tg in a way that agrees well with the Gordon-Taylor equation.[Citation24] Kim has also investigated the binary system of trehalose and mannitol and found that a Gordon-Taylor constant, Kmannitol,trehalose of 5. Applying the Gordon-Taylor equation on mannitol and trehalose allows for a prediction of the Tg of the water-free system of the ratios used in the investigation (). Using EquationEquation (3)
(3) Equation(3)
(3)
(3) the Kmannitol/trehalose,aq constants can be predicted allowing for the estimation of the Tg curves for all investigated mannitol/trehalose systems. The maximum freeze-concentrated solute matrix, Cg’ does not vary much and it can be assumed to be constant (0.816) to allow for the determination of glassy state transition temperature of the glassy state in equilibrium with ice crystals at the maximum of ice formation, Tg’ ().
Table 6. Summarizing mannitol’s function as crystalline and amorphous as well as amorphous fraction of total solids, in each manufactured composition.
The properties of the glassy matrix changes above the Tg curve due to increased molecular mobility, allowing for diffusion and flow. Thus, we may expect that the impact of mannitol on the Tg curve will be reflected in the recrystallisation of mannitol and on the structure of the dried material. However, the amorphous trehalose-mannitol solid solution becomes depleted of mannitol when it crystallizes. Thus, the impact of the mannitol will be slightly less strong compared to what is suggested in . The amorphous fraction of total solids, the fraction of amorphous mannitol in the total amorphous fraction, the estimated humidity counted on the amorphous fraction and the estimated Tg of the amorphous solid using the estimated fraction of mannitol and humidity using the Gordon-Taylor relationship and the estimation of the Tg of the dry matrix are shown in .
It can be observed that the fraction of mannitol in the amorphous material is increasing when the mannitol content in the sample is risen. Thus, the composition of the amorphous solid after drying is kinetically controlled rather than determined by the pseudo equilibrium according to the state diagram. The double Gordon-Tayler model describes a plasticizing effect (as estimated Tg) from both the present mannitol as well as by the residual humidity. The results do not display a perfect agreement with the measured Tg (like sample freeze-dried 50/50 and 75/25, annealing freeze-dried 25/75, spray-freeze dried 50/50, spray dried 50/50), although the trends agree. Partly this is because it is difficult to determine Tg very precisely due to lack of equilibrium in the system below Tg (possible transient concentration gradients) and even a possibility for a phase segregation within the amorphous phase as it has been seen in macromolecular/saccharide mixtures.[Citation25]
The arsenal of techniques offers differences mainly in final product appearance, issued through atomizer systems (spray-freeze dried and spray dried), presenting spherical particles, or non-atomizing systems (freeze-dried and annealing freeze-dried), offering “cake-like” structures.
The non-atomizing systems use solvent dehydration by sublimation. The remaining structure after primary drying is templating the ice-crystals present in the frozen material, as outlined in . The intention of the annealing step is to increase the size of ice crystal and reduce the amount of unfrozen water, and thereby speed up the drying. However, as observed in , there is no clear difference in the structure of the interior of the cake. Both conditions seem to lead to an ice structure dominated by about 50 µm sized more or less spherical crystals. Both methods allow for the formation of a continuous crust, with pores. The pores are expected to reflect surface penetrating ice crystals. The annealing seems to lead to an increased surface penetration of the ice crystals and thereby the formation of a more porous crust. The crust morphology of freeze-dried mixtures transitions from smooth (100/0) to ridged of various size and direction (75/25–25/75) showing the orientation of mannitol crystals parallel to the surfaces.[Citation26] In systems with neat mannitol, the walls appear granular with very small non-oriented crystals.
As shown in and mannitol has a strong plasticizing effect (low Tg) that may lead to destabilization of the structure during the drying. The freeze-dried and annealing freeze-dried 75/25 mixtures display coarse with large cells and the walls dissolved as thicker threads as a consequence of the plasticizing ( and and ). The plasticizing is counteracted by the scaffolding from the crystalline mannitol when the amount of crystalline material is above 30% (50/50). This effect is more pronounced for the annealed samples ( compared to ).
Powders produced by atomizing techniques are either dried through heat, rapidly converting sprayed droplets into particles (spray drying), or by instant quench freezing followed by freeze-drying leaving highly porous, spherical particles (spray-freeze drying).
A notable property of the spray-freeze dried particles is the lack of a crust (). This observation suggests that the structure is a result of crystallization of the water from the center of the particle penetrating the surface. The neat systems display defined raised ridges surrounding areas with smaller pores, while these features are discernible but not as defined for the mixed systems.
Spray dried particles composed of neat trehalose, mixtures of mannitol and trehalose and neat mannitol shows particles with a smooth surface. However, by adding mannitol in the mixtures, manufacturing of powder was either absent (75/25) or agglomerated (50/50). Sou et al., also observed fused trehalose/mannitol particles at 50/50 and suggested increased tendency of hygroscopicity as a plausible explanation.[Citation27] and show that the Tg of these mixtures is low, and in presence of higher moisture, the stickiness of the particles is increased which results in aggregation and loss on the walls of the dryer. The scaffolding effect improves the spray drying ability of the system at 25/75 and for neat mannitol.
Influence of drying technology on mannitol crystallinity and polymorphism
The mannitol polymorphism was affected by two factors, 1) the choice of drying method and 2), the composition of the mixture. Neat mannitol has a low glass transition temperature, and thus crystallizes very rapidly, regardless of freezing rates, and drying temperatures, although the polymorphic composition was affected. shows a summary of obtained polymorphs from each drying technique and trehalose/mannitol mixture. α- and β-mannitol (reported melting point 166 °C and 166.5 °C, respectively) are considered the most stable polymorphs of mannitol, whilst δ-mannitol (noted melting point interval 150–158 °C) is regarded as meta-stable and MHH least stable.[Citation16] Dierks and Korter has analyzed the thermodynamic stability of the crystal forms as a function of the temperature and found that the hemihydrate is stable below −20 °C, δ < 35 °C and β > 35 °C.[Citation11] The analyses also showed that the energy difference between the different polymorphs is quite small and thus the actual structures formed may remain stable for a long time. Previous articles have shown that freezing and drying temperature affects the crystallization pathways of mannitol.[Citation6,Citation28–30]Therefore, it might be considered unsurprising that spray drying showed a domination of β-mannitol, whilst all freeze-dried techniques exhibited δ-mannitol.
Interestingly, most drying techniques dehydrating solvent through sublimation showed a mixture of predominantly δ-mannitol or the hemihydrate.
In comparison, trehalose/mannitol mixtures, as demonstrated from and , showed completely different mannitol polymorphism pattern. For freeze-dried, annealing freeze-dried and spray-freeze dried, mannitol crystallization is consistently affected by the presence of trehalose, and freezing rate with or without an annealing step. Only the freeze-dried series (75/25–25/75) showed existence of MHH, in line with previous reports,[Citation7,Citation8,Citation10] whilst the spray-freeze dried exhibited no MHH. MHH is meta-stable and during storage tends to convert into a more stable anhydrous mannitol polymorph. In doing so release of crystal water, in addition to already present residual water in the freeze-dried cake, can jeopardize the physical stability of the formulation. Once formed, MHH seems quite difficult to eliminate.[Citation7] Fast cooling rates of 20 °C/min or secondary drying temperatures at 50 °C or above could be adopted to avoid formation of MHH.[Citation7,Citation12] As the sprayed droplets subjects within milliseconds to freezing (spray-freeze dried) or evaporative drying (spray dried) this also agrees well that fast freezing and rapid drying generates no hemihydrate in the spray-freeze dried and spray dried powder. For a typical protein formulation, secondary drying temperature at 50 °C might be unpreferable since it challenges the protein stability.[Citation7] In our study, implemented cooling rate (0.54 °C/min) is generally seen as slow and in presence of carbohydrates possibly facilitates crystallization of MHH.[Citation10]
Table 3. PXRD to detect solid states in dried carrier-matrix—mannitol polymorphism (α, β, δ and MHH), trehalose either described as amorphous (A) or crystalline dihydrate (DH).
Effect of drying technology on residual moisture content
The general outcome during any dehydration technique is control of residual moisture, i.e., strive toward low amounts of water content. A particular issue is the formation of the metastable mannitol hemihydrate after freeze-drying, which seems to be present in significant amount in all samples with mixed trehalose and mannitol after freeze-drying and annealing freeze-drying. For all spray-freeze dried trehalose/mannitol series exhibiting crystallization, existence of the troublesome MHH was undetectable.
Each mixtures glass transition temperature and corresponding residual moisture content, , indicate a pattern where Tg and RMC are depressed by an increased mannitol content. Moreover, the data in presents, for the mixtures 75/25–25/75, an acceptable two-phase model whereby crystalline mannitol coexists with amorphous mannitol solubilized in amorphous trehalose. Since x-ray data show no or very weak crystalline signal, for 75/25, most of the mannitol is presumed amorphous and solubilized in amorphous trehalose, supported by data from XRD and SEM the transition from the amorphous state (neat trehalose) to a two-phase model (75/25–25/75) to the crystalline state (neat mannitol) can feasibly explain the Tg behavior. All successfully dried 75/25 mixtures exhibit low Tg but only freeze-dried and annealing freeze-dried show elevated residual moisture contents. All three mixtures are exposed to similar drying processes but differ in particle composition and mannitol polymorphism. The secondary drying’s main function arises by removal of unfrozen solvent mainly through diffusion and desorption. The kinetics behind diffusive removal of solvent depends on time and the distance unfrozen solvent, in the matrix structure, travels before sublimation proceeds. The longer the implemented secondary drying time is, the increased likelihood of a more efficient residual water removal. From the SEM images of freeze-dried and annealing freeze-dried 75/25 ( and , summarized in and ), the inner structure depicts walls dissolved into thicker threads. Amorphous fraction of total solids was plotted against residual moisture content for corresponding dried process and mixture, see , and seem to follow a somewhat linear trend (R2 = 0.7). We hypothesize that as 75/25 lack enough crystallized mannitol and too much amorphous mannitol solubilized in amorphous trehalose, this mixture constructs an unfavorable environment for water diffusion. As the material undergoes secondary drying, to avoid cake collapse, the ramp temperature rate, in this study set at 0.25 °C/min, should preferably not exceed the apparent glass transition. For amorphous materials ramp rate temperatures of 0.1–0.15 °C/min is feasible and generally considered appropriate.[Citation31] A mixture of two-components with Tg-difference might also influence the glassy matrix. Roe and Labuza showed that the Tg-mixture depends on the ratio between freeze-dried sucrose and trehalose.[Citation3] At low trehalose amounts in sucrose the Tg-mixture reflects closer to that of neat, sucrose and vice versa. We also noticed that MHH is present for freeze-dried and annealing freeze-dried, whilst absent for spray-freeze dried. MHH contains some crystal bound water in the crystal lattice, which the other mannitol polymorphs lack. Perhaps a combination of used ramp temperature rate, inadequate amount of manufactured crystalline mannitol and presence of MHH, 75/25 governs a poorly developed carrier-matrix with unbalanced amorphous/crystalline mannitol ratio.
Figure 8. Residual moisture content of freeze dried (squares), annealing freeze-dried (circles) spray-freeze dried (diamond) and spray dried (triangles) of trehalose/mannitol (solid content 75/25—yellow, 50/50—green, 25/75—red, 0/100—gray wt/wt) as a function of fraction amorphous mannitol normalized for mannitol in each mixture. Open symbols indicate presence of MHH whilst closed symbols indicate no presence of MHH in the mannitol crystalline structure.
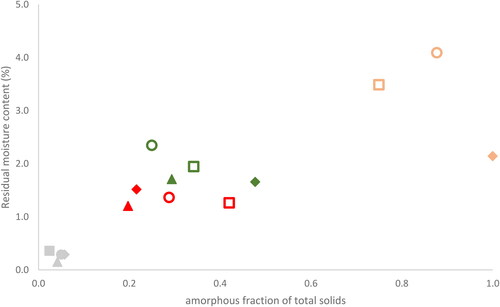
Table 5. Tg’ of frozen water-trehalose/mannitol solutions (10% total solids).
Additionally, some of the mixtures seem to exhibit two glass transition events, one lower and one higher, . Hence, indicating possible heterogeneity in the glass formation during drying. Moreover, only the drying techniques utilizing dehydration through sublimation showed this type of glass transition heterogeneity, i.e., spray dried mixtures demonstrated only one Tg. Drying through sublimation is typically considered time consuming and presented kinetics influence the drying procedure over a very long time. The solution during the freezing stage should be considered homogenous with trehalose and mannitol evenly distributed. During the primary drying a system consisting of frozen solvent and the freeze concentrate co-exist. As the primary drying proceeds, the frozen solvent sublimates increasing the concentration of the freeze concentrate. At this point a plausible explanation for Tg heterogeneity may be due to insufficient equilibrium of the system. The SEM images ( and ) depict some continuous domains and other ridged, perhaps indicating presence of a trehalose-rich phase at the continuous domains (with a Tg reflecting closer to neat trehalose, i.e., Tg2) and another were some of the mannitol turns amorphous and solubilizes into amorphous trehalose (Tg of the mixture, i.e., Tg1). However, this theory needs complementary data for support, as our claims are still in the early exploratory stage.
Conclusions
In this paper, we show how different drying technologies affect the morphology, structural stability and solid-state properties of trehalose/mannitol mixtures in different ratios. We also explore if mannitol can be utilized as a scaffolding agent in other drying technologies aside form freeze-drying. In trehalose/mannitol mixtures, mannitol contents at 25% generally provides no scaffolding tendency and a structurally collapsed material is typically obtained, due to low glass transition temperature of the amorphous mannitol/trehalose mix. At 50% mannitol and above enough mannitol crystallizes to generate a stable material, except for spray-drying where 75% mannitol is required. The scaffolding effect is best established in freeze-drying, where the largest mannitol crystals are obtained. Striking similarities were observed for the extent of mannitol crystallization for all drying technologies at a given trehalose/mannitol ratio. Mannitol in the trehalose/mannitol mixtures partly dissolves in the amorphous trehalose and partly crystallizes, and thus the trehalose/mannitol ratio also determines whether enough mannitol crystallizes to offer proper scaffolding structures. Hence, the trehalose/mannitol composition and drying technique together determine the possibility of sufficient mannitol crystallization or high enough glass transition temperature to provide structural stability to the dried material.
All trehalose/mannitol mixtures dried through a freeze-drying process generate a porous material. Annealing freeze-dried, in particular, but also freeze-dried trehalose/mannitol mixtures demonstrated formation of a crust, while spray-freeze dried materials presented no crust. The internal structure was affected by trehalose/mannitol composition. Trehalose/mannitol at 75/25 depict large cavities and thread-like walls. Consequently, if mannitol is present it needs to crystallize to a sufficient extent to offer proper matrix structure, which is observed for all mixtures at ≥ 50% mannitol. The spray-dried material is structurally fundamentally different, in that dense, small and spherical particles are formed, and the structural stability is primarily dictated by the Tg of the amorphous part of the matrix.
Mannitol polymorphism is affected by process temperature, freezing rate and trehalose/mannitol composition. Freezing at moderate temperatures and low freezing rates (freeze-drying and annealing freeze-drying) in combination with trehalose generated favorable conditions for creating MHH. All trehalose/mannitol mixtures dried through any type of freeze-drying generated δ-mannitol, whilst drying at high temperature presented β-mannitol.
This work provides knowledge on the interplay stabilizers and scaffolders has on the final particle structure and solid-state properties in relation to drying technology. This is necessary for future work, were we plan to include a bioactive protein in the formulation. Therefore, contributions to understand how the amorphous matrix is influenced by the ratio of stabilizer and scaffolding agent and drying conditions are relevant for the quality of the final protein formulation.
Supplemental Material
Download MS Word (3.2 MB)Acknowledgments
The authors wish to thank David Noreland at Research Institutes of Sweden, Södertälje, Sweden, for guidance with sample preparation prior to XRD and method development for the XRD measurements, and Karin Hallstensson at Research Institutes of Sweden, Stockholm, Sweden for guidance using the SEM instrument and sample preparation prior to SEM imaging.
Disclosure statement
No potential competing interest was reported by the authors.
Correction Statement
This article has been republished with minor changes. These changes do not impact the academic content of the article.
Additional information
Funding
References
- Walters, R. H.; Bhatnagar, B.; Tchessalov, S.; Izutsu, K.-I.; Tsumoto, K.; Ohtake, S. Next Generation Drying Technologies for Pharmaceutical Applications. J. Pharm. Sci. 2014, 103, 2673–2695. DOI: 10.1002/jps.23998.
- Carpenter, J. F.; Chang, B. S.; Garzon-Rodriguez, W.; Randolph, T. W. Rational Design of Stable Lyophilized Protein Formulations: Theory and Practice. Pharm. Biotechnol. 2002, 13, 109–133.
- Roe, K. D.; Labuza, T. P. Glass Transition and Crystallization of Amorphous Trehalose-Sucrose Mixtures. Int. J. Food Propert. 2005, 8, 559–574. DOI: 10.1080/10942910500269824.
- Burger, A.; Henck, J.-O.; Hetz, S.; Rollinger, J. M.; Weissnicht, A. A.; Stöttner, H. Energy/Temperature Diagram and Compression Behavior of the Polymorphs of D-Mannitol. J. Pharm. Sci. 2000, 89, 457–468. DOI: 10.1002/(SICI)1520-6017(200004)89:4<457::AID-JPS3>3.0.CO;2-G.
- Nunes, C.; Suryanarayanan, R.; Botez, C. E.; Stephens, P. W. Characterization and Crystal Structure of D-Mannitol Hemihydrate. J. Pharm. Sci. 2004, 93, 2800–2809. DOI: 10.1002/jps.20185.
- Grohganz, H.; Lee, Y.-Y.; Rantanen, J.; Yang, M. The Influence of Lysozyme on Mannitol Polymorphism in Freeze-Dried and Spray-Dried Formulations Depends on the Selection of the Drying Process. Int. J. Pharm. 2013, 447, 224–230. DOI: 10.1016/j.ijpharm.2013.03.003.
- Liao, X.; Krishnamurthy, R.; Suryanarayanan, R. Influence of Processing Conditions on the Physical State of mannitol - Implications in Freeze-Drying. Pharm. Res. 2007, 24, 370–376. DOI: 10.1007/s11095-006-9158-3.
- Liao, X.; Krishnamurthy, R.; Suryanarayanan, R. Influence of the Active Pharmaceutical Ingredient Concentration on the Physical State of Mannitol-Implications in Freeze-Drying. Pharm. Res. 2005, 22, 1978–1985. DOI: 10.1007/s11095-005-7625-x.
- Andrieu, J.; Vessot, S. A Review on Experimental Determination and Optimization of Physical Quality Factors during Pharmaceuticals Freeze-Drying Cycles. Drying Technol. 2018, 36, 129–145. DOI: 10.1080/07373937.2017.1340895.
- Badal Tejedor, M.; Fransson, J.; Millqvist-Fureby, A. Freeze-Dried Cake Structural and Physical Heterogeneity in Relation to Freeze-Drying Cycle Parameters. Int. J. Pharm. 2020, 590, 119891. DOI: 10.1016/j.ijpharm.2020.119891.
- Dierks, T. M.; Korter, T. M. Origins of the Relative Stabilities of Anhydrous and Hydrated D-Mannitol Crystals. J. Phys. Chem. A. 2016, 120, 6629–6636. DOI: 10.1021/acs.jpca.6b05244.
- Cavatur, R. K.; Vemuri, N. M.; Pyne, A.; Chrzan, Z.; Toledo‐Velasquez, D.; Suryanarayanan, R. Crystallization Behavior of Mannitol in Frozen Aqueous Solutions. Pharma. Res. 2002, 19, 894–900. DOI: 10.1023/A:1016177404647.
- Yu, L.; Milton, N.; Groleau, E. G.; Mishra, D. S.; Vansickle, R. E. Existence of a Mannitol Hydrate during Freeze-Drying and Practical Implications. J. Pharm. Sci. 1999, 88, 196–198. DOI: 10.1021/js980323h.
- Abdul-Fattah, A. M.; Truong-Le, V.; Yee, L.; Nguyen, L.; Kalonia, D. S.; Cicerone, M. T.; Pikal, M. J. Drying-Induced Variations in Physico-Chemical Properties of Amorphous Pharmaceuticals and Their Impact on Stability (I): Stability of a Monoclonal Antibody. J. Pharm. Sci. 2007, 96, 1983–2008.
- Abdul-Fattah, A. M.; Truong-Le, V.; Yee, L.; Pan, E.; Ao, Y.; Kalonia, D. S.; Pikal, M. J. Drying-Induced Variations in Physico-Chemical Properties of Amorphous Pharmaceuticals and Their Impact on Stability II: Stability of a Vaccine. Pharm. Res. 2007, 24, 715–727. DOI: 10.1007/s11095-006-9191-2.
- Takada, A.; Nail, S. L.; Yonese, M. Influence of Ethanol on Physical State of Freeze-Dried Mannitol. Pharm. Res. 2009, 26, 1112–1120. DOI: 10.1007/s11095-009-9829-y.
- Larsen, H. M. L.; Trnka, H.; Grohganz, H. Formation of Mannitol Hemihydrate in Freeze-Dried Protein formulations - A Design of Experiment Approach. Int. J. Pharm. 2014, 460, 45–52. DOI: 10.1016/j.ijpharm.2013.11.009.
- Kim, A. I.; Akers, M. J.; Nail, S. L. The Physical State of Mannitol after Freeze-Drying: Effects of Mannitol Concentration, Freezing Rate, and a Noncrystallizing Cosolute. J. Pharm. Sci. 1998, 87, 931–935. DOI: 10.1021/js980001d.
- Bruni, G.; Berbenni, V.; Milanese, C.; Girella, A.; Cofrancesco, P.; Bellazzi, G.; Marini, A. Physico-Chemical Characterization of Anhydrous d-Mannitol. J. Therm. Anal. Calorim. 2009, 95, 871–876. DOI: 10.1007/s10973-008-9384-5.
- Chen, T.; Fowler, A.; Toner, M. Literature Review: Supplemented Phase Diagram of the Trehalose–Water Binary Mixture. Cryobiology 2000, 40, 277–282. DOI: 10.1006/cryo.2000.2244.
- Roos, Y. H.; Drusch, S. Phase Transitions in Foods: Second Edition; Elsevier, New York, 2015. pp. 1–367.
- Corti, H. R.; Angell, C. A.; Auffret, T.; Levine, H.; Buera, M. P.; Reid, D. S.; Roos, Y. H.; Slade, L. Empirical and Theoretical Models of Equilibrium and Non-Equilibrium Transition Temperatures of Supplemented Phase Diagrams in Aqueous Systems (IUPAC Technical Report). Pure Appl. Chem. 2010, 82, 1065–1097. DOI: 10.1351/PAC-REP-09-10-24.
- Drake, A. C.; Lee, Y.; Burgess, E. M.; Karlsson, J. O. M.; Eroglu, A.; Higgins, A. Z. Effect of Water Content on the Glass Transition Temperature of Mixtures of Sugars, Polymers, and Penetrating Cryoprotectants in Physiological Buffer. PLoS One 2018, 13, e0190713. DOI: 10.1371/journal.pone.0190713.
- Willart, J. F.; Descamps, N.; Caron, V.; Capet, F.; Danède, F.; Descamps, M. Formation of Lactose-Mannitol Molecular Alloys by Solid State Vitrification. Solid State Commun. 2006, 138, 194–199. DOI: 10.1016/j.ssc.2006.02.034.
- Nuzzo, M.; Sloth, J.; Brandner, B.; Bergenstahl, B.; Millqvist-Fureby, A. Confocal Raman Microscopy for Mapping Phase Segregation in Individually Dried Particles Composed of Lactose and Macromolecules. Colloids Surf., A. 2015, 481, 229–236. DOI: 10.1016/j.colsurfa.2015.04.044.
- Cornel, J.; Kidambi, P.; Mazzotti, M. Precipitation and Transformation of the Three Polymorphs of d-Mannitol. Ind. Eng. Chem. Res. 2010, 49, 5854–5862. DOI: 10.1021/ie9019616.
- Sou, T.; Kaminskas, L. M.; Nguyen, T.-H.; Carlberg, R.; McIntosh, M. P.; Morton, D. A. V. The Effect of Amino Acid Excipients on Morphology and Solid-State Properties of Multi-Component Spray-Dried Formulations for Pulmonary Delivery of Biomacromolecules. Eur. J. Pharm. Biopharm. 2013, 83, 234–243. DOI: 10.1016/j.ejpb.2012.10.015.
- Mutukuri, T. T.; Wilson, N. E.; Taylor, L. S.; Topp, E. M.; Zhou, Q. T. Effects of Drying Method and Excipient on the Structure and Physical Stability of Protein Solids: Freeze Drying vs. spray Freeze Drying. Int. J. Pharm. 2021, 594, 120169. DOI: 10.1016/j.ijpharm.2020.120169.
- Telang, C.; Suryanarayanan, R.; Yu, L. Crystallization of D-Mannitol in Binary Mixtures with NaCl: Phase Diagram and Polymorphism. Pharm. Res. 2003, 20, 1939–1945. DOI: 10.1023/B:PHAM.0000008040.14958.bc.
- Leung, S. S. Y.; Parumasivam, T.; Gao, F. G.; Carrigy, N. B.; Vehring, R.; Finlay, W. H.; Morales, S.; Britton, W. J.; Kutter, E.; Chan, H.-K.; et al. Production of Inhalation Phage Powders Using Spray Freeze Drying and Spray Drying Techniques for Treatment of Respiratory Infections. Pharm. Res. 2016, 33, 1486–1496. DOI: 10.1007/s11095-016-1892-6.
- Tang, X.; Pikal, M. J. Design of Freeze-Drying Processes for Pharmaceuticals: Practical Advice. Pharm. Res. 2004, 21, 191–200. DOI: 10.1023/B:PHAM.0000016234.73023.75.